Article

Design of Metaheuristic Optimization with Deep-Learning-Assisted Solar-Operated On-Board Smart Charging Station for Mass Transport Passenger Vehicle

1
College of Engineering, Princess Nourah Bint Abdulrahman University, Riyadh 84428, Saudi Arabia
2
College of Science, Princess Nourah Bint Abdulrahman University, Riyadh 84428, Saudi Arabia
*
Author to whom correspondence should be addressed.
Sustainability 2023, 15(10), 7845; https://doi.org/10.3390/su15107845
Submission received: 16 March 2023 / Revised: 29 April 2023 / Accepted: 5 May 2023 / Published: 10 May 2023

Abstract

:
Electric vehicles (EVs) have become popular in reducing the negative impact of ICE automobiles on the environment. EVs have been predicted to be an important mode of mass transit around the globe in recent years. Several charging stations in island and remote areas are dependent on off-grid power sources and renewable energy. Solar energy is used in the daytime as it is based on several environmental components. The creation of efficient power trackers is necessary for solar arrays to produce power at their peak efficiency. To deliver energy during emergencies and store it in case there is an excess, energy storage systems are required. It has long been known that reliable battery management technology is essential for maintaining precise battery charge levels and avoiding overcharging. This study suggests an ideal deep-learning-assisted solar-operated off-board smart charging station (ODL-SOOSCS) design method as a result. The development of on-board smart charging for mass transit EVs is the main goal of the ODL-SOOSCS technique that is being described. In the ODL-SOOSCS approach described here, a perovskite solar film serves as the generating module, and the energy it generates is stored in a module with a hybrid ultracapacitor and a lithium-ion battery. Broad bridge converters and solar panels are incorporated into the deep belief network (DBN) controller, which doubles as an EV charging station. An oppositional bird swarm optimization (OBSO) algorithm is used as a hyperparameter optimizer to improve the performance of the DBN model. Moreover, an MPPT device is exploited for monitoring and providing maximal output of the solar panel if the power sources are PV arrays. The proposed system combines the power of metaheuristic optimization algorithms with deep learning techniques to create an efficient and smart charging station for mass transport passenger vehicles. This integration of two powerful technologies is a novel approach toward solving the complex problem of charging electric vehicles in mass transportation systems. The experimental validation of the ODL-SOOSCS technique is tested on distinct converter topologies. A widespread experimental analysis assures the promising performance of the ODL-SOOSCS method over other current methodologies.

1. Introduction

With the progression of the global economy, the consumption and demand for energy in several nations have been steadily increasing [1]. The energy crisis and environmental pollution have also allured attention. A mass transit vehicle can be any vehicle that is utilized for providing transportation services, either privately or publicly owned, to the public on a regular, continual, and equal basis [2]. Mass transportation is any type of transportation mechanism where many individuals are carried within a single vehicle or a combination of vehicles. Light rail systems, buses, subways, and railways are instances of mass transportation [3]. The term “mass transit” can be utilized as a replacement for mass transportation. In many parts of the world, mass transit systems are a significant element of the transportation system of nations. Mass transit mechanisms even take up less space compared to highways required for the movement of automobile traffic [4]. Overpasses, parking lots, roads, bridges, and highways inhabit a third of the land obtainable in some cities. Mass transit systems are more eco-friendly than vehicles [5]. A single bus with eighty people utilizes more fuel compared to private automobiles, yet it can carry more commuters. The air pollution caused per passenger is much less.
Electric vehicles (EVs) are becoming a vital factor in the automotive field. EV sales reached 2.1 million in 2019, a substantial increase [6]. Additionally, EV chargers are part of the global substructure, with a 60% rise in public charging units in 2019 compared to 2018 and 7.3 million chargers globally in 2019. Because EVs have higher operating costs with the current infrastructure than internal-combustion-engine vehicles, the proper management of EVs is urgently needed to protect the distribution grid from transformer overload [7], power losses, and volt fluctuations. Because electric vehicles (EVs) require a lot of power when they are being charged, the increased demand for their utility puts pressure on the distribution grid [8]. In addition, it was projected that demand would increase as EVs become more useful and as consumers begin to employ a variety of strategies to lower running expenses. Several charging units in island and remote areas run on off-grid power sources and renewable energy. Solar energy can only be used in the daytime as it is dependent on a range of ecological elements [9]. The optimal power generation of solar arrays requires the construction of effective power trackers. Energy storage mechanisms are needed for power supply in emergencies and the surplus can be stored for a later period [10]. A charger can now be advanced through artificial intelligence (AI) and cutting-edge ML methods.
This paper develops an optimal deep-learning-assisted solar-operated on-board smart charging station (ODL-SOOSCS) technique. The presented ODL-SOOSCS technique mainly concentrates on the design of on-board smart charging for mass transit EVs. The advantage of the proposed charging station is that it is designed to be installed on-board the mass transport vehicle. This is a unique feature as most charging stations are stationary and require the vehicle to be parked for charging. The on-board charging station allows for the continuous charging of the vehicle while it is in operation, thereby reducing downtime and increasing the efficiency of the transportation system. The disadvantage of on-board smart charging stations for mass transit EV stations is the dependence on weather conditions, with their performance likely being affected by cloudy or rainy days. In the presented ODL-SOOSCS technique, the generation module involves a perovskite solar film placed on the surface of the vehicle, with the generated energy saved in a storage module (including the hybrid ultracapacitor and lithium-ion battery). Solar panels serve as an EV charging station, and complete bridge converters and solar panels are integrated into the deep belief network (DBN) controller. For enhancing the DBN model’s performance, the oppositional bird swarm optimization (OBSO) algorithm is a hyperparameter optimizer. Moreover, the MPPT device is exploited for monitoring and providing maximal output of the solar panel if the power source is a PV array. The experimental validation of the ODL-SOOSCS technique is tested on distinct converter topologies.
The present article is divided into the following sections: Studies relating to charging electric vehicles are provided in Section 2 using machine learning and optimization methods. The proposed methodology, which includes challenge formulation, an optimization strategy, and ensemble machine learning prediction, is discussed in Section 3. A comparison of the alternatives and the effectiveness of the suggested model are provided in Section 4. Section 5 presents the overall result for the suggested models.

2. Related Works

Developing fast charging solar hybrid EV charging stations was the main focus of Goswami and Sadhu [11]. The charging stations had a 100 kW solar energy plant with storage to reduce the reliance on the grid and to increase profit. A comprehensive strategy for hybrid solar charging stations was described in the study. For determining the load on charging units, a stochastic method can be utilized for forecasting the arrival duration, the charging demand, and the SOC. To gain maximal power from solar energy plants and to assure the fast charging of station batteries, the stochastic firefly algorithm (SFA) was utilized. Lodi et al. [12] introduced a new technique to assess the full-battery effect at the time of on-board solar charging of regular vehicles and thus to predict related CO2 savings. The technique depends on driver mobility data and solar irradiance.
Murat et al. [13] offered an energy control of EV charging related to the PV mechanism for an Industrial Microgrid (IMG) to present EV load shaving services, and they optimized the layout of electric energy charging. Utilizing travel performances of EVs, daily charging energies were inspected and a Monte Carlo Simulation (MCS) relevant to arithmetic data can be enforced for determining driving hours for EVs. By examining the battery charge property of EVs, the primary state of charge (SOC) was computed, and the charging period and total charging power of EVs can be obtained by analysis. To resolve these issues, a space-efficient charging structure and a power grid balancer connected to multi-agent mechanisms were proposed by Chavhan et al. [14]. The multi-level EV charging stations on exhibit save significant space and ease traffic congestion because they have the capacity to accommodate numerous automobiles in that area. The multilevel car charging mechanism can be used as a dependable charging solution in locations with high and medium daily step counts depending on its kind, size, and capacity.
Shariff et al. [15] introduced the practical application and design aspects of contemporary solar-assisted level-two EV charging stations, which can be controlled by Type-1 vehicle connectors. Additionally, a comprehensive hardware setup for producing a 48 V buck converter’s dc output and for verifying the effectiveness of power factor correction under steady-state settings for 3 kW inputs, 230 Vrms at 1-stage, and 50 Hz rated load changes was constructed. According to Sain et al. [16], a thorough analysis of several technologies for solar-powered energy-efficient smart electric vehicles related to PMSM drives was explored. For minimizing greenhouse gas emissions and preserving ecological sustainability, solar-powered EVs constitute a dynamic role in the current energy-efficient field. The prevailing and modern technology related to IoT tools for smart EVs is needed in numerous smart cities.
A decentralized predictive control method was devised by Nisha et al. [17]. In this study, EV charging load profiles were designed by taking the power demand, typical driving cycles, and SOCs of many vehicles into account for studying the impact of uncertain changing EV loads in bipolar DC microgrids. Mohammed et al. [18] developed a new scheduling method for charging EVs in order to reduce total charging costs and eliminate any negative grid effects. The created technique enables the management of EV charging based on connected renewable energy source day-ahead projections. With the use of a particular ANN method, power generation predictions can be improved. The presented technique scheduled charges for utilizing the solar PV power effectively.

3. The Proposed Model

In this study, we develop a novel ODL-SOOSCS approach for on-board smart charging stations for EVs utilized in public transportation. In the presented ODL-SOOSCS technique, the generation module involves a perovskite solar film mounted on the vehicle surface. Next, the storage module encompasses a hybrid ultracapacitor and lithium-ion battery. Here, the solar panels and a broad bridge converter are integrated into the DBN controllers and solar panels create EV charging units. Figure 1 demonstrates the total procedure of the ODL-SOOSCS approach.

3.1. System Model

The MPPT model for the charging system is created using the Perturb and Observe technique [19]. Using the volt detection method, voltage might be decreased or increased (V). The dP is defined by the difference in voltage (change in power). In such cases, if V0 does not result in P0, the perturbation takes a similar path as the observation. Once the voltage and current readings are compared with a preceding calculation, v = v(t) v(t − 1) and p = p[(t)] p[(t − 1)] ae the resulting outcomes. The MPPT method for duty cycle estimation in the constructed organization’s duty cycle estimation yields D(t) = D(t − 1) − d. The index terms d m a x and d m i n correspondingly indicate the maximal and minimal duty cycles. Here, the major goal is to select the better candidate for the DC–DC converters.
This graphic demonstrates full bridge converters (Q1, Q2, Q3, and Q4) along with the transformers for galvanic isolation. The switches turn ON and OFF every half cycle in pulse width modulation [20]. The converter is exploited in one of two ways. During the first half of the cycle, Q1 and Q4 switches are often ON. An electric current is provided to the load through two diodes and an HFT. Then, the diodes are loaded with electricity that might see the flow of current through them. At interval 1 of the second half-cycle, the Q3 and Q2 switches are ON, whereas the others are toggles. It can evaluate the HFT’s nominal voltage and current value by using the following formula: VinD, voutD.
V i n _ D = V i n × D m a x V o u t _ D = V 0 + 1.6 I o u t _ D = I 0 × D m a x I i n _ D = I o u t _ D η η = V i n _ D V o u t _ D
where Vin signifies i/p volts; V0 designates o/p volts; I0 symbolizes o/p present; Dmax means the maximal duty cycle; TS represents the PWM period; n means the turn ratio of the HFT.

3.2. Modeling of DBN for On-Board Smart Charging

In this work, the solar panels and complete bridge converters are integrated into the DBN controller and the solar panels create EV charging points. The DBN is a probability generalization method proposed by stacking restricted Boltzmann machines (RBMs) [21]. The RBM is the most effective way to extract and represent the data adopted in ML algorithms. The RBM is a kind of traditional Boltzmann Machine (BM) that eliminates each connection in a similar layer, and the links between hidden and visible layers are maintained. The RBM is an energy-driven model and is exploited as a generalization model for dissimilar types of data, involving images, text, and speech. It can be formulated as follows:
E n e r g y   v , h = i = 1 m j = 1 n W i j v j h j , i = 1 m b i v i j = 1 n c j h j ,
where W i j denotes the component of W that interconnects the ith visible parameter v i to the jth hidden parameter h j ; b and c indicate the model parameters. Next, the fundamental Boltzmann distribution is evaluated as:
P v , h = exp E n e r g y v , h Σ v Σ h exp E n e r g y v , h = Π i j e W i i v i h i Π i e b i v i Π j e a i h i Σ v Σ h exp E n e r g y v , h ,
Meanwhile, v is only observed, and then the hidden variable h is marginalized.
P v = h e E n e r g y v , h Σ v Σ h exp E n e r g y v , h ,  
In Equation (4), P v represents the probability assigned by nodes to the v visible vector. As there is no relationship between nodes (the intra-connection is absent), the respective conditional probability is:
P ( v | h ) = i p ( v i | h ) ,   a n d   ( h | v ) = j p ( h j | v ) .
For a binary dataset, (5) can be rewritten by:
P v i = 1 | h = σ j W i j h j + c i ,
P h j = 1 | v = σ i W i j v i + b j ,
Now, σ · indicates the logistic function and σ x = ( 1 +   exp   x ) 1 . The DBN is constructed by a stacked RBM and trained in an unsupervised way to extract relevant features from the input dataset [22]. They are demonstrated to be efficient at uncovering the layer-wise complicated non-linearity. A fast-learning mechanism for the DBN is presented, whereby joint distributions amongst observed vectors χ and hidden layers h k are attained as follows:
P x , h 1 ,   , h l = k = 0 2 P h k | h k + 1 P h 1 , h ,
where χ = h 0 , P ( h k | h k + 1 ) denotes the visible hidden conditional distribution in an RBM related to level k of the DBN, and P h 1 , h indicates a joint distribution in the topmost-level RBM [23]. Generally, adding additional layers in the DBN improves the modeling power. The performance of the energy expression is enhanced by integrating multiple layers into DBNs. In the presented method, two stacked RBMs are used to create the DBN model without labeling data.

3.3. Hyperparameter Tuning

For optimal selection of the hyperparameters related to the DBN model, the OBSO algorithm is used. Meng et al. introduced a BSO algorithm, which is a recent population-related metaheuristic algorithm, inspired by the foraging, vigilance, and fight of birds [24]. BSO is the most recent invention in the domain of swarm intelligence and computational to resolve global optimization problems. Like other metaheuristics algorithms, a guided randomization model is used for generating solutions with the highest-diversity properties. This behavior of birds is conceptualized by five major rules. In the first rule, every individual bird maintains vigilance at one time or acts as a forager. This strategy can be modeled as a stochastic method. In the problematic application, the task is detached from overloaded VMs and is positioned on the underloaded VMs related to available resources. The foraging concept is associated with the problems of mapping the task (birds) on the essential VM (destination food sources). The strategy to maintain vigilance is the same as the particles having the optimum location [25]. If the uniformly distributed random numbers within [0, 1] are small when compared to P , then P 0 ,   1 , a constant value—the bird forages for food—otherwise, the bird maintains vigilance.
Next, in the foraging technique, every bird finds a food location based on the prior knowledge of the bird flock f. The task continues updating the location based on the experience in terms of food location (destination VM). In the problem environment, the particle continues updating the location in terms of p b e s t and maps onto the corresponding VM. This is expressed in Equation (9), and the first location is evaluated in Equation (10).
X i k + 1 = X i k + c × r a n d 1 × p b e s f i X i k + s × r a n d 2 × g b e s f X i k
X 0 k = X min + X max X min × r a n d
From the expression, X 0 k indicates the first location of particle 0 at the kth iteration, X m i n denotes the minimal value (−0.4), X max illustrates the maximal value (4.0), X i k signifies the present location of the ith particles at the kth iteration, X i k + 1 denotes the location vector of the ith particle at the kth iteration, p b e s t i shows the better location of the ith particles, g b e s t represents the global optimum location of the particle, r a n d i represents the random number within [0, 1], i = 1 ,   2   r a n d = r a n d 1 = r a n d 2 = 0.5 , and C and S indicate cognitive and acceleration coefficients, respectively, that are two positive constant values ( C = S = 1.5 ) .
Based on the third rule, while maintaining vigilance, every individual bird would certainly compete with one another to get closer to the center of the flock instead of moving directly to the center [26]. The particles have the lowest fitness value and are regarded as the optimum location to move toward the center of swarm. The strategy to maintain vigilance could be associated with the problem environments as the particle (task) with the minimum position competes to move toward the forager with the optimum location.
Xik + 1 = Xik + A 1 p meanj Xitk × randa + A 2 p bestl Xik × randb
A 1 = a 1 × e x p p b e s t i p b e s t j × N
A 2 = a 2 × e x p p b e s t i p b e s t l p b e s t l p b e s t i + e N × p b e s t l p b e s t j + e
From the expression, p m e a n j indicates the average location of the entire swarm; p b e s t l denotes the better location of the lth particles ( l i ,   l is selected from particles 1 to N); r a n d a is a randomly generated integer within [0, 1]; r a n d b indicates a random value within [ 1 , 1], A 1 and A 2 denote indirect and direct impacts caused by the surroundings, respectively; a i denotes two positive constants ( i = 1 ,   2   { i   ( 0 ,   2 ; p b e s f i )}) indicates the better fitness value of the ith particles; p b e s f j denotes the sum of swarming of the better fitness value; can be exploited for avoiding zero-division errors; N shows the overall number of particles.
The fourth rule indicates that the bird often flies to another site looking for food. While flying, they frequently shift between scrounger and producer. The birds with optimum fitness values are producers, and the birds with worst fitness values are scroungers. The bird that falls between the worst and best fitness values is arbitrarily chosen as the scrounger or producer as shown in Algorithm 1. The tasks (birds) with the worst and greatest fitness values, respectively, might be viewed as producers and scroungers [23,27,28]. It is considered that the makers of overloaded VMs frequently search for underloaded VMs (food sources) because they frequently search for food supplies. In addition, the scrounger is the task (birds) with the minimum fitness value of the underloaded VM who shares similar VMs (food sources) with the producers. The bird might switch their fight behaviors at F Q intervals of time. These behaviors are modeled in the following.
X i k + 1 = X i k + r a n d n 0 , 1 × X i k
X i k + 1 = X i k + X l k X i k × F L × r a n d   0 , 1
where r a n d n 0 , 1 indicates a random value derived from a Gaussian distribution random integer with mean 0 and standard deviation 1; X l k l i ,   l is selected from particle 1 to N ; F L signifies the probability that the scroungers might be producers to find food, where F L [ 0 , 2 ] . Lastly, the fifth rule states that the producer actively searches for the food source, and the scrounger follows the producer [29,30,31,32]. Once at the recently created food sources, the producer once more forages for the food source, and the scrounger eats the food sources that the producers discover [33,34,35]. The task (producer), after being situated in the underloaded VMs (food sources), finds a better location and forages for the food sources once more. The scrounger maintains the optimum location in one of the underloaded VMs (food sources) found by the producers. These feeding and searching behaviors of scroungers and producers are divided in (14) and (15), respectively. Figure 2 demonstrates the steps involved in the BSO technique.
Algorithm 1: Pseudo code of BSO algorithm
Input:
                N : the number of individuals (birds)
                M : the maximal number of iterations
                F Q : the frequency of flight behaviours of birds
                P : the probability of foraging for food
                C ,   S ,   a 1, 2 ,   F L : five constant parameters
t = 0 ; Initialise the population and describe the relevant parameters
Assess the N individuals’ fitness values, and identify the optimal solution
While ( t < M )
               If t   %   F Q 0
                            For i = 1 : N
                                         If rand O , 1 < P
                                                     Birds forage for food
                                         Else
                                                     Birds keep vigilance
                                         End if
                            End for
               Else
                            Split the swarm into 2 parts: scroungers and producers.
                            For i = 1 : N
                                         If i is a producer
                                                     Producing
                                         Else
                                                     Scrounging
                                         End if
                            End for
               End if
               Assess novel solutions
               If the novel solutions are superior to their previous ones, upgrade them
               Identifies the current optimal solution
The basic BSO suffers from drawbacks including sluggish convergence and being bound to the local optimum solution [22,36,37,38]. These drawbacks increase when any local optimum solutions are updated, but there are also optimal, reachable distant solutions that BSO is unable to identify. Therefore, an opposite solution from that which is thought of for avoiding particular problems is needed. The method that is being discussed supports two steps of BSO enhancement. The OBL is primarily used to initialize the population by accelerating convergence and scanning every available space for every possible solution in order to prevent stagnation in the local best solution. Additionally, it is used to check for the existence of additional optimal solutions by comparing individual solutions to the current one and controlling the updated solution from the opposite direction. Therefore, it avoids local optimum minima. The following subsections describe stages employed for the presented technique. The OBSO technique begins with initializing a random population of X that has an extent of N such that the position vector to the primary description is distinct as x i = x i 1 , x i 2 ,   , x i n , where i = 1 , 2 , , N . The OBL is then utilized for the manipulation of the description from the opposite direction of all the descriptions and creates an opposite population of X ¯ . Utilizing both populations of X and X ¯ , the optimum N count of descriptions is designated. The stages in this step are given as follows:
  • Arbitrarily begin the description for the population of X .
  • Compute the opposite population of X ¯ as:
χ ¯ i j = u i + l i x i j , where i = 1 , 2 , , N and j = 1 , 2 , , n . At this point, l and u define the lower and upper limits to search the space, correspondingly. x i j and x ¯ demonstrate the jth solution of positions i for the population of X and the equivalent opposite population of X ¯ , correspondingly.
  • Select an N count of optimum solutions in the union of X X ¯ for the procedure of a novel population.
An optimum solution x p is defined (primary step) after selecting optimum N descriptions. The agent in the population of X can be advanced by utilizing the BSO technique, and fitness functions (FFs) are computed. In addition, the opposite population of X ¯ is computed based on the OBL, and the FF to all x ¯ is determined. The next stage in the OBSO technique is to select an N count of optimum descriptions in the union of both populations X X ¯ . Every stage is repeated until terminating criteria are obtained.

4. Results and Discussion

This section contains a detailed discussion of the experimental validation of the ODL-SOOSCS approach. For complete management of the charging EVs, the user requirements and distribution system have to be considered. Hence, to improve the user experience, the charging rate must be minimal. It should be noted that if the user adheres to the advised charging structure, the charging rate can be decreased in order to optimize power losses, load, and variance. Figure 3 shows the cost function curve for a day.
Table 1 and Figure 4 illustrate the efficiency study of the ODL-SOOSCS system with a conventional and normal load curve. The results indicate that the ODL-SOOSCS approach obtains higher efficiency values. For instance, with 1 h and a normal load of 92.21%, the ODL-SOOSCS technique obtains an efficiency of 91.29%. Similarly, with 2 h and a normal load of 90.69%, the ODL-SOOSCS approach gains an efficiency of 89.78%. Moreover, with 10 h and a normal load of 89.19%, the ODL-SOOSCS approach attains an efficiency of 88.30%. Likewise, with 11 h and a normal load of 85.68%, the ODL-SOOSCS method gains an efficiency of 84.82%. Finally, with 24 h and a normal load of 92.83%, the ODL-SOOSCS approach reaches an efficiency of 91.90%.
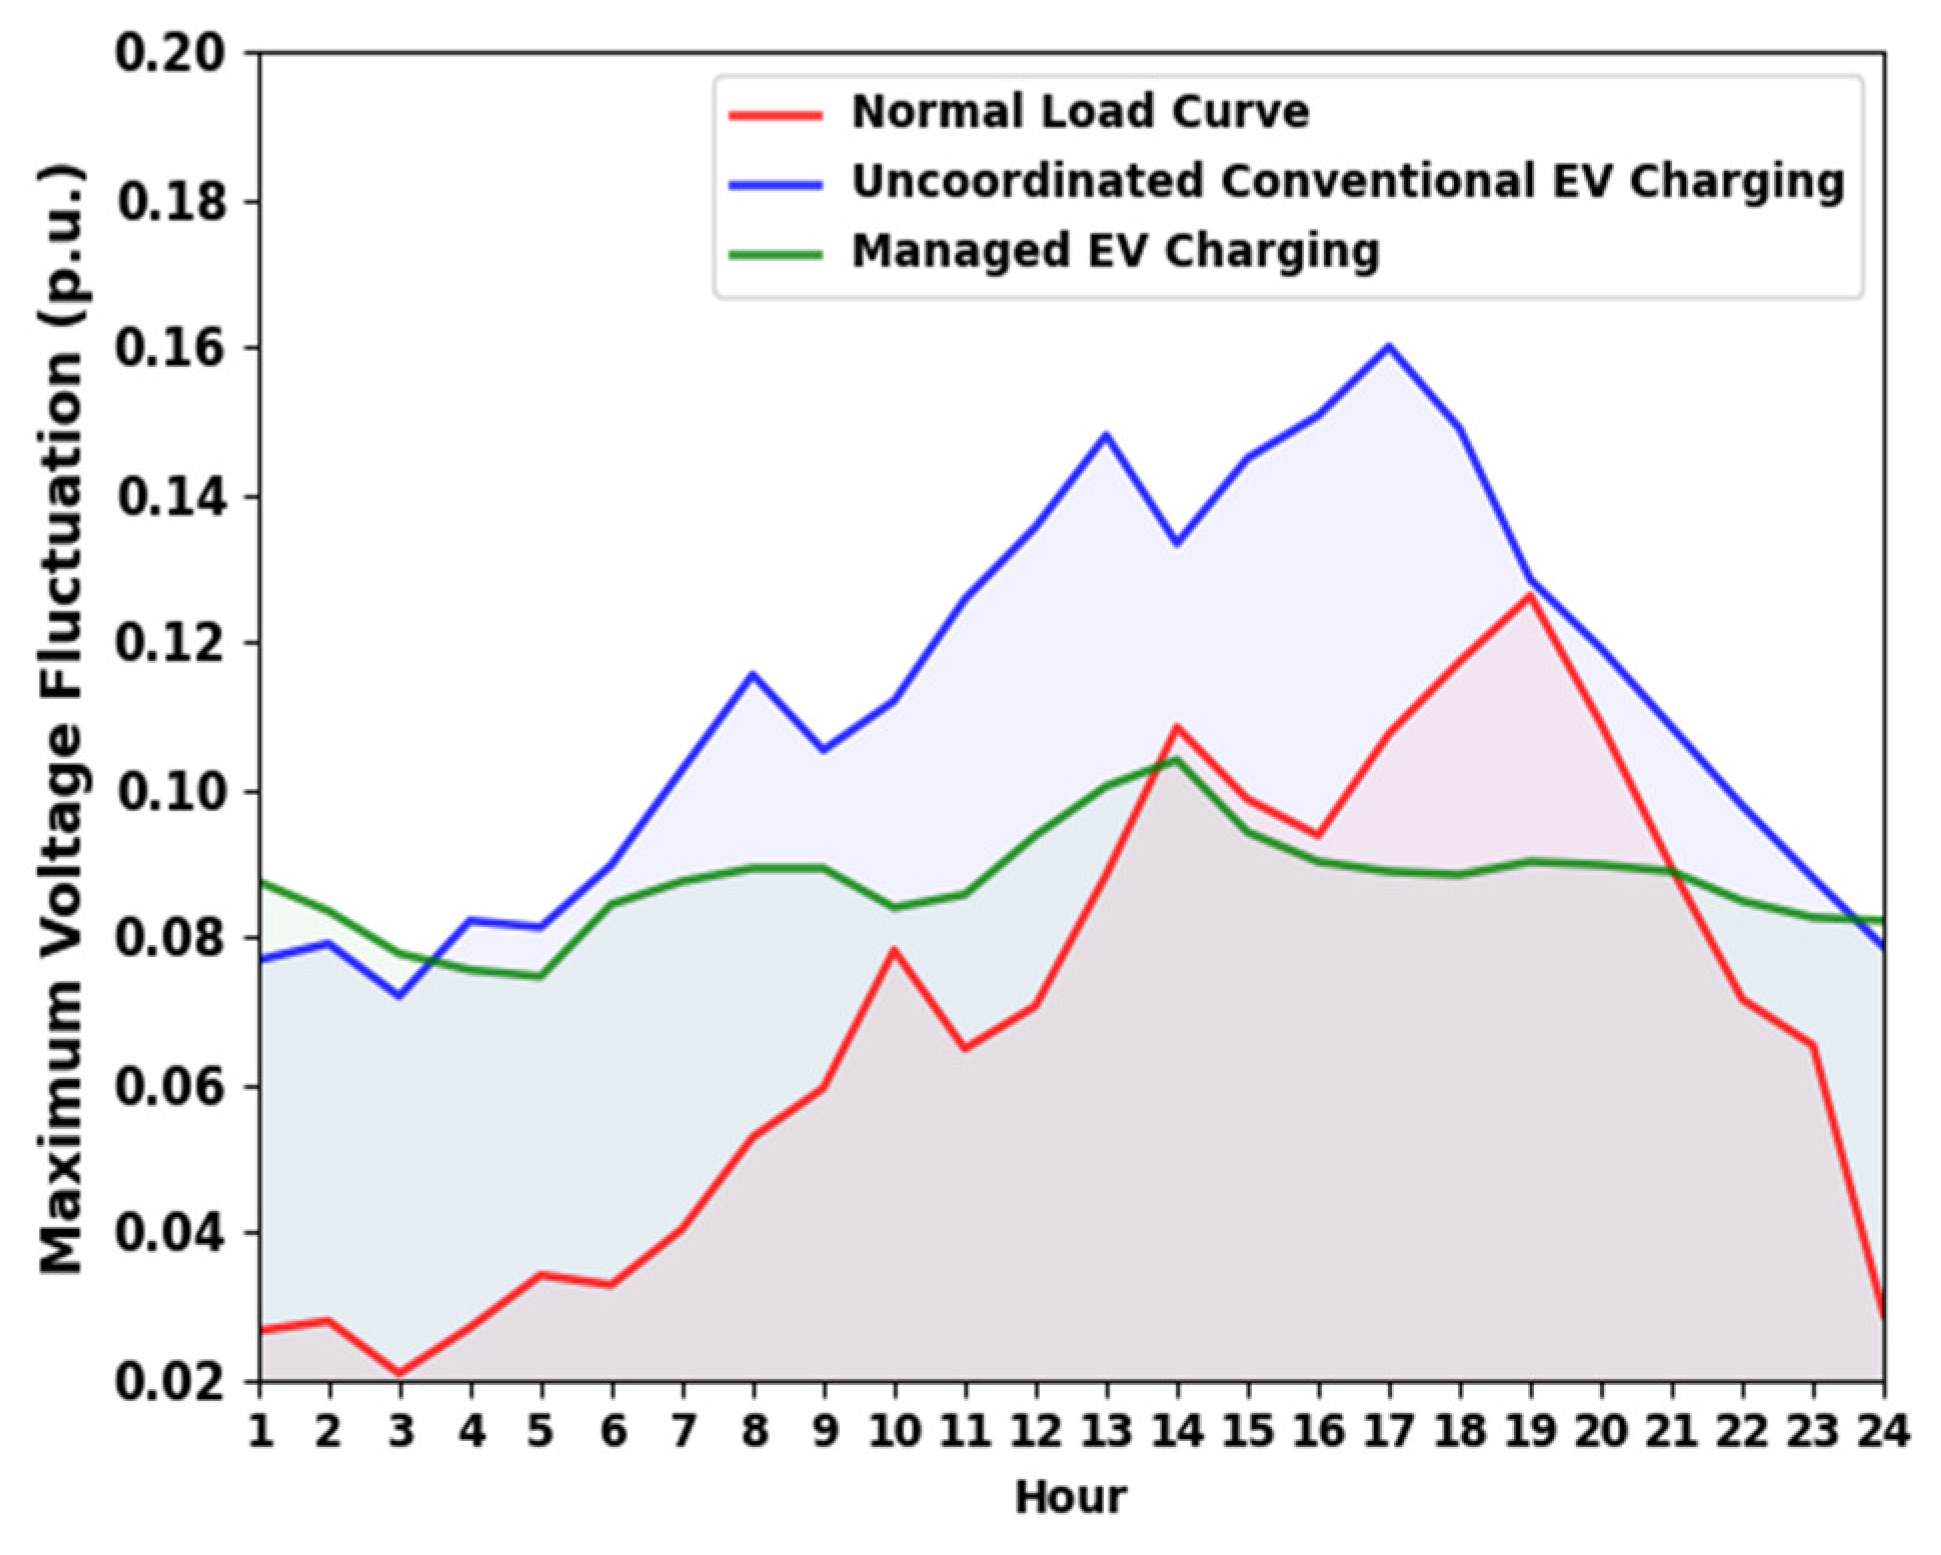
The greatest voltage fluctuations that occur when managing EV charging as compared to EV charging that is not coordinated are shown in Table 2 and Figure 5. The distribution grid’s voltage variations sharply increase linearly as a result of uncoordinated EV charging. However, power quality is enhanced by the improved voltage profile produced by the ODL-SOOSCS approach. Additionally, because power losses and load variation are reduced, the voltage profile is nearly constant throughout the day, maintaining the grid’s power quality at high levels throughout the day.
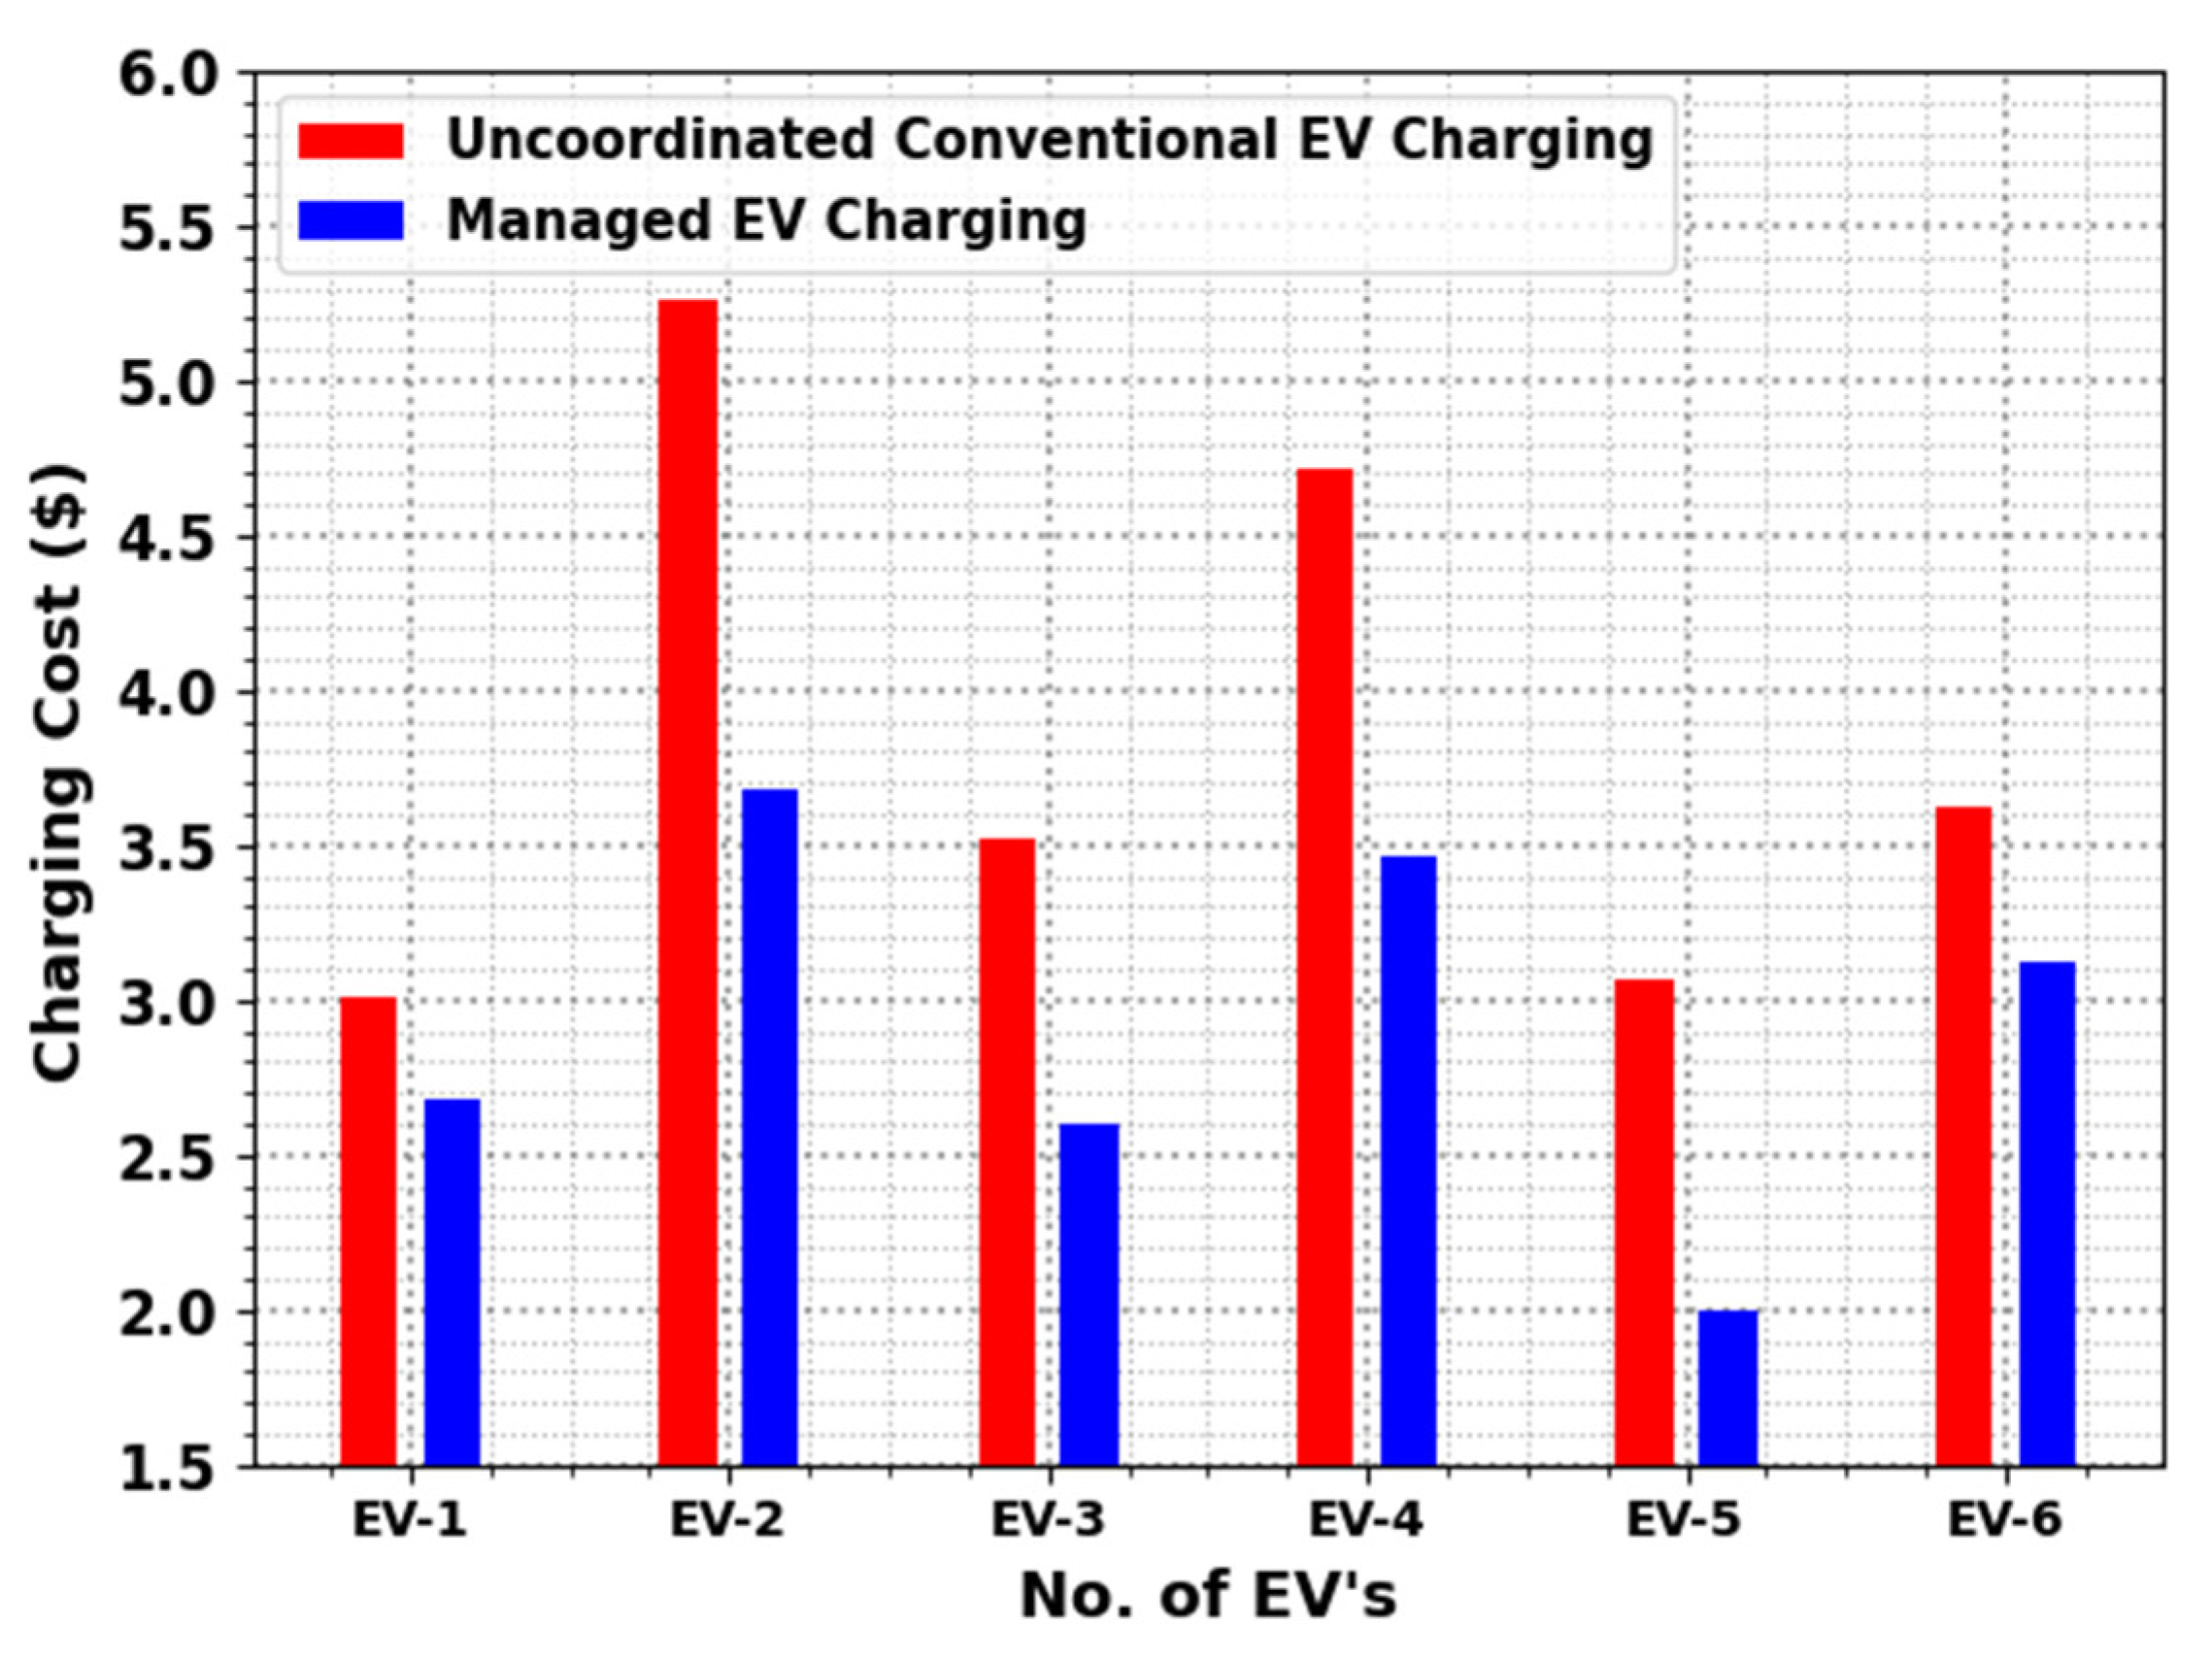
Table 3 and Figure 6 inspect the charging cost of the ODL-SOOSCS technique under conventional and managed EV charging. The results indicate that the ODL-SOOSCS technique reduces the charging rate of the user under all EVs. As a significant portion of the battery is charged at a lower cost than with normal charging, it is highlighted that adopting fast charging results in reduced costs. V2G (Vehicle-to-Grid) technology is a system that enables bidirectional power flow between an electric vehicle (EV) and the power grid. With V2G technology, an EV can both charge its battery from the grid and discharge its battery to the grid, providing services such as grid stabilization and peak shaving. The V2G system typically uses communication and control technologies to manage the power flow between the EV and the grid. Additionally, V2G technology reduces costs by enabling users to discharge during periods of high cost for the purpose of earning money, which lowers total charging costs.
Table 4 and Figure 7 represent the charging station analysis of the ODL-SOOSCS technique with other models in terms of accuracy. The experimental results indicate that the DT model reaches poor performance with a minimal accuracy of 78.12%. On the other hand, the RF model results in a slightly enhanced performance with an accuracy of 86.97%. Although the LSTM model obtains a reasonable accuracy of 94.52%, the ODL-SOOSCS technique gains maximum performance with an accuracy of 97.12%.
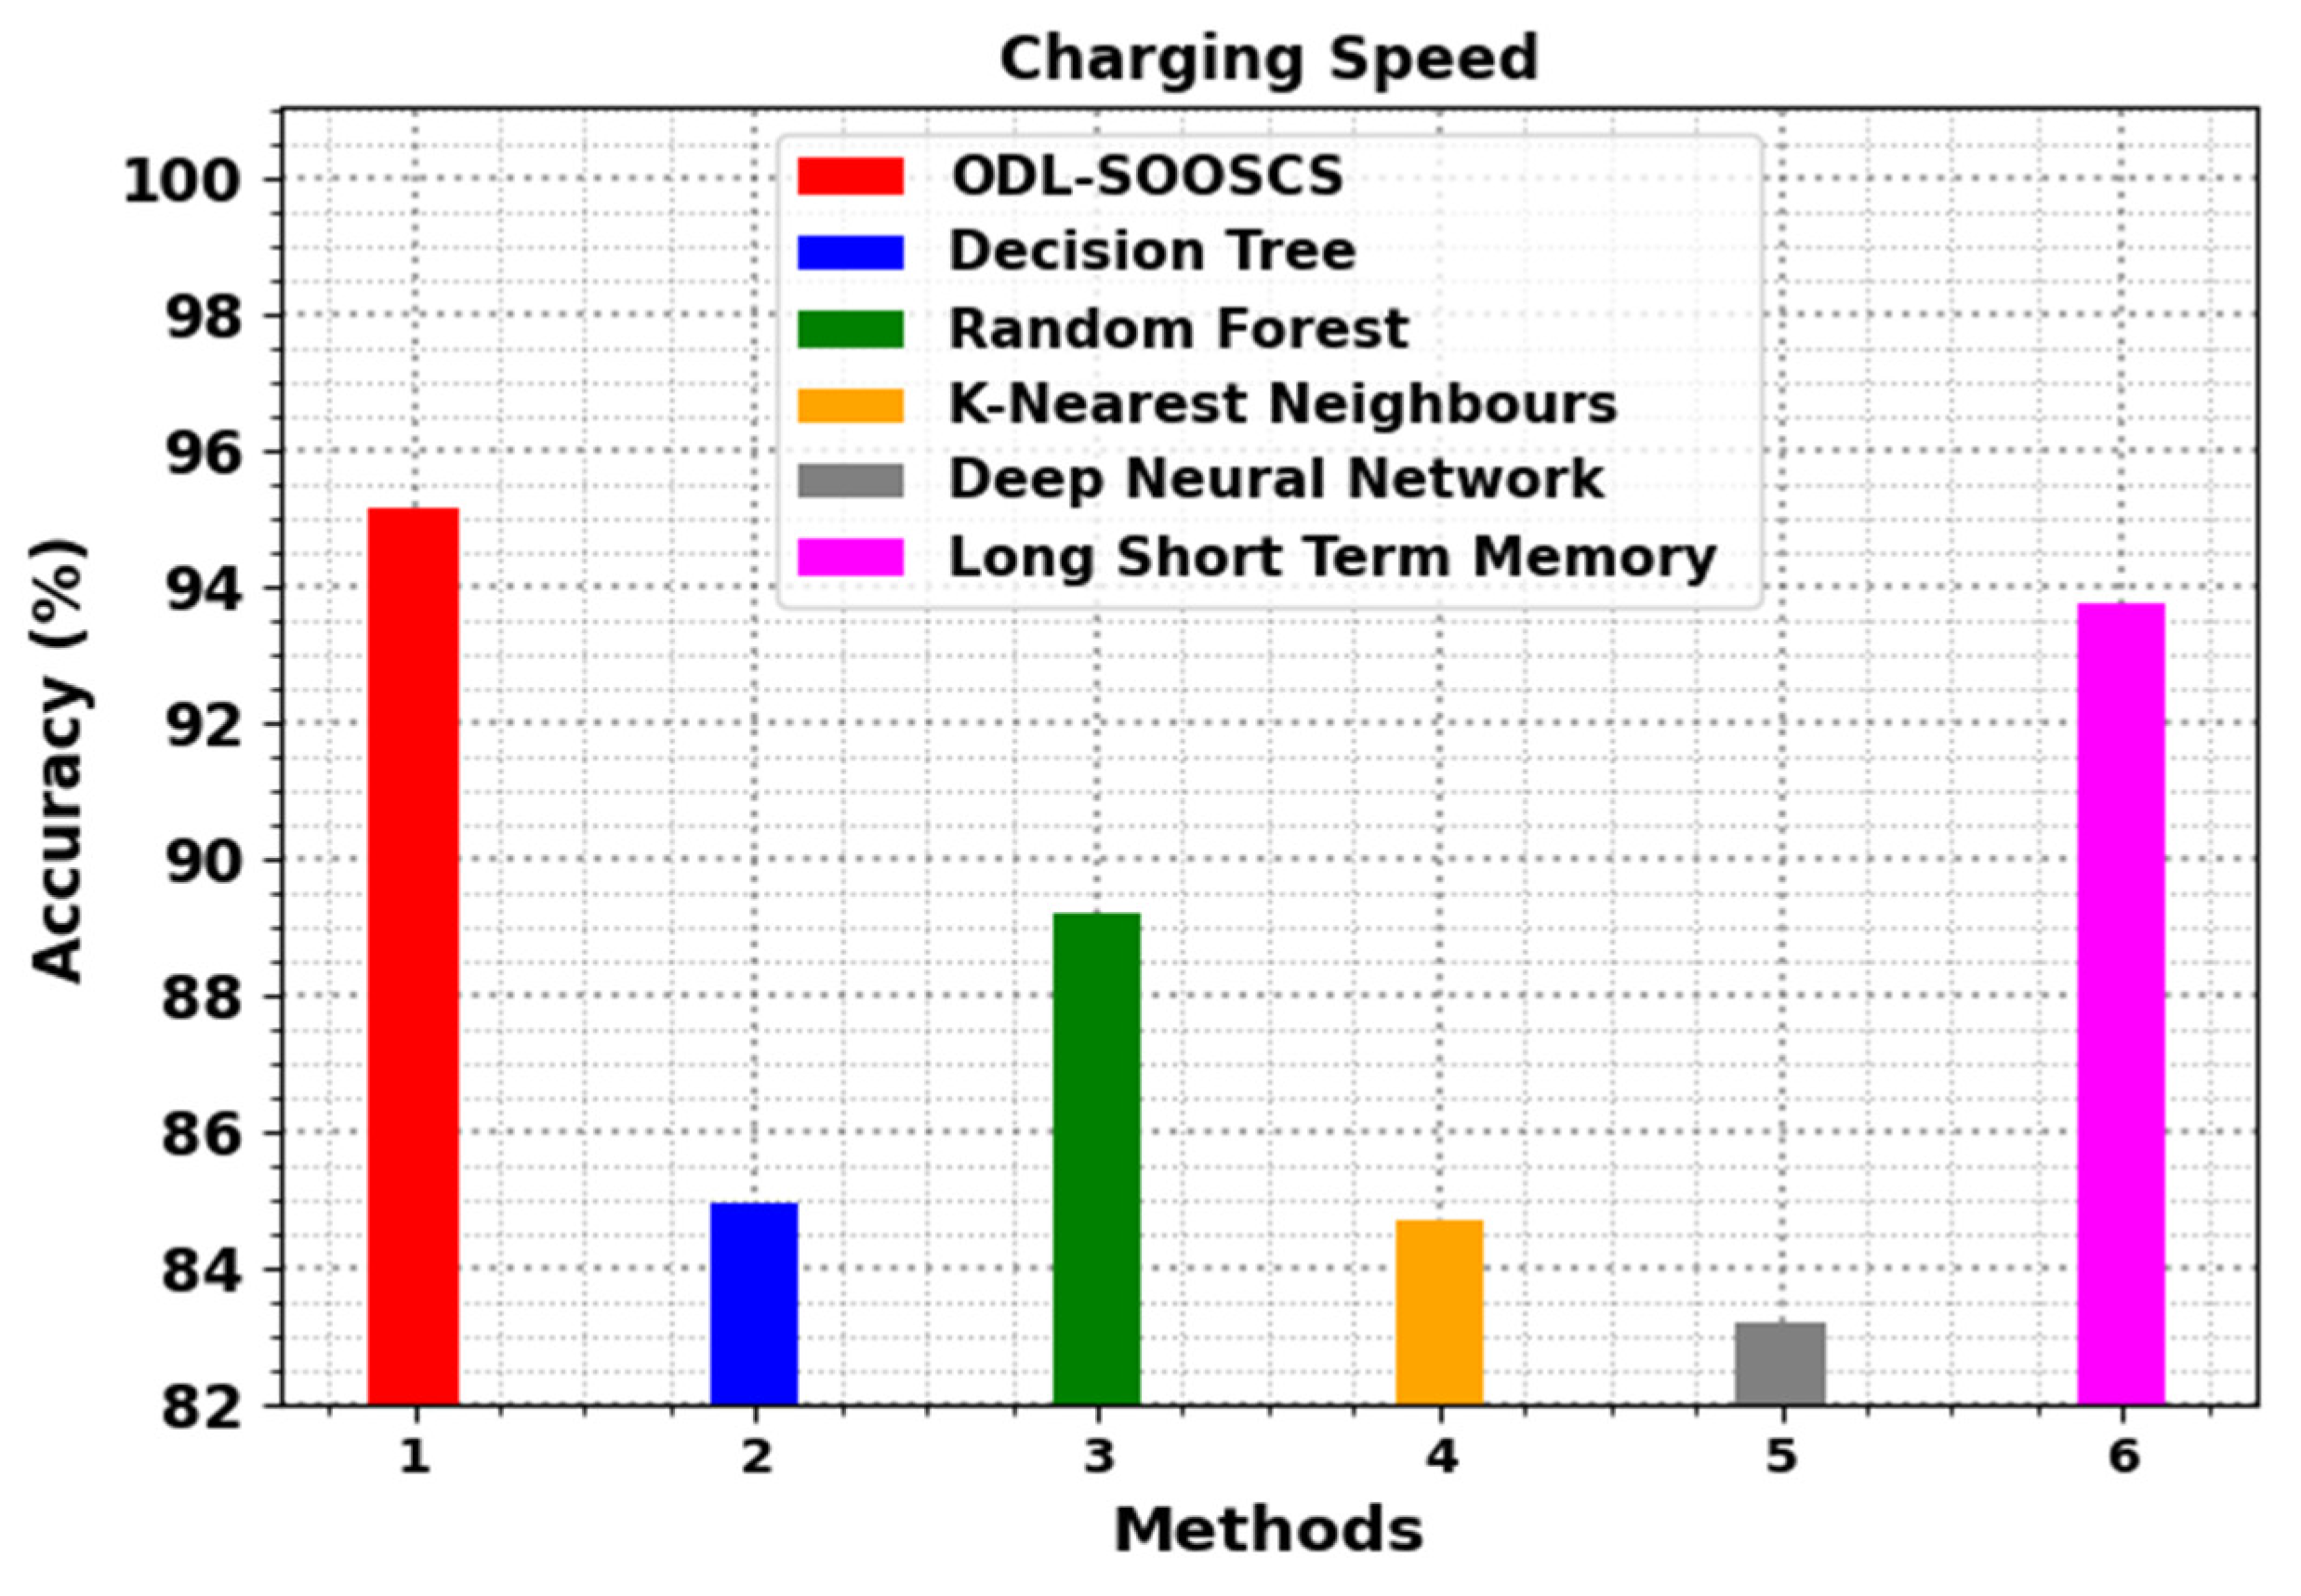
Table 5 and Figure 8 represent the charging speed performance of the ODL-SOOSCS technique with other models in terms of accuracy [39,40,41,42,43]. The experimental results reveal that the DNN, KNN, RF, DC, and LSTM models show accuracies of 83.19%, 84.68%, 89.21%, 84.95%, and 93.72%, respectively. However, the ODL-SOOSCS method outperforms the other models with a maximum accuracy of 95.12%.
Table 6 and Figure 9 demonstrate the performance of the ODL-SOOSCS method to minimize the power loss with varying levels of GWN appended to the load. It is noticed that the efficiency of the distribution grid is almost comparable to all GWN levels. For instance, with 1 hr, the ODL-SOOSCS technique obtains efficiencies of 93.13%, 92.73%, and 92.10% under GWNs of 10%, 15%, and 20%, respectively.
Meanwhile, with 10 h, the ODL-SOOSCS approach gains efficiencies of 94.40%, 94.16%, and 93.53% under GWNs of 10%, 15%, and 20%, correspondingly. Furthermore, with 24 h, the ODL-SOOSCS approach obtains efficiencies of 93.99%, 93.45%, and 92.81% under GWNs of 10%, 15%, and 20%, correspondingly. These consequences indicate the maximum performance of the ODL-SOOSCS technique.

5. Conclusions

In this study, we develop a new ODL-SOOSCS technique for solar-powered on-board smart charging stations for electric vehicles (EVs) in public transport. Here, the DBN controller is connected with solar panels and complete bridge converters, and the solar panels function as EV charging stations. The DBN model performs better thanks to the OBSO approach, which works as a hyperparameter optimizer. The generation module in the ODL-SOOSCS approach described here utilizes a perovskite solar film that is affixed to the surface of the vehicle. The storage module also includes a lithium-ion battery and a hybrid ultracapacitor. The MPPT gadget is also used to monitor and give the highest output of solar panels when power sources are PV arrays. On various converter topologies, the ODL-SOOSCS technique’s experimental validity is verified. A thorough experimental investigation confirms the ODL-SOOSCS technique’s promising performance compared to other recent techniques. Future studies should concentrate on user sociodemographic data, driver economic characteristics, battery type, charging/discharging cycles, traffic conditions, or network topology, which are excluded from the dataset used for this study.

Author Contributions

Conceptualization, S.J. and W.S.; methodology, S.J.; software, M.M.A.L.; validation, S.J., W.S. and H.M.A.; formal analysis, W.S.; investigation, S.J.; resources, W.S.; data curation, S.J.; writing—original draft preparation, S.J.; writing—review and editing, W.S.; visualization, W.S.; supervision, S.J.; project administration, W.S.; funding acquisition, S.J. All authors have read and agreed to the published version of the manuscript.

Funding

The authors extend their appreciation to the Deputyship for Research and Innovation, Ministry of Education in Saudi Arabia for funding this research work through the project number RI-44-0221.

Institutional Review Board Statement

Not applicable.

Informed Consent Statement

Not applicable.

Data Availability Statement

Not applicable.

Conflicts of Interest

The authors declare no conflict of interest.

References

  1. Clairand, J.M.; Guerra-Terán, P.; Serrano-Guerrero, X.; González-Rodríguez, M.; Escrivá-Escrivá, G. Electric vehicles for public transportation in power systems: A review of methodologies. Energies 2019, 12, 3114. [Google Scholar] [CrossRef]
  2. Mastoi, M.S.; Zhuang, S.; Munir, H.M.; Haris, M.; Hassan, M.; Usman, M.; Bukhari, S.S.H.; Ro, J.S. An in-depth analysis of electricvehicle charging station infrastructure, policy implications, and future trends. Energy Rep. 2022, 8, 11504–11529. [Google Scholar] [CrossRef]
  3. Kumar, A.; Terang, P.P.; Bali, V. Sustainable Solution for Load Forecasted EHV Charging Station in Smart Cities. In Green Internet of Things for Smart Cities; CRC Press: Boca Raton, FL, USA, 2021; pp. 147–156. [Google Scholar] [CrossRef]
  4. Veerappampalayam, E.S.; Subramani, N.; Subramanian, M.; Meckanzi, S. Handcrafted deep-feature-based brain tumor detection and classification using mri images. Electronics 2022, 11, 4178. [Google Scholar] [CrossRef]
  5. Hemavathi, S.; Shinisha, A. A study on trends and developments in electric vehicle charging technologies. J. Energy Storage 2022, 52, 105013. [Google Scholar] [CrossRef]
  6. Zamani, M.; Nagrial, M.; Rizk, J.; Hellany, A. Electric Vehicles Charging: Review of Current Status. In Proceedings of the 2018 Australasian Universities Power Engineering Conference (AUPEC), Auckland, New Zealand, 27–30 November 2018; pp. 1–5. [Google Scholar] [CrossRef]
  7. Kumar, K.; Kumar, J.; Vs, S.N. Standards for electric vehicle charging stations in India: A review. Energy Storage 2022, 4, e261. [Google Scholar] [CrossRef]
  8. Gönül, Ö.; Duman, A.C.; Güler, Ö. Electric vehicles and charging infrastructure in Turkey: An overview. Renew. Sustain. Energy Rev. 2021, 143, 110913. [Google Scholar] [CrossRef]
  9. Savari, G.F.; Sathik, M.J.; Raman, L.A.; El-Shahat, A.; Hasanien, H.M.; Almakhles, D.; Aleem, S.H.A.; Omar, A.I. Assessment of charging technologies, infrastructure and charging station recommendation schemes of electric vehicles: A review. Ain Shams Eng. J. 2022, 14, 101938. [Google Scholar] [CrossRef]
  10. Wahid, M.R.; Budiman, B.A.; Joelianto, E.; Aziz, M. A review on drive train technologies for Passenger Electric Vehicles. Energies 2021, 14, 6742. [Google Scholar] [CrossRef]
  11. Goswami, A.; Sadhu, P.K. Stochastic firefly algorithm enabled fast charging of solar hybrid electric vehicles. Ain Shams Eng. J. 2021, 12, 529–539. [Google Scholar] [CrossRef]
  12. Lodi, C.; Gil-Sayas, S.; Currò, D.; Serra, S.; Drossinos, Y. Full-battery effect during on-board solar charging of conventional vehicles. Transp. Res. Part D Transp. Environ. 2021, 96, 102862. [Google Scholar] [CrossRef]
  13. Murat, A.K.I.L.; Dokur, E.; Bayindir, R. Energy Management for EV Charging Based on Solar Energy in an Industrial Microgrid. In Proceedings of the 2020 9th International Conference on Renewable Energy Research and Application (ICRERA), Glasgow, UK, 27–30 September 2020; pp. 489–493. [Google Scholar] [CrossRef]
  14. Chavhan, S.; Zeebaree, S.R.; Alkhayyat, A.; Kumar, S. Design of Space Efficient Electric Vehicle Charging Infrastructure Integration Impact on Power Grid Network. Mathematics 2022, 10, 3450. [Google Scholar] [CrossRef]
  15. Shariff, S.M.; Alam, M.S.; Ahmad, F.; Rafat, Y.; Asghar, M.S.J.; Khan, S. System design and realization of a solar-powered electric vehicle charging station. IEEE Syst. J. 2019, 14, 2748–2758. [Google Scholar] [CrossRef]
  16. Sain, C.; Banerjee, A.; Biswas, P.K.; Padmanaban, S. A state-of-the-art review on solar-powered energy-efficient PMSM drive smart electric vehicle for sustainable development. In Advances in Greener Energy Technologies; Springer: Singapore, 2020; pp. 231–258. [Google Scholar] [CrossRef]
  17. Nisha, K.S.; Gaonkar, D.N.; Jayalakshmi, N.S. Operation and control of multiple electric vehicle load profiles in bipolar microgrid with photovoltaic and battery energy systems. J. Energy Storage 2023, 57, 106261. [Google Scholar] [CrossRef]
  18. Mohammed, S.S.; Titus, F.; Thanikanti, S.B.; Sulaiman, S.M.; Deb, S.; Kumar, N.M. Charge Scheduling Optimization of Plug-In Electric Vehicle in a PV Powered Grid-Connected Charging Station Based on Day-Ahead Solar Energy Forecasting in Australia. Sustainability 2022, 14, 3498. [Google Scholar] [CrossRef]
  19. Rachel, D.; Mahesh, K.R.K. Solar Powered Off-Board Smart Charging Station for Electric Vehicles based on Artificial Neural Network Technology. Int. J. Mech. Eng. 2022, 7, 272–281. [Google Scholar]
  20. Dairi, A.; Zerrouki, N.; Harrou, F.; Sun, Y. EEG-Based Mental Tasks Recognition via a Deep Learning-Driven Anomaly Detector. Diagnostics 2022, 12, 2984. [Google Scholar] [CrossRef]
  21. Veeramani, T.; Bhatia, S.; Hussain Memon, F. Design of fuzzy logic-based energy management and traffic predictive model for cyber physical systems. Comput. Electr. Eng. 2022, 102, 108135. [Google Scholar] [CrossRef]
  22. Metwally, A.M.; Gupta, M.S. Metaheuristics with Deep Transfer Learning Enabled Detection and classification model for industrial waste management. Chemosphere 2022, 308, 136046. [Google Scholar] [CrossRef]
  23. Alotaibi, Y.; Alghamdi, S.; Khalafand, O.I.; Nanda, A.K. Improved Metaheuristic-Driven Energy-Aware Cluster-Based Routing Scheme for IoT-Assisted Wireless Sensor Networks. Sustainability 2022, 14, 7712. [Google Scholar] [CrossRef]
  24. Parthiban, S.; Harshavardhan, A.; Neelakandan, S.; Prashanthi, V.; Alhassan Alolo, A.R.A.; Velmurugan, S. Chaotic Salp Swarm Optimization-Based Energy-Aware VMP Technique forCloud Data Centers. Comput. Intell. Neurosci. 2022, 2022, 4343476. [Google Scholar] [CrossRef]
  25. Arul Vinayakam Rajasimman, M.; Manoharan, R.K.; Aridoss, M.; Galety, M.G. Robust Facial Expression Recognition Using An Evolutionary Algorithm with a Deep Learning Model. Appl. Sci. 2023, 13, 468. [Google Scholar] [CrossRef]
  26. Raghavendra, S.; Neelakandan, S.; Prakash, M.; Geetha, B.T.; Asha, S.M.R.; Roberts, M.K. Artificial Humming Bird with Data Science Enabled Stability Prediction Model for Smart Grids. Sustain. Comput. Inform. Syst. 2022, 36, 100821. [Google Scholar] [CrossRef]
  27. Geetha, B.T.; Kumar, P.S.; Bama, B.S.; Neelakandan, S.; Dutta, C.; Babu, D.V. Green energy aware and cluster-based communication for future load prediction in IoT. Sustain. Energy Technol. Assess. 2022, 52, 102244. [Google Scholar] [CrossRef]
  28. Perumal, S.K.; Kallimani, J.S.; Ulaganathan, S.; Bhargava, S.; Meckanizi, S. Controlling energy aware clustering and multihop routing protocol for IoT assisted wireless sensor networks. Concurr. Comput. Pract. Exper. 2022, 34, e7106. [Google Scholar] [CrossRef]
  29. Mishra, K.; Majhi, S.K. A binary bird swarm optimization-based load balancing algorithm for cloud computing environment. Open Comput. Sci. 2021, 11, 146–160. [Google Scholar] [CrossRef]
  30. Ekinci, S.; Hekimoğlu, B.; Izci, D. Opposition based Henry gas solubility optimization as a novel algorithm for PID control of DC motor. Eng. Sci. Technol. Int. J. 2021, 24, 331–342. [Google Scholar] [CrossRef]
  31. Shibl, M.; Ismail, L.; Massoud, A. Electric vehicles charging management using machine learning considering fast charging and vehicle-to-grid operation. Energies 2021, 14, 6199. [Google Scholar] [CrossRef]
  32. Subbulakshmi, P.; Ramalakshmi, V. Honest auction based spectrum assignment and exploiting spectrum sensing data falsification attack using stochastic game theory in wireless cognitive radio network. Wirel. Pers. Commun. 2018, 102, 799–816. [Google Scholar] [CrossRef]
  33. Ambeth Kumar, V.D.; Malathi, S.; Abhishek, K.; Kalyana, C.V. Active volume control in smart phones based on user activity and ambient noise. Sensors 2020, 20, 4117. [Google Scholar] [CrossRef]
  34. Chithambaramani, R. An efficient applications cloudinteroperability framework using i-anfis. Symmetry 2021, 13, 268. [Google Scholar] [CrossRef]
  35. Ramalingam, C. addressing semantics standards for cloud portability and interoperability in multi cloud environment. Symmetry 2021, 13, 317. [Google Scholar] [CrossRef]
  36. Rajaram, P.V. Intelligent deep learning based bidirectional long short term memory model for automated reply of e-mail client prototype. Pattern Recognit. Lett. 2021, 152, 340–347. [Google Scholar] [CrossRef]
  37. Paulraj, D.; Ezhumalai, P. A deep learning modified neural network (dlmnn) based proficient sentiment analysis technique on twitter data. J. Exp. Theor. Artif. Intell. 2022. [Google Scholar] [CrossRef]
  38. Satpathy, S.; Padthe, A.; Trivedi, M.C.; Goyal, V.; Bhattacharyya, B.K. Method for measuring supercapacitor’s fundamental inherent parameters using its own self-discharge behavior: A new steps towards sustainable energy. Sustain. Energy Technol. Assess. 2022, 53, 102760. [Google Scholar] [CrossRef]
  39. Ranjith, C.P.; Hardas, B.M.; Mohideen, M.S.K.; Raj, N.N.; Robert, N.R. Robust deep learning empowered real time object detection for unmanned aerial vehicles based surveillance applications. J. Mob. Multimed. 2022, 19, 451–476. [Google Scholar] [CrossRef]
  40. Subramani, N.; Mardani, A.; Mishra, A.R.; Ezhumalai, P. A fuzzy logic and DEEC protocol-based clustering routing method for wireless sensor networks. AIMS Math. 2023, 8, 8310–8331. [Google Scholar] [CrossRef]
  41. Revanesh, M.; Sridhar, V.; Acken, J.M. CB-ALCA: A cluster-based adaptive lightweight cryptographic algorithm for secure routing in wireless sensor networks. Int. J. Inf. Comput. Secur. 2019, 11, 637–662. [Google Scholar] [CrossRef]
  42. Hardas, B.M. Optimization of peak to average power reduction in OFDM. J. Commun. Technol. Electron. 2017, 62, 1388–1395. [Google Scholar] [CrossRef]
  43. Pokle, S.B. Analysis of OFDM system using DCT-PTS-SLM based approach for multimedia applications. Clust. Comput. 2019, 22, 4561–4569. [Google Scholar] [CrossRef]
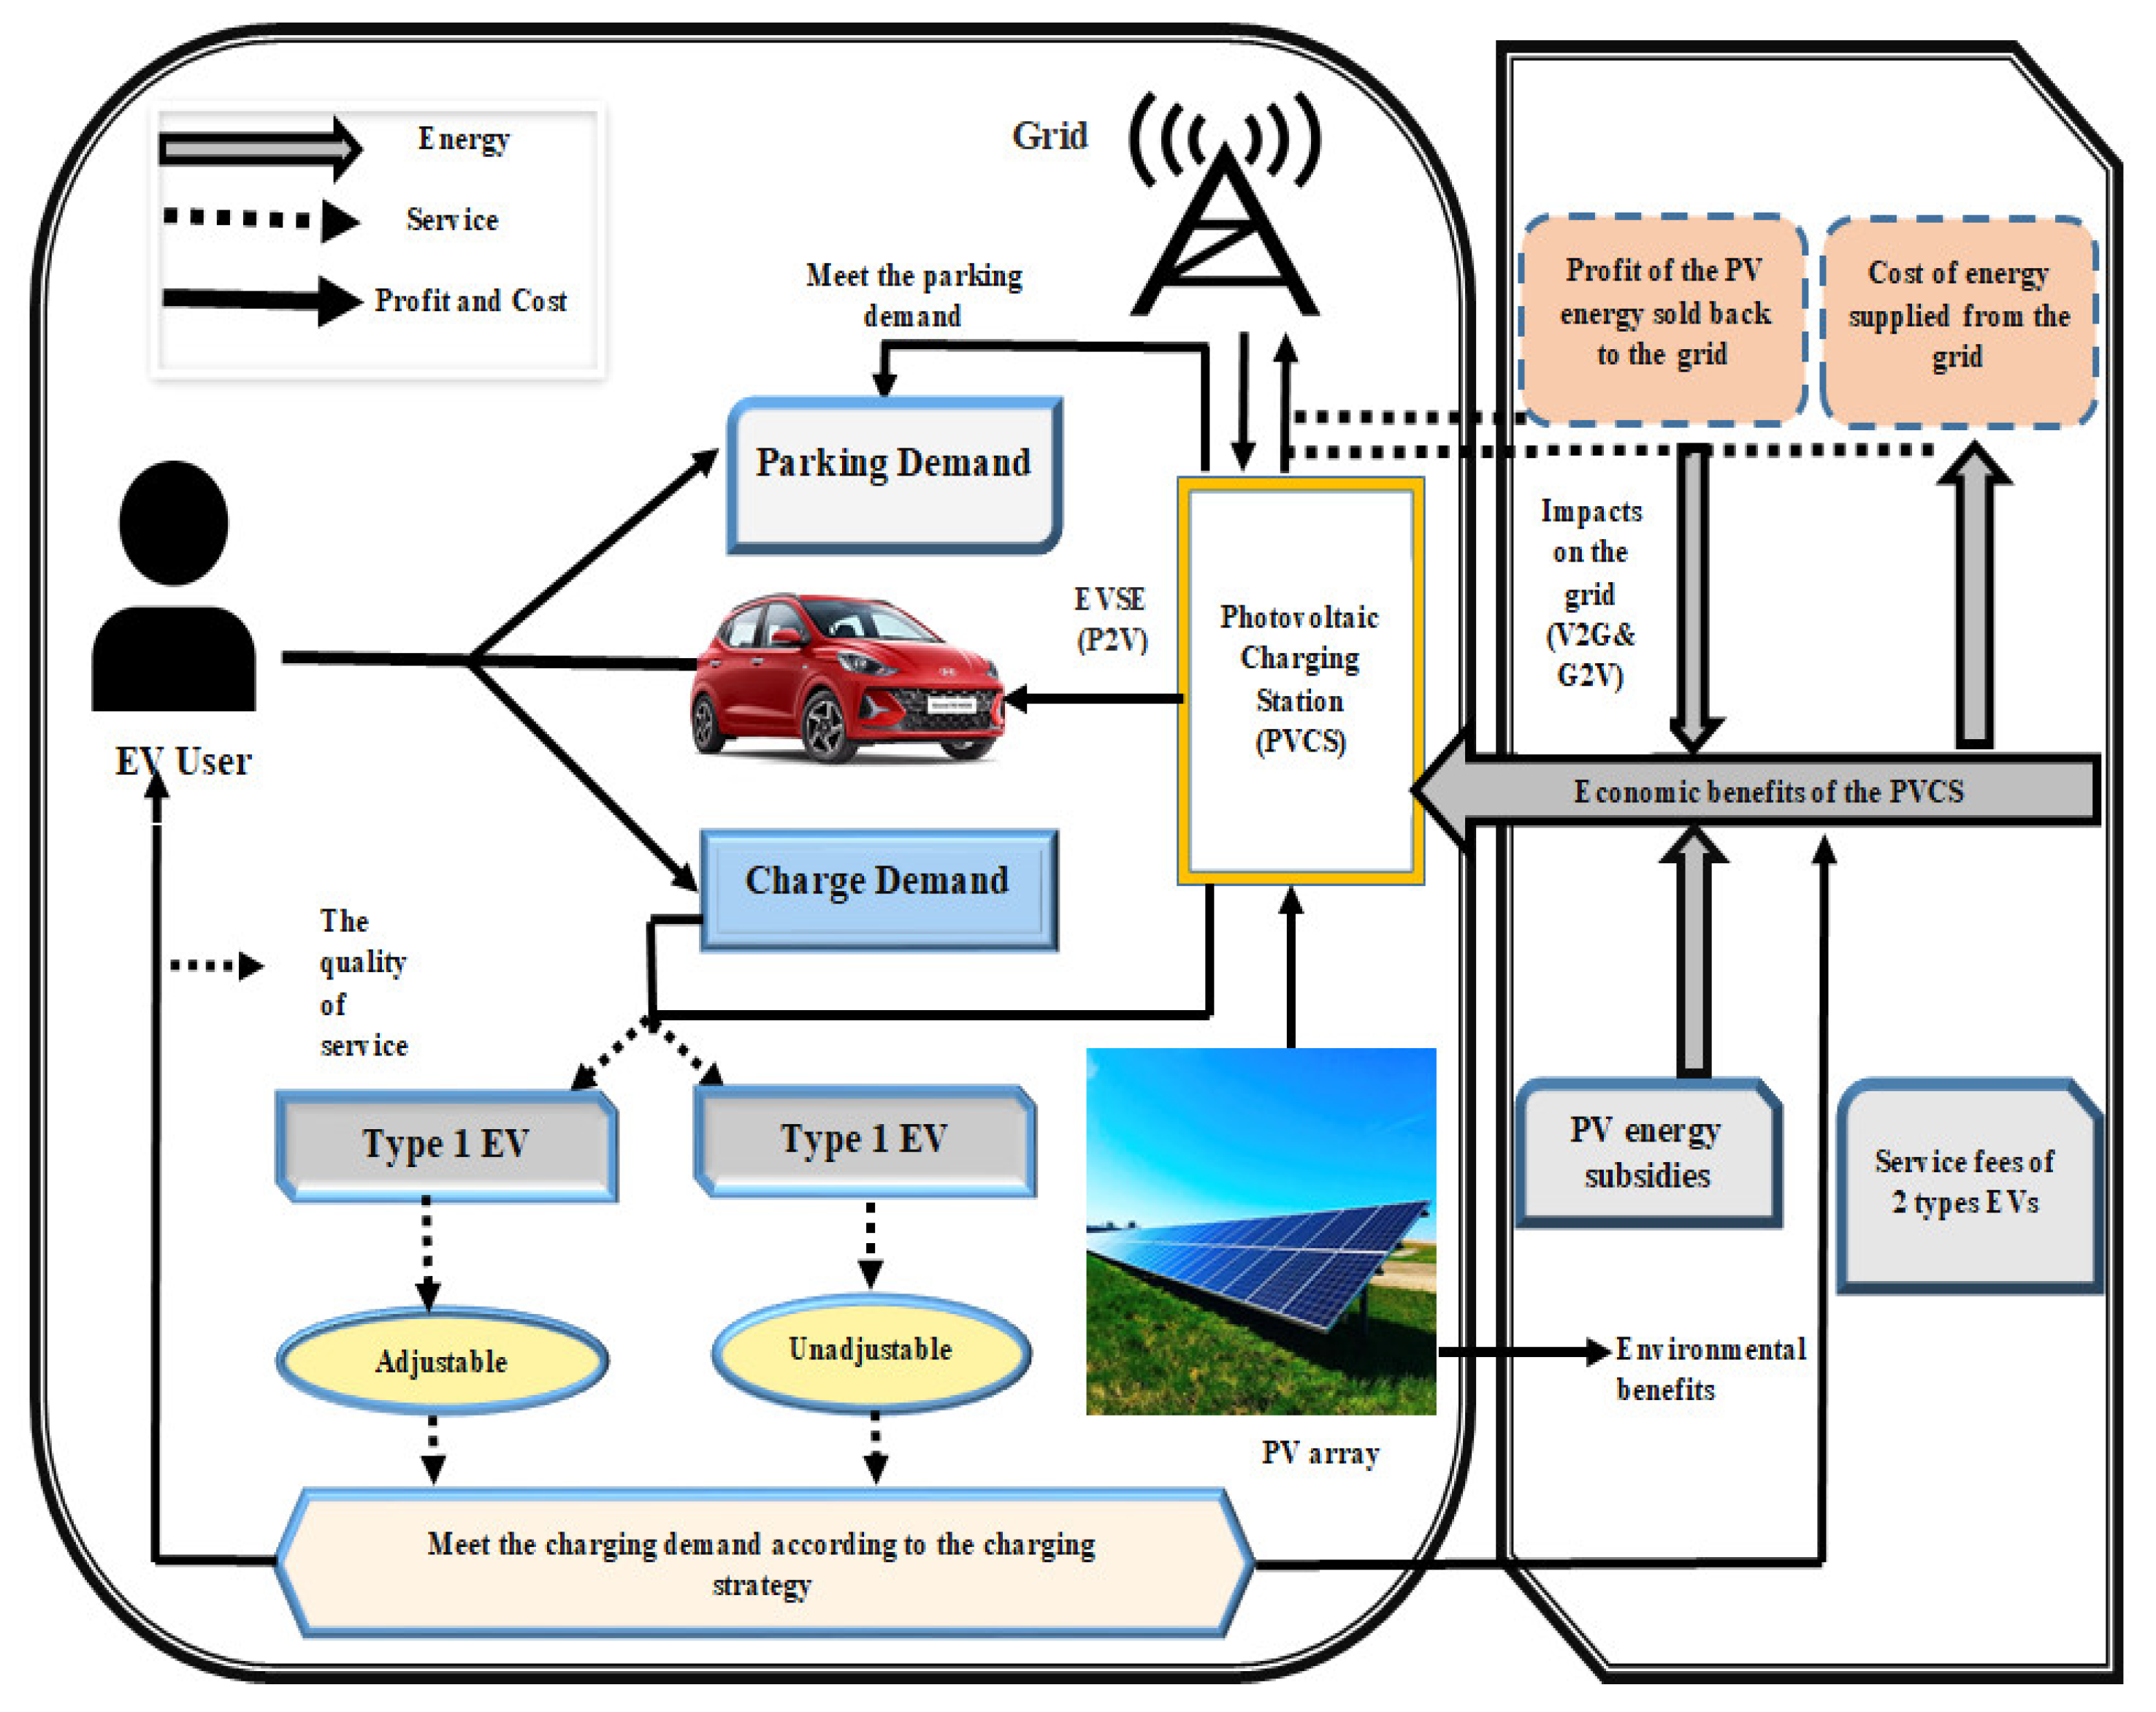
Figure 1. Overall procedure of ODL-SOOSCS system.
Sustainability 15 07845 g001
Figure 2. Steps involved in BSO.
Sustainability 15 07845 g002
Figure 3. Charging cost of a day.
Sustainability 15 07845 g003
Figure 4. Efficiency analysis of ODL-SOOSCS approach with distinct hours.
Sustainability 15 07845 g004
Figure 5. Comparative study of voltage fluctuations under diverse situations.
Sustainability 15 07845 g005
Figure 6. Charging cost analysis of ODL-SOOSCS approach under different EVs.
Sustainability 15 07845 g006
Figure 7. Charging station analysis of ODL-SOOSCS approach with existing methodologies.
Sustainability 15 07845 g007
Figure 8. Charging speed analysis of ODL-SOOSCS approach with existing methodologies.
Sustainability 15 07845 g008
Figure 9. Efficiency analysis of ODL-SOOSCS approach with varying hours.
Sustainability 15 07845 g009
Table 1. Efficiency analysis of ODL-SOOSCS approach with distinct hours.
Efficiency (%)
HourNormal Load CurveUncoordinated Conventional EV ChargingManaged EV Charging
192.2189.4491.29
290.6987.9789.78
390.6587.9389.74
490.0187.3189.11
590.9788.2490.06
691.0388.3090.12
791.0988.3690.18
885.6183.0484.75
989.5686.8788.66
1089.1986.5188.30
1185.6883.1184.82
1288.6686.0087.77
1385.4582.8984.60
1488.6686.0087.77
1585.1482.5984.29
1686.2983.7085.43
1787.2784.6586.40
1893.8891.0692.94
1993.3790.5792.44
2091.6088.8590.68
2193.7790.9692.83
2291.7188.9690.79
2392.0989.3391.17
2492.8390.0591.90
Table 2. Comparative analysis of voltage fluctuations under diverse situations.
Maximum Voltage Fluctuation (p.u.)
HourNormal Load CurveUncoordinated Conventional EV ChargingManaged EV Charging
10.02660.07680.0875
20.02790.07900.0835
30.02080.07190.0777
40.02700.08220.0755
50.03410.08130.0746
60.03280.08970.0844
70.04040.10260.0875
80.05280.11550.0893
90.05950.10530.0893
100.07820.11200.0839
110.06480.12570.0857
120.07060.13550.0937
130.08840.14800.1004
140.10840.13330.1039
150.09860.14490.0942
160.09370.15060.0902
170.10750.16000.0888
180.11730.14890.0884
190.12620.12840.0902
200.10880.11910.0897
210.08930.10840.0888
220.07150.09770.0848
230.06530.08790.0826
240.02880.07860.0822
Table 3. Charging cost analysis of ODL-SOOSCS approach under different EVs.
Charging Cost (USD)
No. of EV’sUncoordinated Conventional EV ChargingManaged EV Charging
EV-13.0100432.682354
EV-25.2611213.679667
EV-33.5229472.59687
EV-44.7197233.465957
EV-53.0670321.998482
EV-63.6226783.124021
Table 4. Charging station analysis of ODL-SOOSCS approach with other existing methodologies.
Charging Station
MethodsAccuracy (%)Accuracy Change (%)
ODL-SOOSCS97.12−0.00
Decision Tree78.12−16.81
Random Forest86.97−9.13
Long Short-Term Memory94.52−0.54
Table 5. Charging speed analysis of ODL-SOOSCS approach with other existing methodologies.
Charging Speed
MethodsAccuracy (%)Accuracy Change (%)
ODL-SOOSCS95.120
Decision Tree84.95−0.32
Random Forest89.21−1.2
K-Nearest Neighbor84.68−0.65
Deep Neural Network83.19−2.54
Long Short-Term Memory93.72−0.98
Table 6. Efficiency analysis of ODL-SOOSCS approach with varying hours.
Efficiency (%)
HourManaged EV Charging—10 (%) GWNManaged EV Charging—15 (%) GWNManaged EV Charging—20 (%) GWN
193.1392.7392.10
293.4092.8992.20
394.9094.2293.62
493.8593.3392.73
593.3292.5791.84
693.9893.4892.86
793.3592.7592.00
893.6292.8392.10
993.7493.1592.47
1094.4094.1693.53
1193.4092.8192.08
1294.6494.1993.50
1393.9693.5692.90
1494.0993.5292.74
1593.0292.3891.66
1693.2492.6392.02
1793.8593.6192.83
1894.2493.5392.89
1994.0493.2792.67
2094.8294.5293.73
2193.5293.2092.51
2293.8793.6192.82
2394.0193.2292.57
2493.9993.4592.81
Disclaimer/Publisher’s Note: The statements, opinions and data contained in all publications are solely those of the individual author(s) and contributor(s) and not of MDPI and/or the editor(s). MDPI and/or the editor(s) disclaim responsibility for any injury to people or property resulting from any ideas, methods, instructions or products referred to in the content.