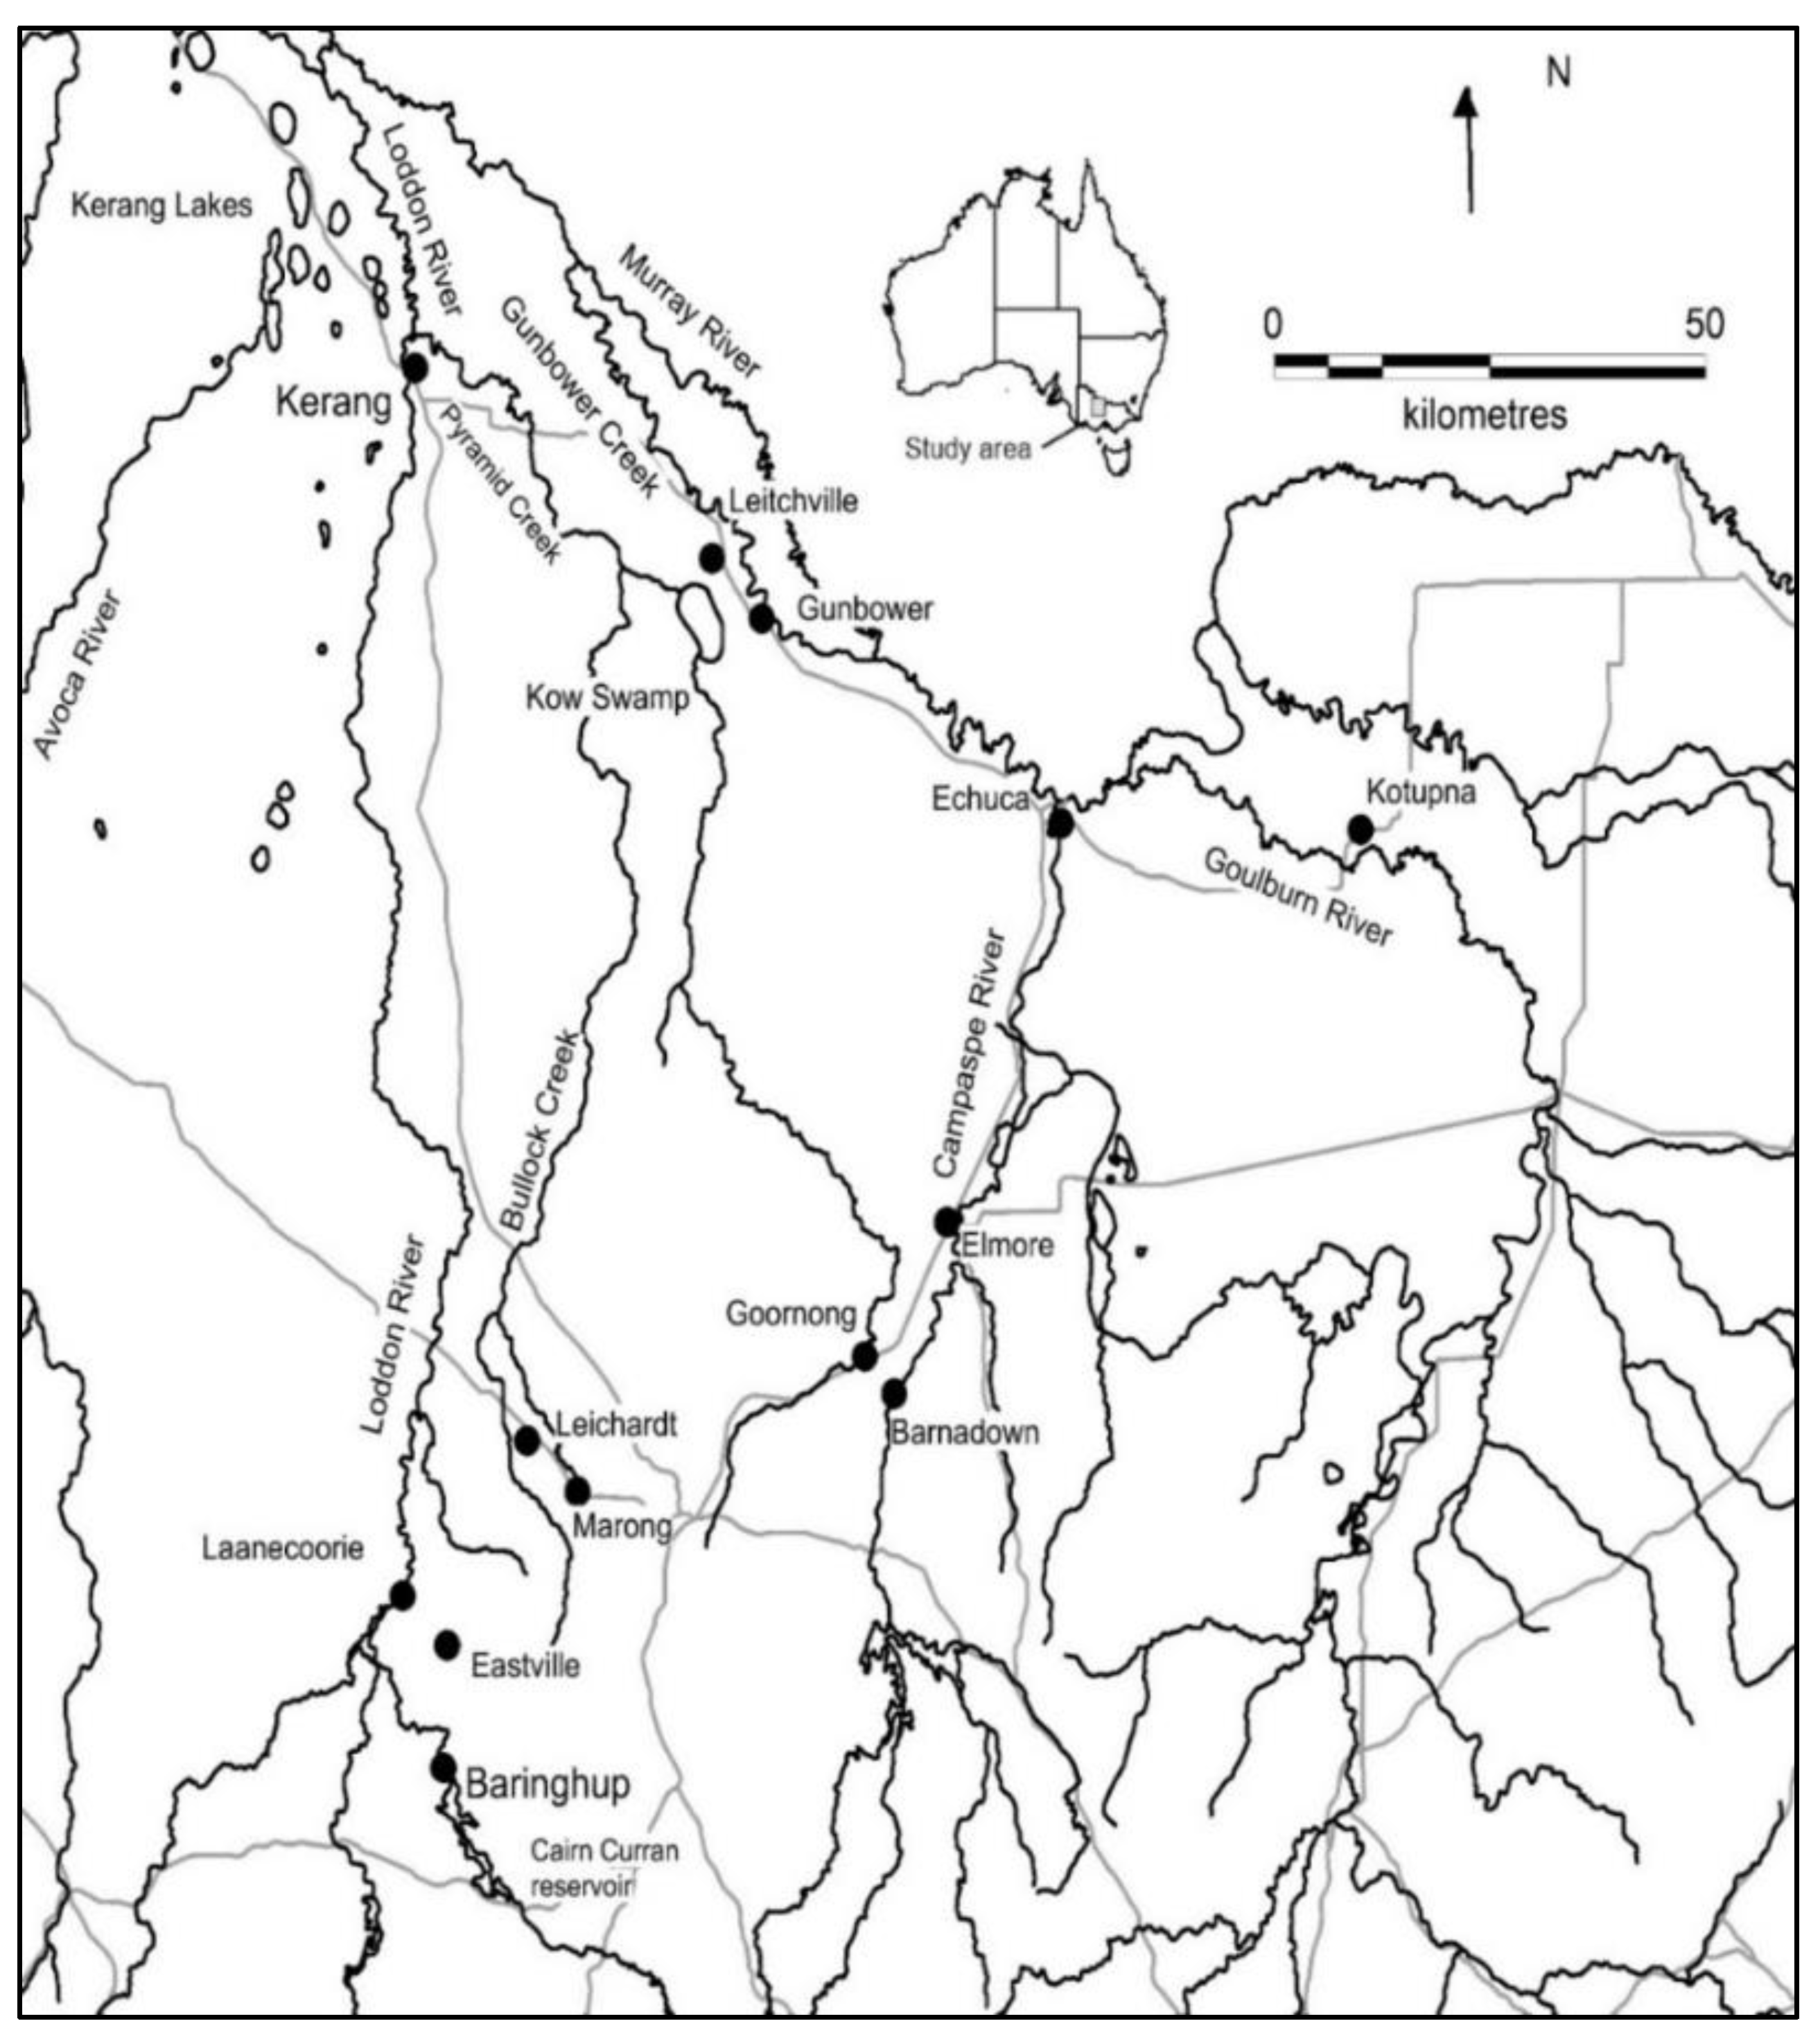
Figure 1.
Rivers and streams of north-central Victoria, Australia with disconnected streams described here–the Campaspe River east of Goornong, the Loddon River at Baringhup, Bullock Creek at Marong and the Pyramid Creek, west of Kow Swamp.
Figure 1.
Rivers and streams of north-central Victoria, Australia with disconnected streams described here–the Campaspe River east of Goornong, the Loddon River at Baringhup, Bullock Creek at Marong and the Pyramid Creek, west of Kow Swamp.
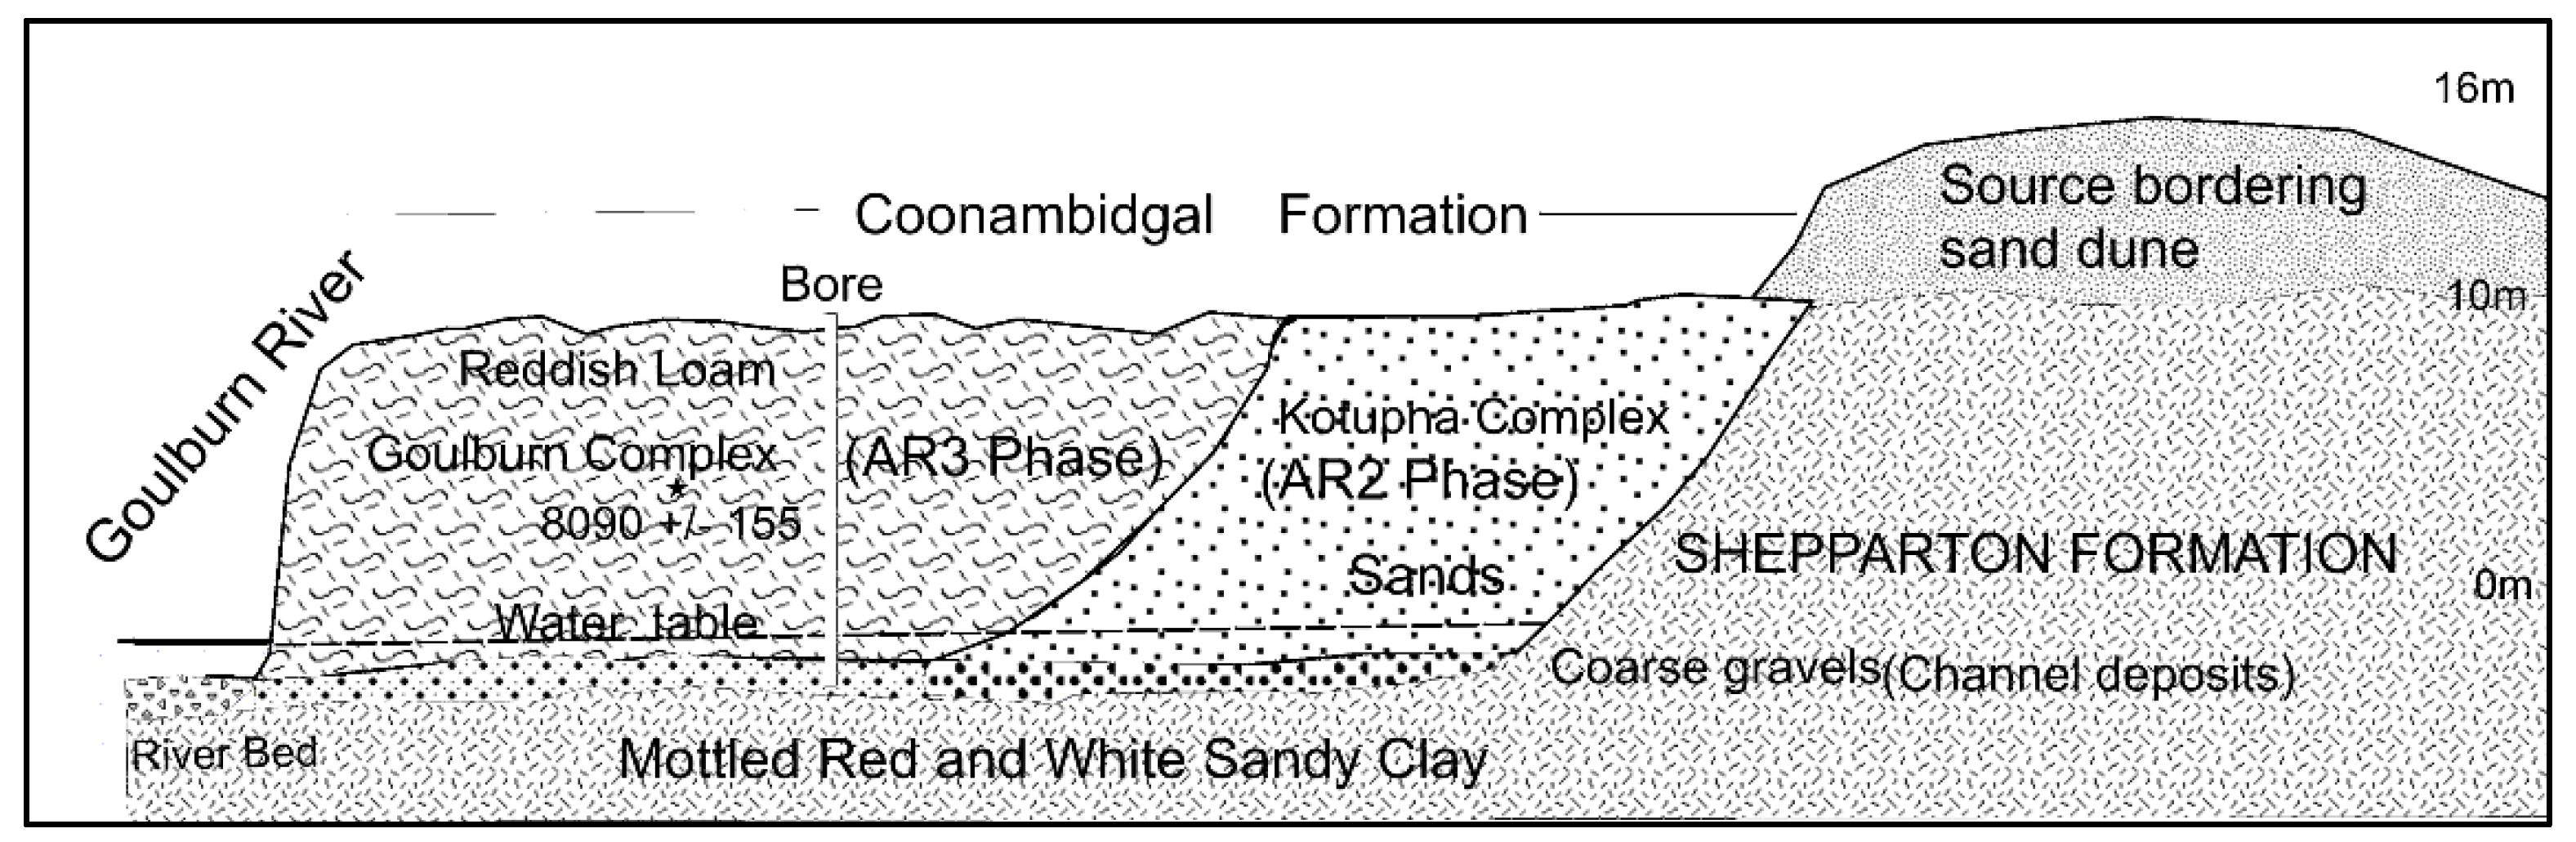
Figure 2.
Coonambidgal Formation terraces on the Goulburn River (modified from Bowler [
36]). The section shows basal channel bed sequences linked to the river.
Figure 2.
Coonambidgal Formation terraces on the Goulburn River (modified from Bowler [
36]). The section shows basal channel bed sequences linked to the river.
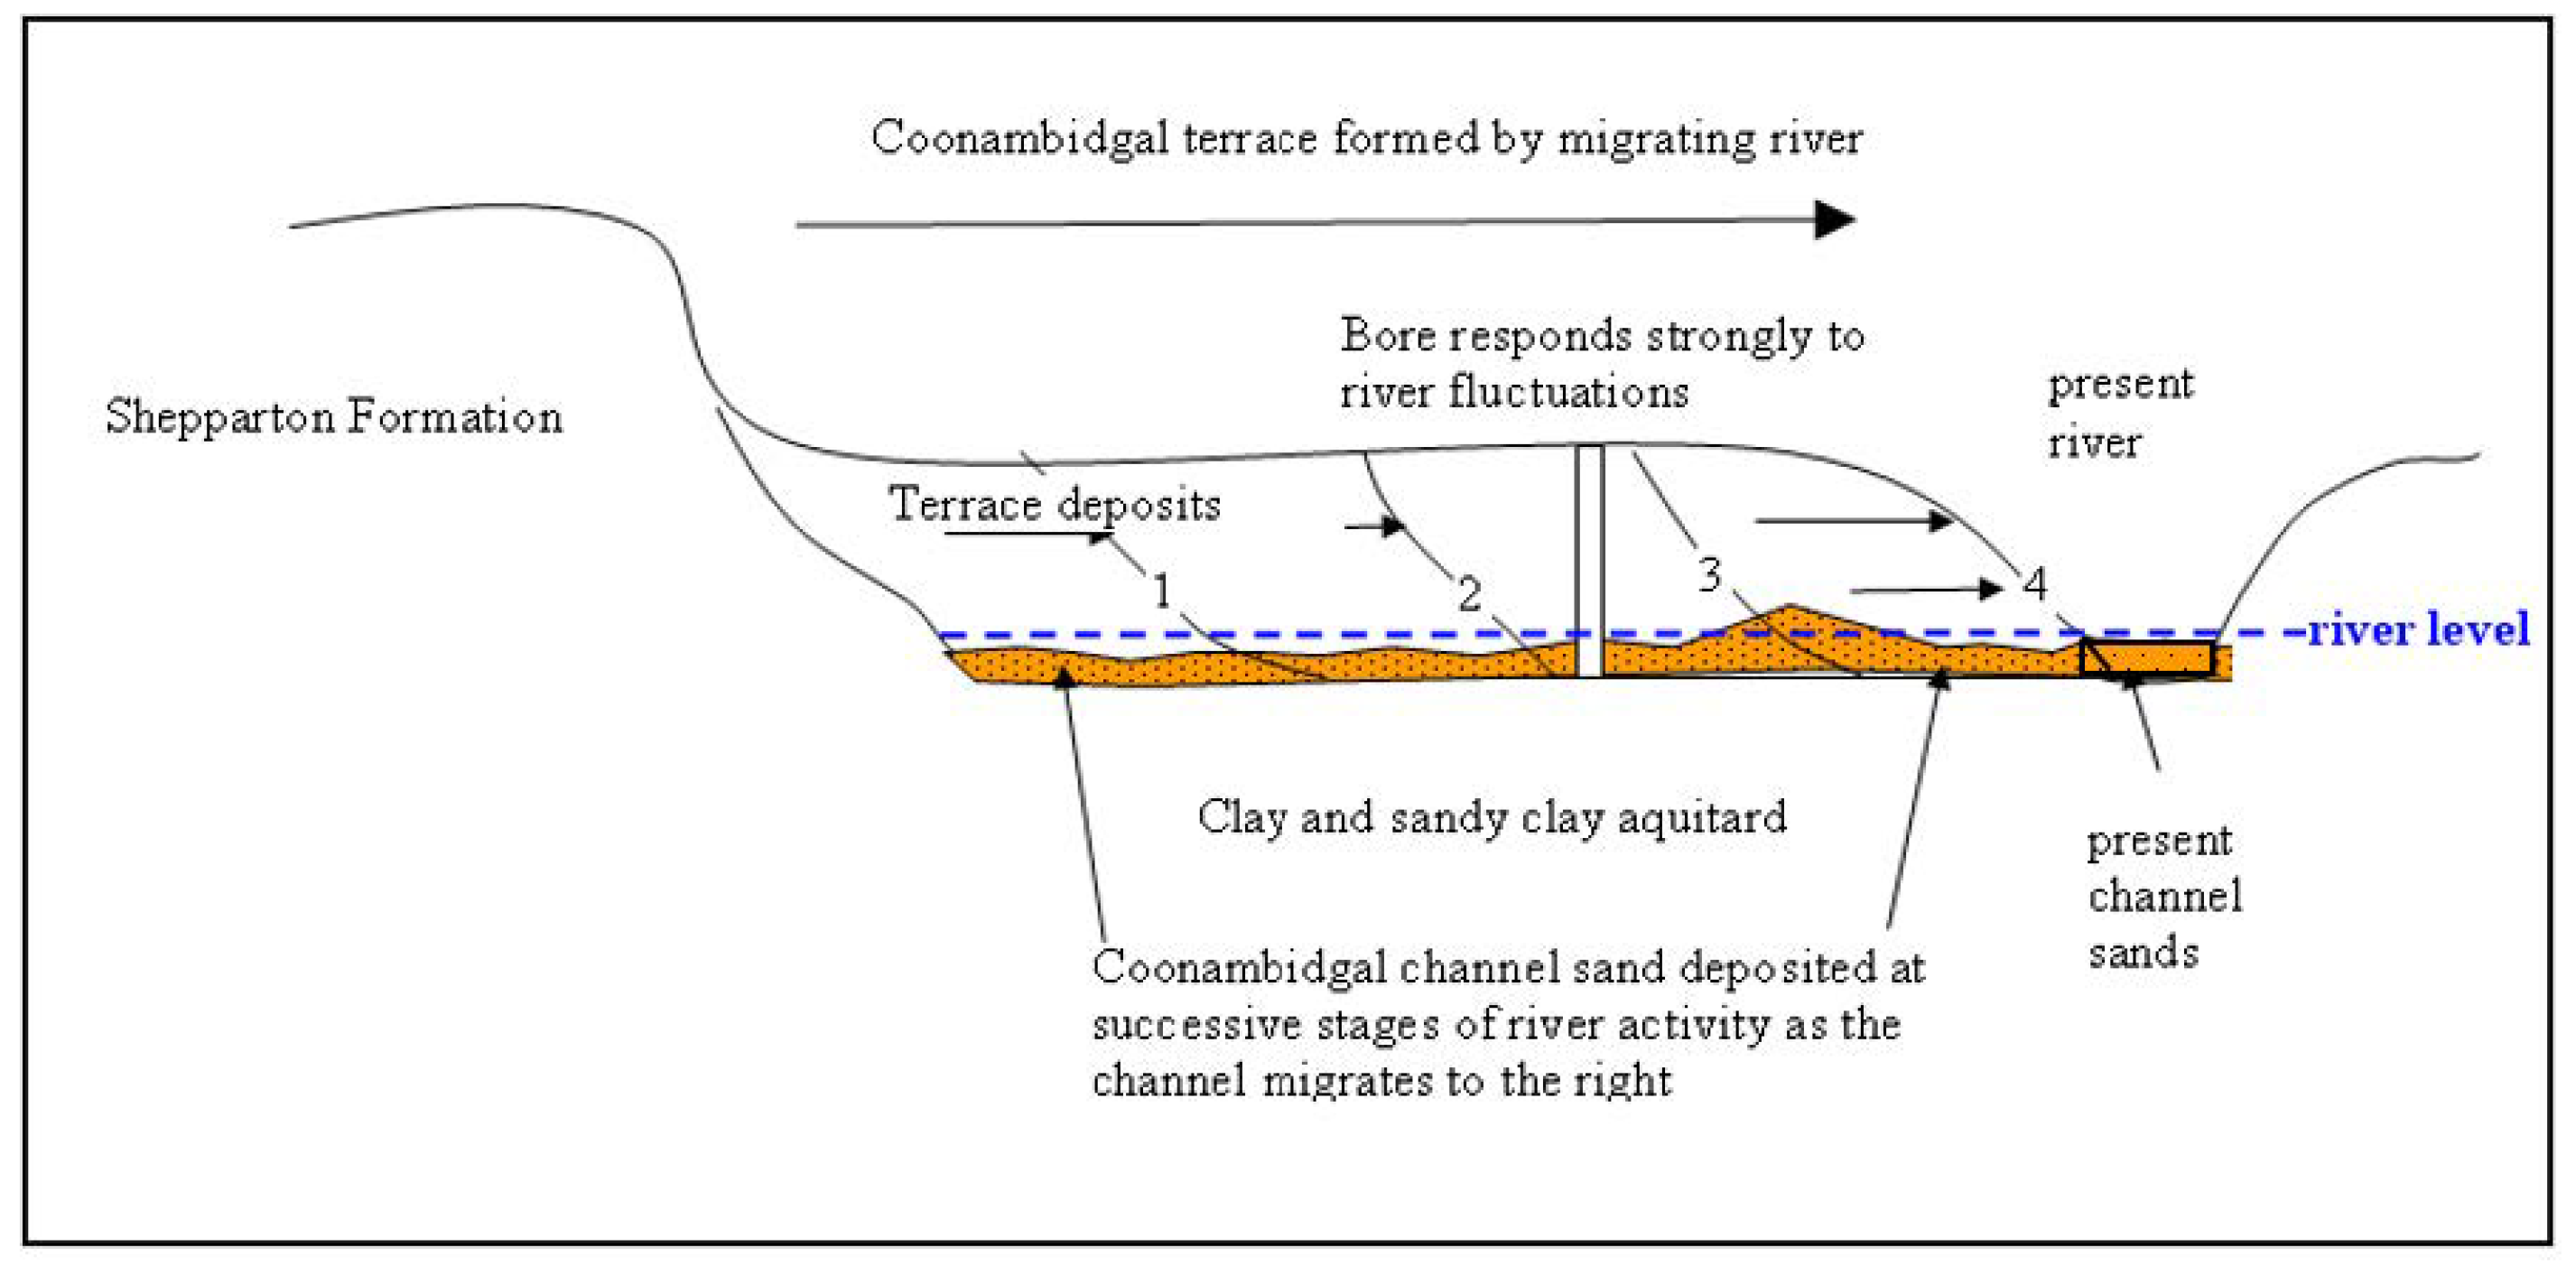
Figure 3.
Conceptualization of river-aquifer interconnectivity from the Campaspe River at Avonmore of the basal Coonambidgal Formation channel sands, the river channel, and the aquitard [
40].
Figure 3.
Conceptualization of river-aquifer interconnectivity from the Campaspe River at Avonmore of the basal Coonambidgal Formation channel sands, the river channel, and the aquitard [
40].
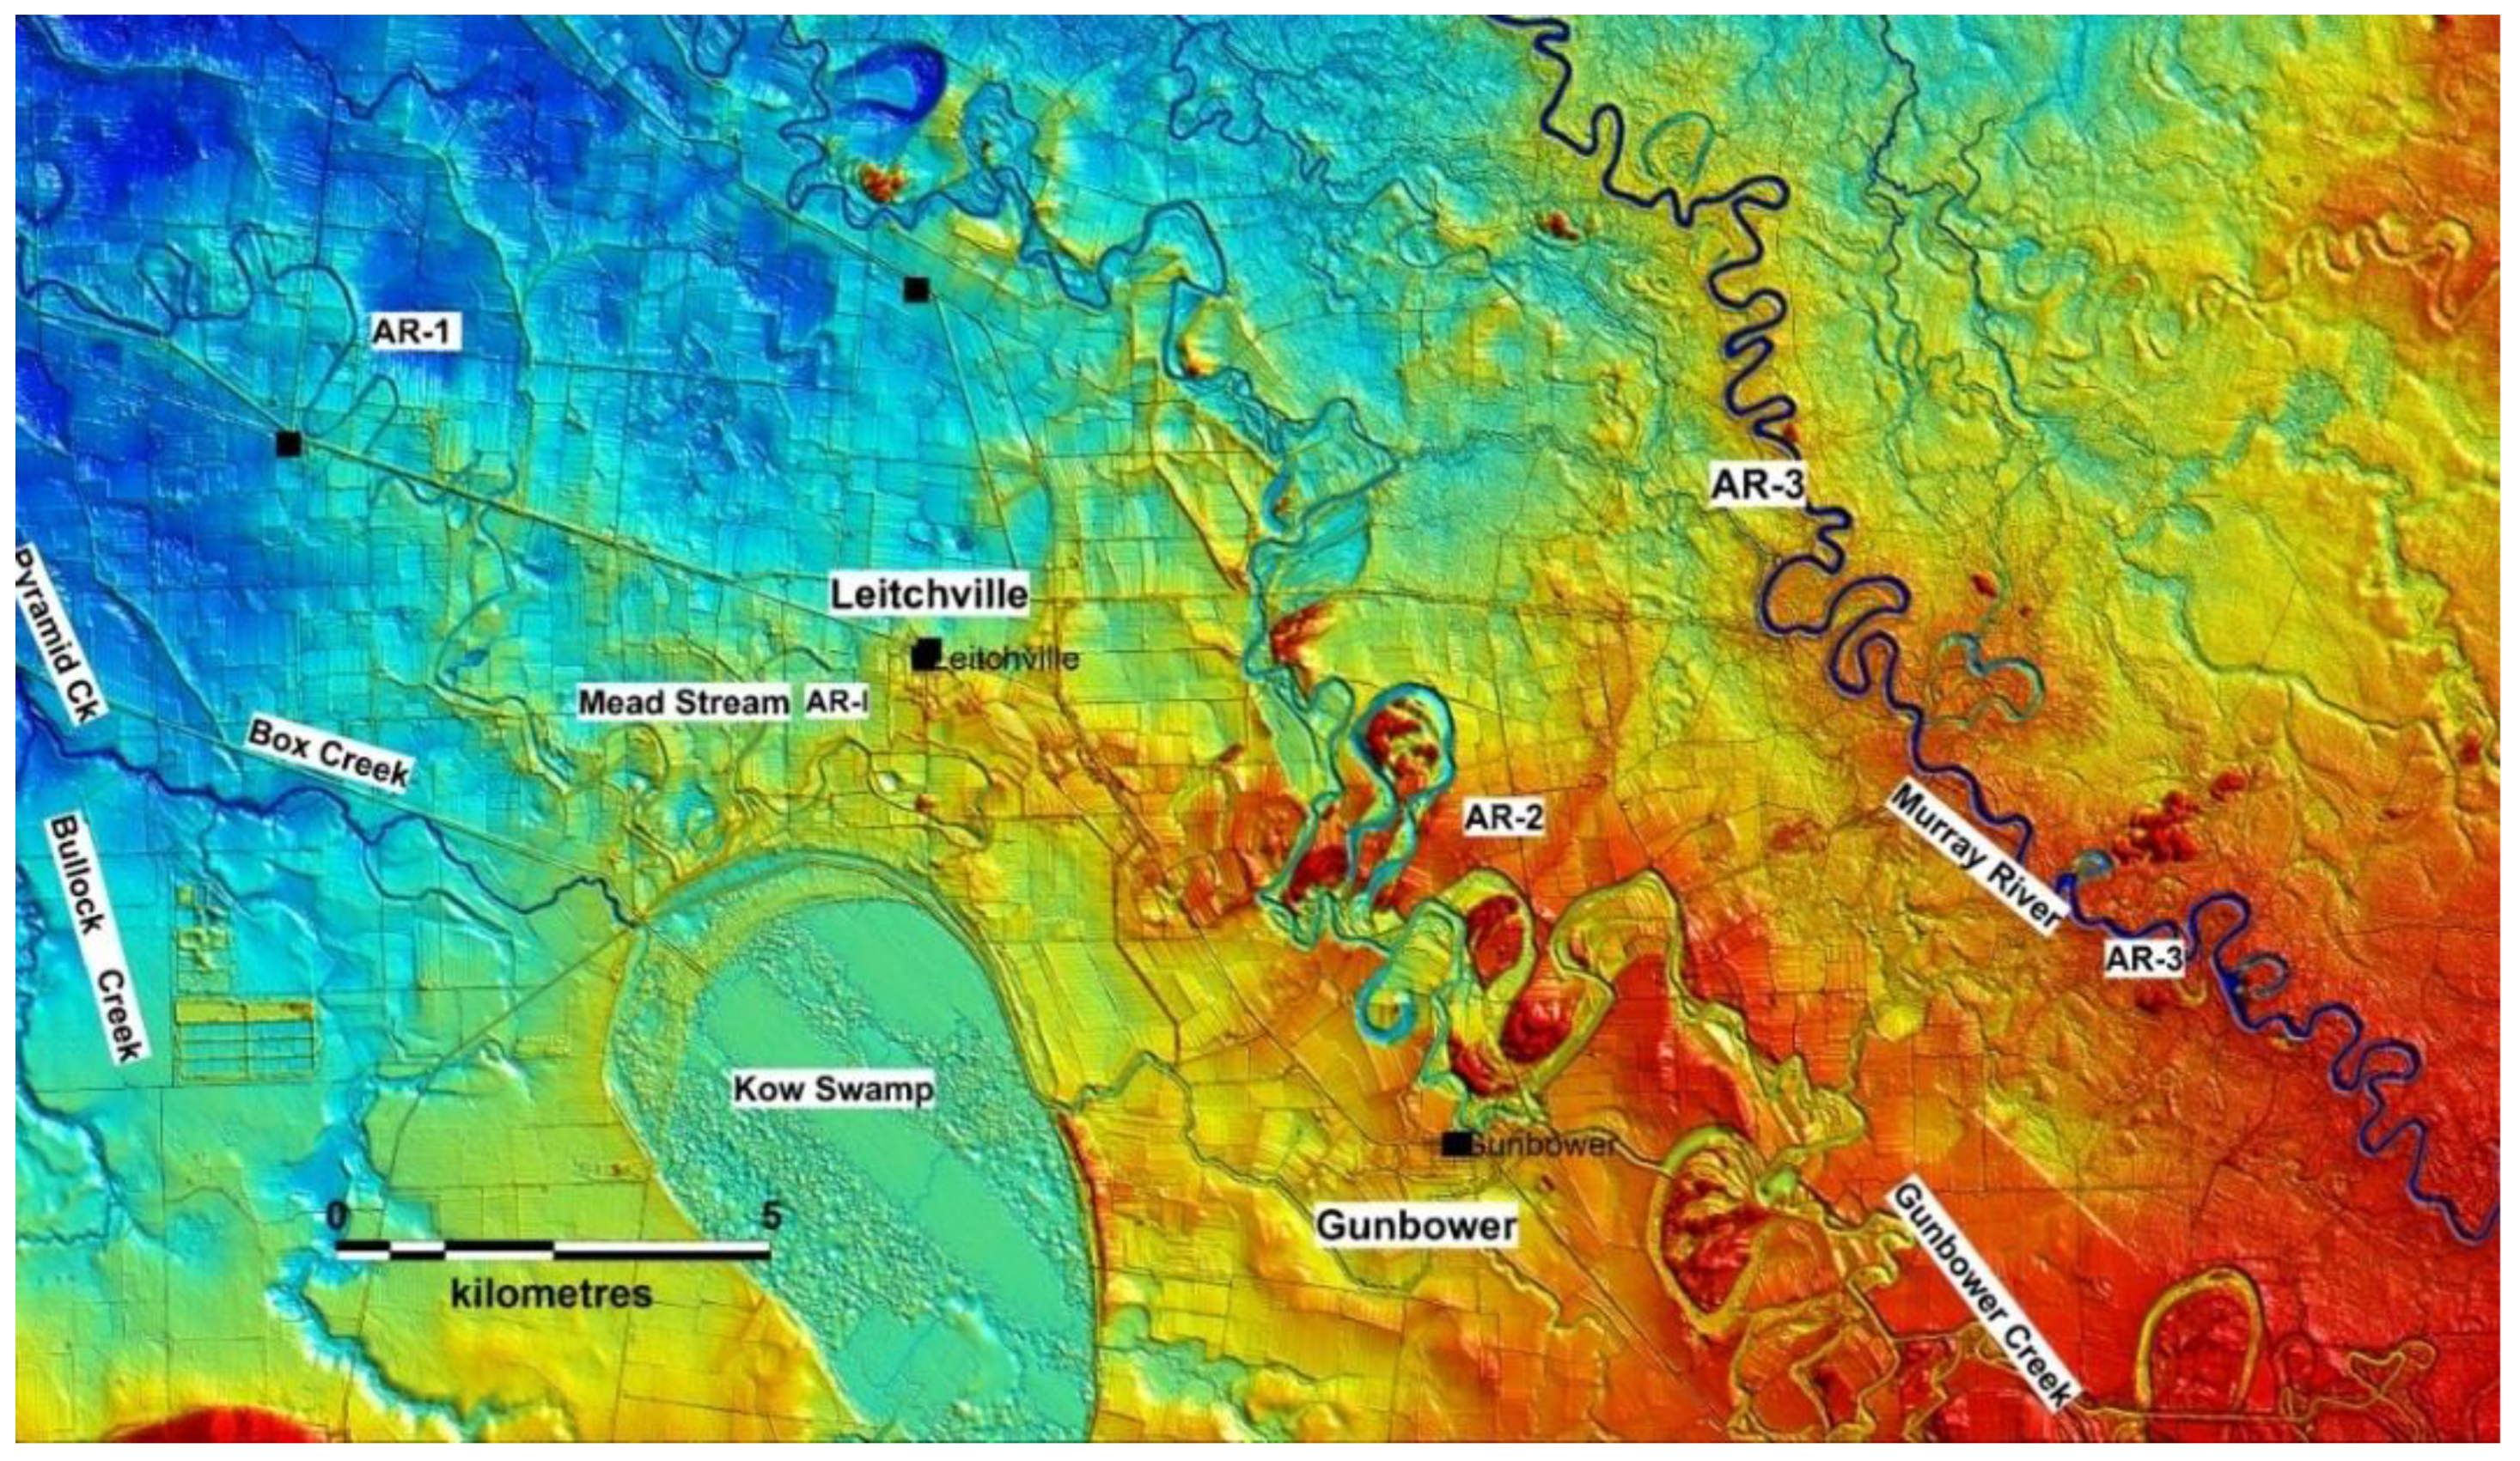
Figure 4.
Ancestral stream types in the vicinity of Kow Swamp, north-central Victoria. An AR2 phase of the Goulburn-Murray system is represented by the largest meanders with high source bordering dunes deflated from sandy point-bars and along which the modern Gunbower Creek now flows as a misfit stream. A separate parallel course to the north is taken by the AR3 phase including the modern Murray River. An AR1 phase passes to the north of Kow Swamp to be later joined by the Pyramid Creek and Loddon River (vicmap-elevation-dem-10 m–modified).
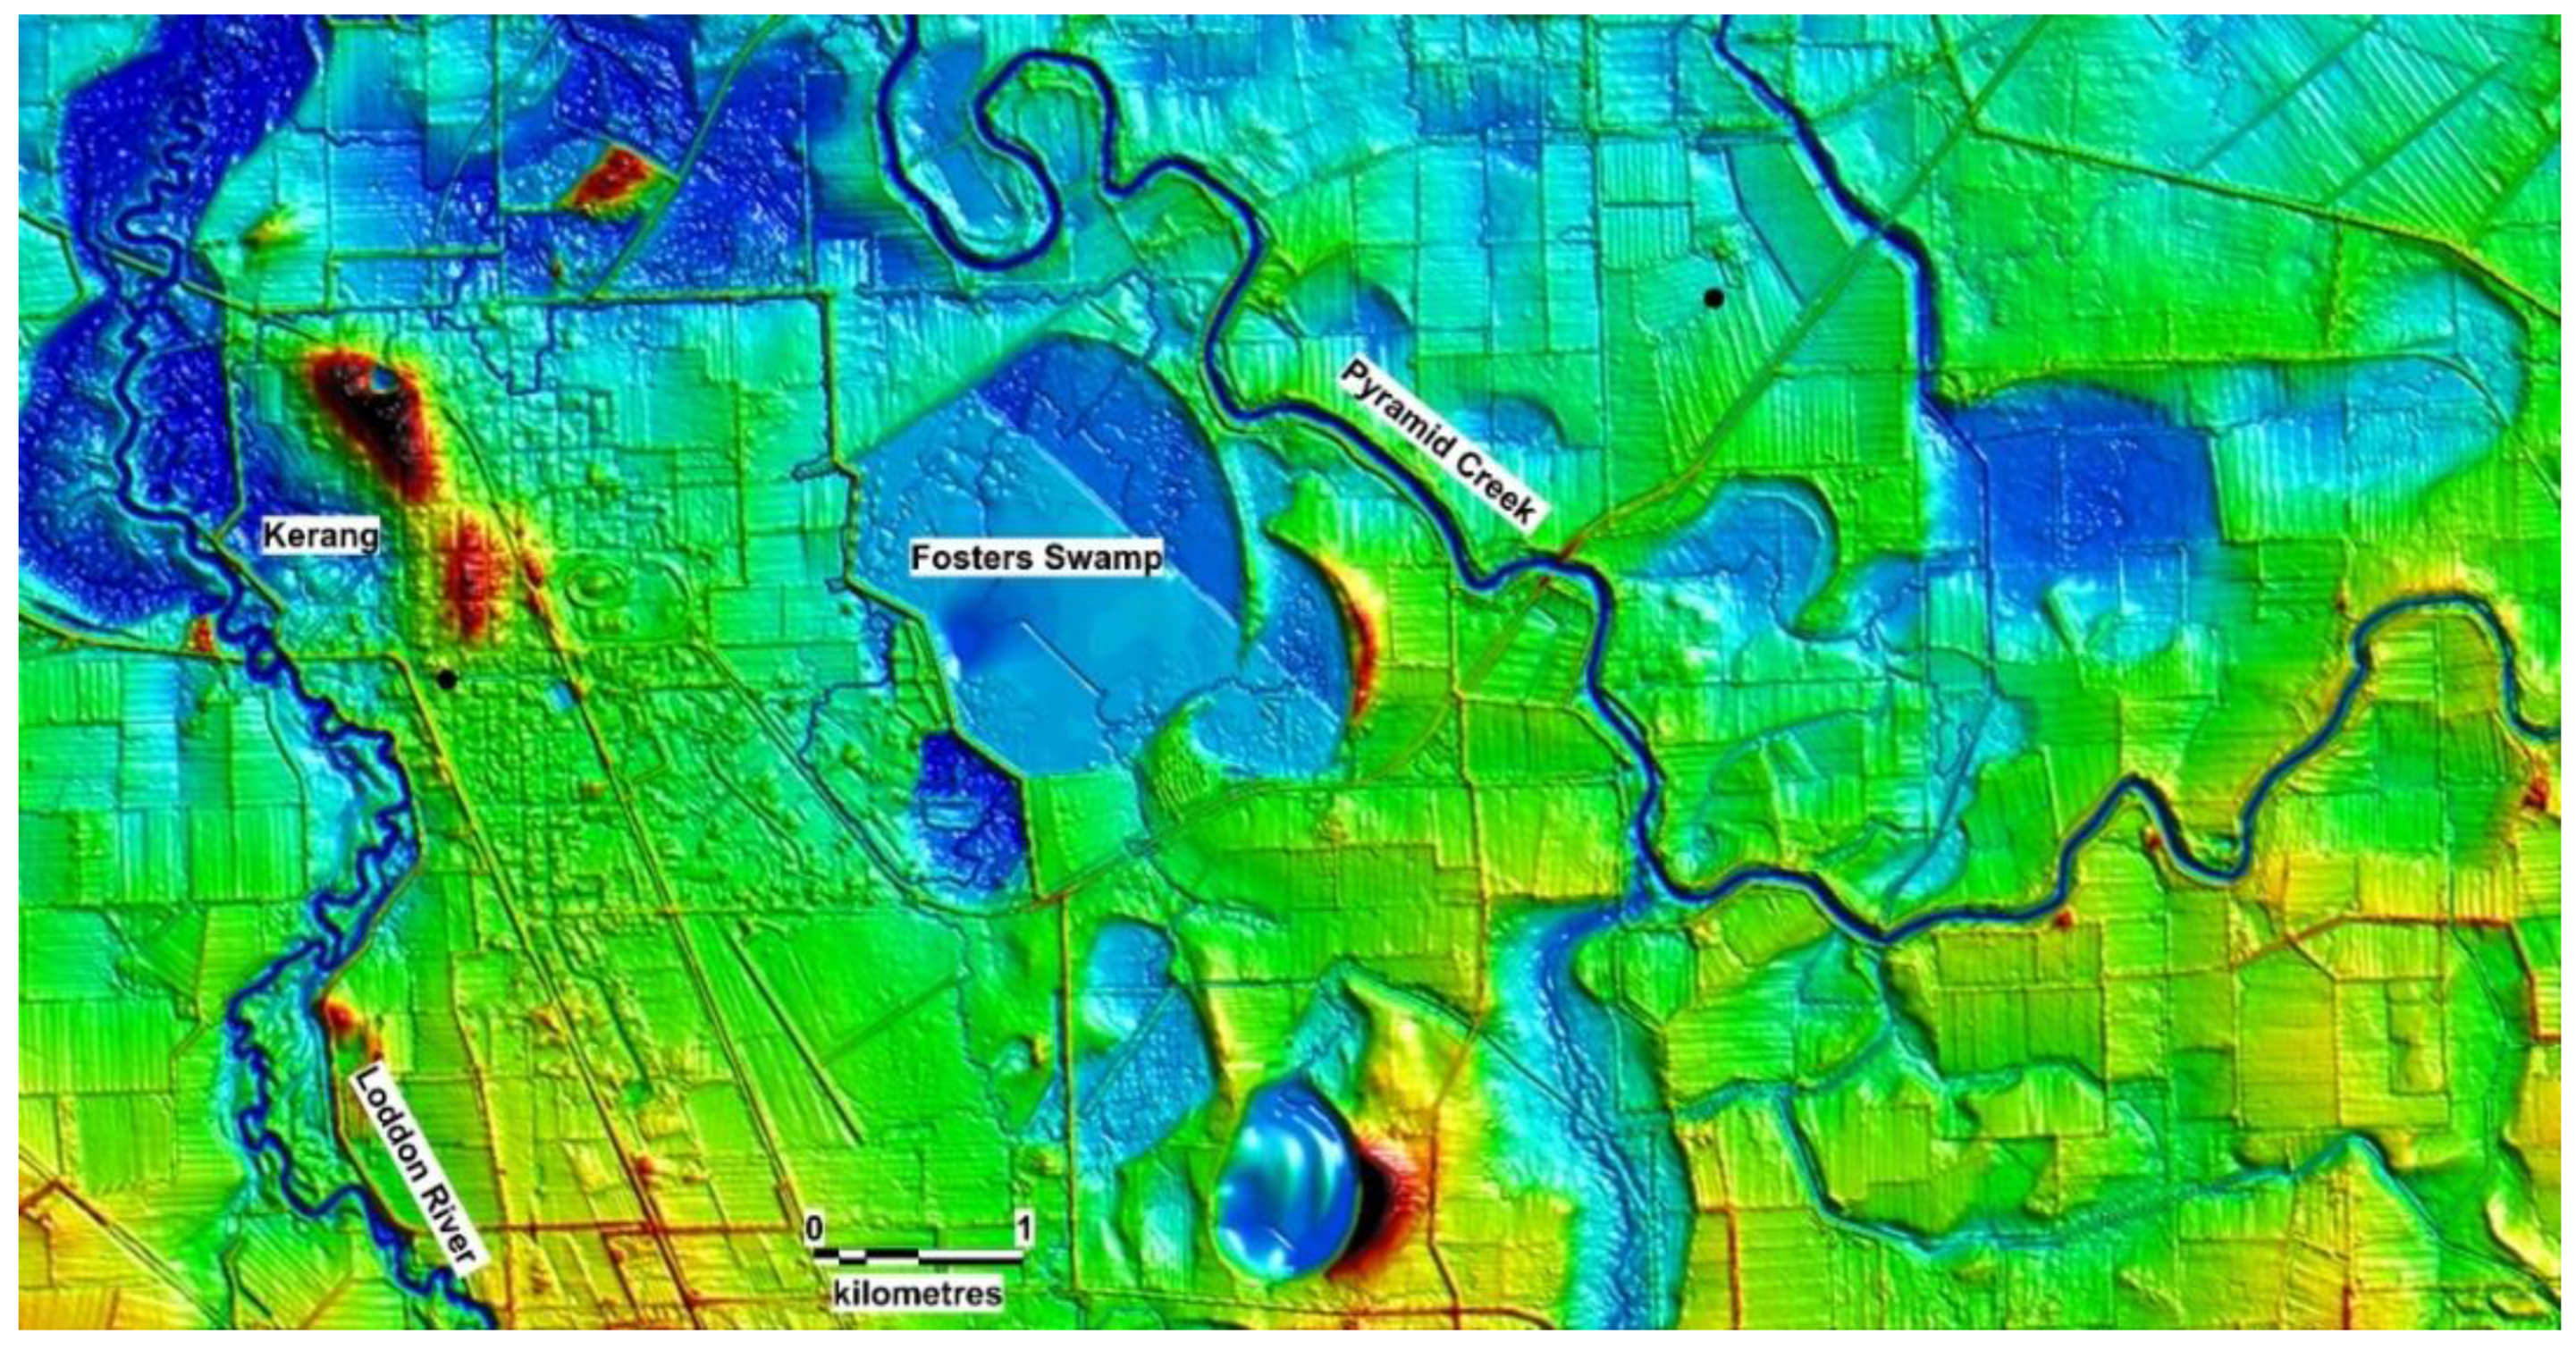
Figure 5.
Pyramid Creek flows as a misfit stream having the long wavelength of the late Pleistocene AR1 system, also adopted by the Loddon River, an AR3 system which joins Pyramid Creek further north at Kerang. (vicmap-elevation-dem-10 m–modified).
Figure 5.
Pyramid Creek flows as a misfit stream having the long wavelength of the late Pleistocene AR1 system, also adopted by the Loddon River, an AR3 system which joins Pyramid Creek further north at Kerang. (vicmap-elevation-dem-10 m–modified).
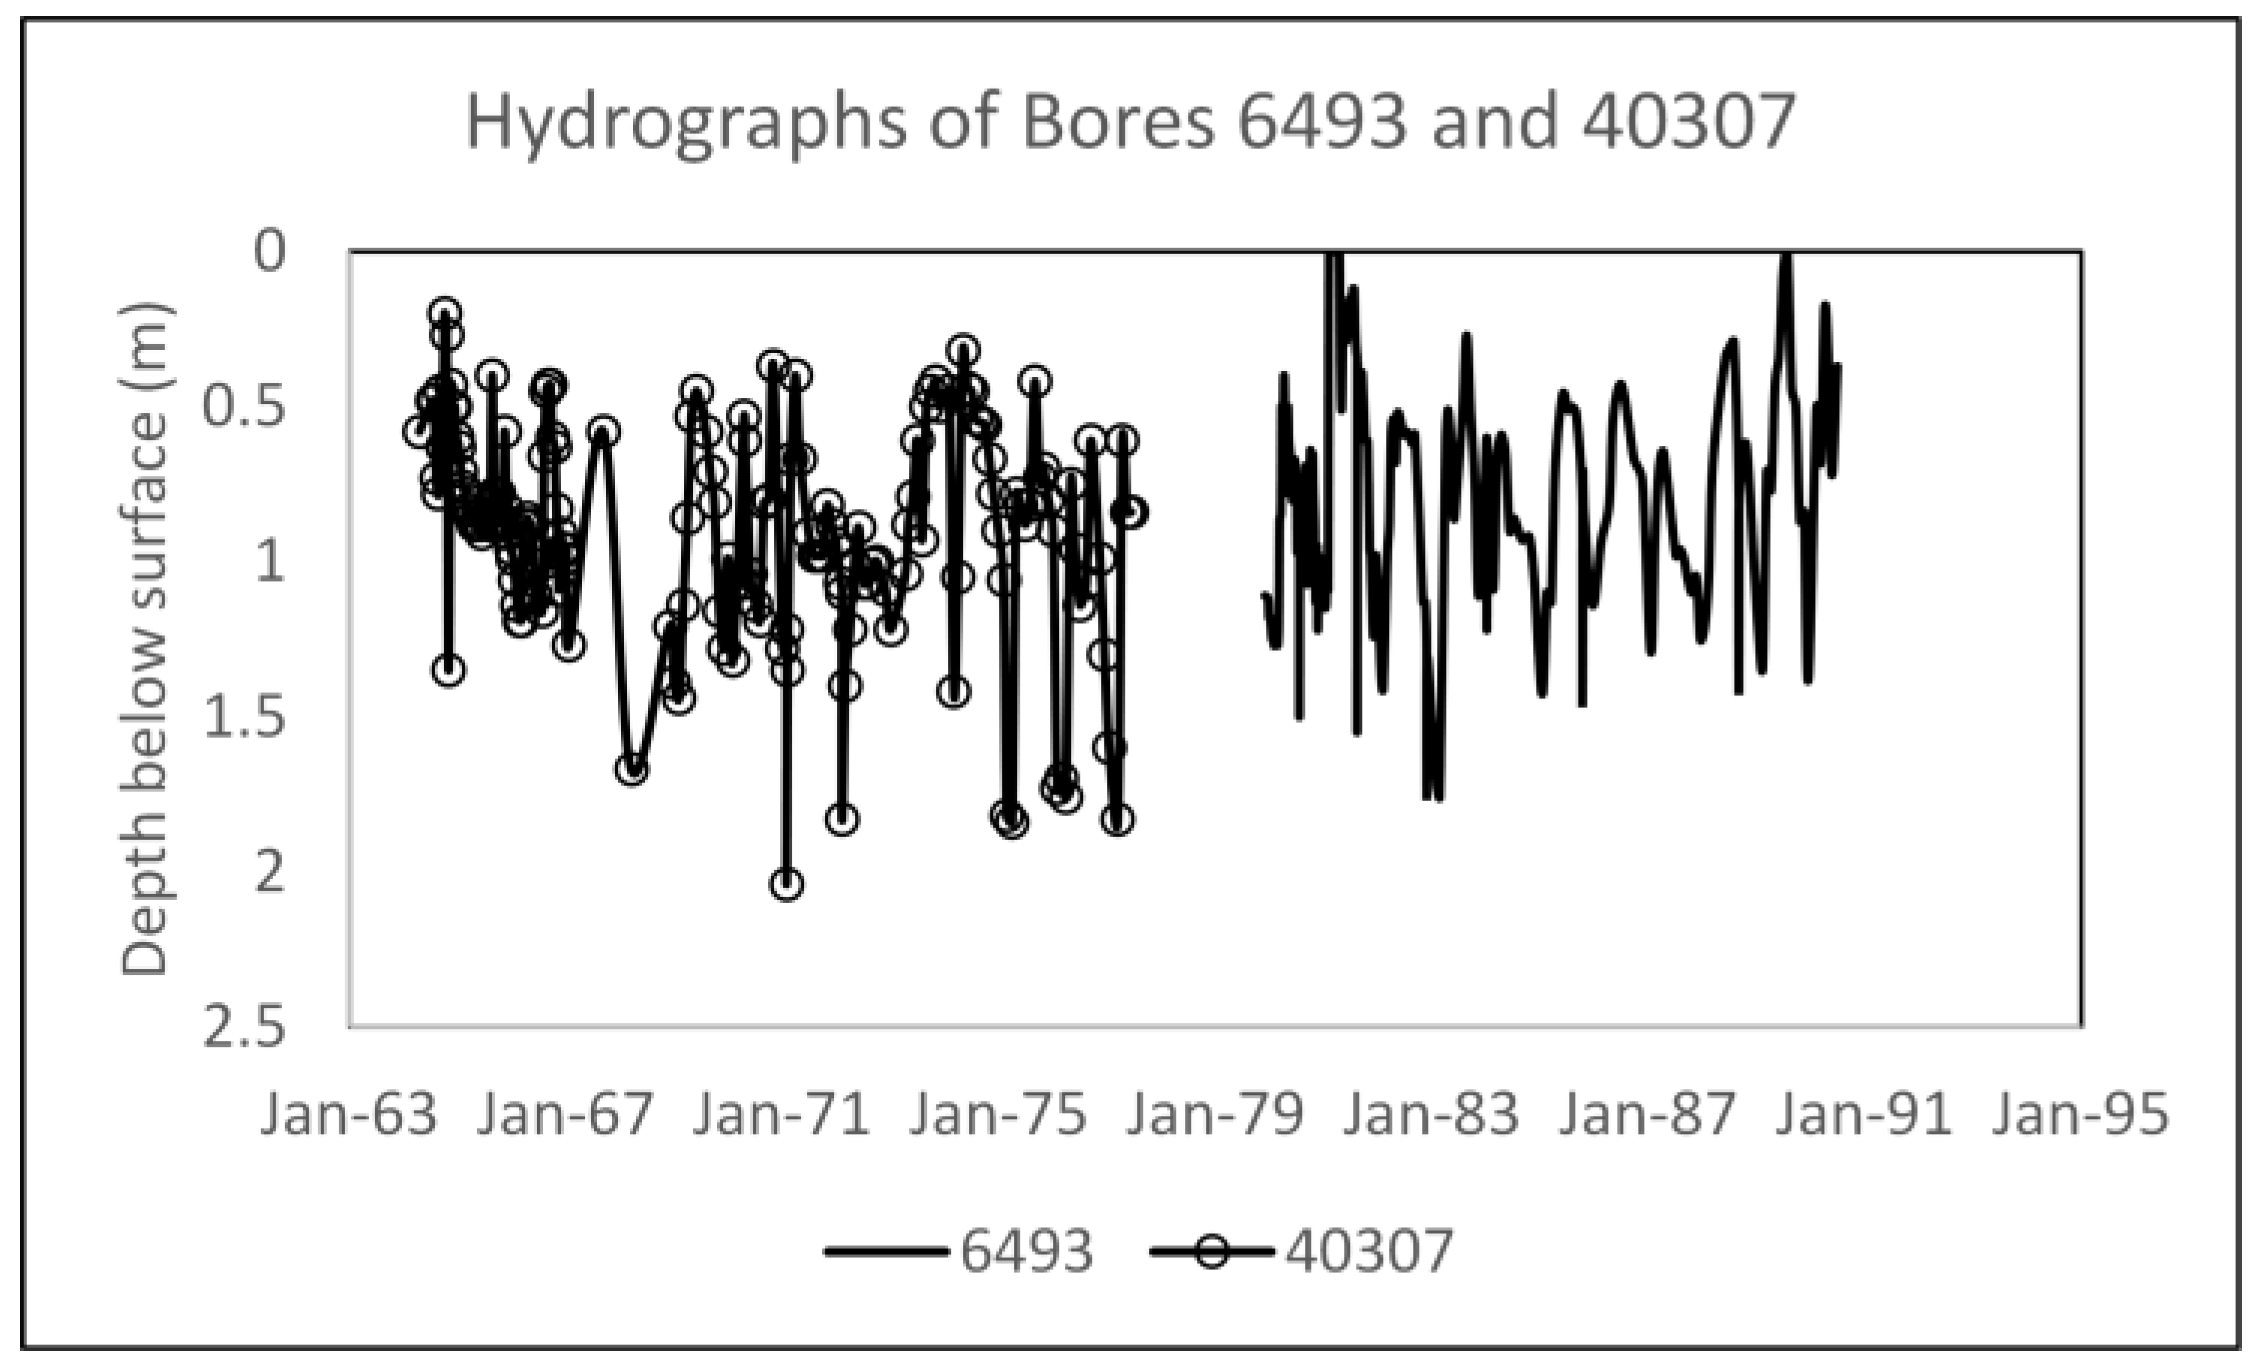
Figure 6.
Static water levels in the vicinity of the Pyramid Creek shallow (3 m) bores 40307 and 6493. The salinity of 6493 was 62,300 EC (μS/cm) in December 1988.
Figure 6.
Static water levels in the vicinity of the Pyramid Creek shallow (3 m) bores 40307 and 6493. The salinity of 6493 was 62,300 EC (μS/cm) in December 1988.
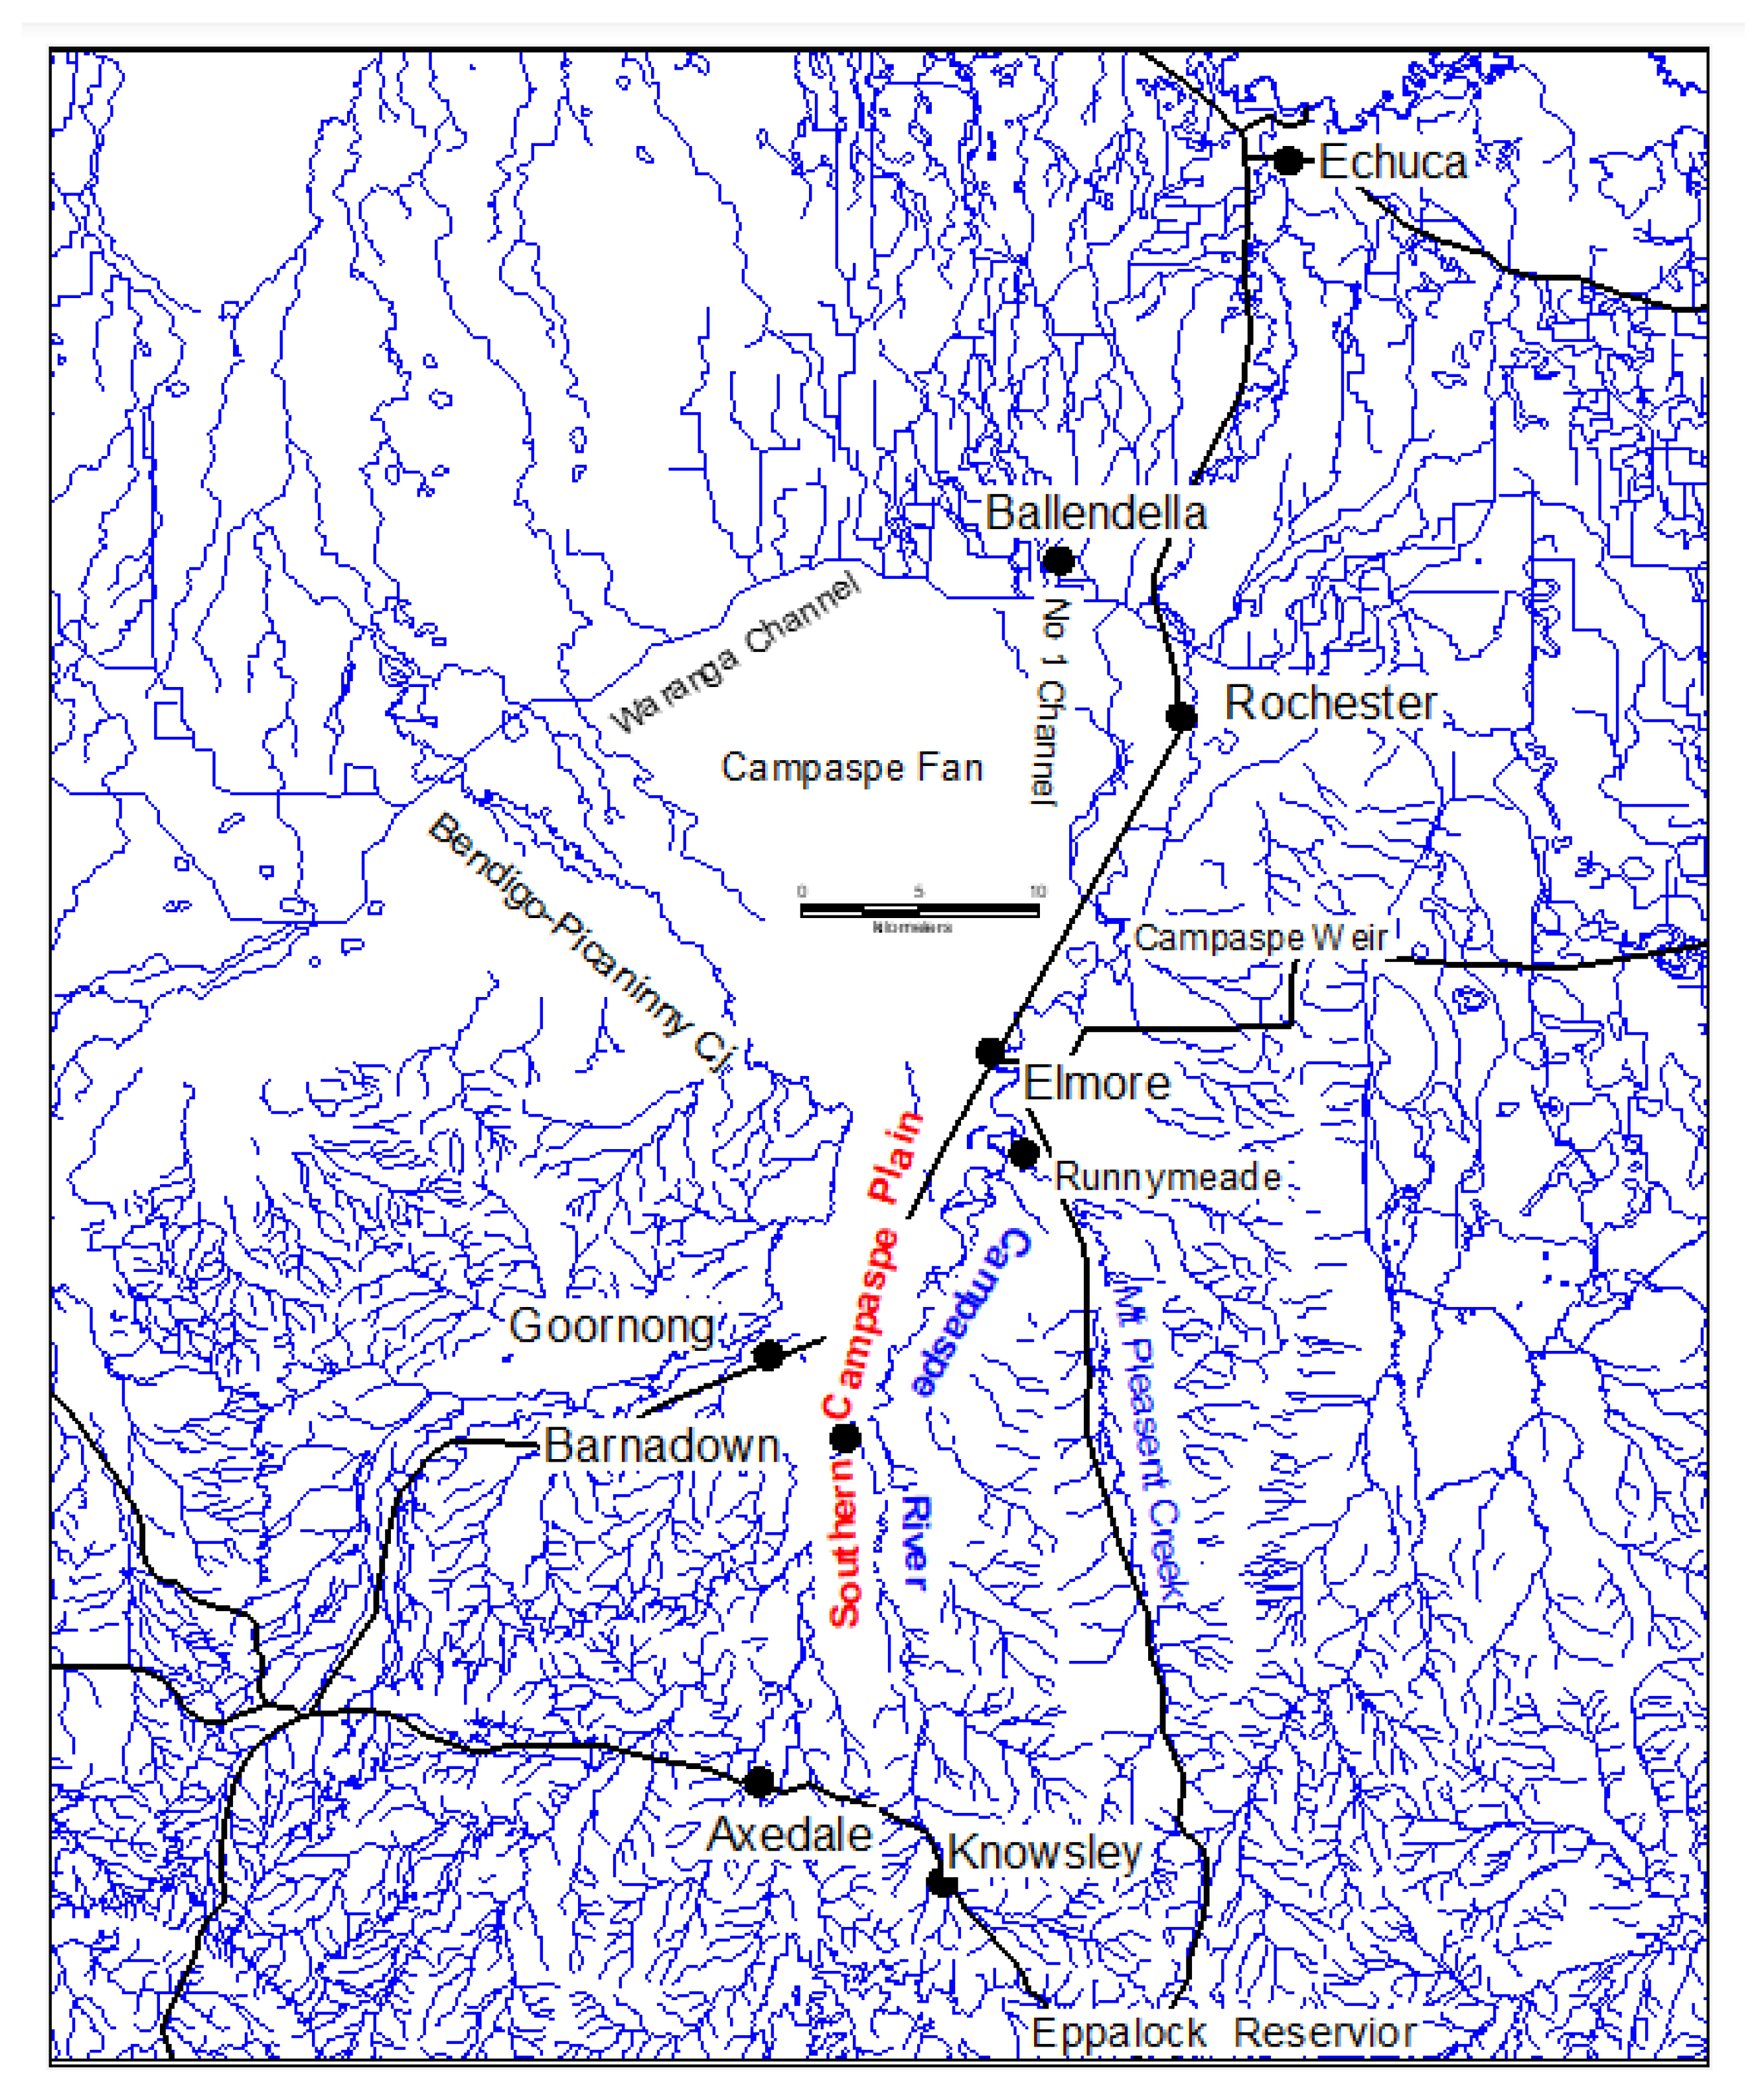
Figure 7.
The geomorphology of the Campaspe Valley showing the Southern Campaspe Plain and the Campaspe Fan. High density dendritic drainage pattern on the valley sides is responsible for high volume storm recharge to the Plain [
50].
Figure 7.
The geomorphology of the Campaspe Valley showing the Southern Campaspe Plain and the Campaspe Fan. High density dendritic drainage pattern on the valley sides is responsible for high volume storm recharge to the Plain [
50].
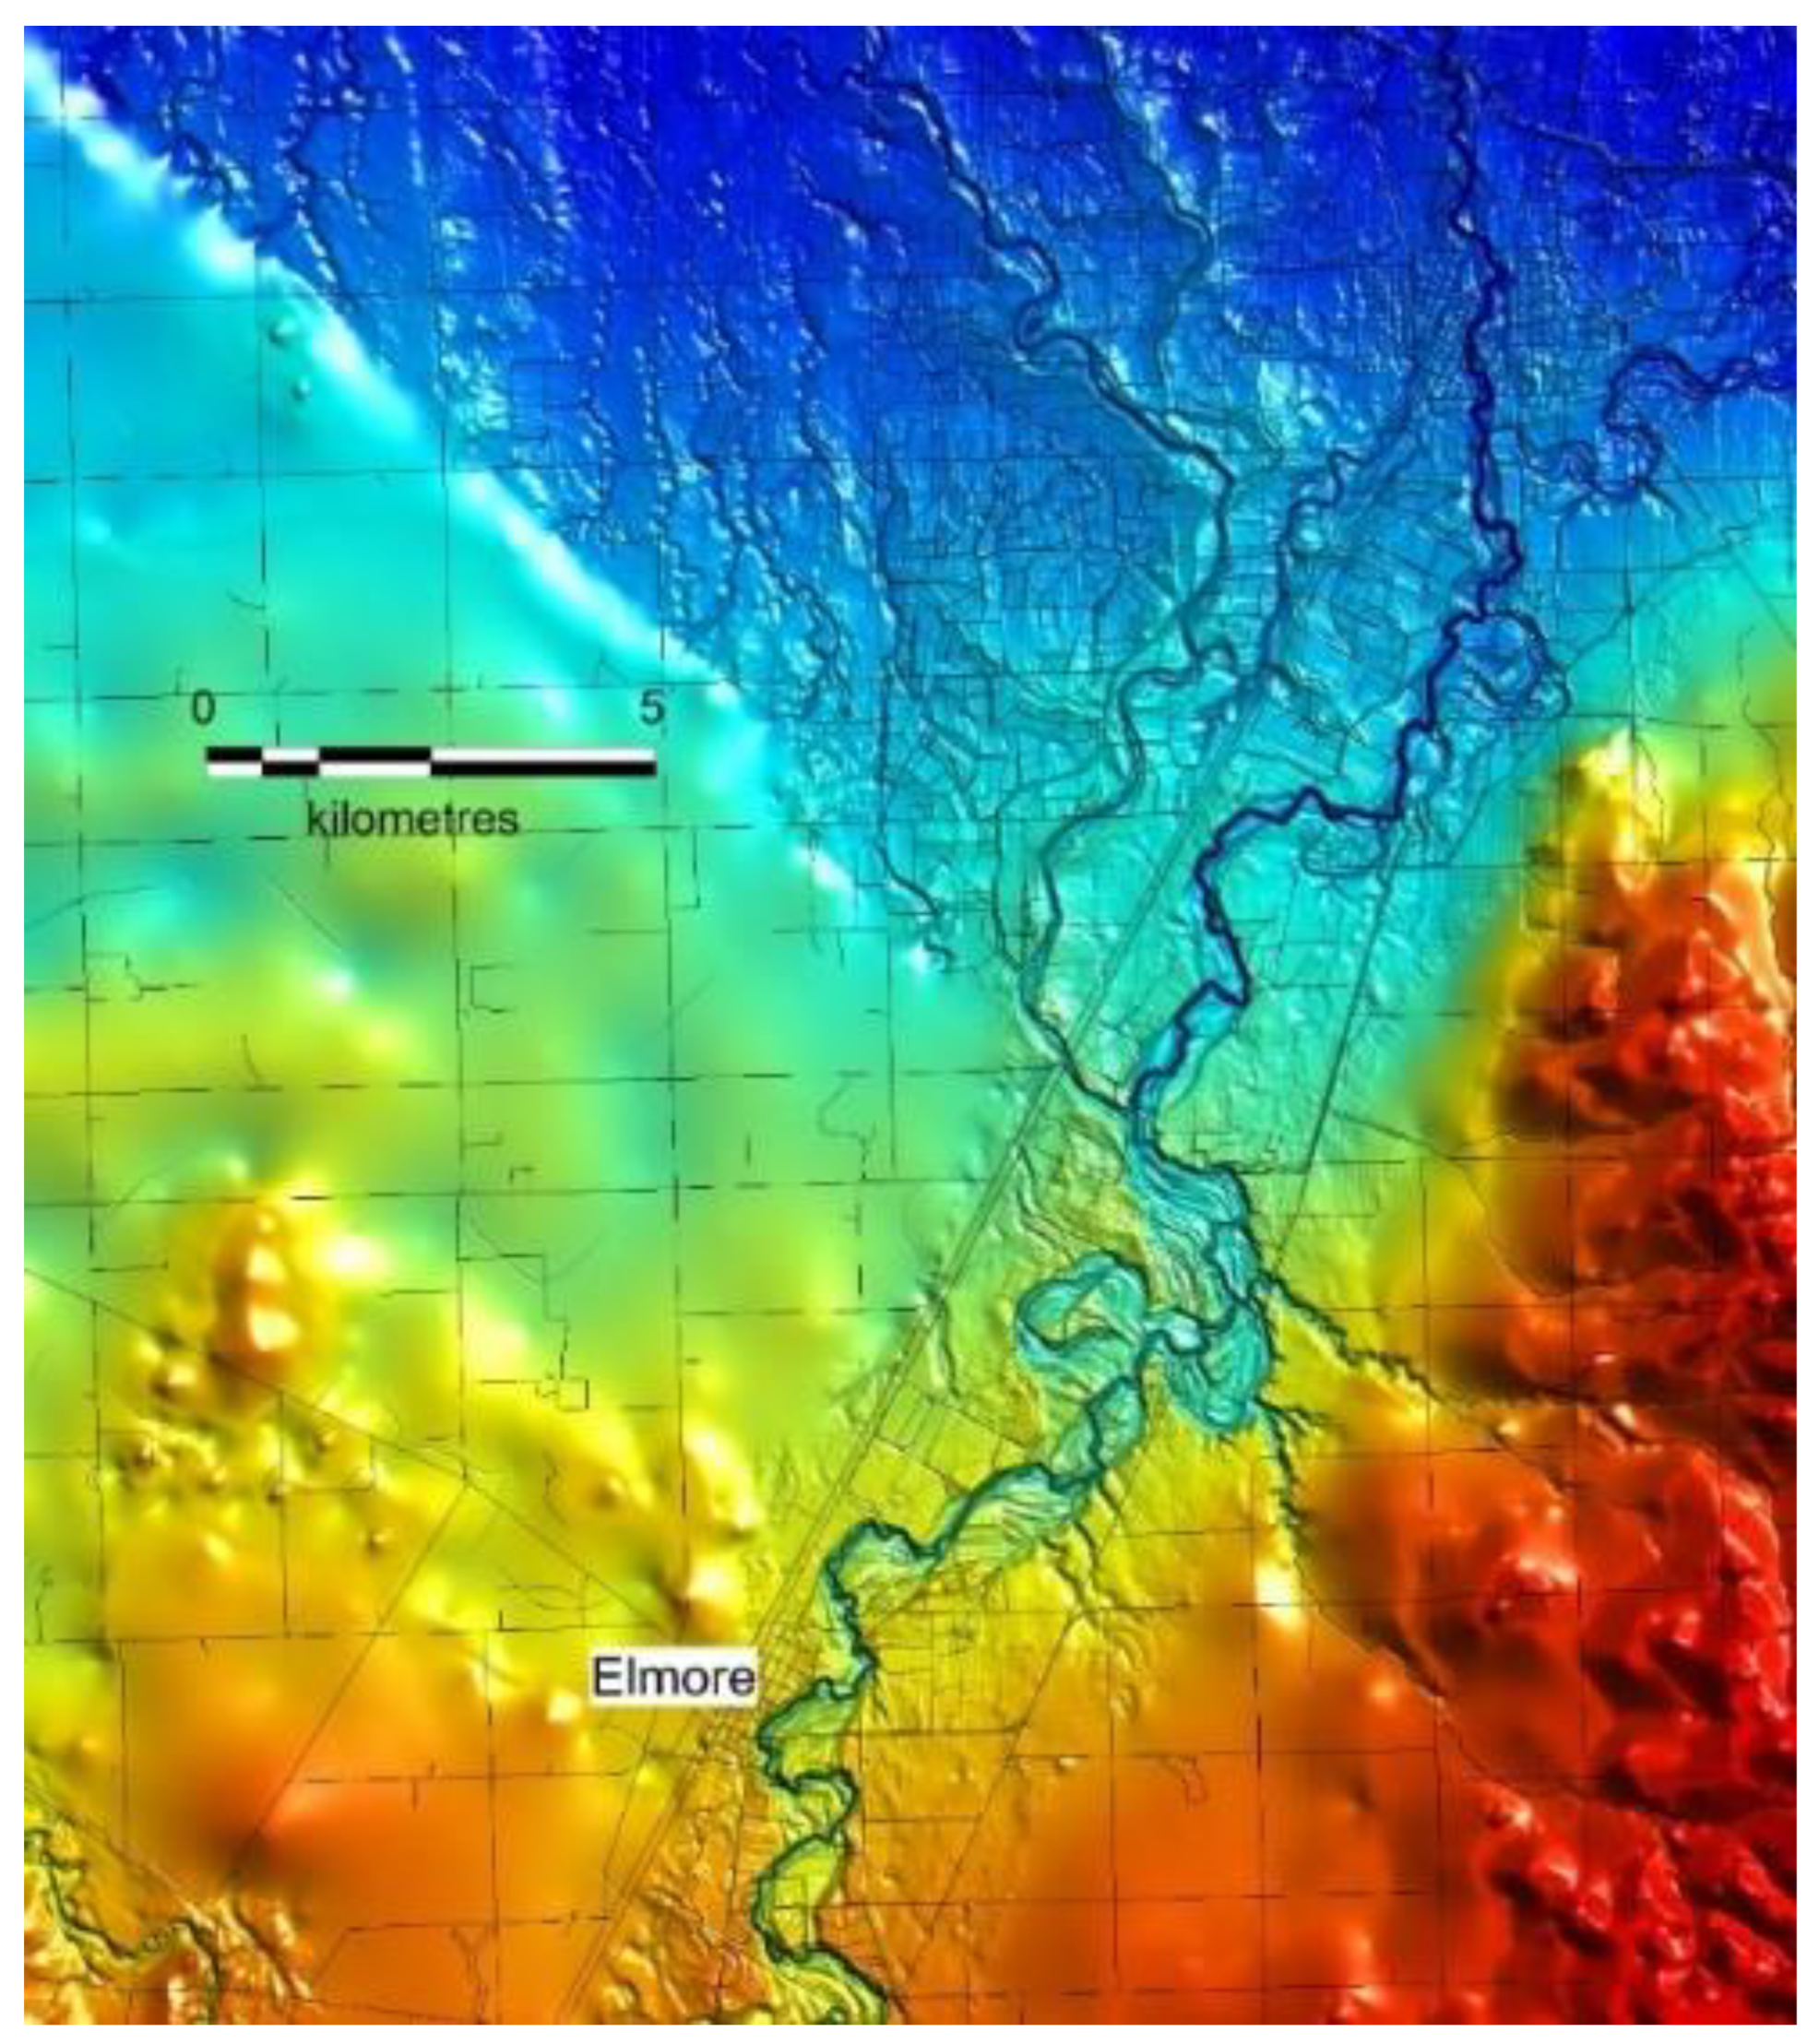
Figure 8.
The change in stream morphology of the Campaspe Valley to the north of Elmore from an incised Coonambidgal Formation terrace system to an anastomosing shoe-string sand regime forming the Campaspe Fan. (vicmap-elevation-dem-10 m–mod.).
Figure 8.
The change in stream morphology of the Campaspe Valley to the north of Elmore from an incised Coonambidgal Formation terrace system to an anastomosing shoe-string sand regime forming the Campaspe Fan. (vicmap-elevation-dem-10 m–mod.).
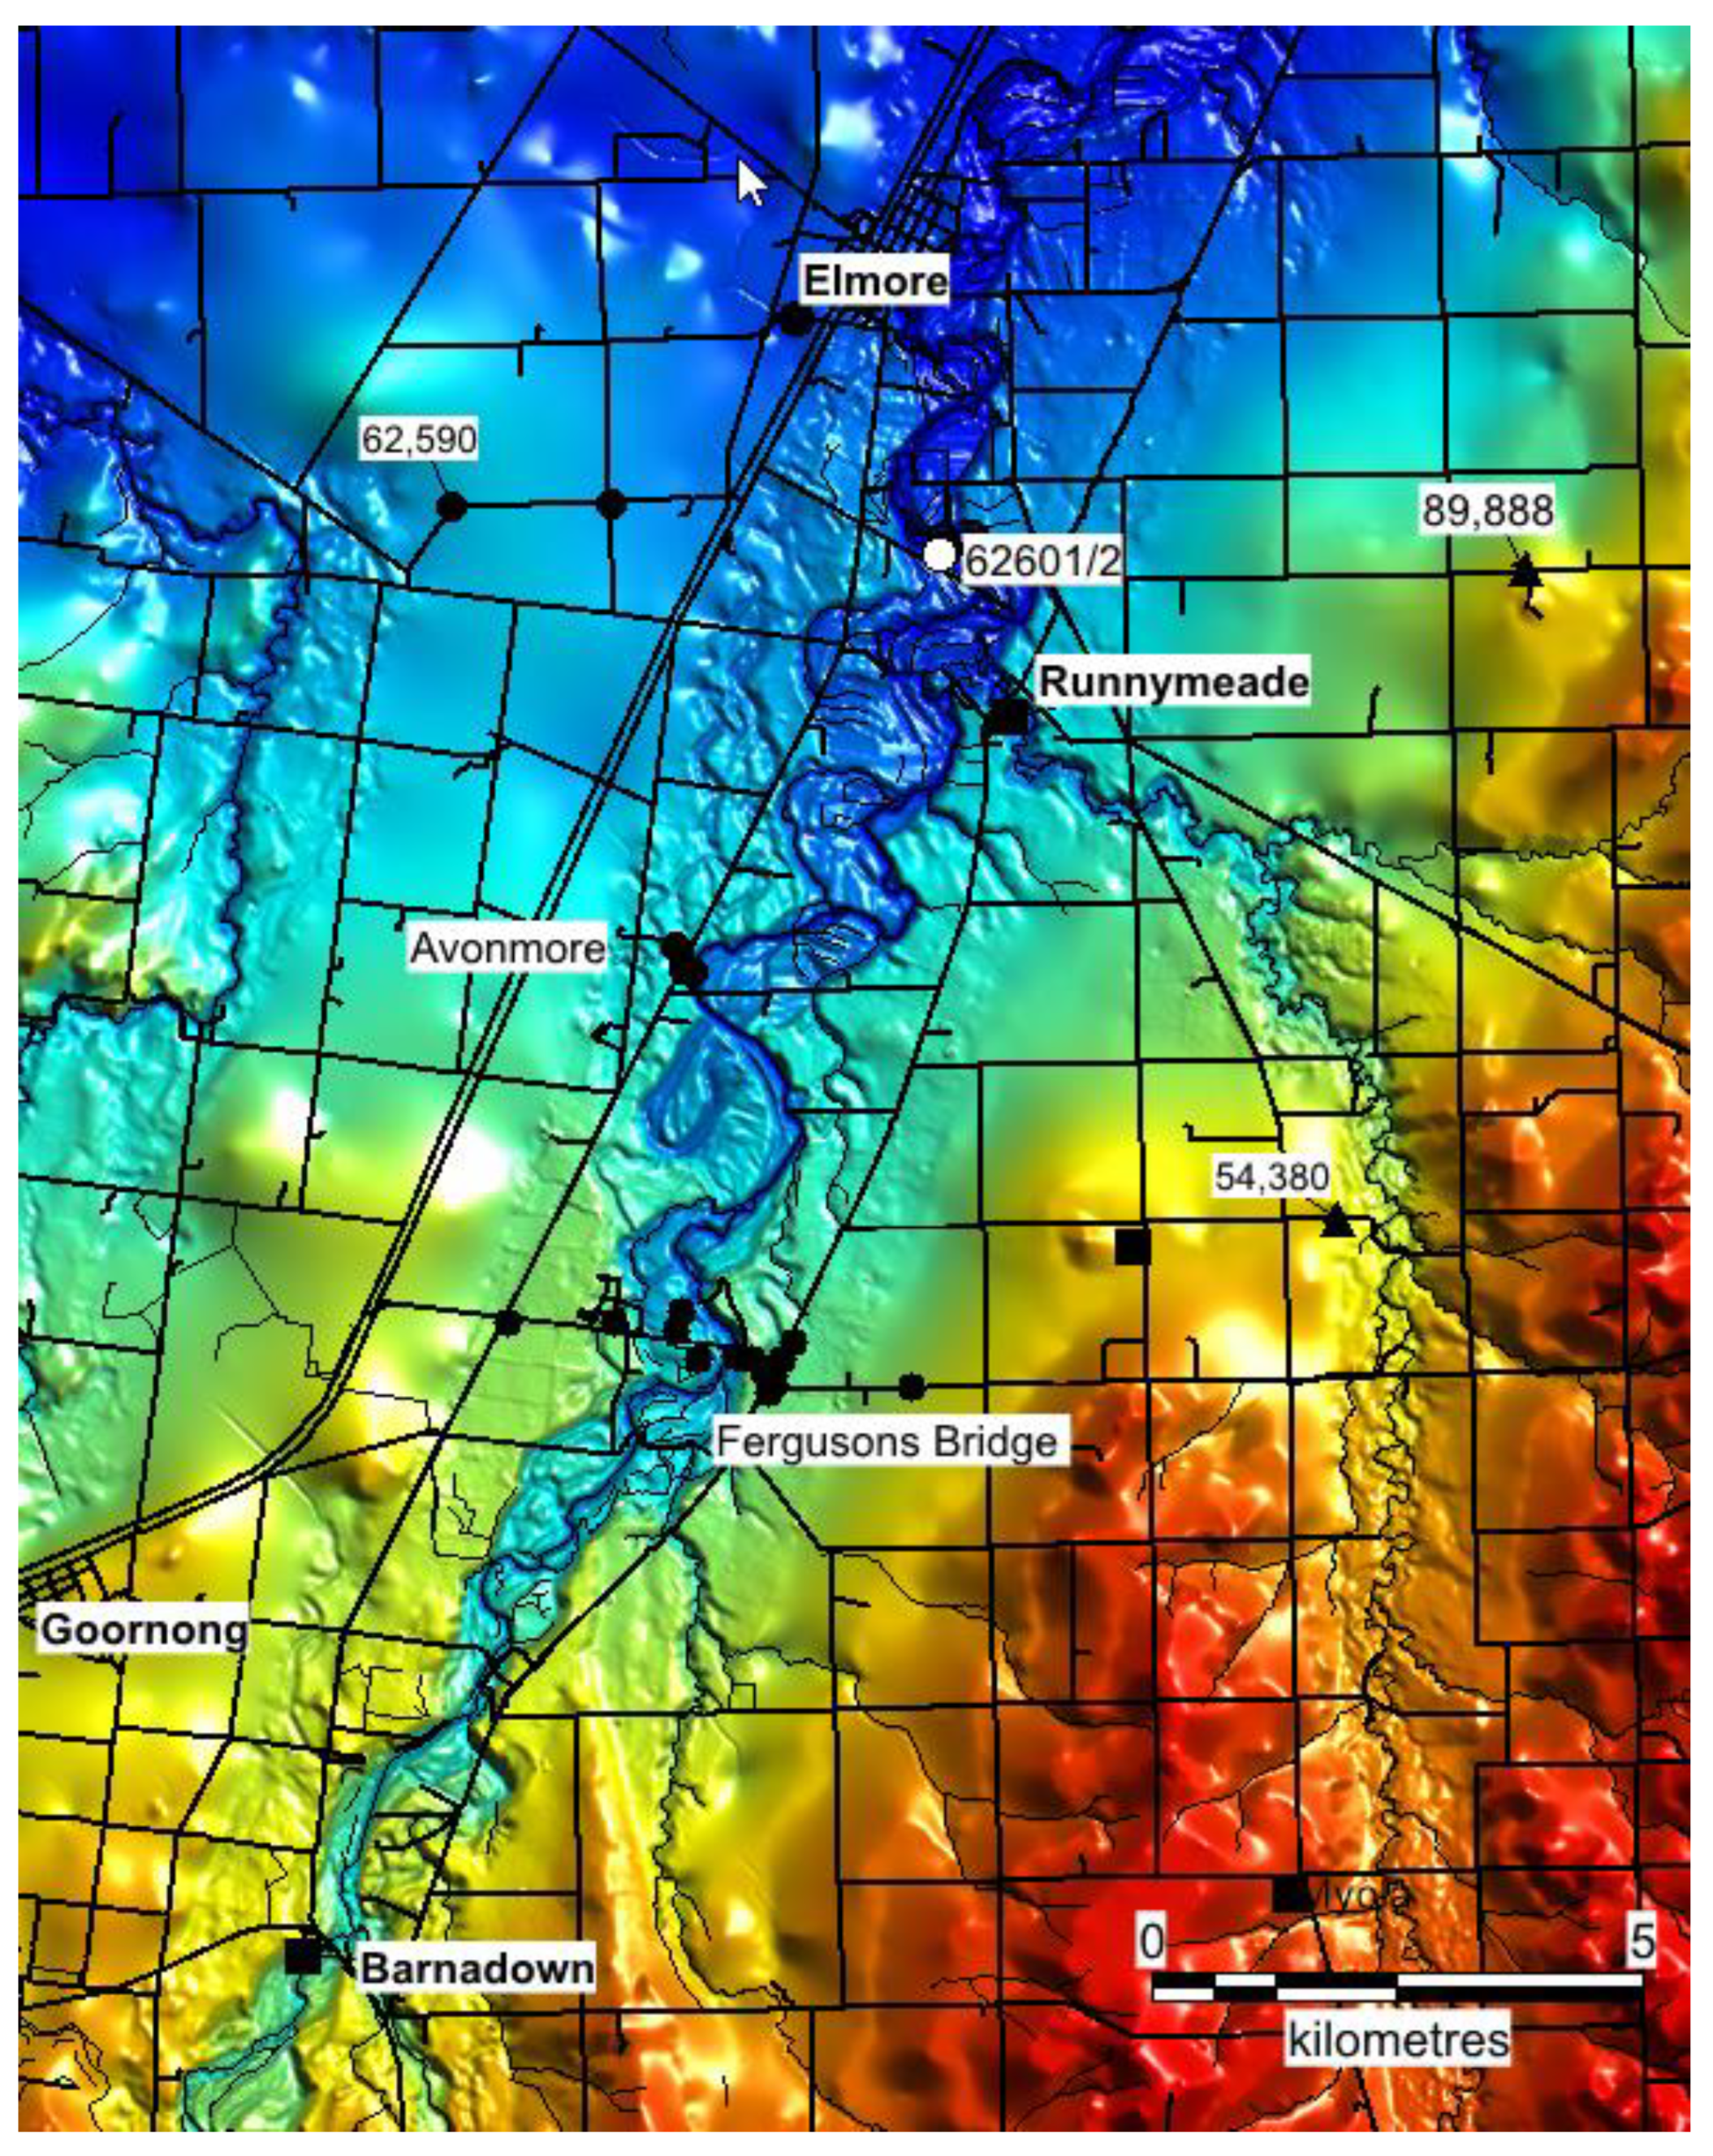
Figure 9.
The course of the Coonambidgal trench across the Southern Campaspe Plain with the Ferguson Bridge, Avonmore and 62601/2 Coonambidgal Formation sites and lateral bores (vicmap-elevation-dem-10 m–mod).
Figure 9.
The course of the Coonambidgal trench across the Southern Campaspe Plain with the Ferguson Bridge, Avonmore and 62601/2 Coonambidgal Formation sites and lateral bores (vicmap-elevation-dem-10 m–mod).
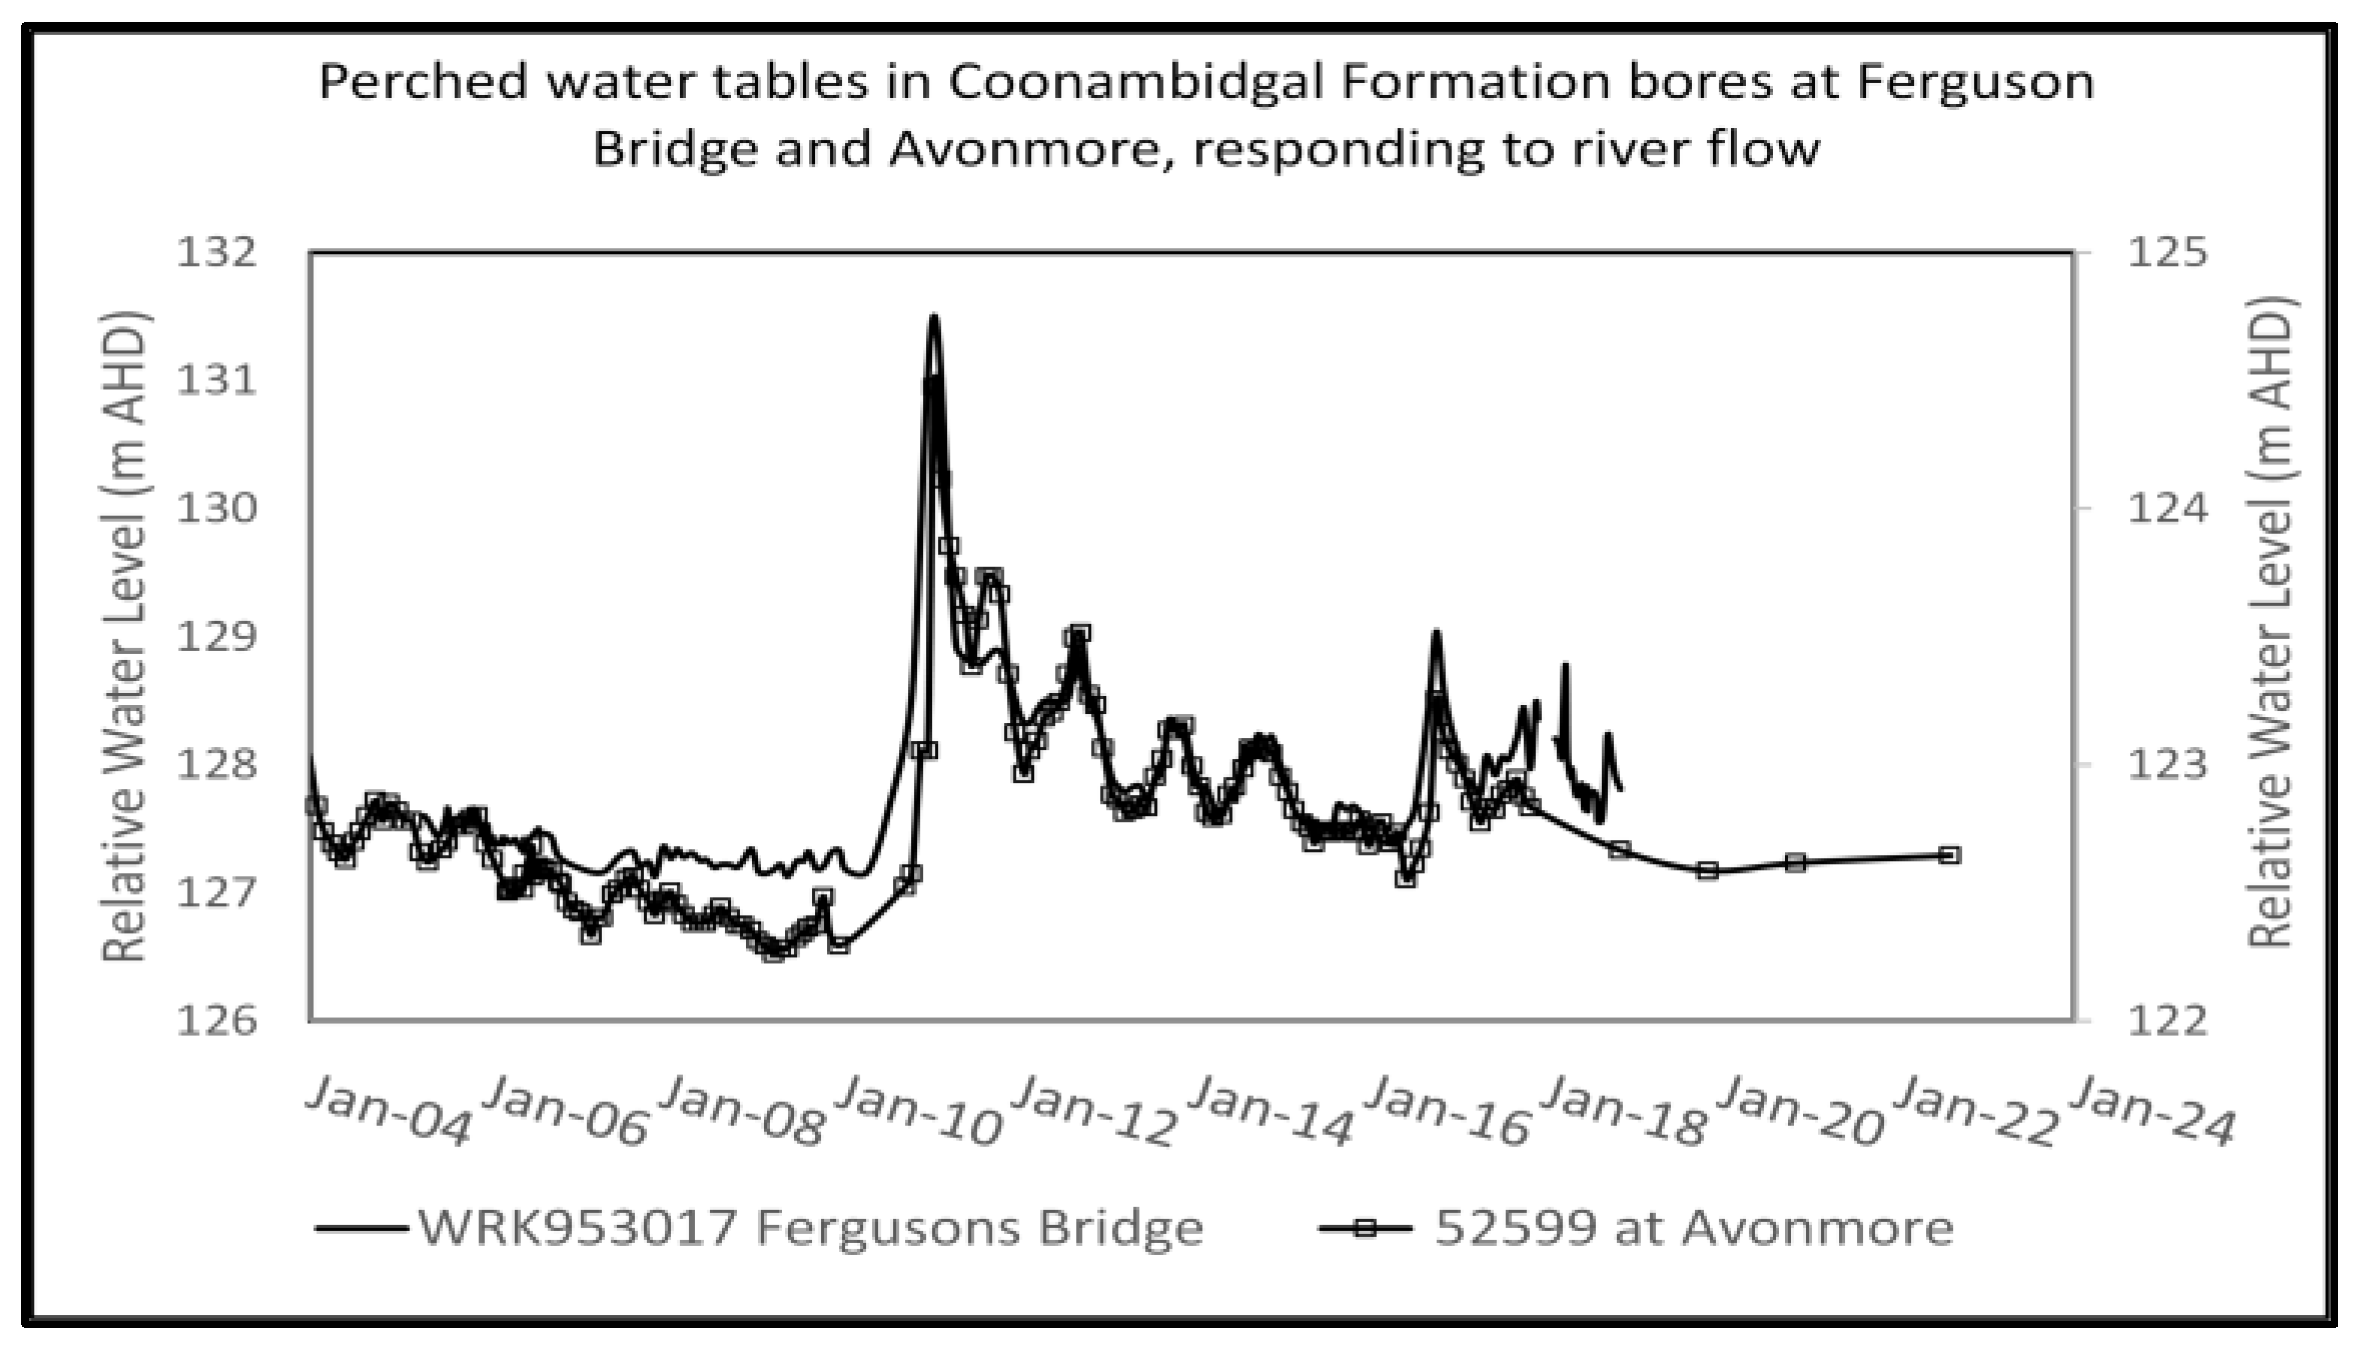
Figure 10.
Hydrographs of the Coonambidgal Formation bores WRK953017 at Fergusons Bridge and 62599 at Avonmore 4 km downstream (locality
Figure 9). Both bores are connected to the river but perched above the regional water table.
Figure 10.
Hydrographs of the Coonambidgal Formation bores WRK953017 at Fergusons Bridge and 62599 at Avonmore 4 km downstream (locality
Figure 9). Both bores are connected to the river but perched above the regional water table.
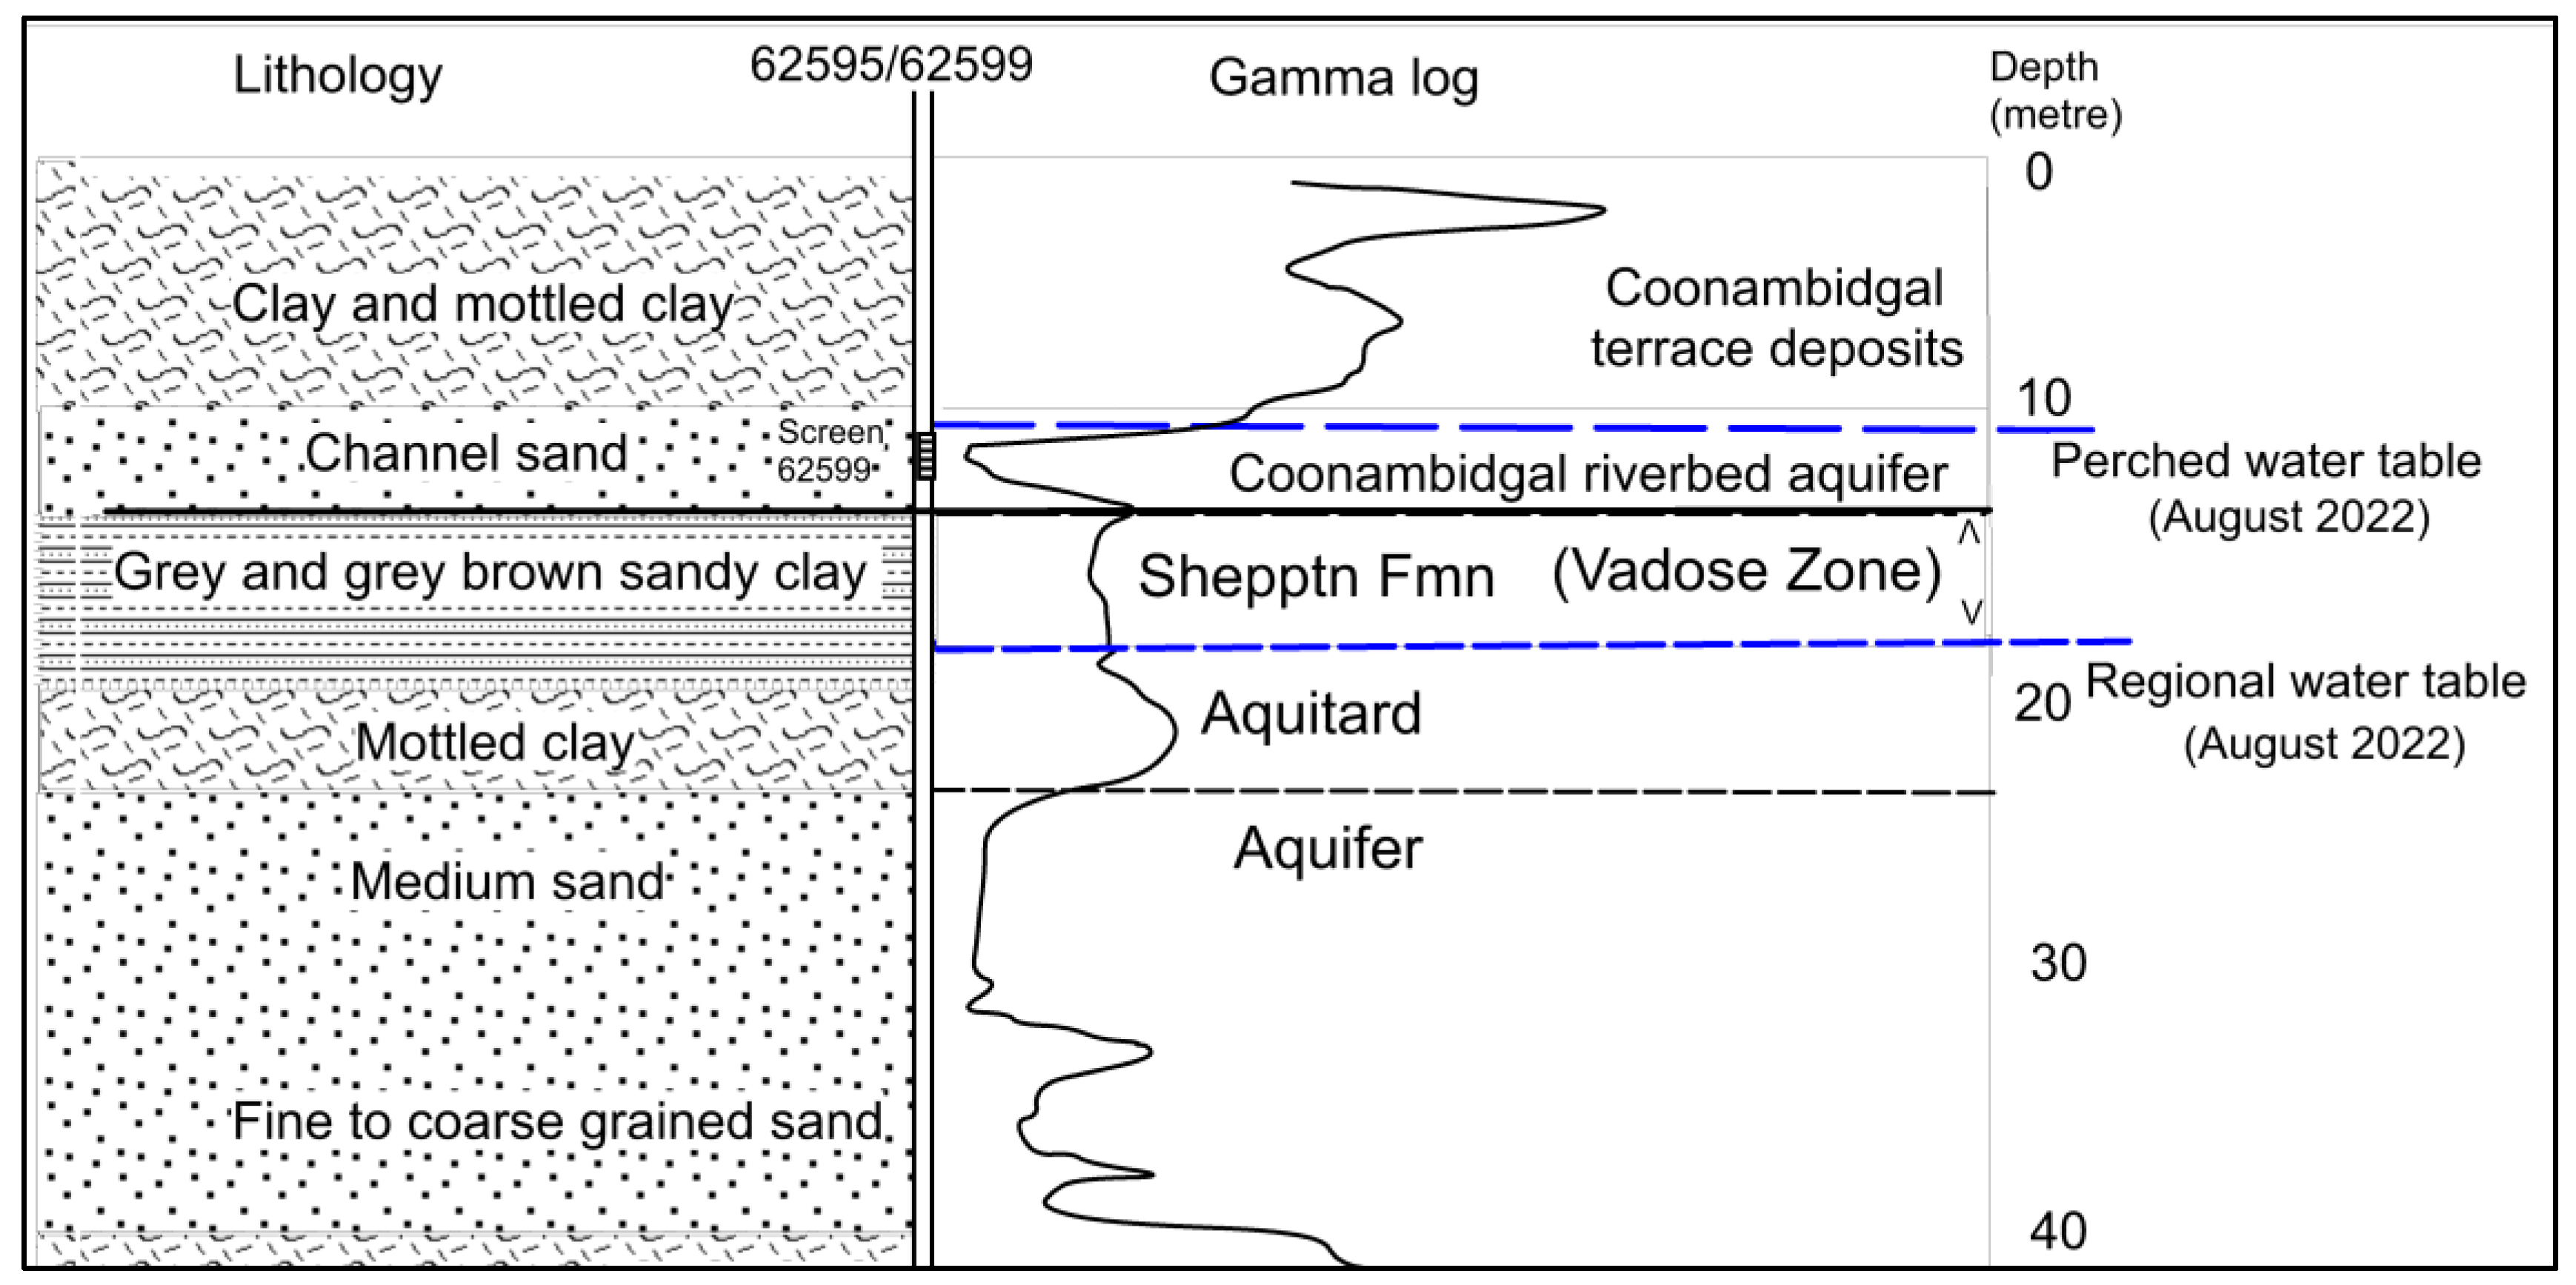
Figure 11.
Lithologic and gamma-log profiles for bore 62595 located on the Coonambidgal terrace of the Campaspe River at Avonmore showing a perched Coonambidgal Formation aquifer with a water table approximating river level and both elevated 5 m above that of the regional water table (gamma-log and lithology from Pratt [
70] and Leonard and Macumber [
66]).
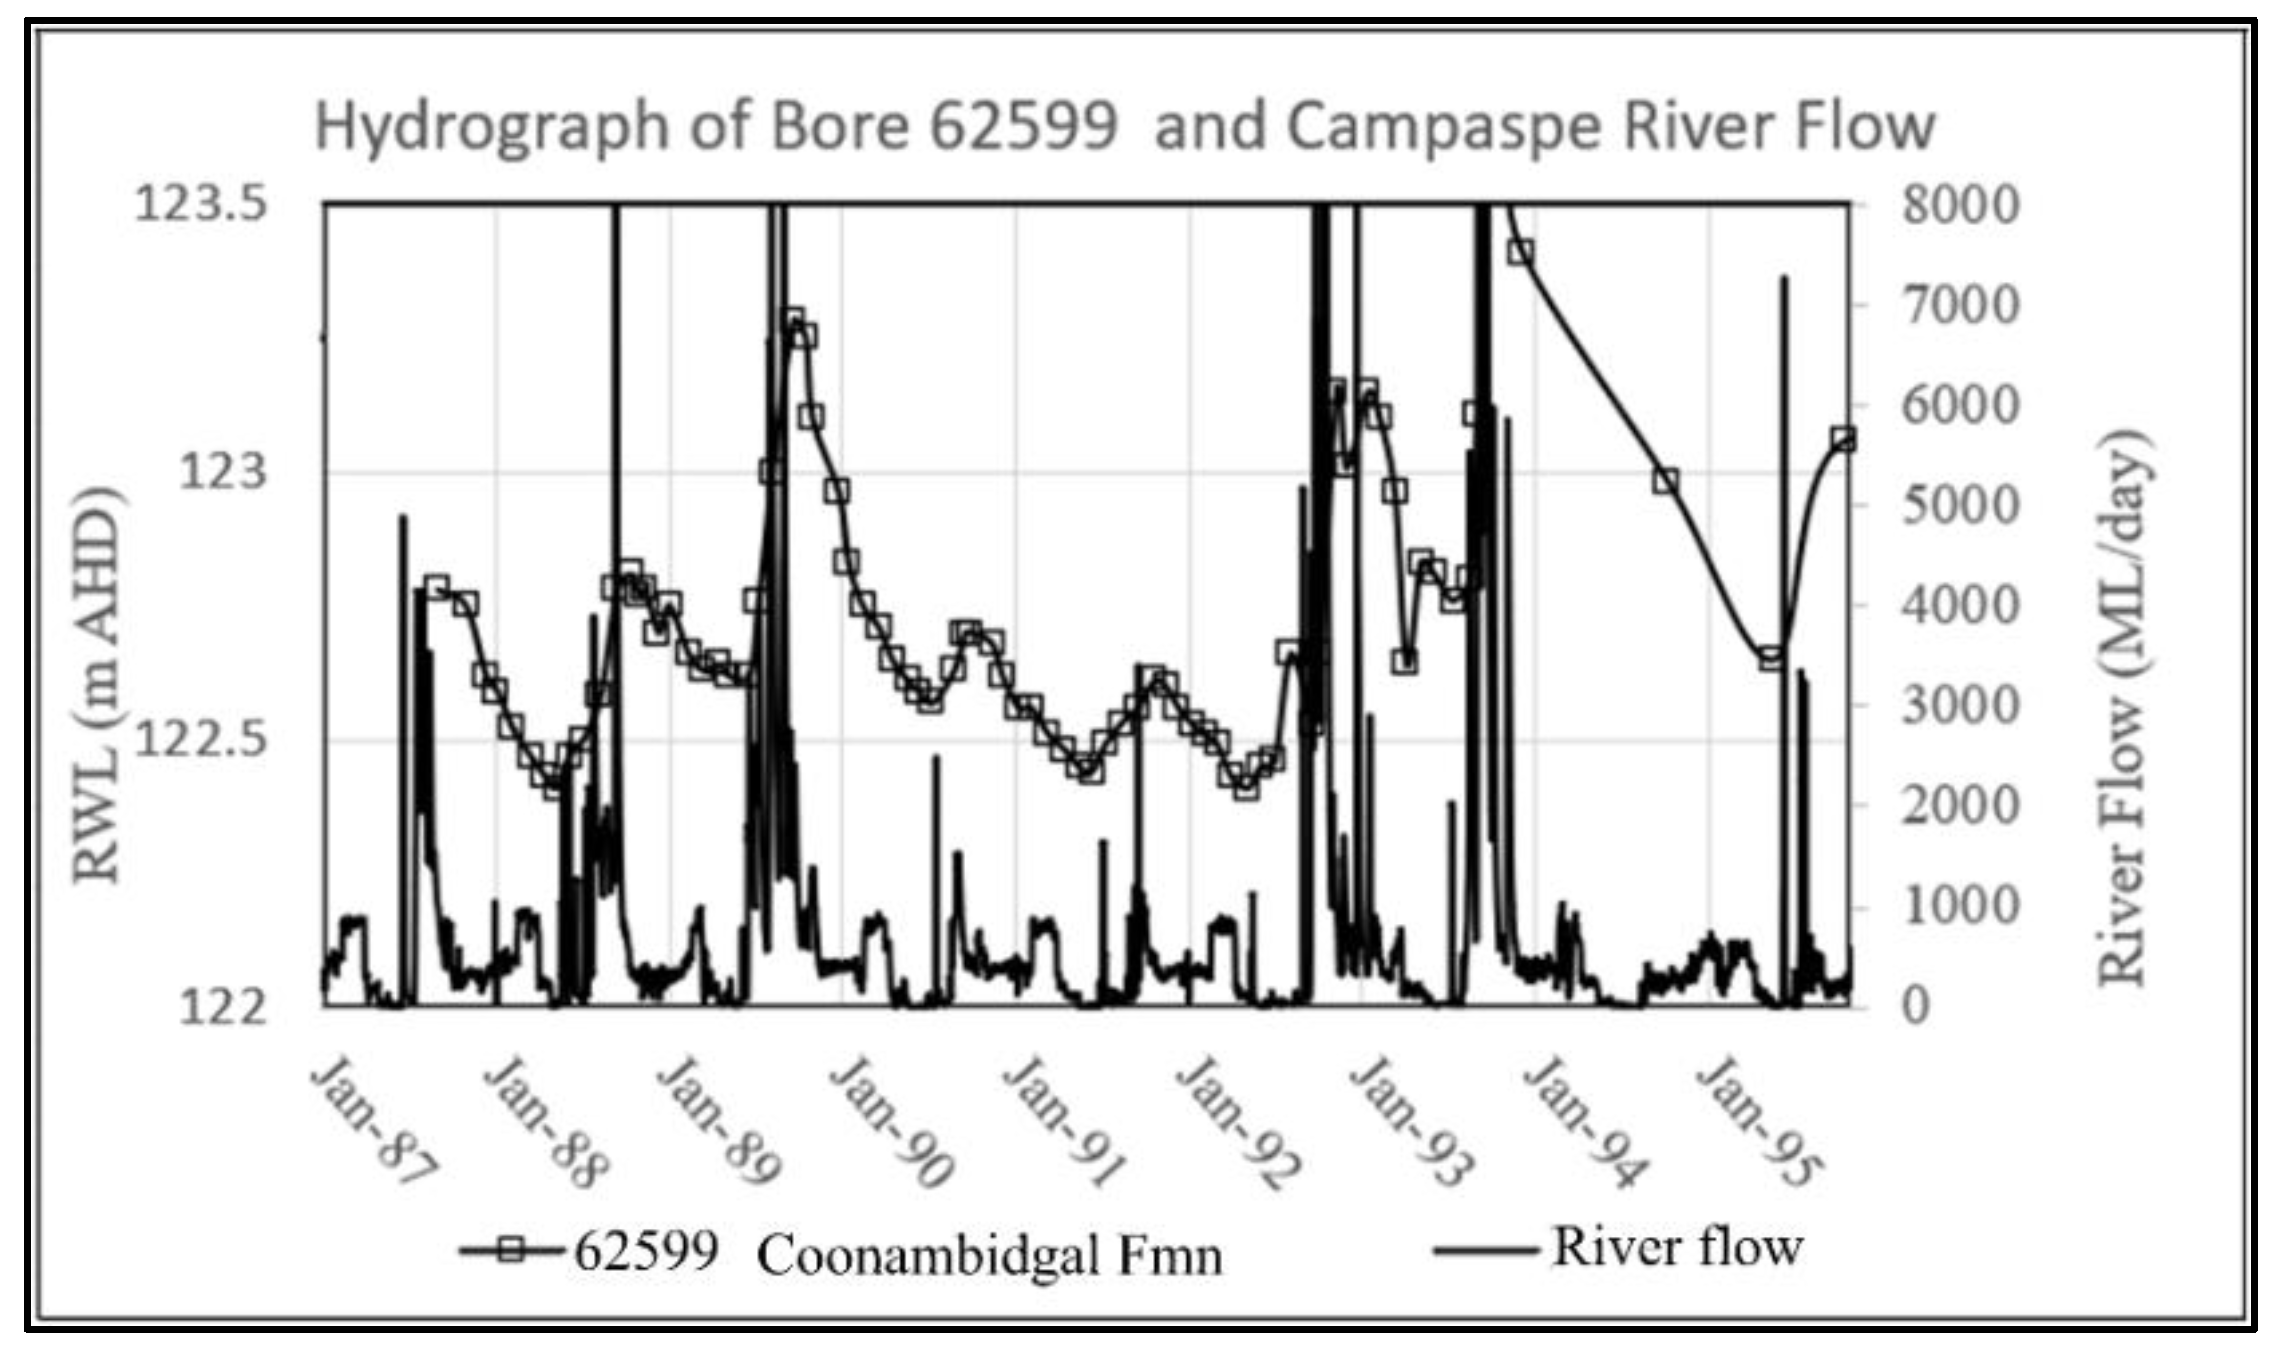
Figure 12.
Hydrograph of Coonambidgal bore 62599 at Avonmore showing its strong connection with river flow by the coincident of peaks, sharp rises and slow declines following high flow events. The aquifer is behaving like a river gauge and its level deemed to be equivalent to that of the river.
Figure 12.
Hydrograph of Coonambidgal bore 62599 at Avonmore showing its strong connection with river flow by the coincident of peaks, sharp rises and slow declines following high flow events. The aquifer is behaving like a river gauge and its level deemed to be equivalent to that of the river.
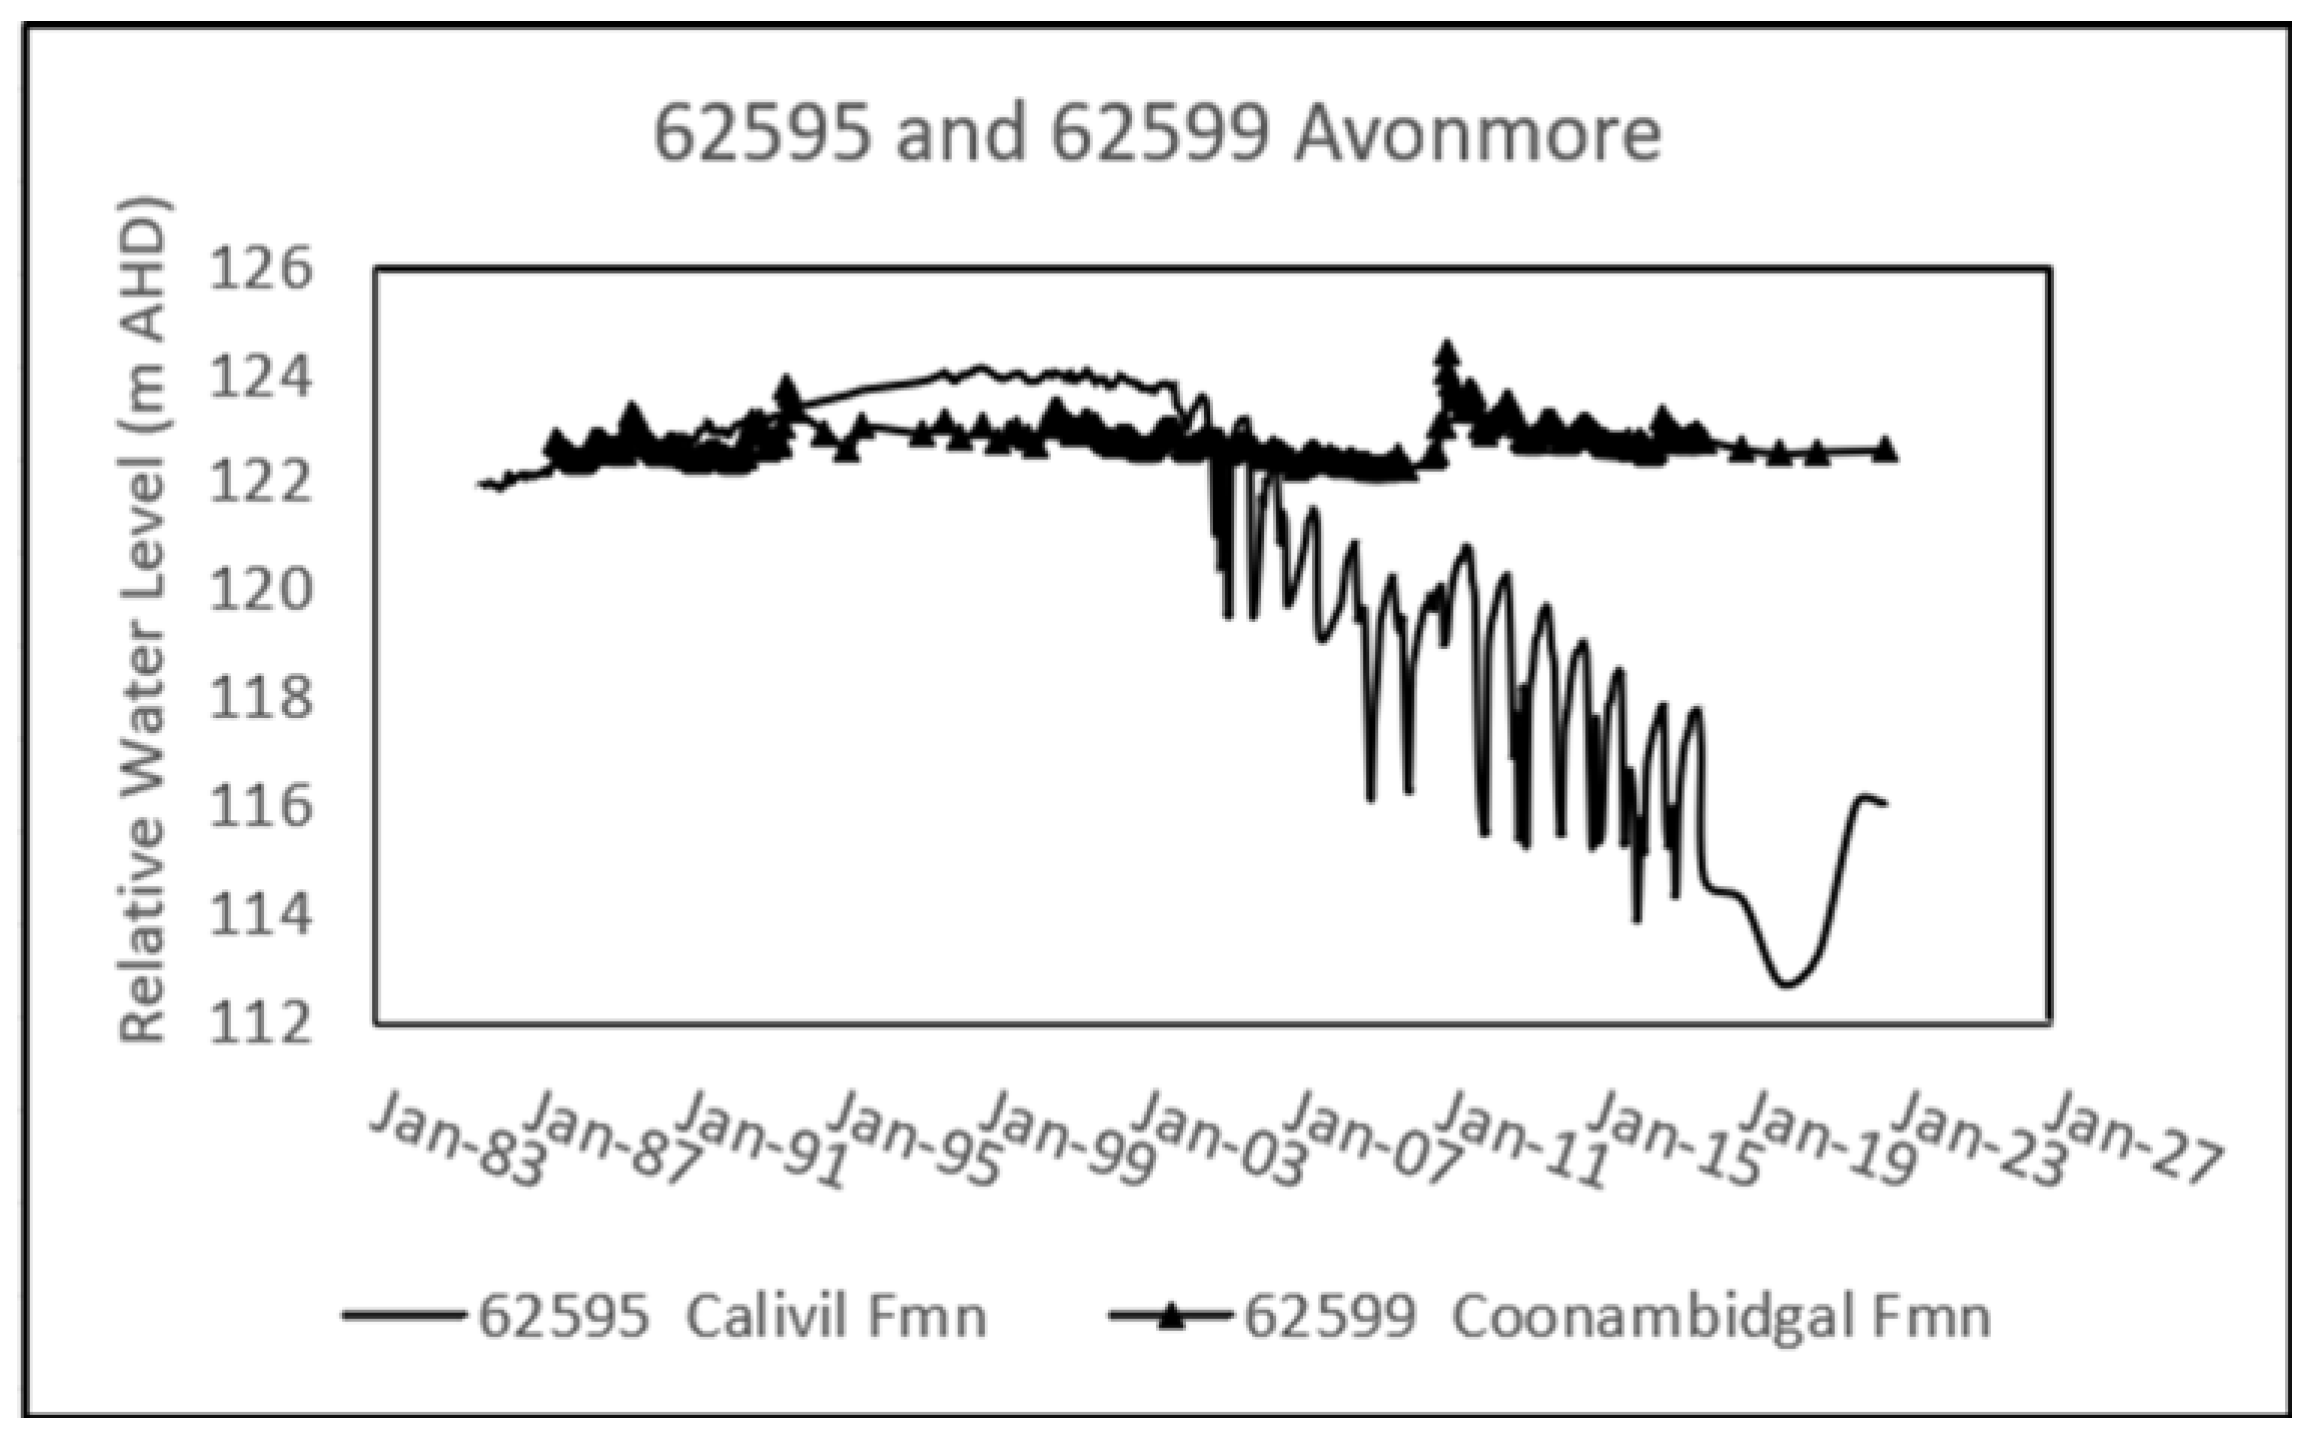
Figure 13.
Groundwater levels in the regional Calivil Formation aquifer (62595) and in the Coonambidgal riverbed aquifer (62599). The level in 62595 briefly exceed those of the Coonambidgal bore 62599, but rapidly fall away once intensive pumping commences as shown by large seasonal fluctuations. The Coonambidgal Formation and river are disconnected from the regional aquifer.
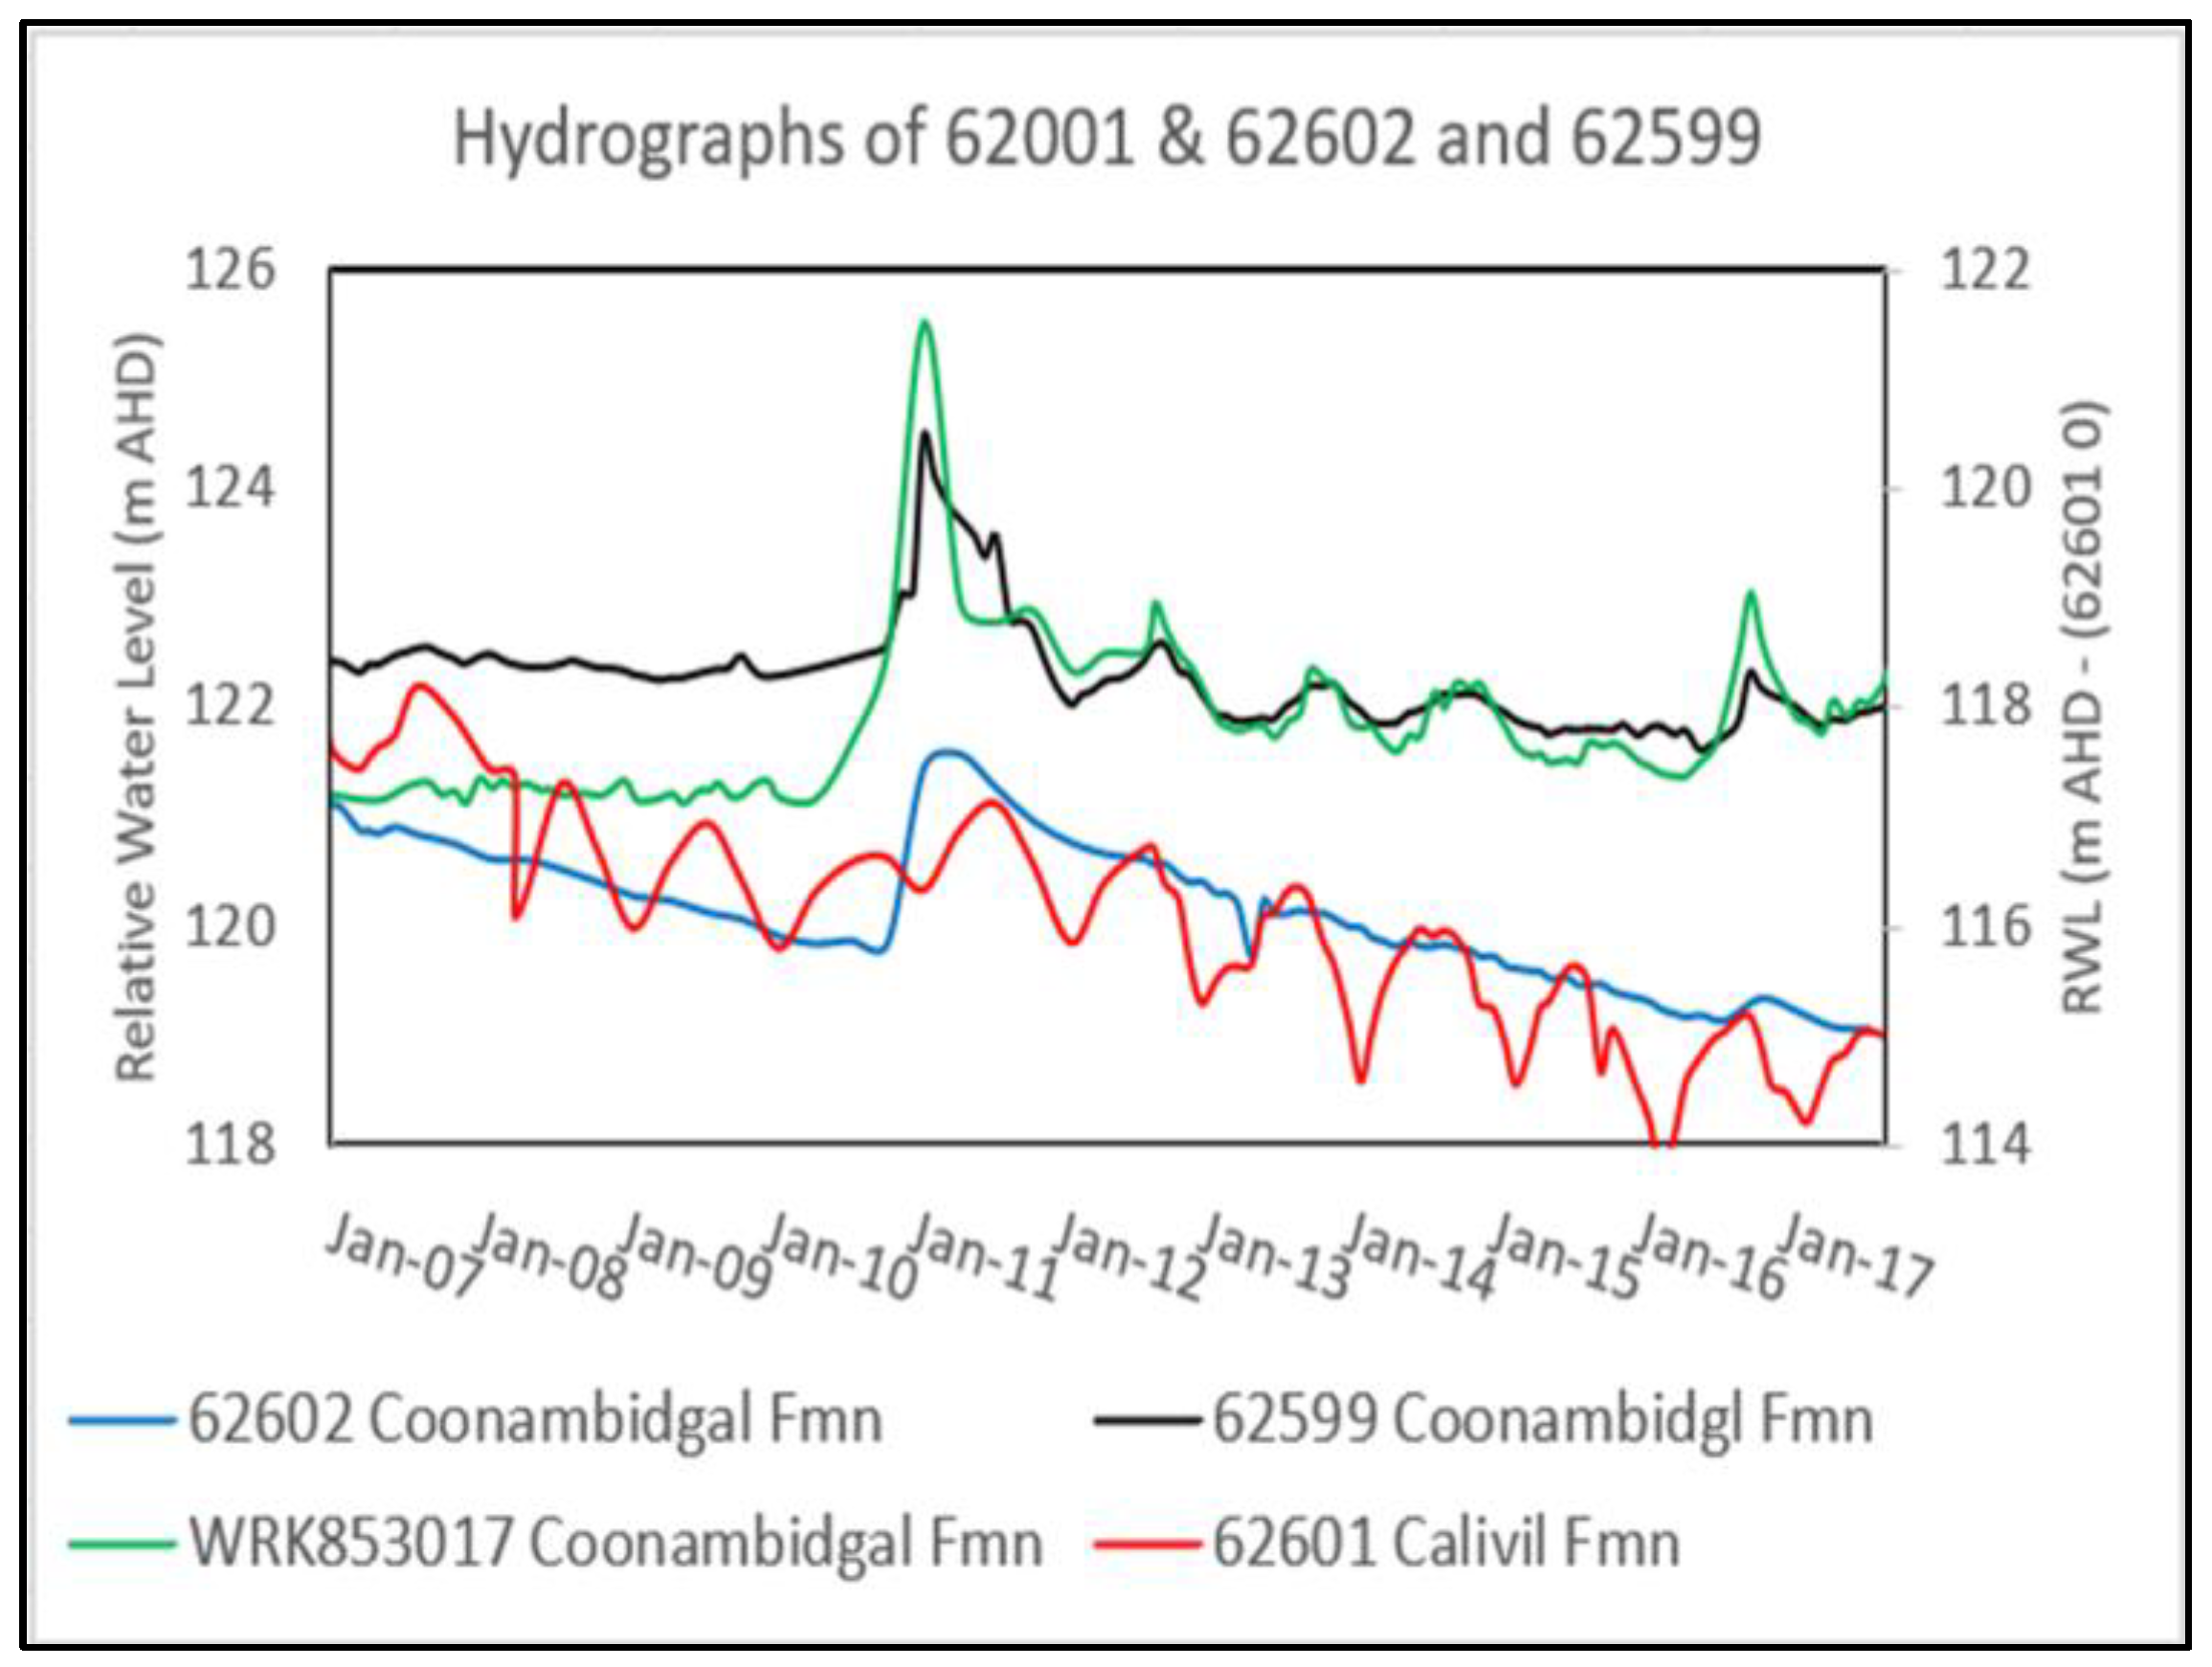
Figure 14.
Hydrographs showing the parallel fall in levels in bore 62601 to that in the Calivil Formation bore following regional trends, while disconnected bores 62599 and WRK853017 bores remain unaffected, being only influenced by river flow. To enable comparisons, 6 m has been removed to the levels of upstream bore WRK8530174.
Figure 15.
Connection across the entire saturated aquifer system shown by the sympathetic fall in levels from the shallow aquifer and water table to the Calivil Formation in response to pumping. Left. Type 1 response in non-irrigated and Right. Type 2 response in irrigated regions of the Campaspe Fan with return flow recharge [
40].
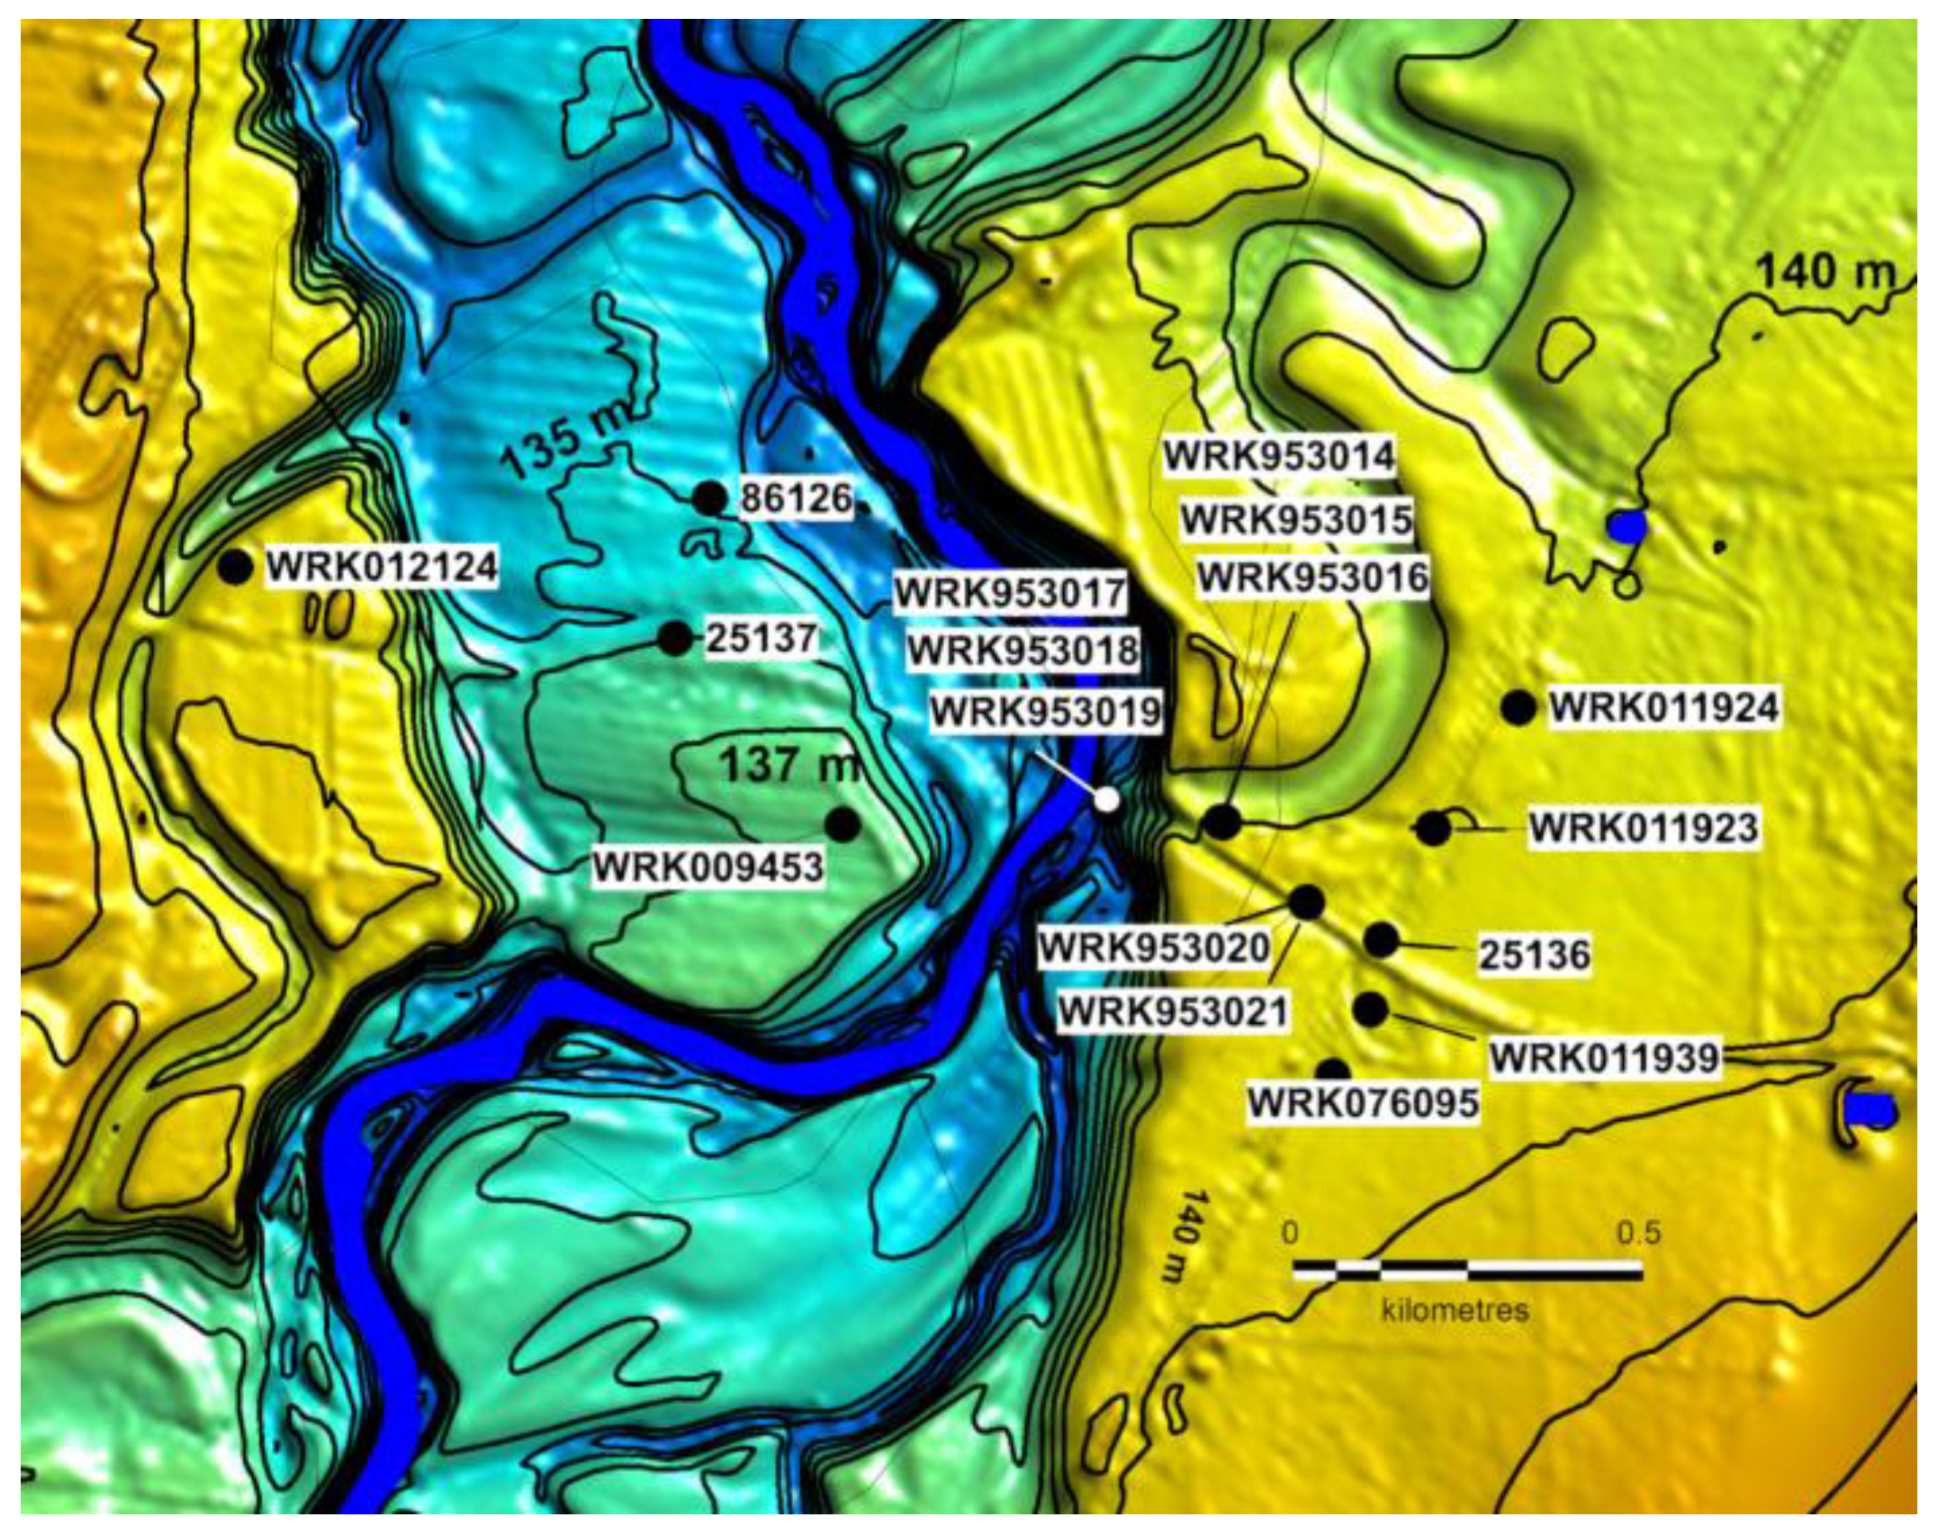
Figure 16.
Distribution of Coonambidgal Formation and the Shepparton Formation Plain at Fergusons Bridge. The WRK953017-19-18 piezometer nest is located alongside the river. Meanders of the earliest ancestral river phase occur lateral to the main AR2 terrace. 1 m contours (vicmap-elevation-dem-10 m–mod.).
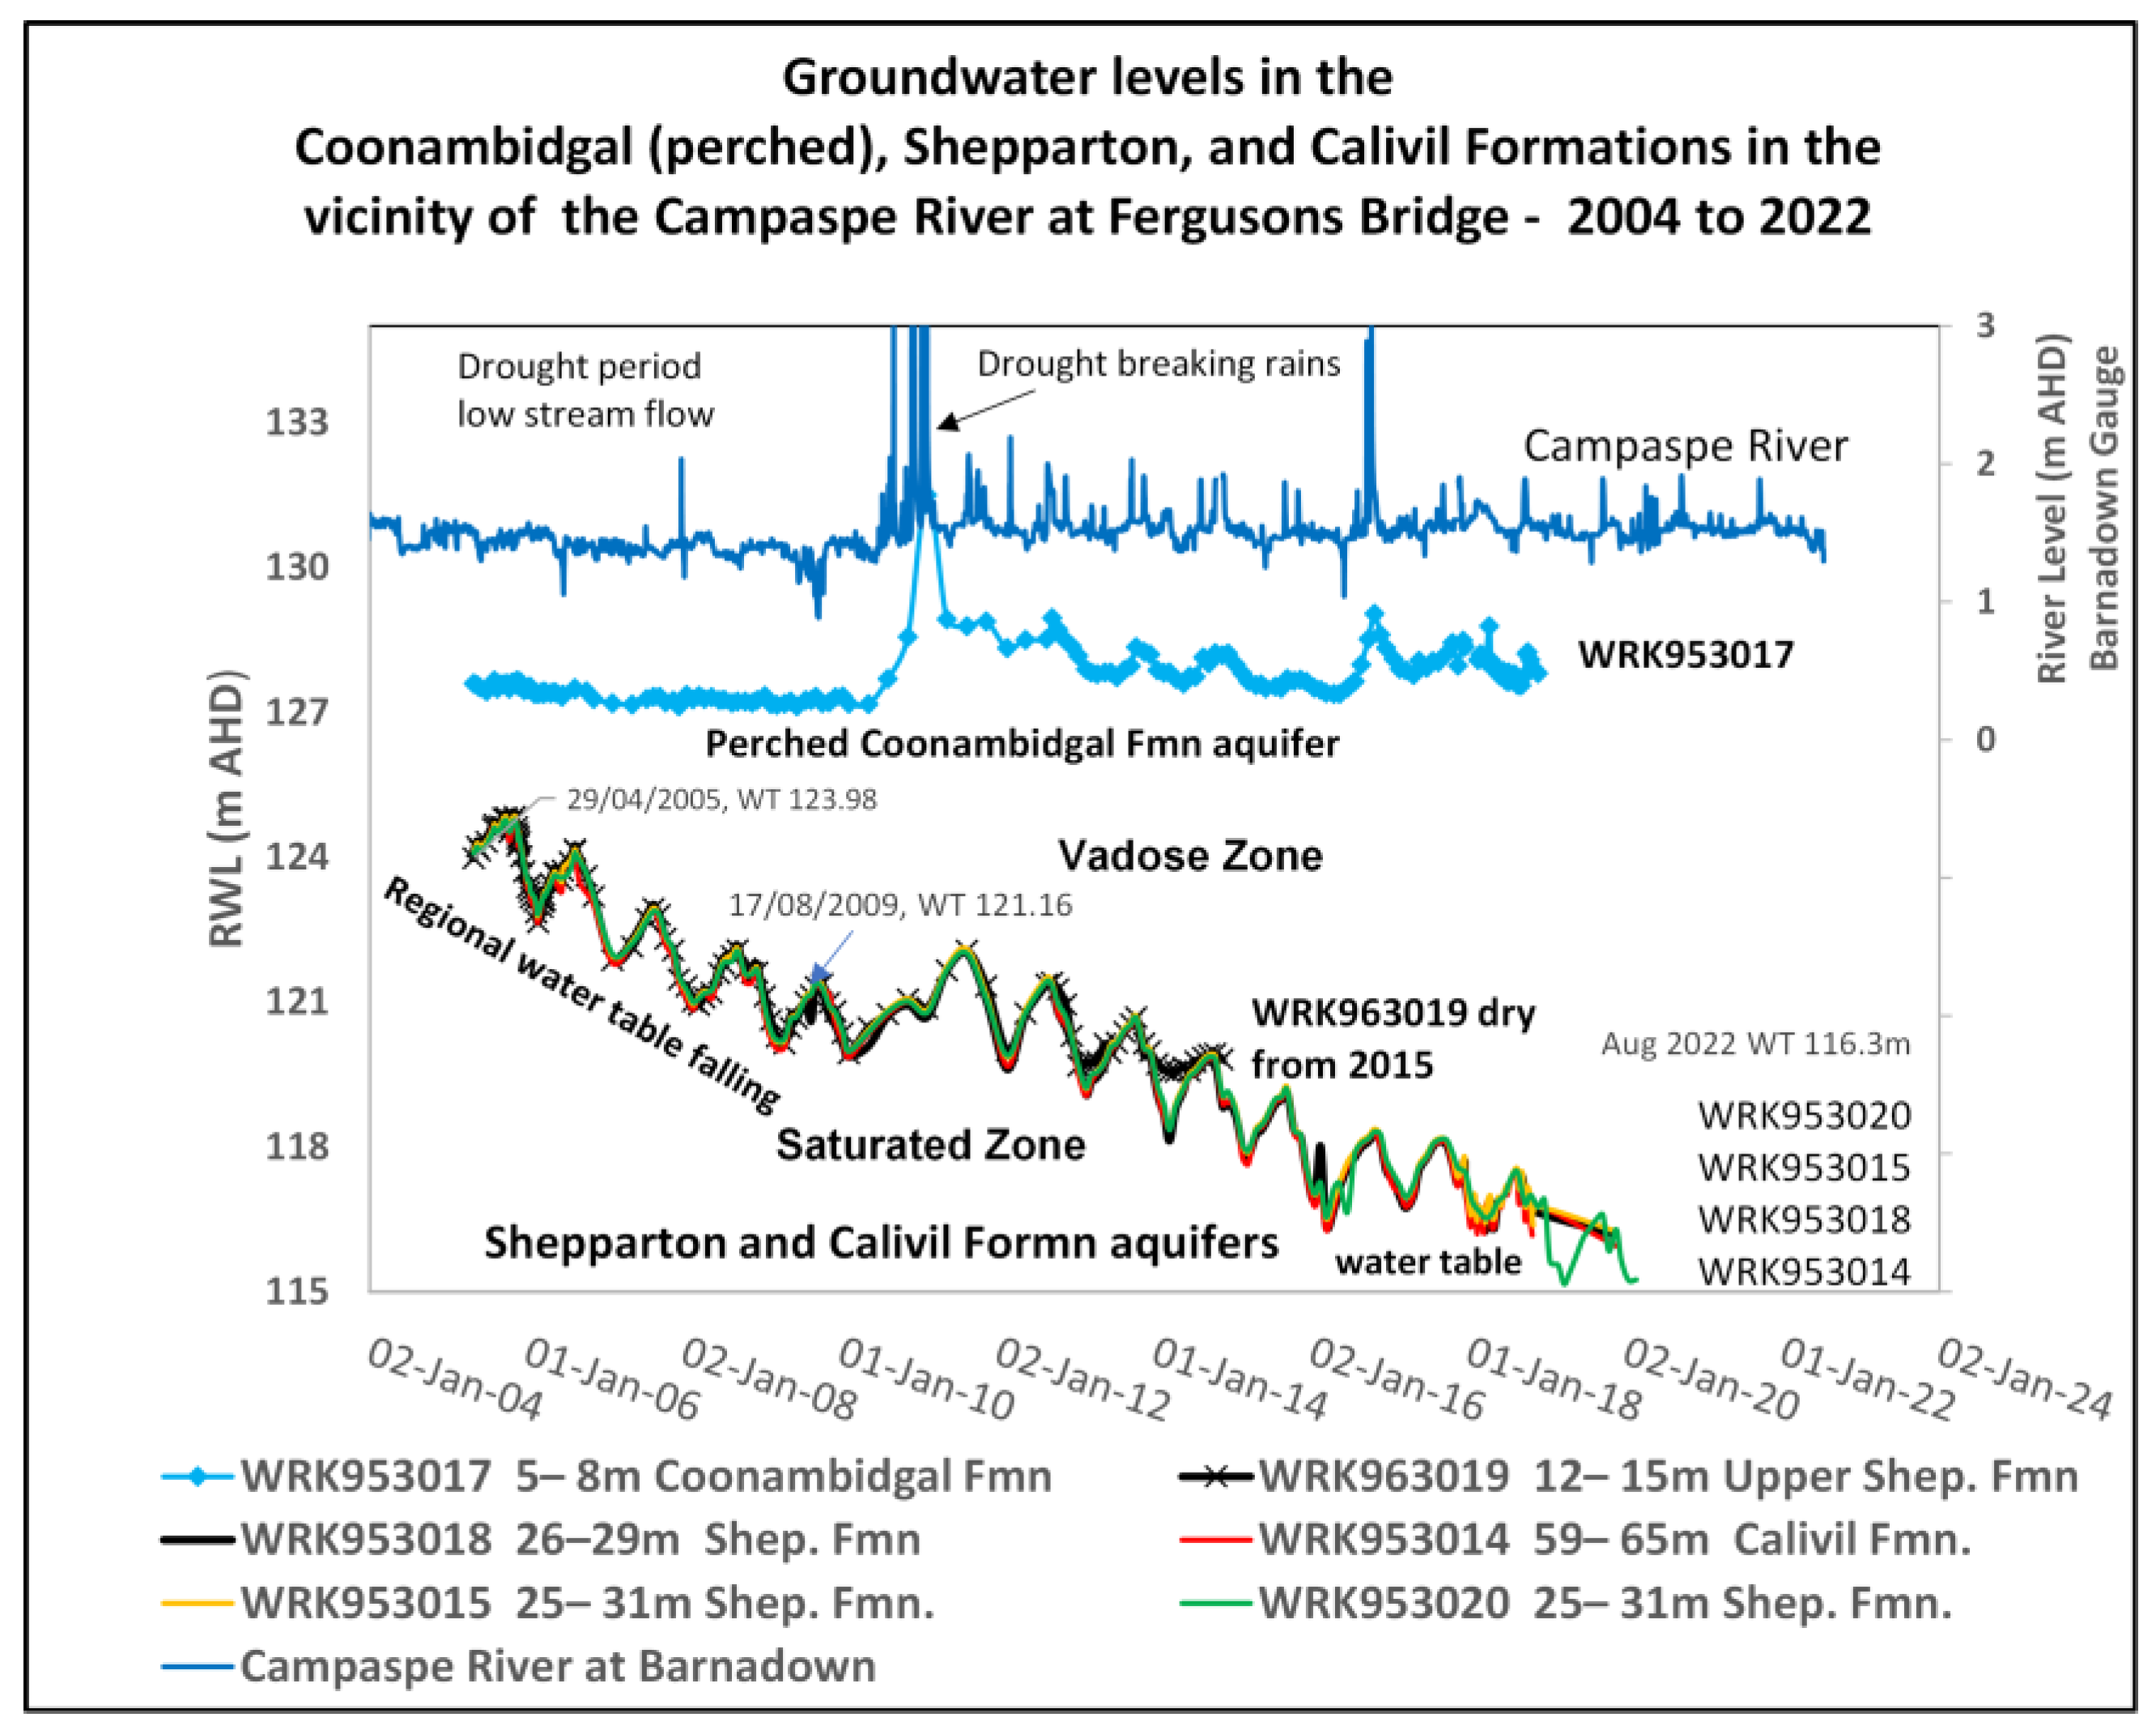
Figure 17.
Groundwater levels in piezometer nests in the vicinity of Fergusons Bridge. The WRK953017, 18 and 19 nest is located on the Coonambidgal terrace alongside the Campaspe River. Other bores are located on the Shepparton Formation nearby. The Coonambidgal bore WRK953017 does not respond to the falling levels in the Shepparton and Calivil aquifers but echoes the Campaspe River flow with spikes in 2011 and 2017. Bore WRK963019 went dry in 2015 as the water table fell and now lies within the expanding vadose zone.
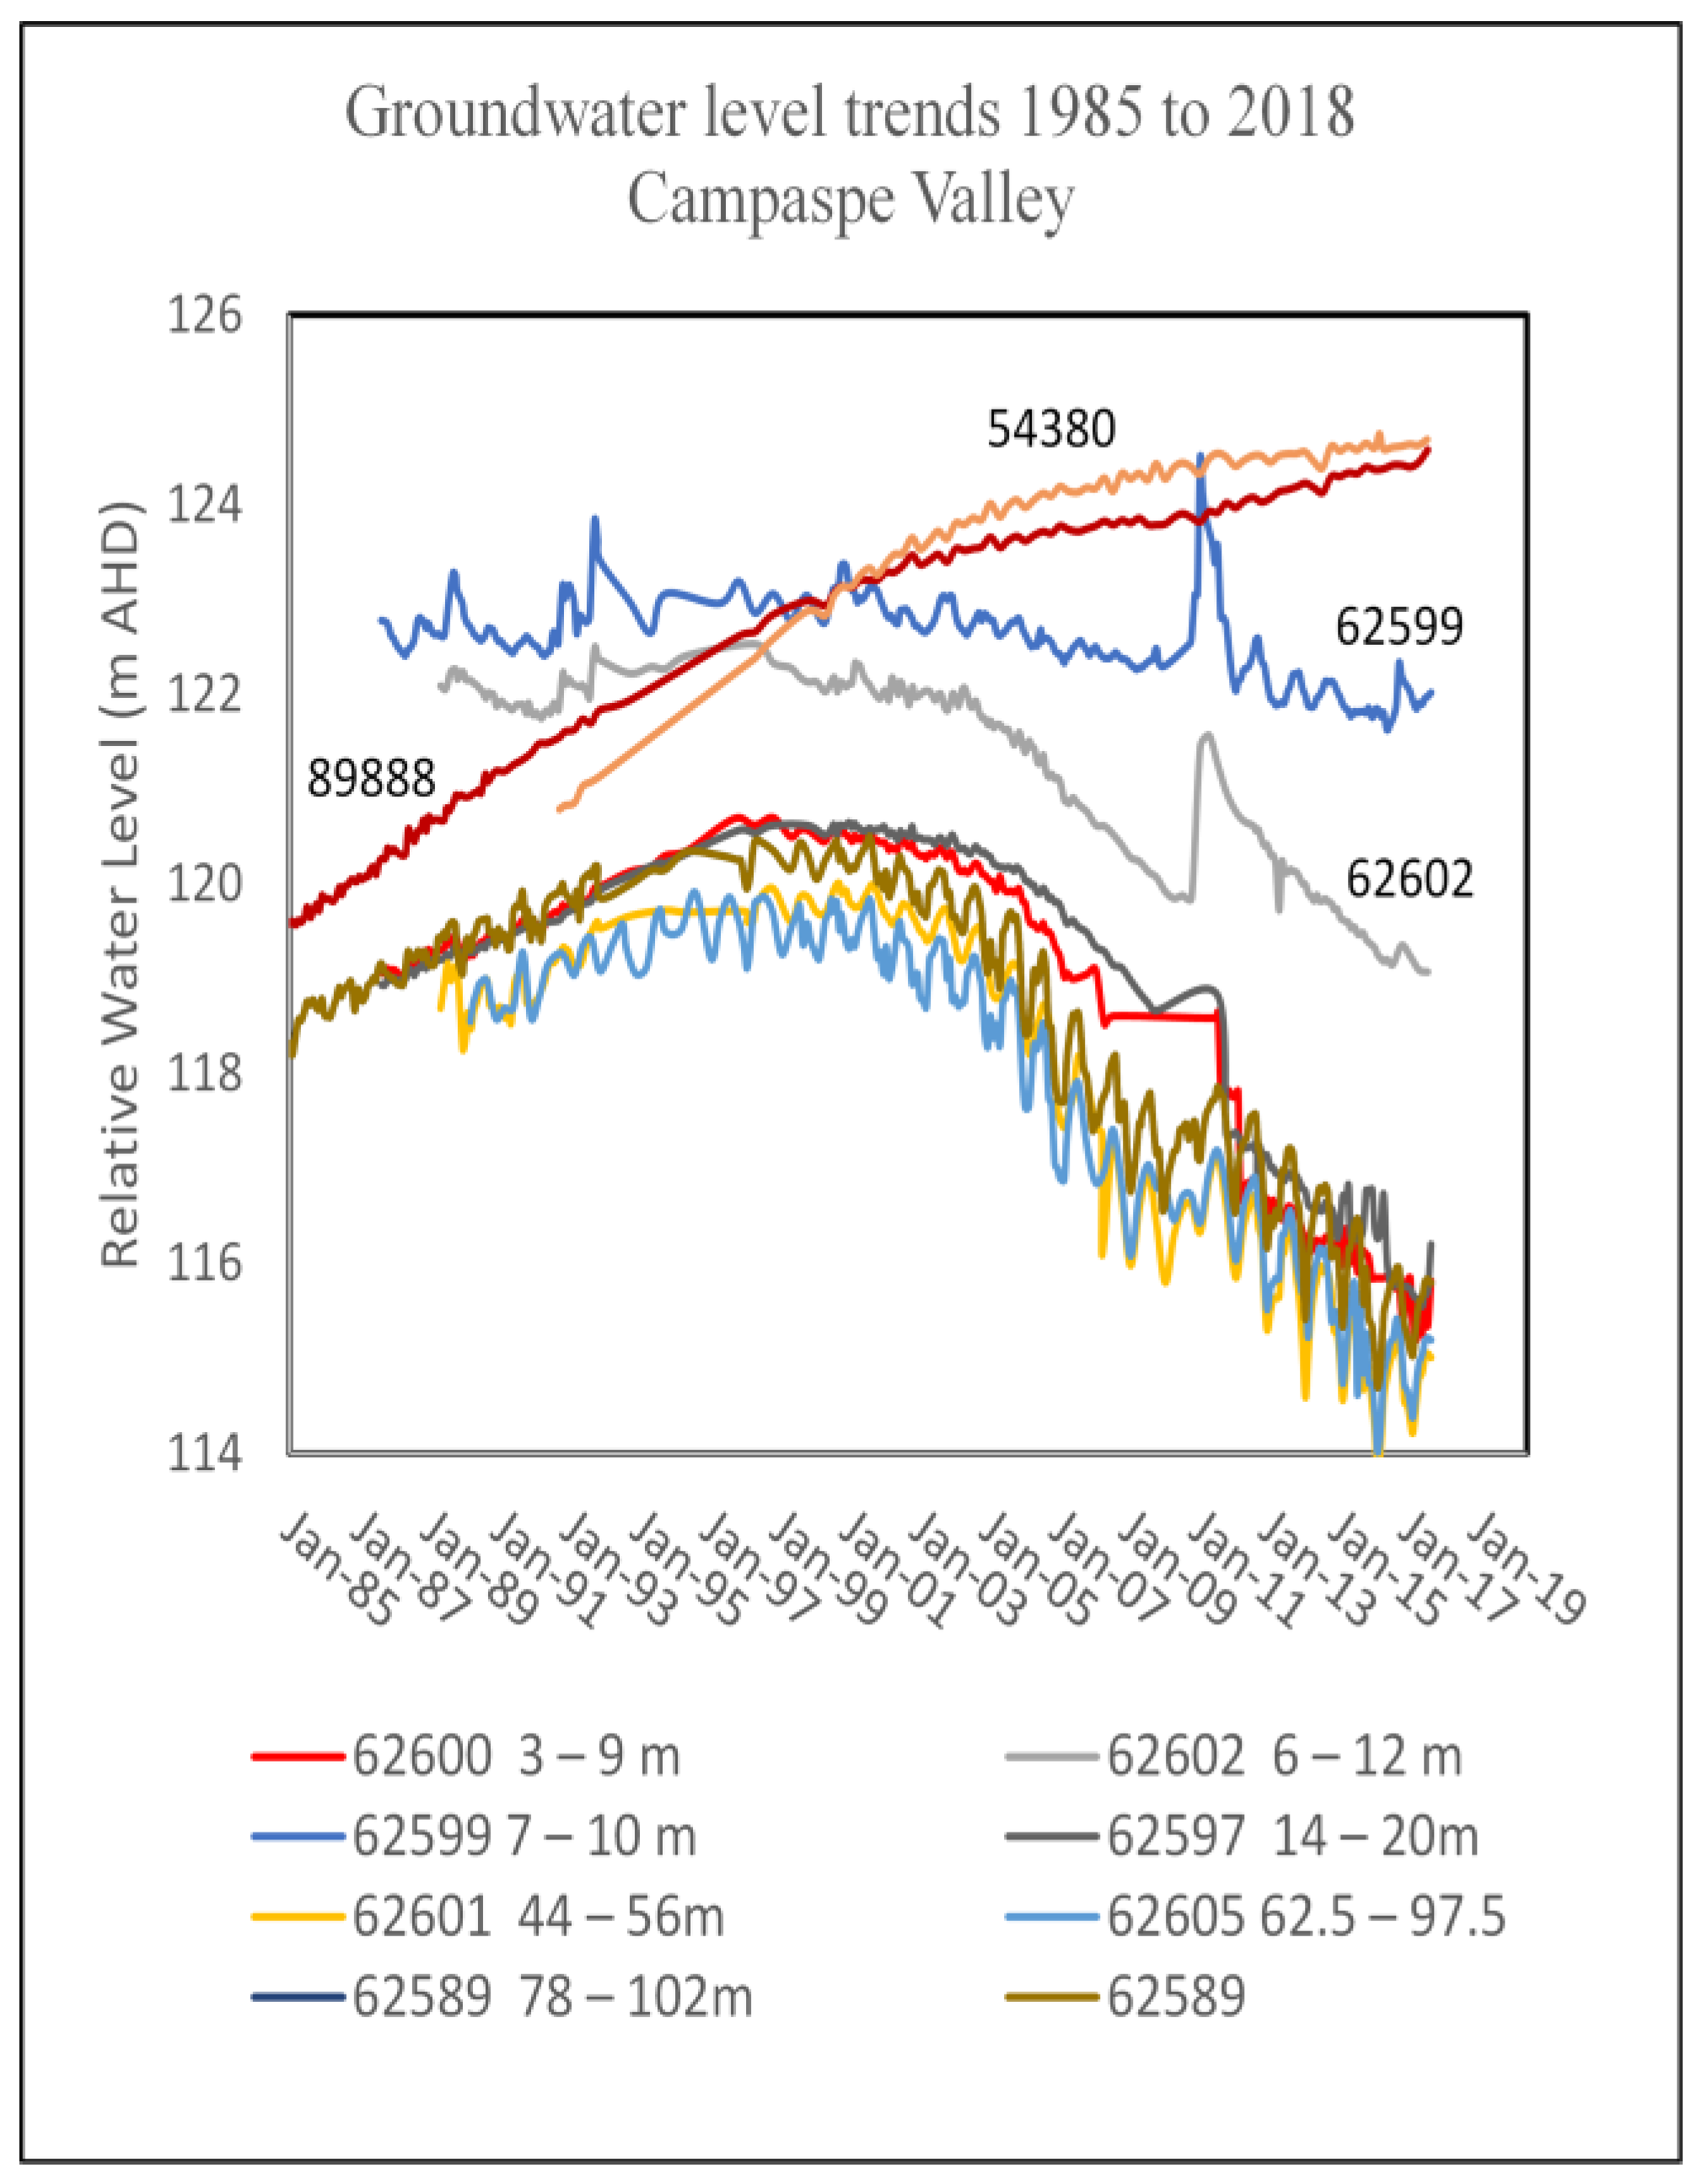
Figure 18.
Groundwater trends showing the rise and fall of regional groundwater levels across the Campaspe Valley between Barnadown and Elmore since 1985.
Figure 18.
Groundwater trends showing the rise and fall of regional groundwater levels across the Campaspe Valley between Barnadown and Elmore since 1985.
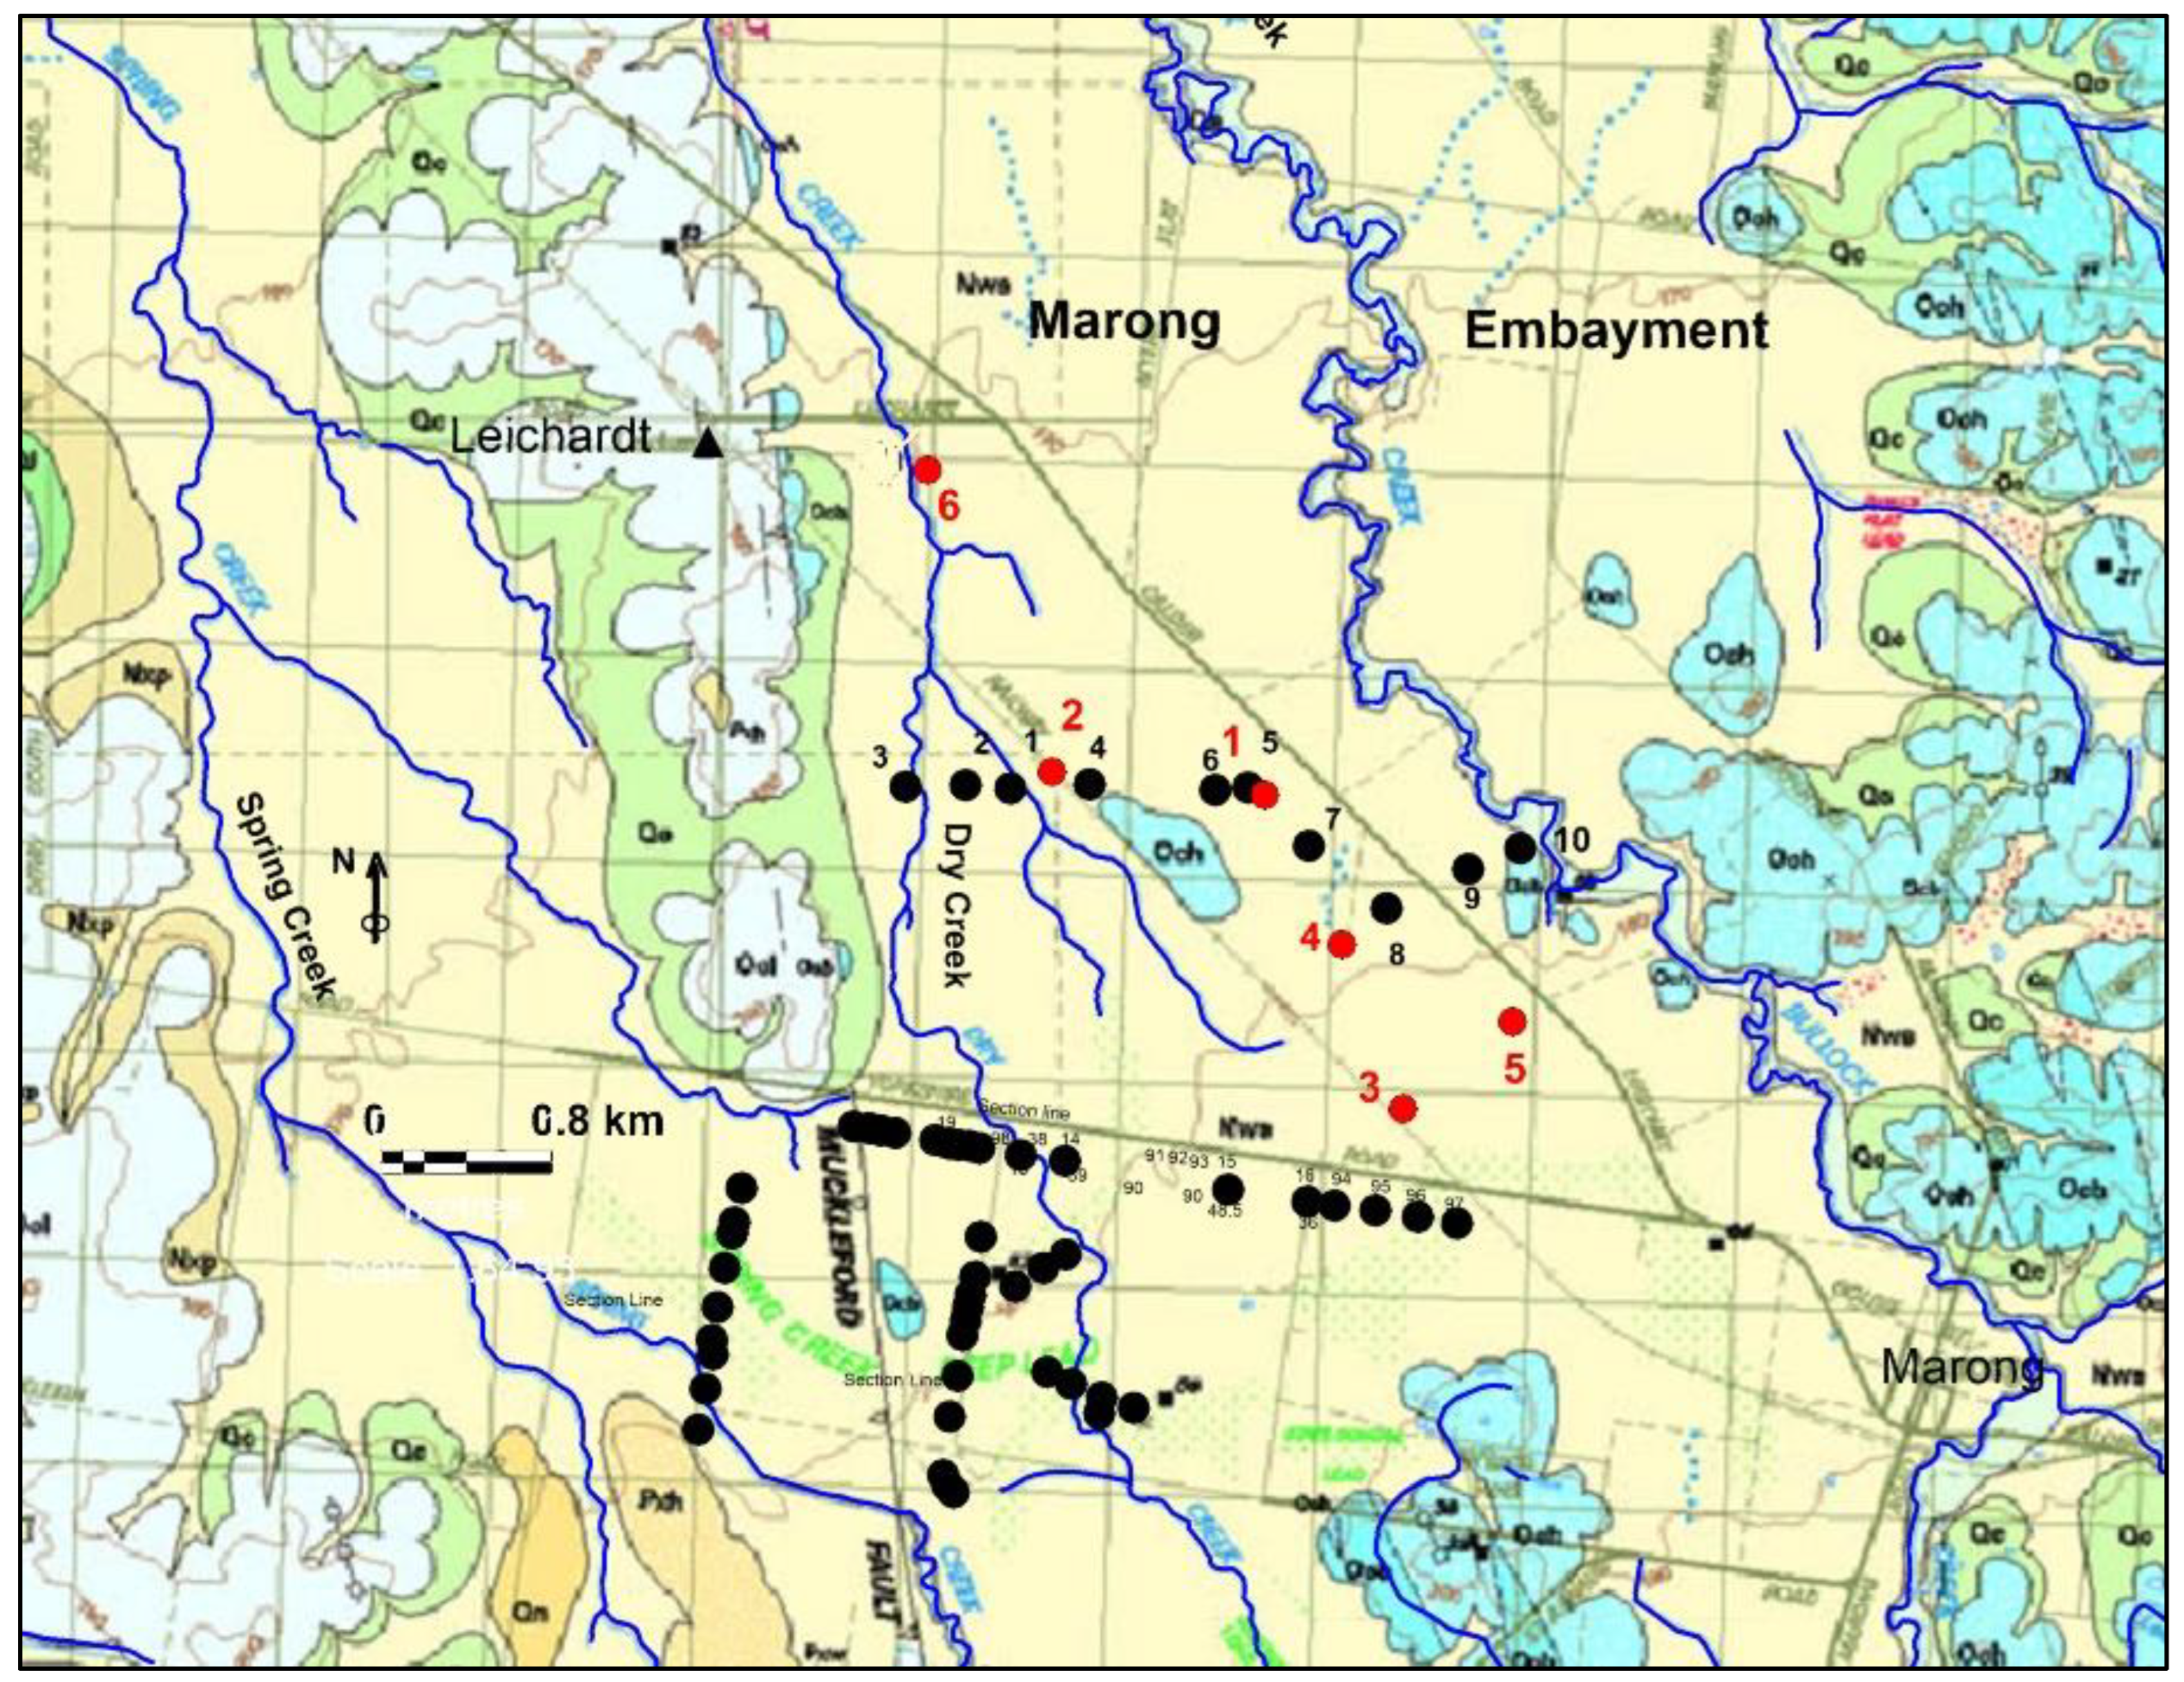
Figure 19.
Bullock Creek flows across a small embayment in the highland front formed by outcropping Ordovician sediments. The section lines shown are of boreholes drilled between 1904 and 1907 which provide lithology, groundwater levels and salinity data at the time. The northern line is numbered 1 to 10. Red dots are bores from recent drilling in 2011, numbered 1 to 6.
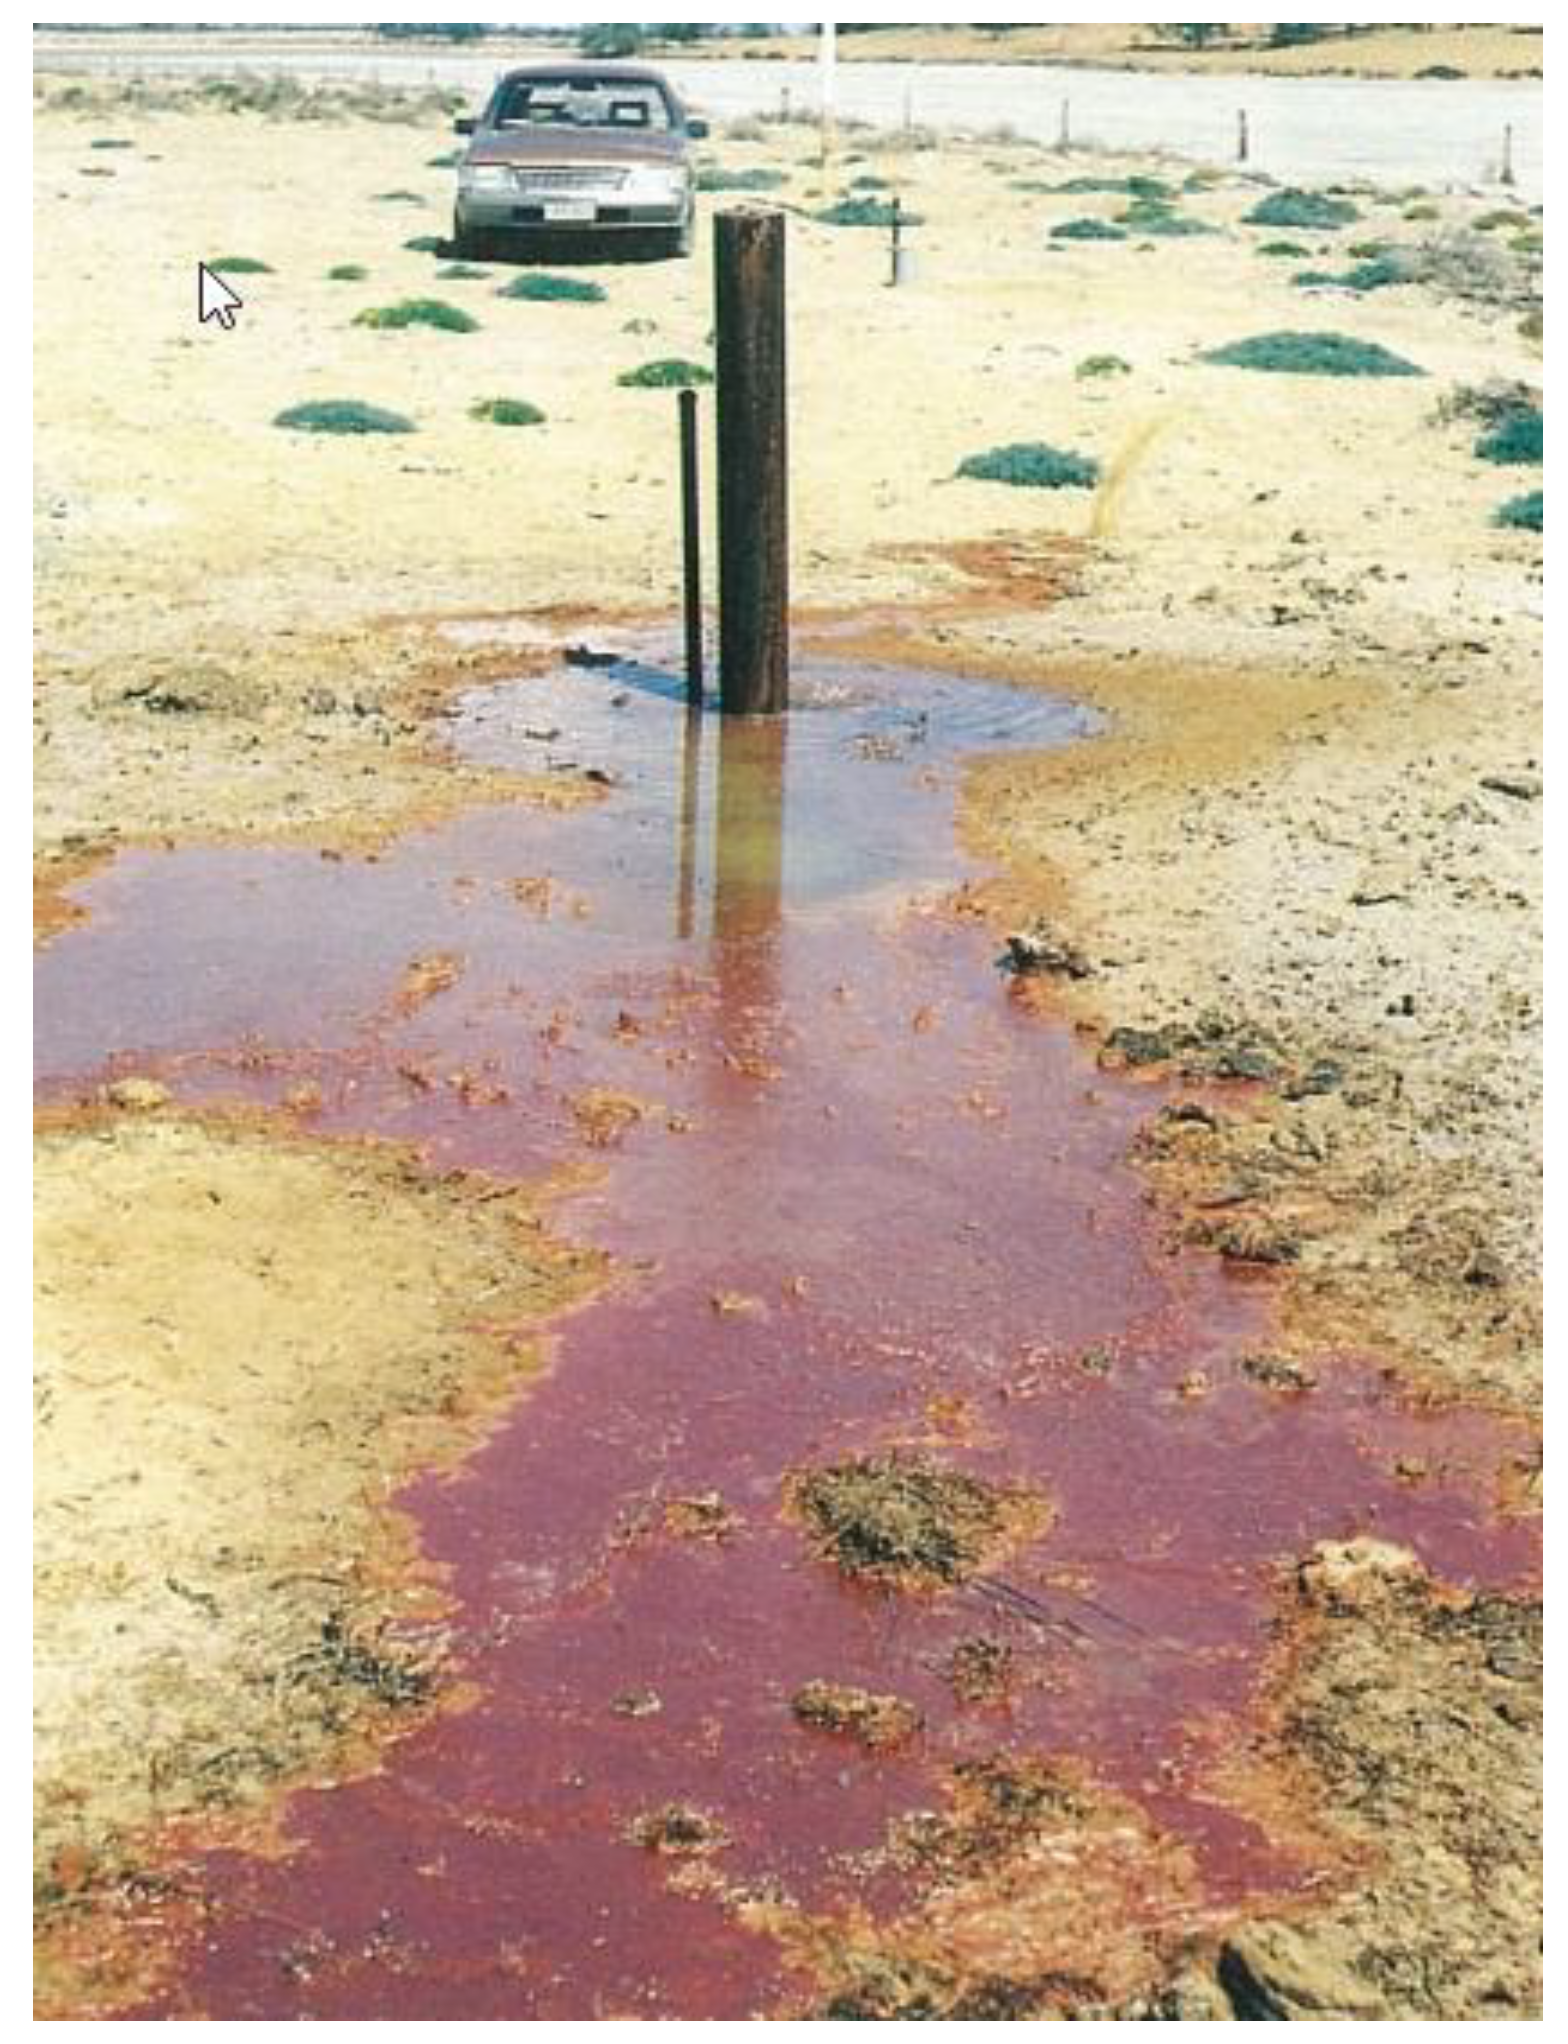
Figure 20.
Iron-trich groundwater flowing from an artesian bore in NW Victoria. The previously white plastic standpipe is iron encrusted, attesting to the rapidity of iron clogging [
8].
Figure 20.
Iron-trich groundwater flowing from an artesian bore in NW Victoria. The previously white plastic standpipe is iron encrusted, attesting to the rapidity of iron clogging [
8].
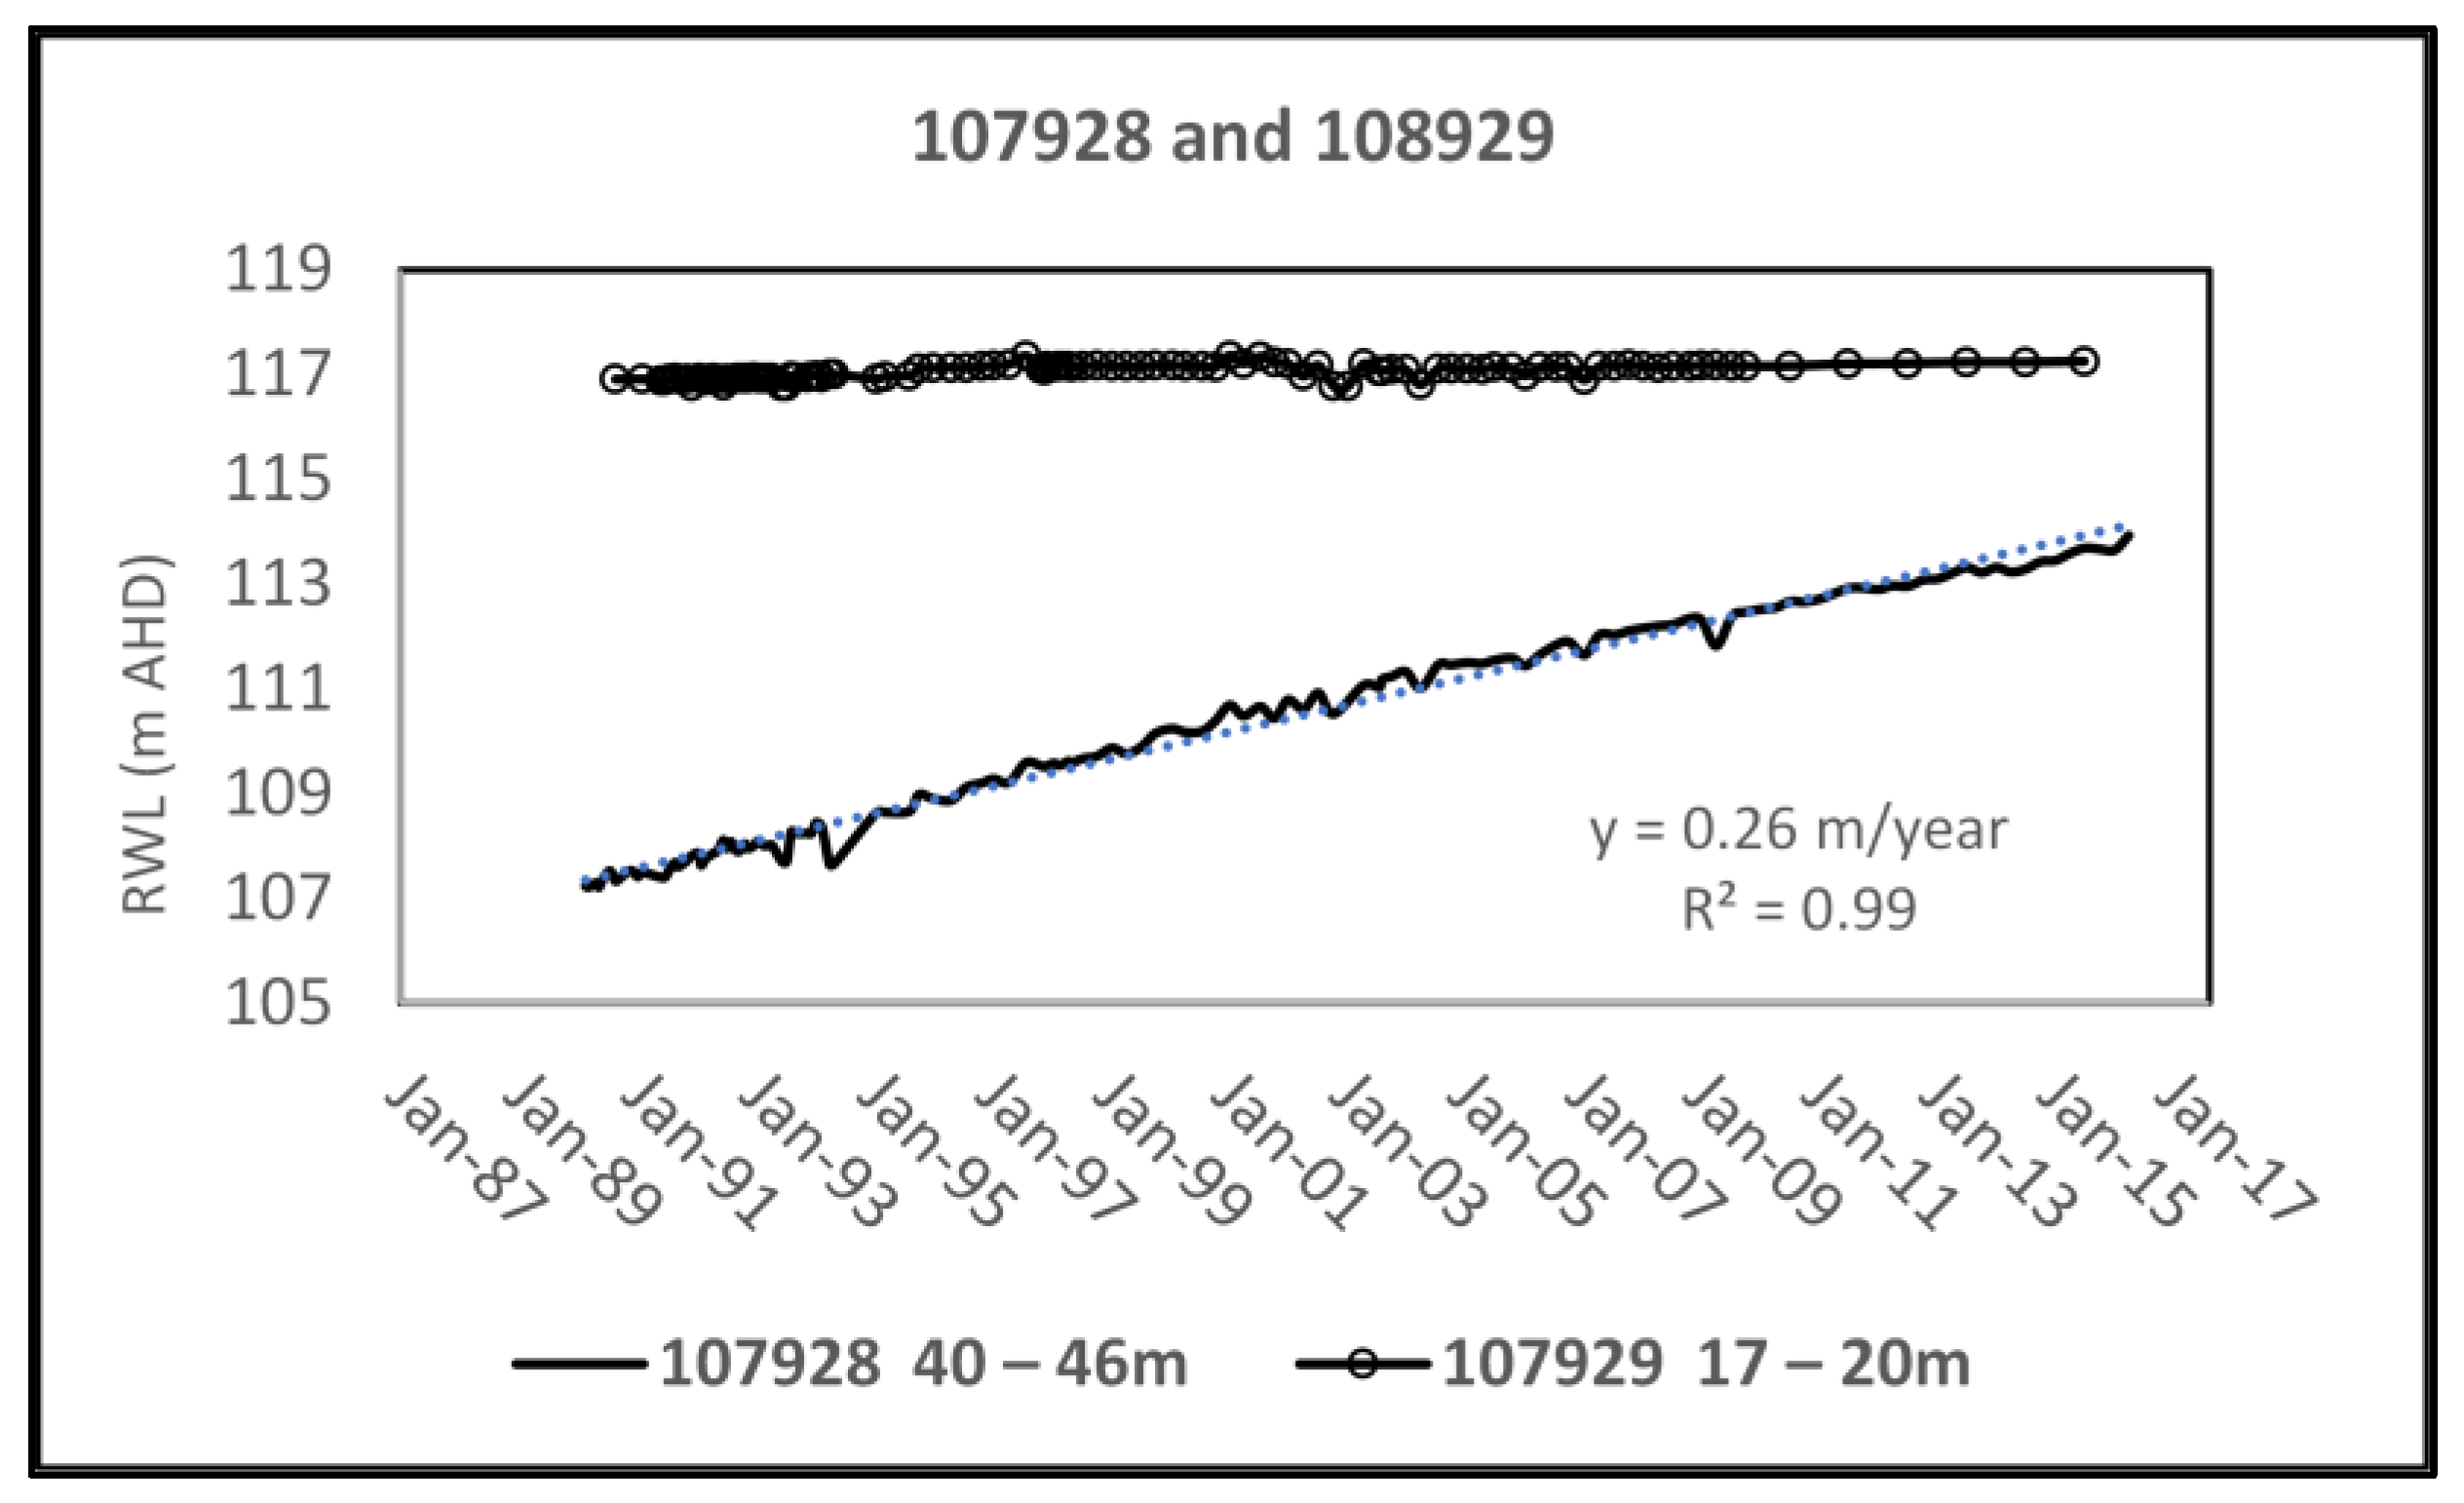
Figure 21.
Hydrograph of Bores in 107928 and 107929 piezometer nest, screened from 40–46 m at the base of the alluvial fill and from a 1 m sand bed continued to rise at 0.26 m/y. Bore 107929 is perched within a 1 m thick sand lens in the vadose zone.
Figure 21.
Hydrograph of Bores in 107928 and 107929 piezometer nest, screened from 40–46 m at the base of the alluvial fill and from a 1 m sand bed continued to rise at 0.26 m/y. Bore 107929 is perched within a 1 m thick sand lens in the vadose zone.
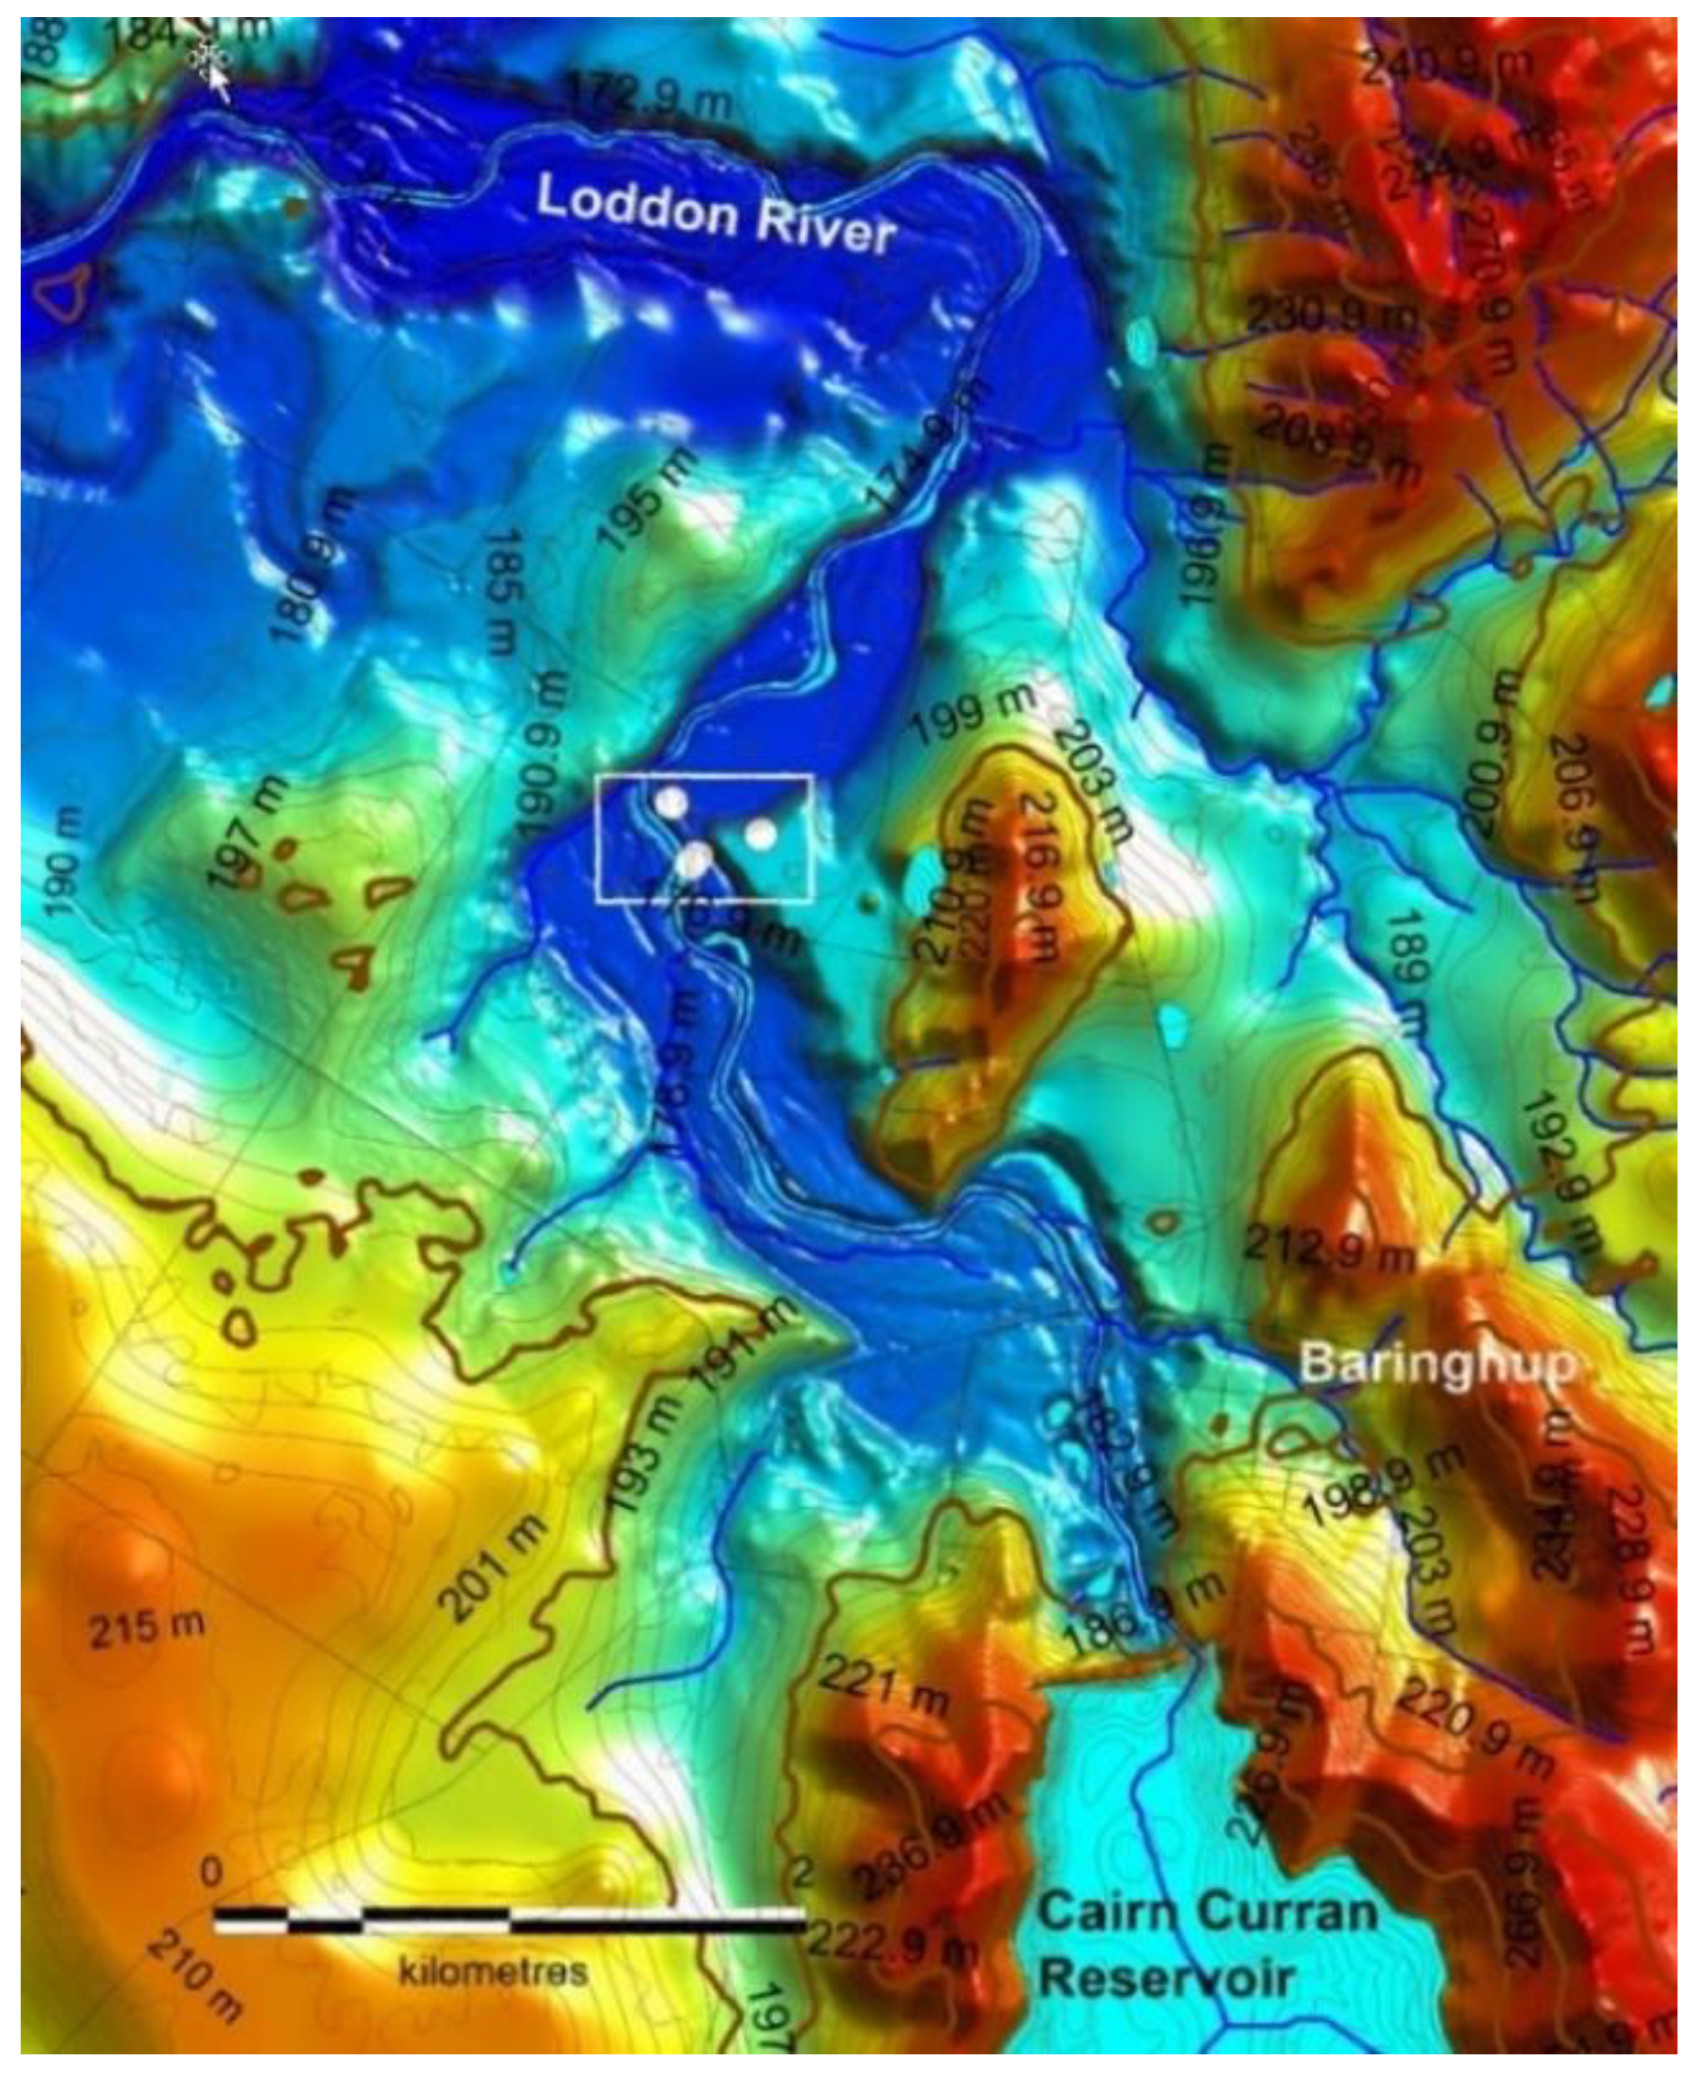
Figure 22.
The Loddon River at Baringhup forms part of the final stage low energy Coonambidgal terrace (AR3) composed of humic clay and silt. The position of three observation bores and a stratigraphic bore on the river terrace and a pumping bore on the Shepparton Formation are shown (vicmap-elevation-dem-10 m modified.).
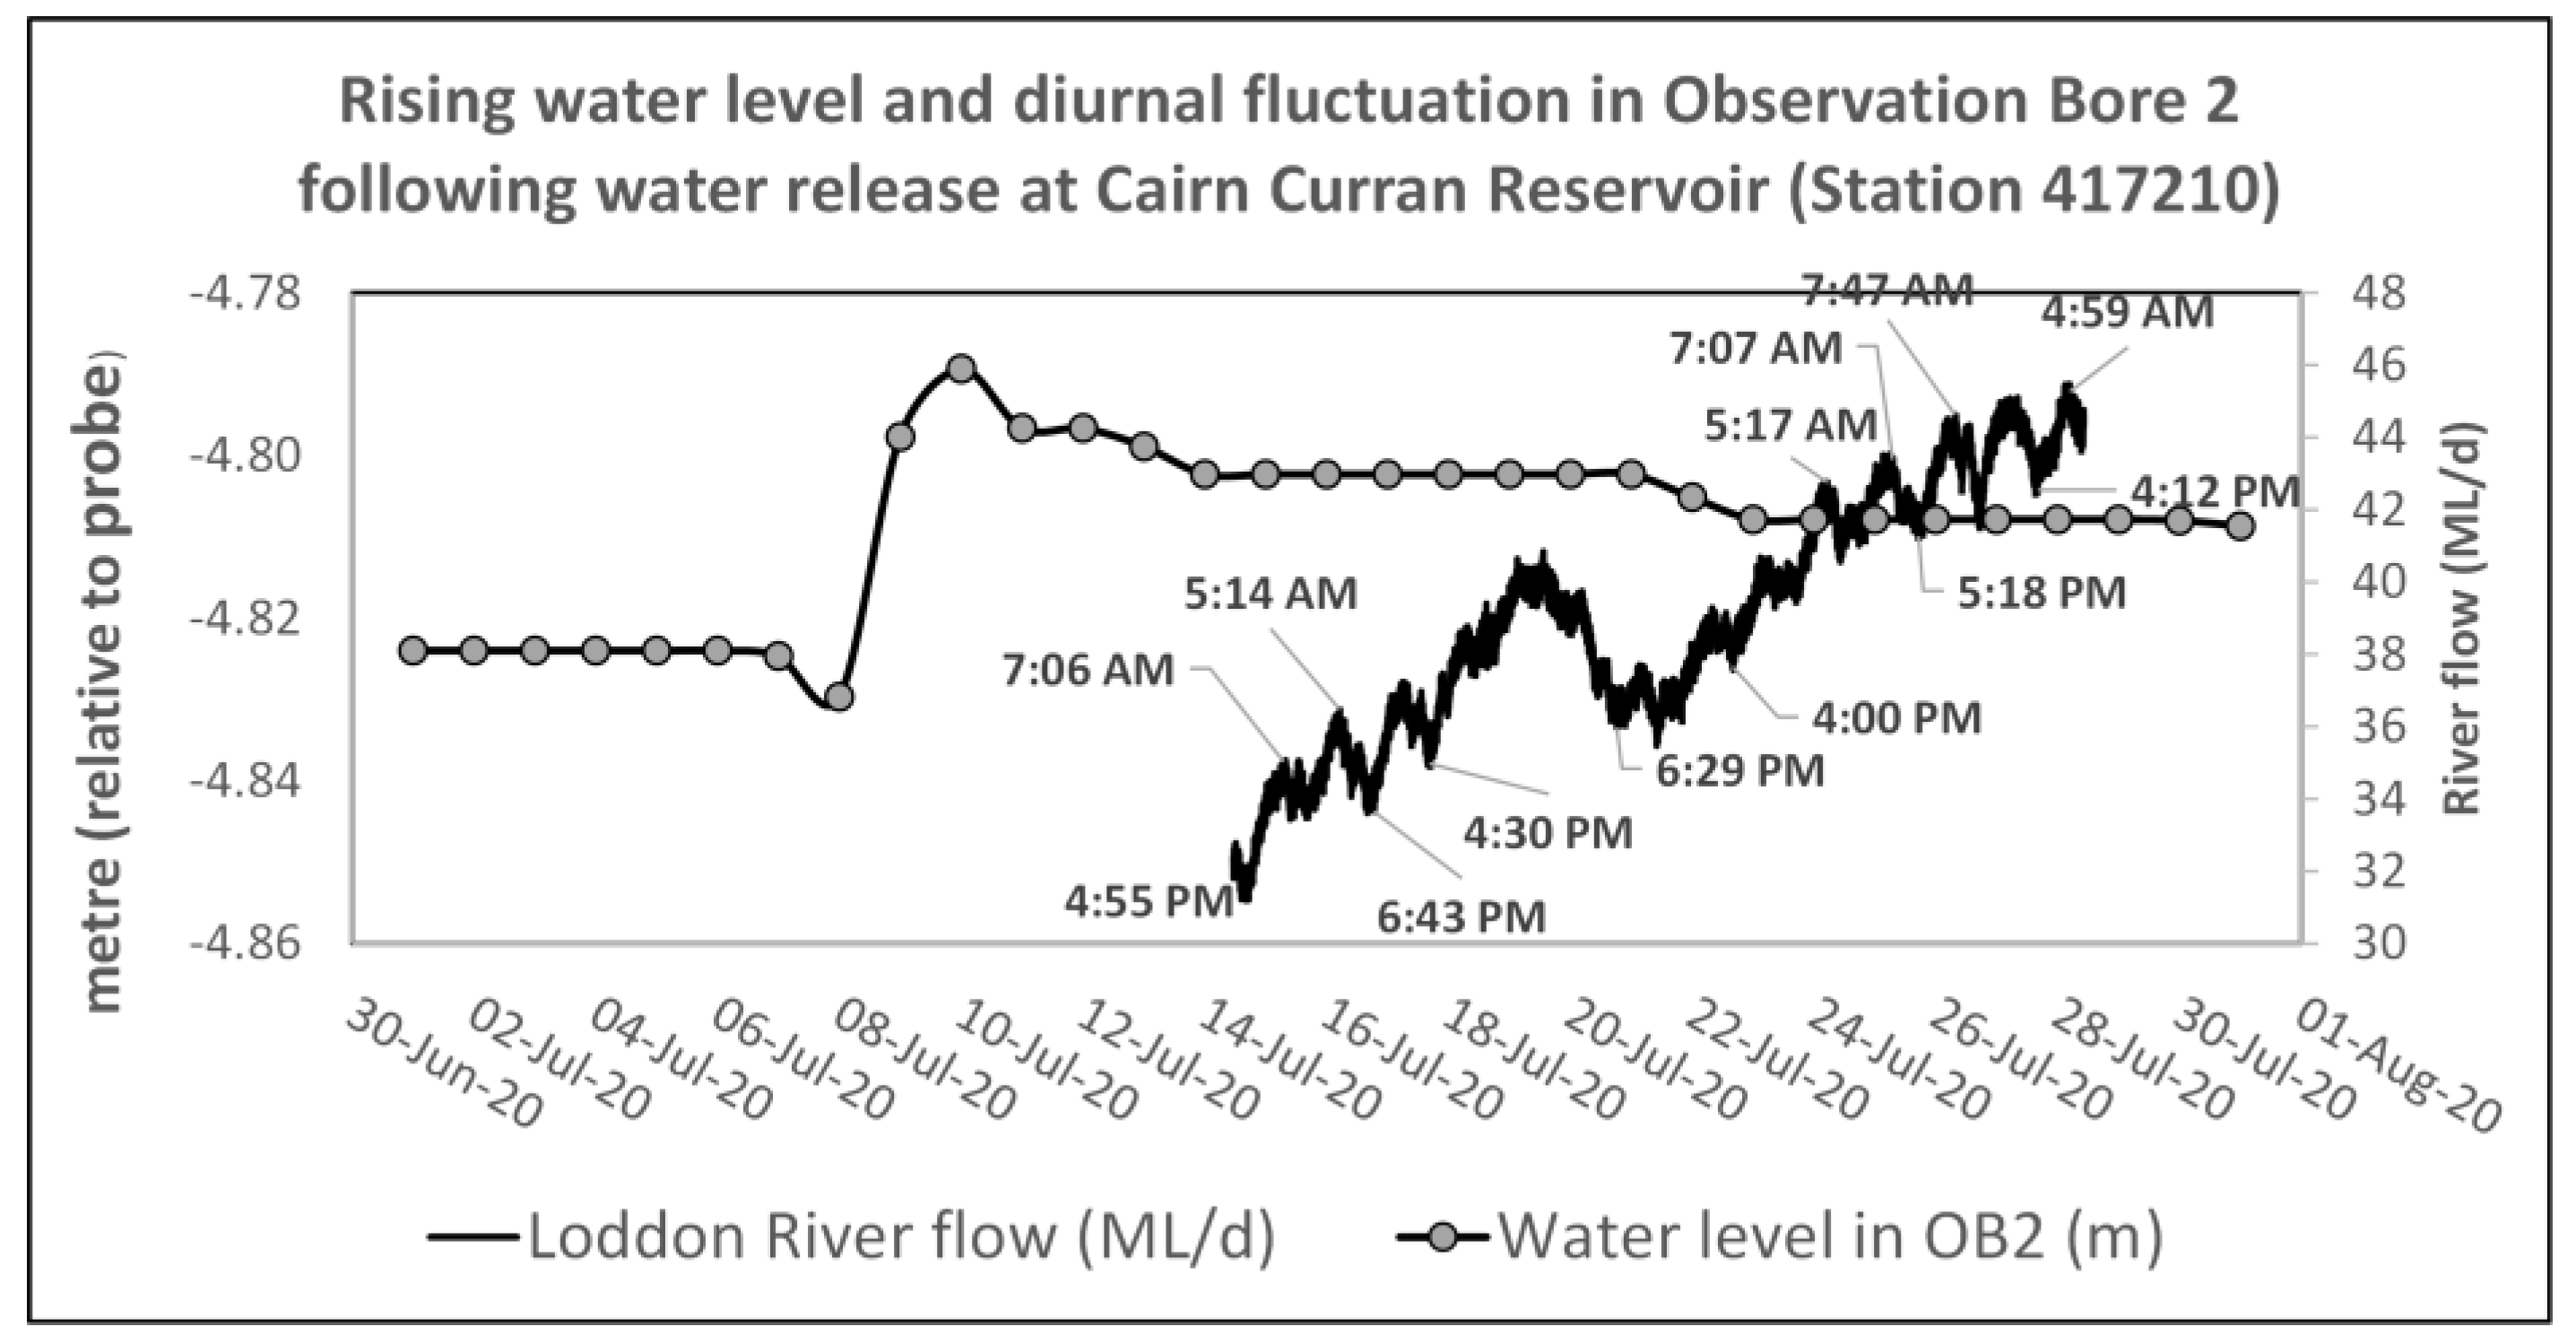
Figure 23.
Rise in water levels in Coonambidgal Formation OB2 bore in response to water release from Cairn Curran Reservoir on 9 July. The commencement of the groundwater rise was not recorded. The rising water table has superimposed diurnal fluctuations due to transpiration by eucalypts on the terrace, with levels being lowest in late afternoon but rising overnight to peak in the early morning.
Figure 24.
Rising then falling groundwater levels in the Calivil Formation to the north of Baringhup.
Figure 24.
Rising then falling groundwater levels in the Calivil Formation to the north of Baringhup.
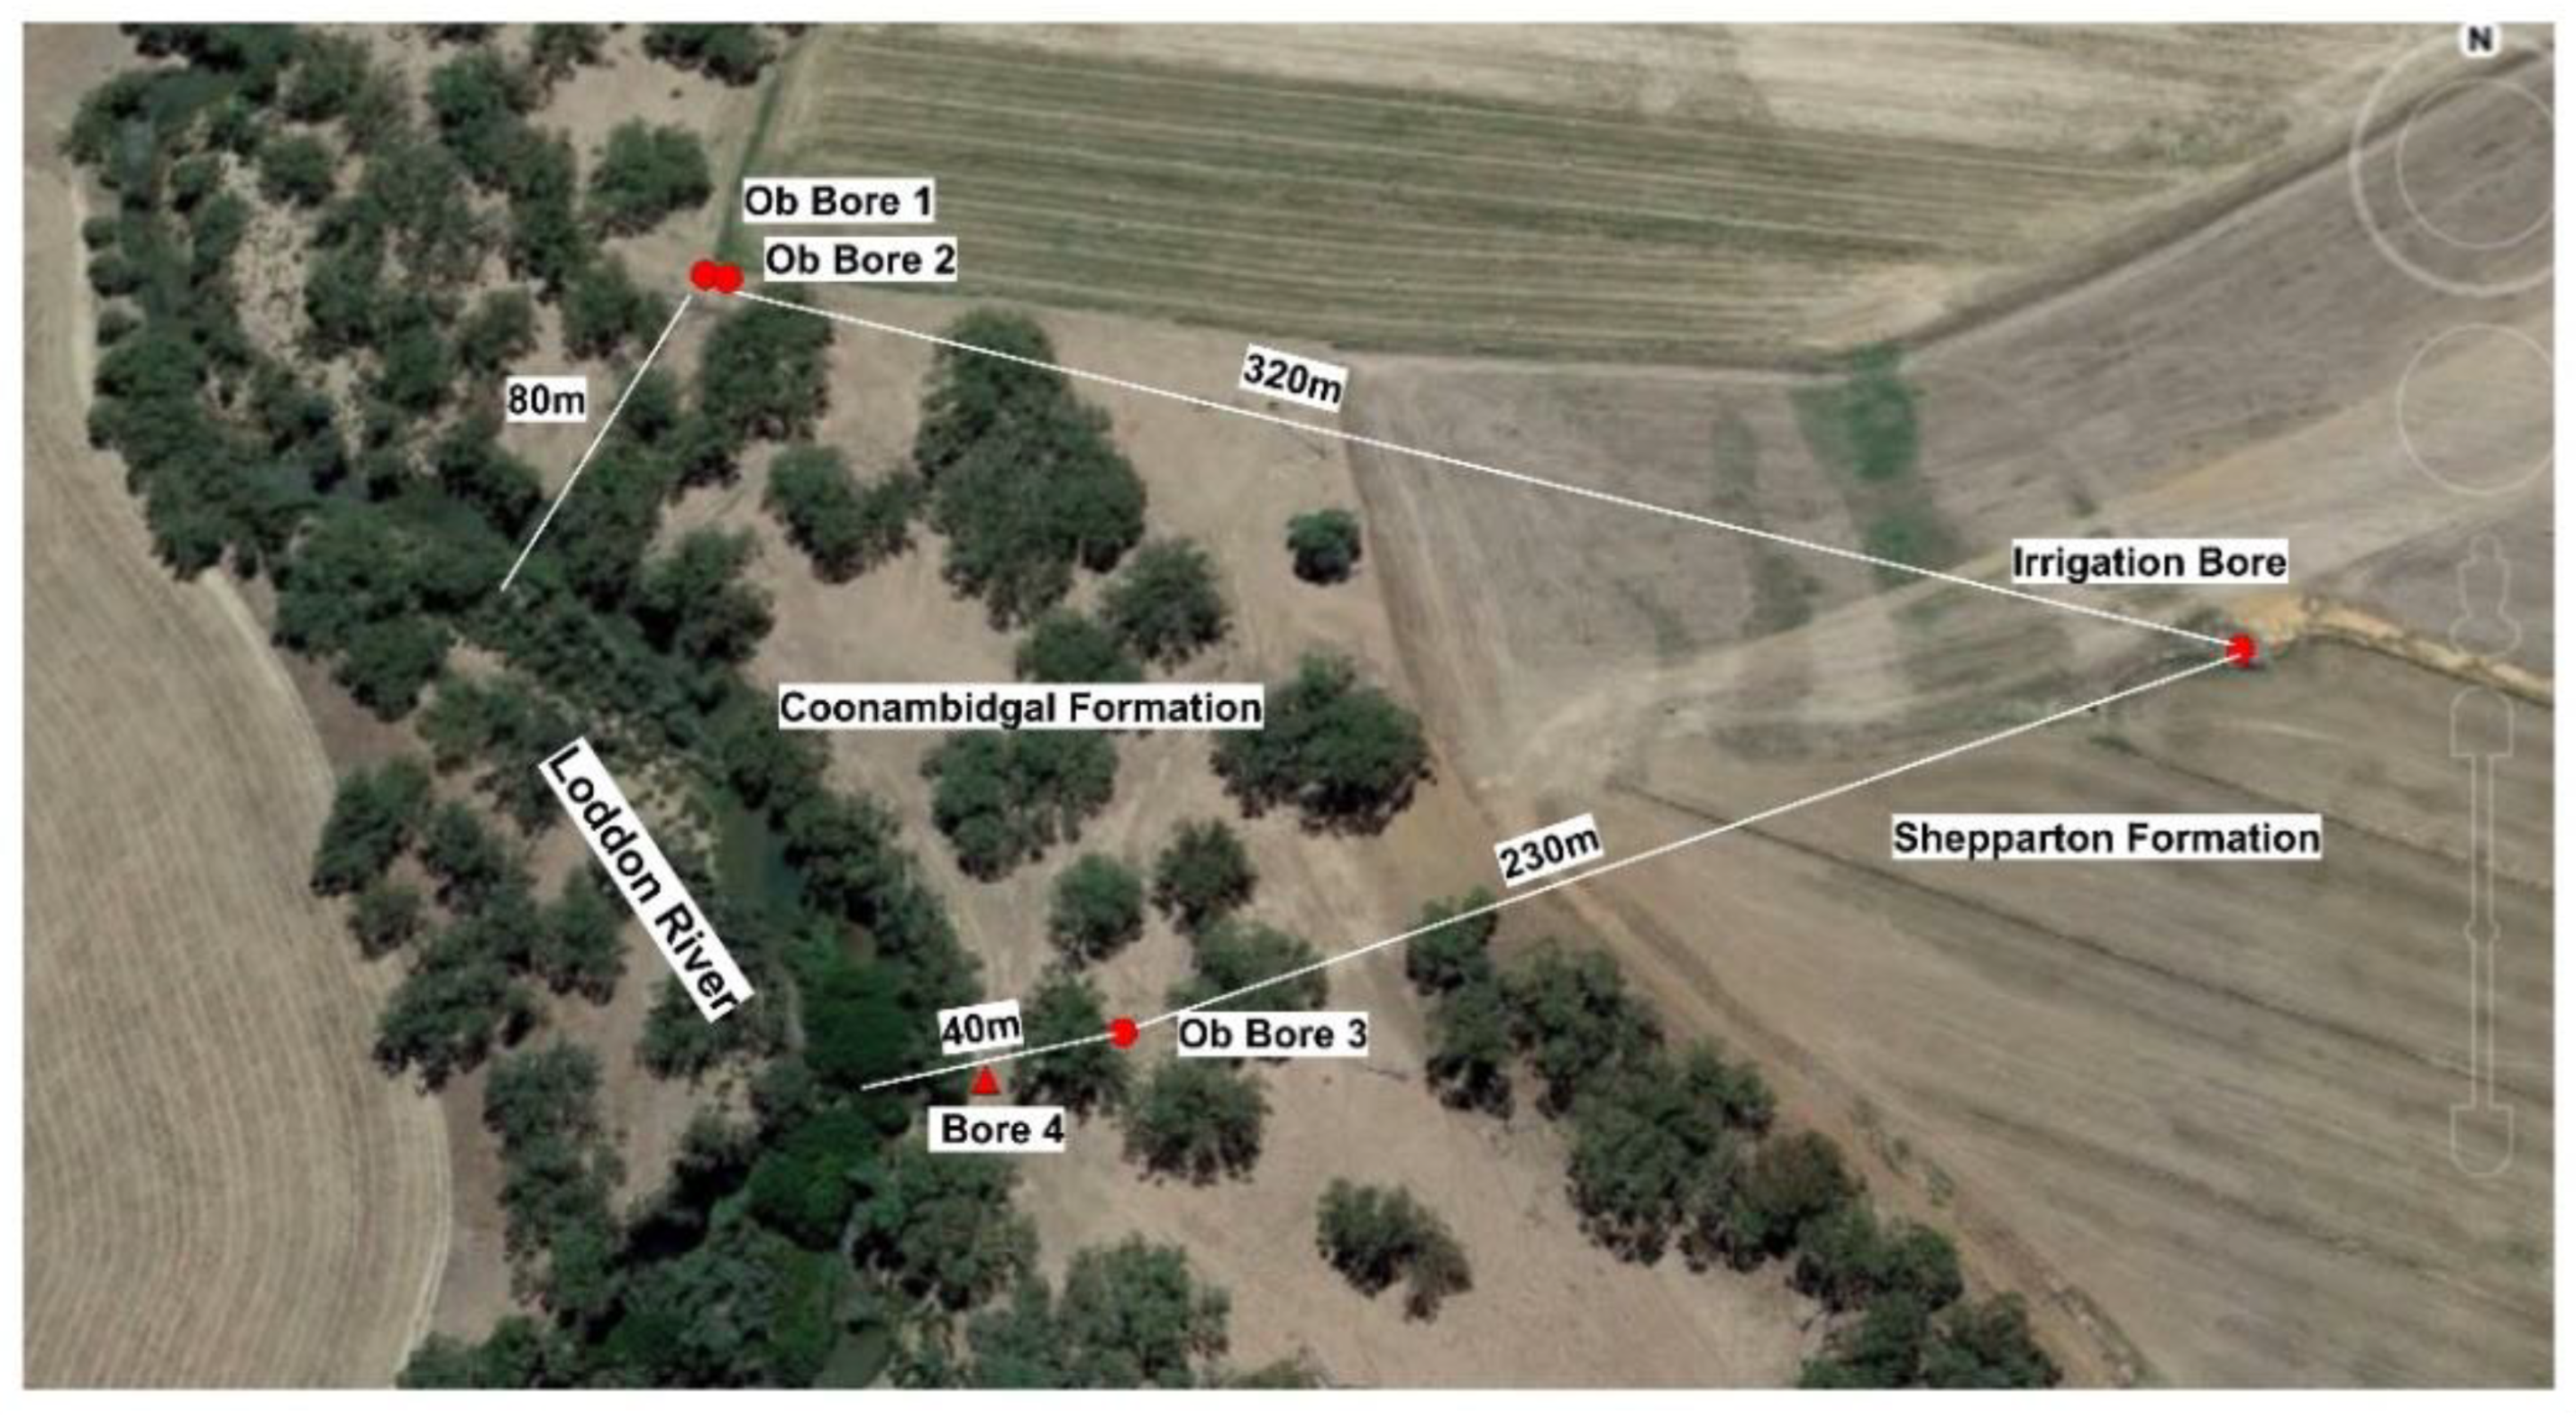
Figure 25.
Location of observation bores (OB1–screen 13–9 m; OB2 and OB3–screens 5–6 m); stratigraphic bore (Bore 4); and extraction bore (screen 45–70 m). The strip eucalypt forest is a Terrestrial GDE tapping groundwater in the 9 m thick Coonambidgal Formation.
Figure 25.
Location of observation bores (OB1–screen 13–9 m; OB2 and OB3–screens 5–6 m); stratigraphic bore (Bore 4); and extraction bore (screen 45–70 m). The strip eucalypt forest is a Terrestrial GDE tapping groundwater in the 9 m thick Coonambidgal Formation.
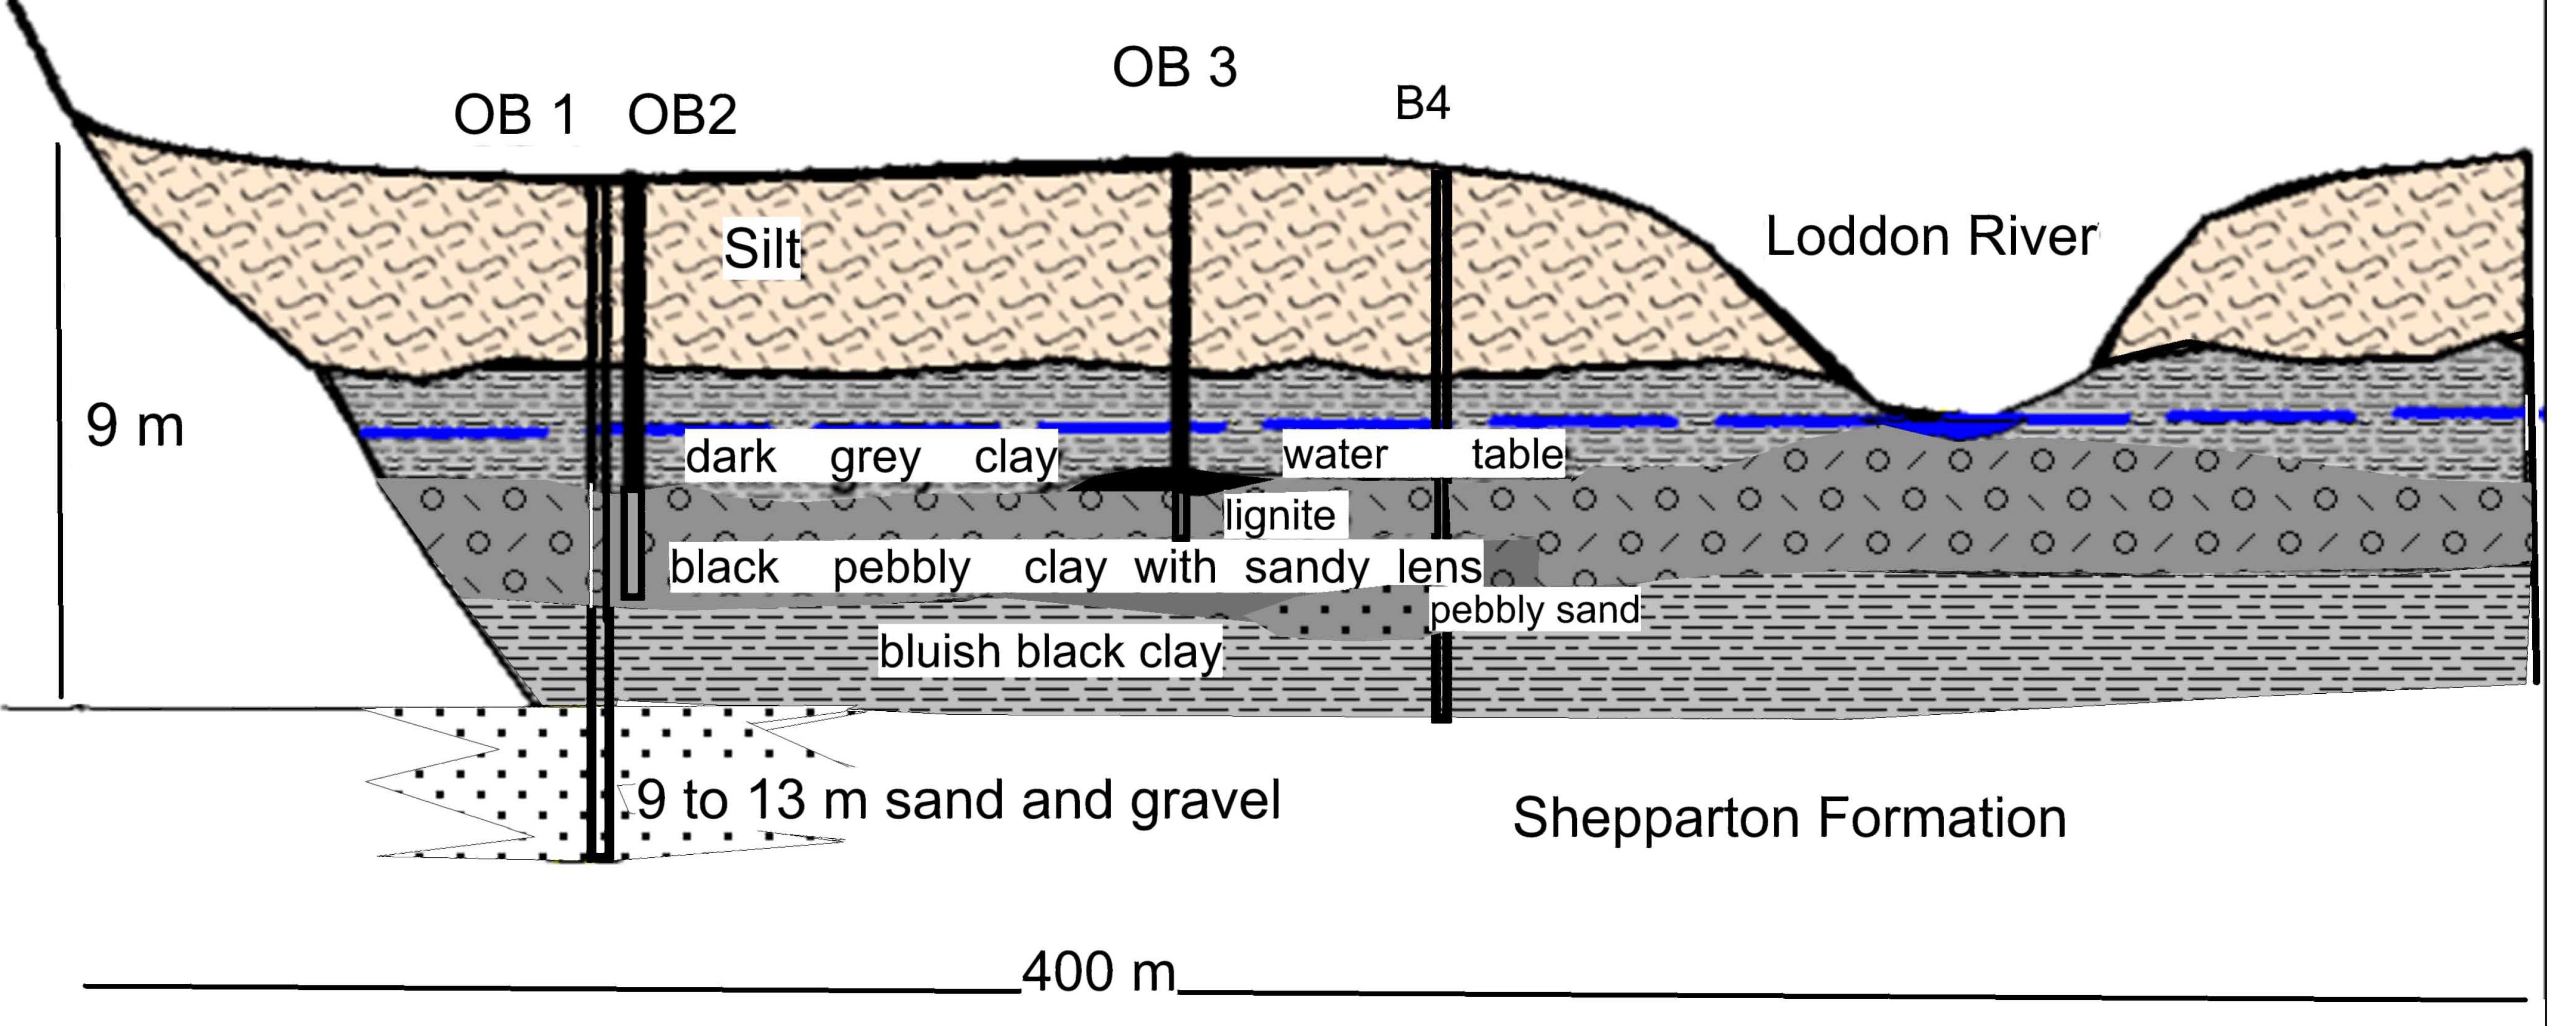
Figure 26.
Lithology of the Coonambidgal Formation at Baringhup with observation bores 1 to 3 and stratigraphic bore B4.
Figure 26.
Lithology of the Coonambidgal Formation at Baringhup with observation bores 1 to 3 and stratigraphic bore B4.
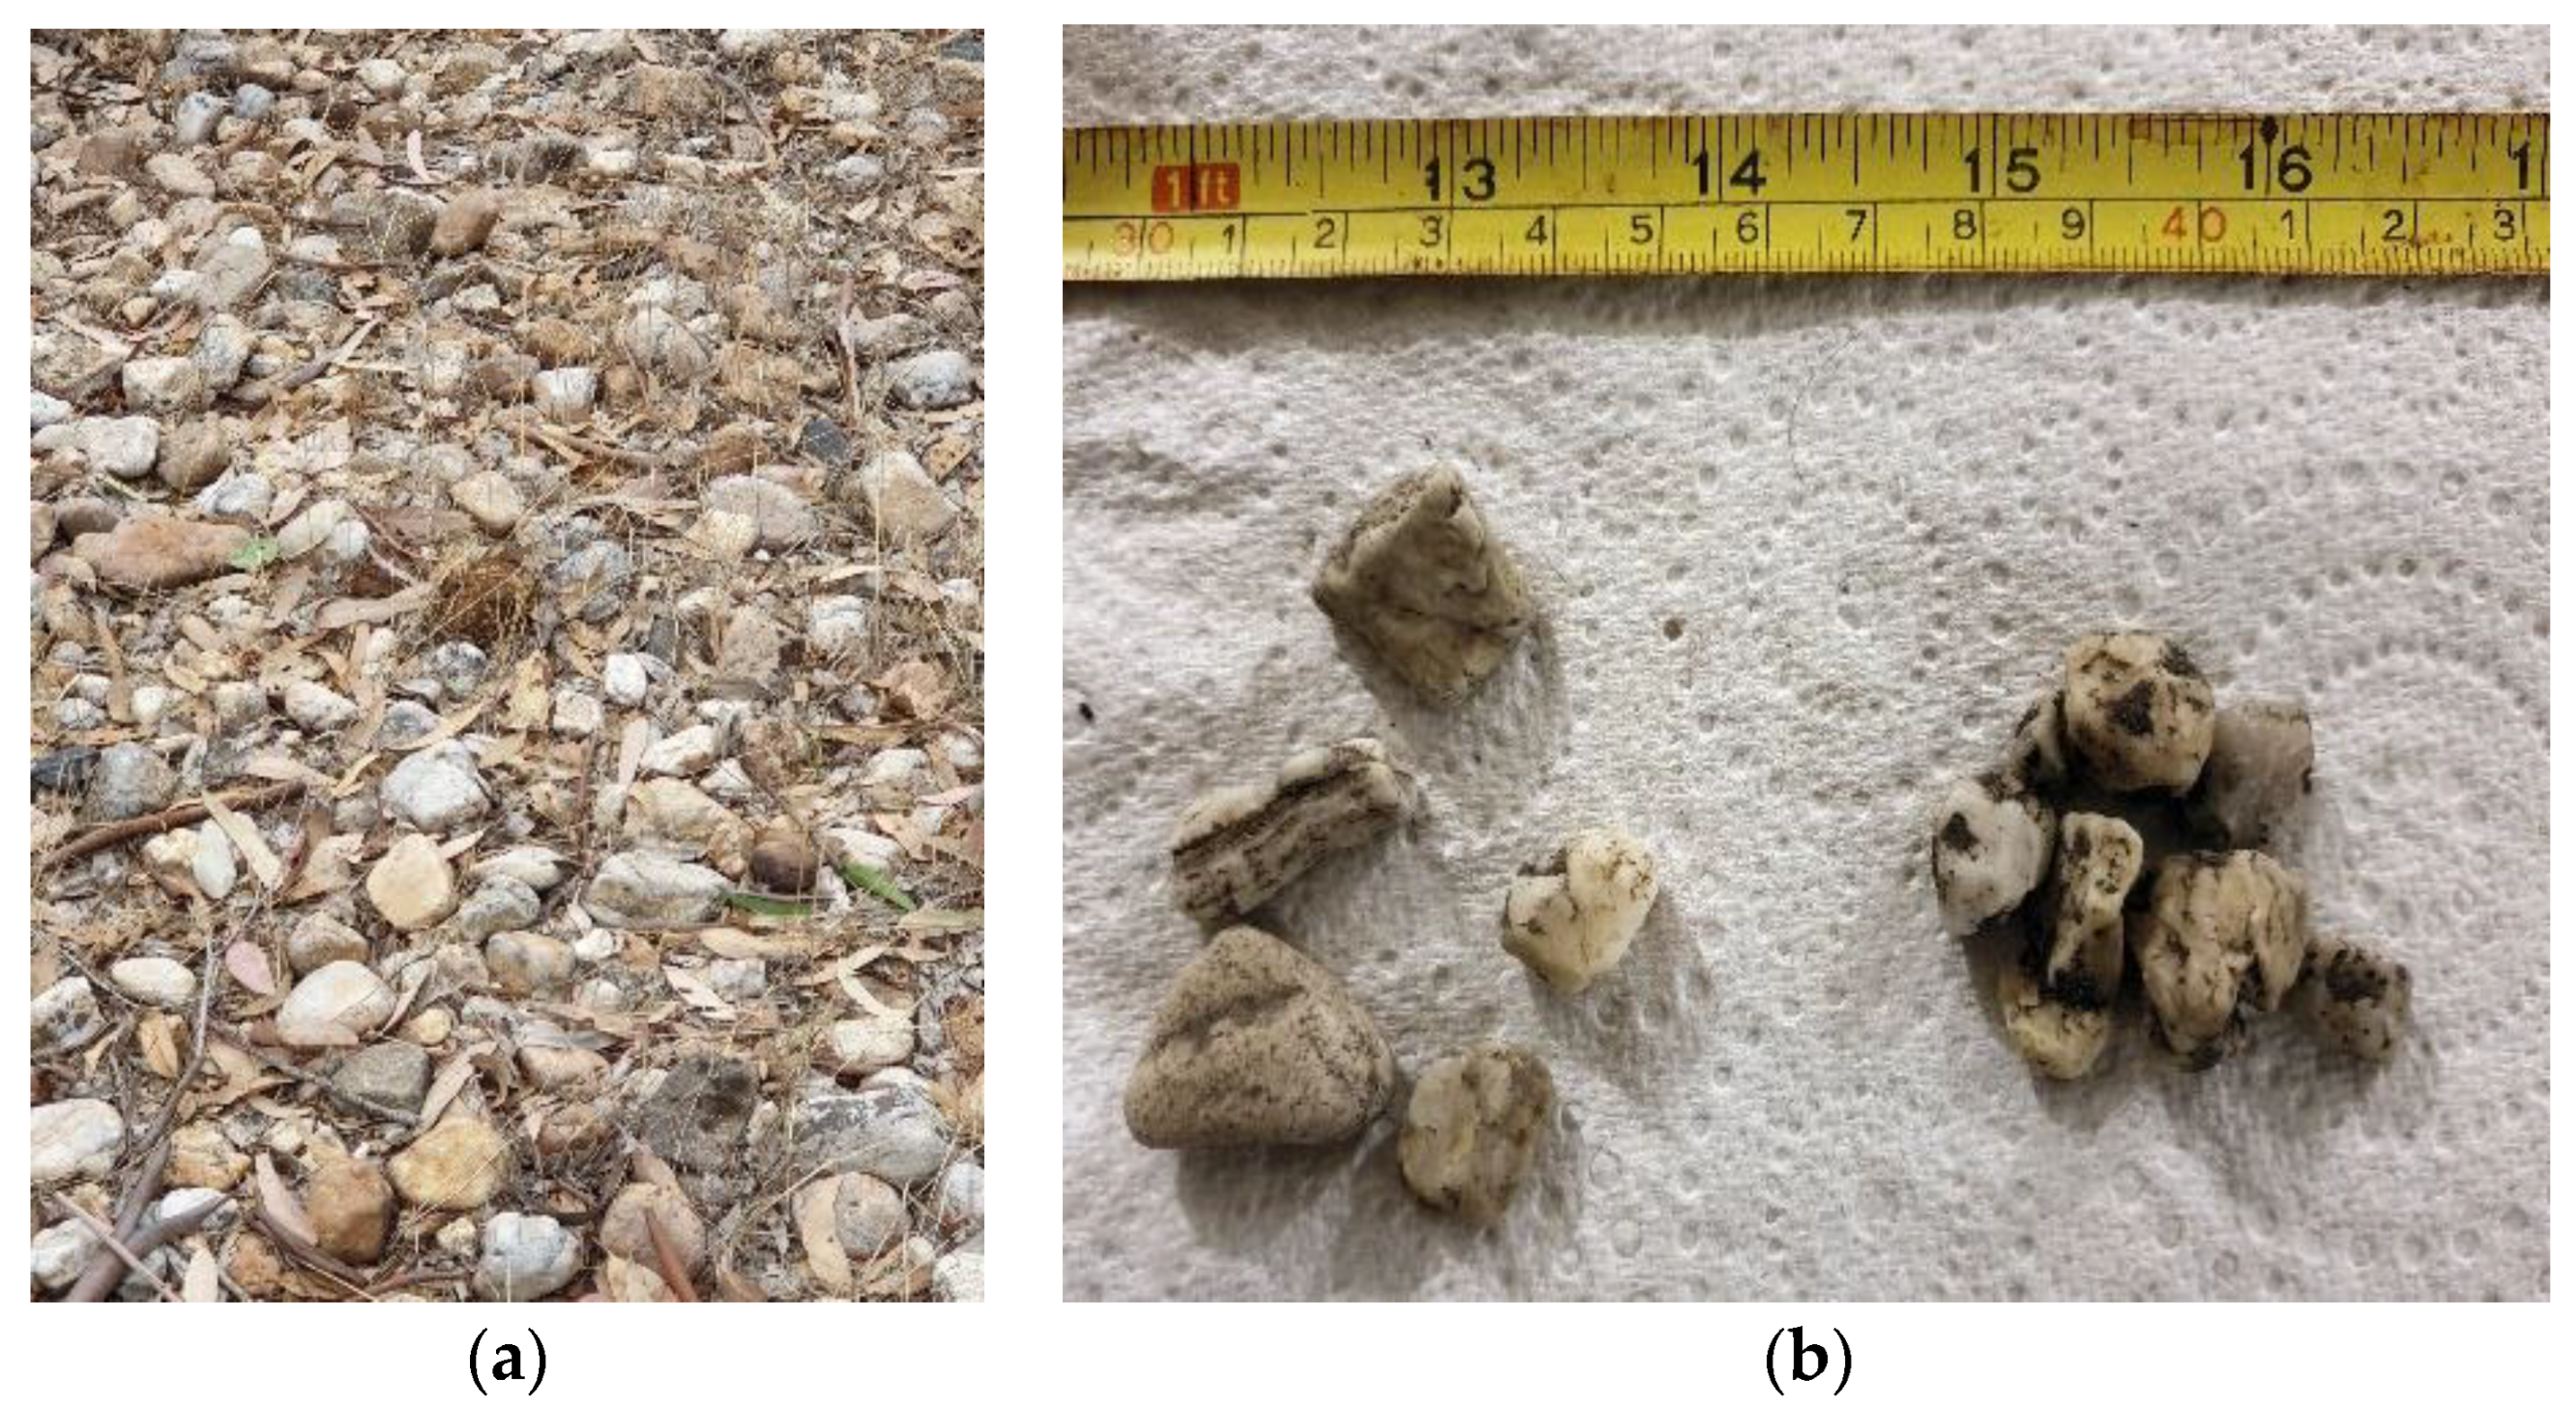
Figure 27.
(a) Quartz riverbed pebbles on a low terrace alongside the Loddon River; (b) quartz pebbles from the Coonambidgal channel deposit after washing.
Figure 27.
(a) Quartz riverbed pebbles on a low terrace alongside the Loddon River; (b) quartz pebbles from the Coonambidgal channel deposit after washing.
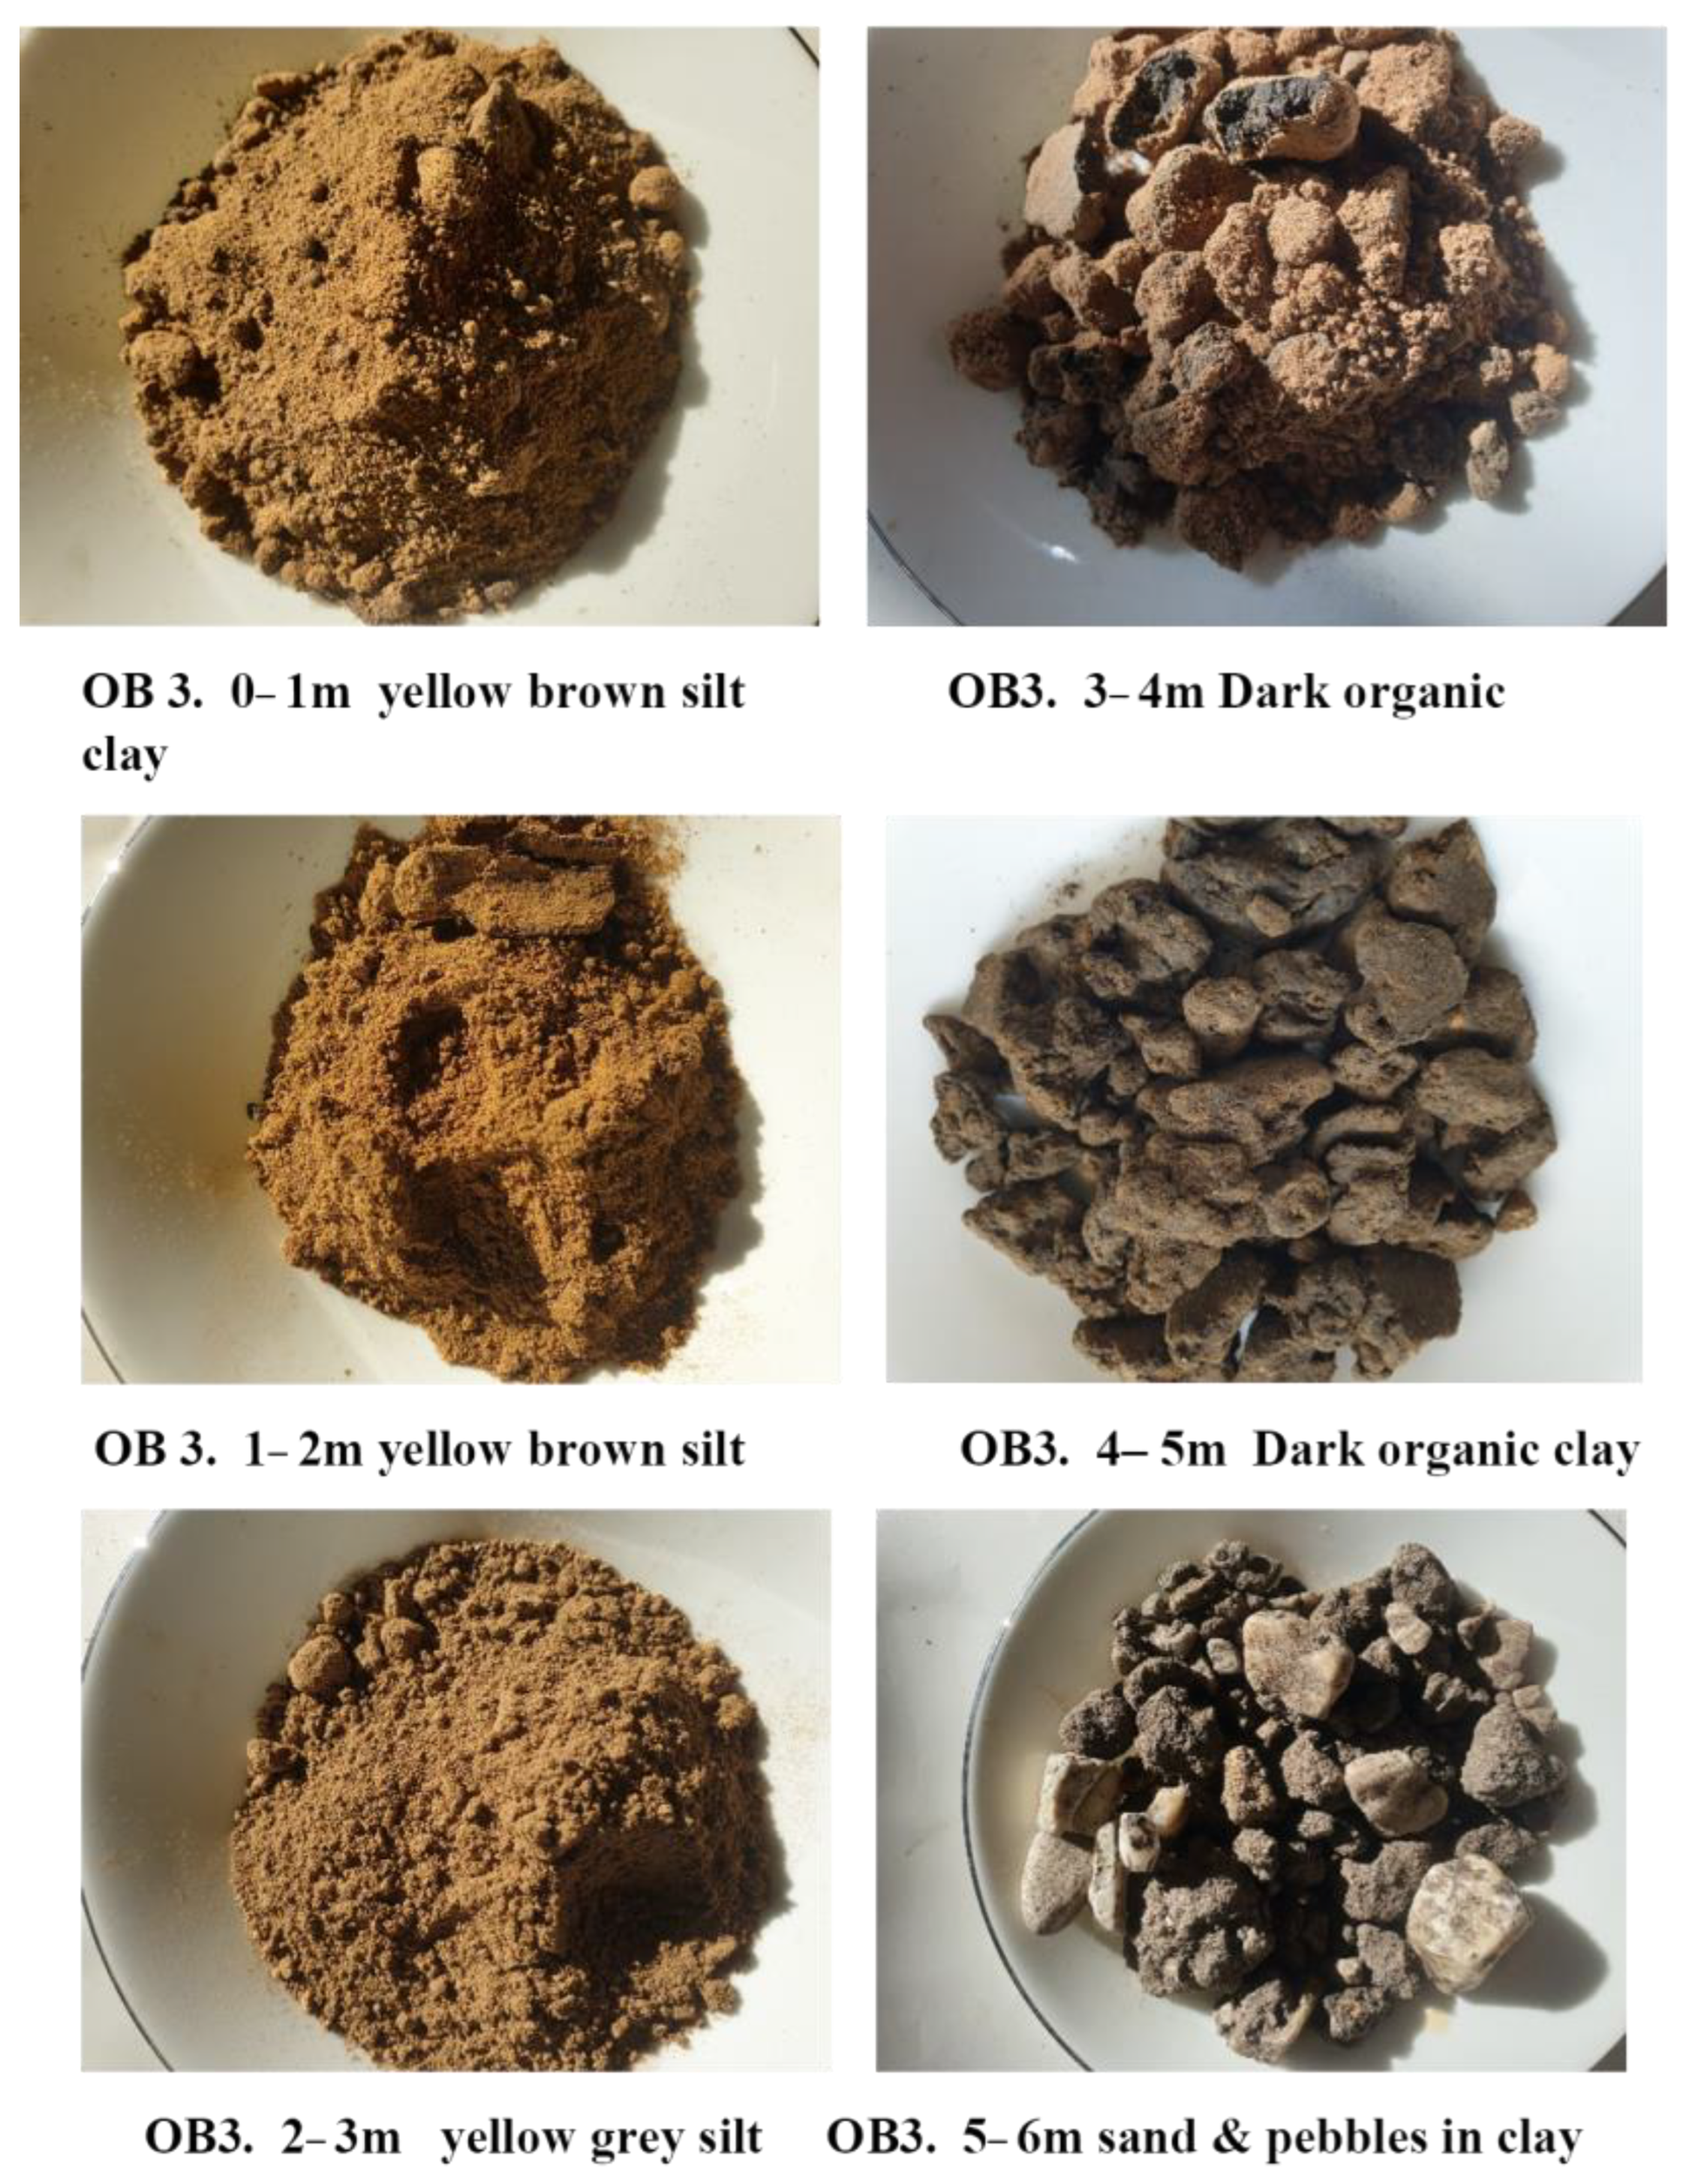
Figure 28.
Lithology at OB 3 bore with depths, showing overbank flow silts (1 to 3 m) overlying meander fill humic clay (black colour most visible on broken peds in 3–4 m sample) and <0.5 to 2 cm quartz pebbles (washed) which were coated in black clay. The clay surrounding the pebbles from 5 to 6 m is deemed to have been introduced during infilling after channel abandonment.
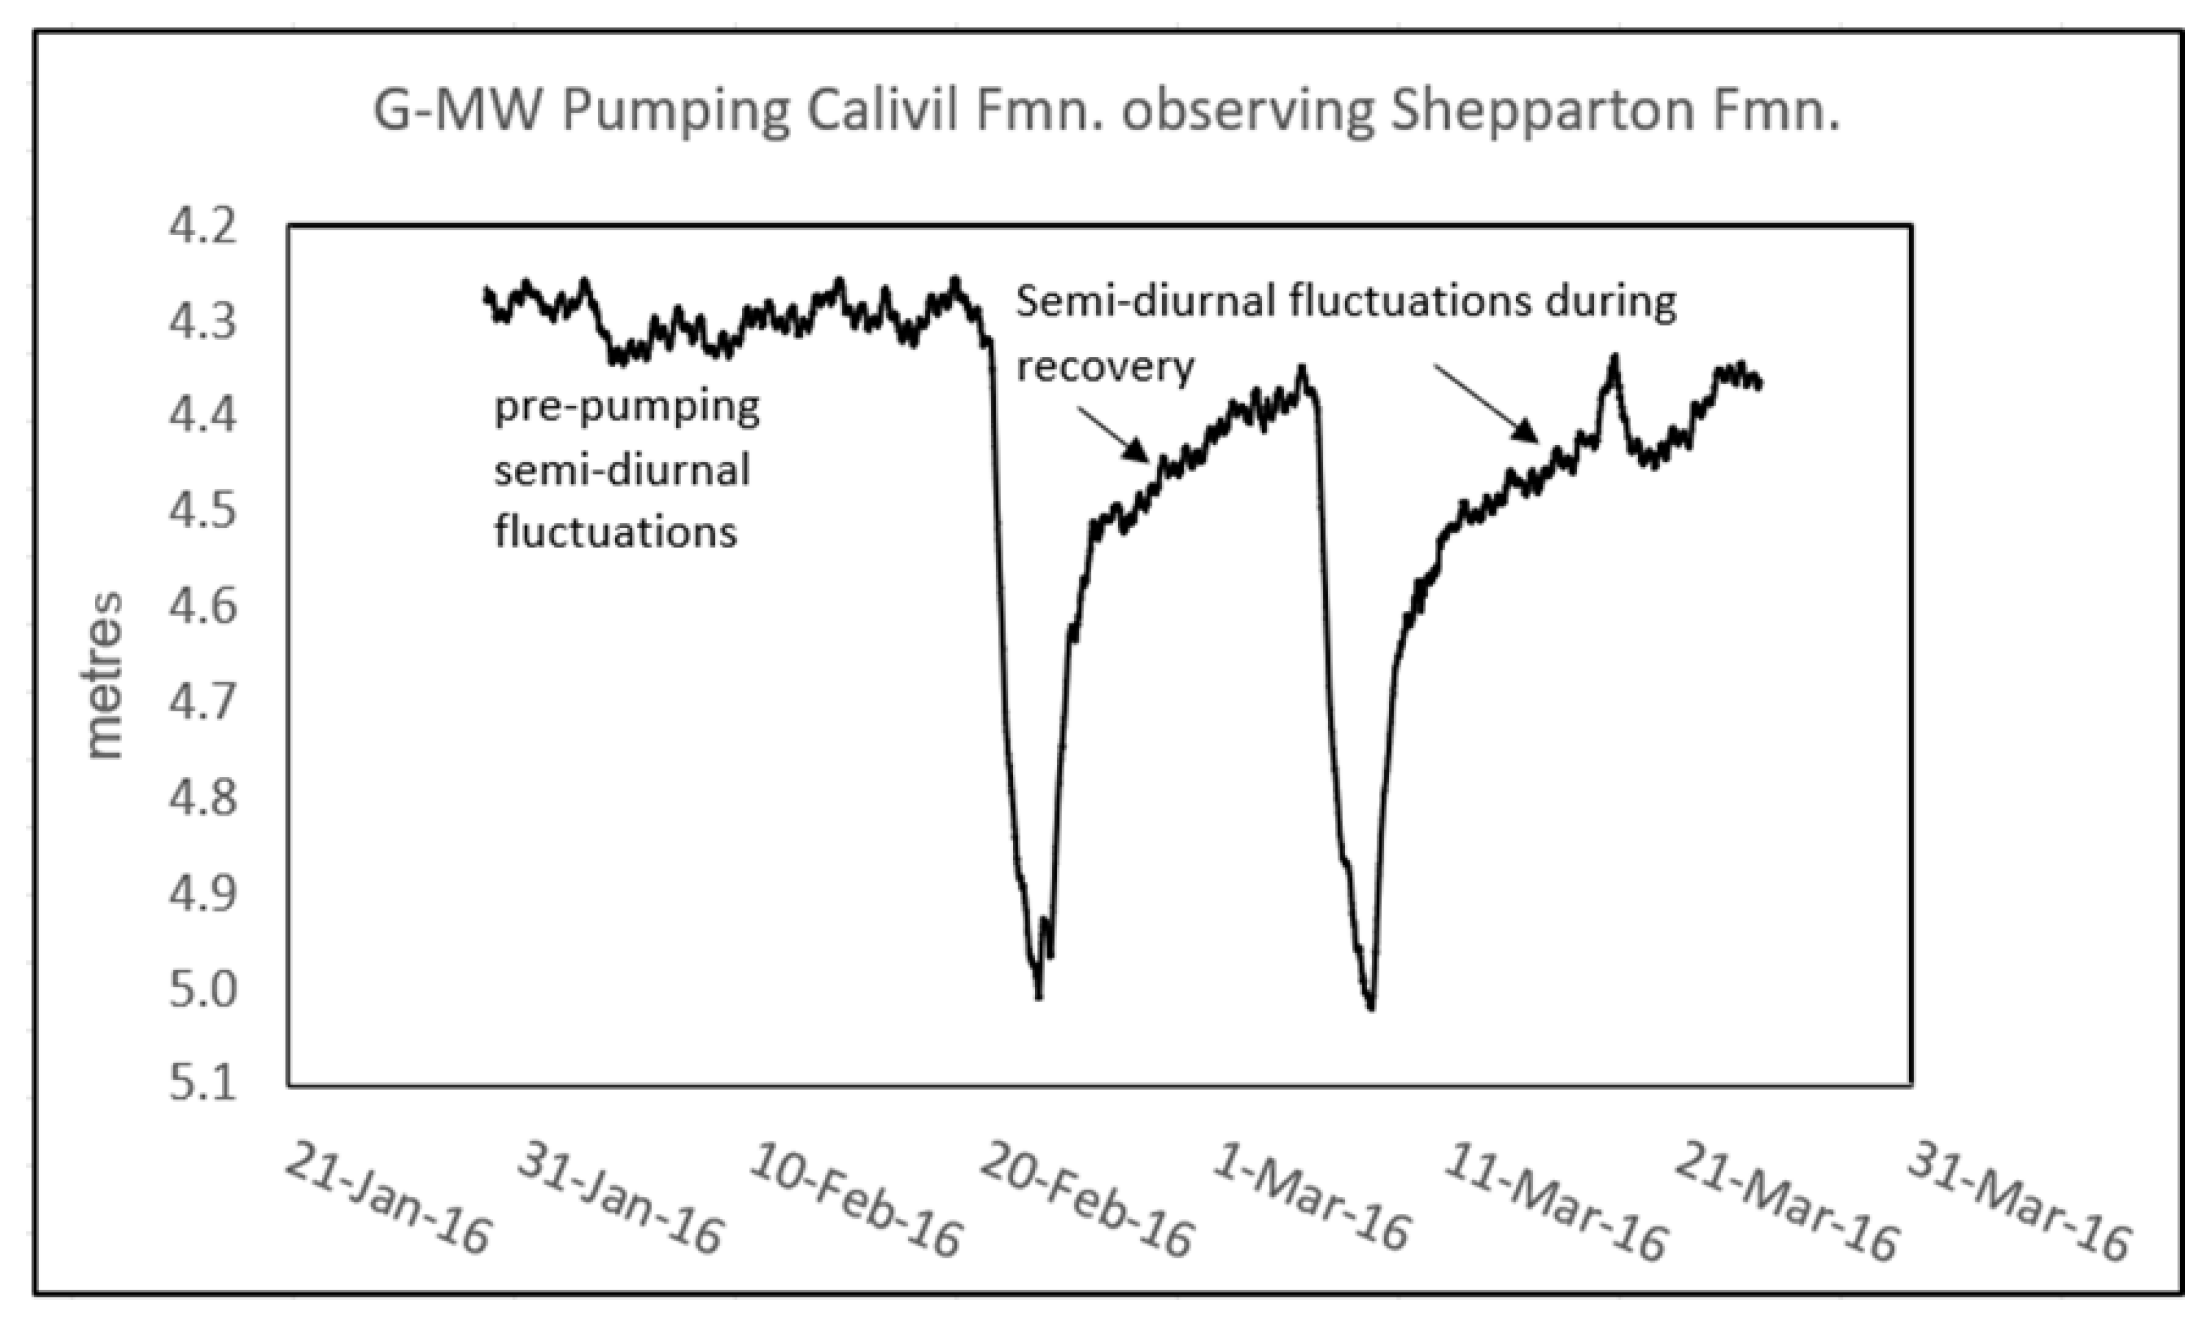
Figure 29.
Drawdown-recovery curves for Shepparton Formation—Observation Bore 1 (G-MW data) when pumping from the Calivil Formation bore, 320 m distant. During the pre-pumping phase prior to 19 February and the later recovery phases, fine scale low amplitude semi-diurnal fluctuations are present in response to earth tides (
Figure 30).
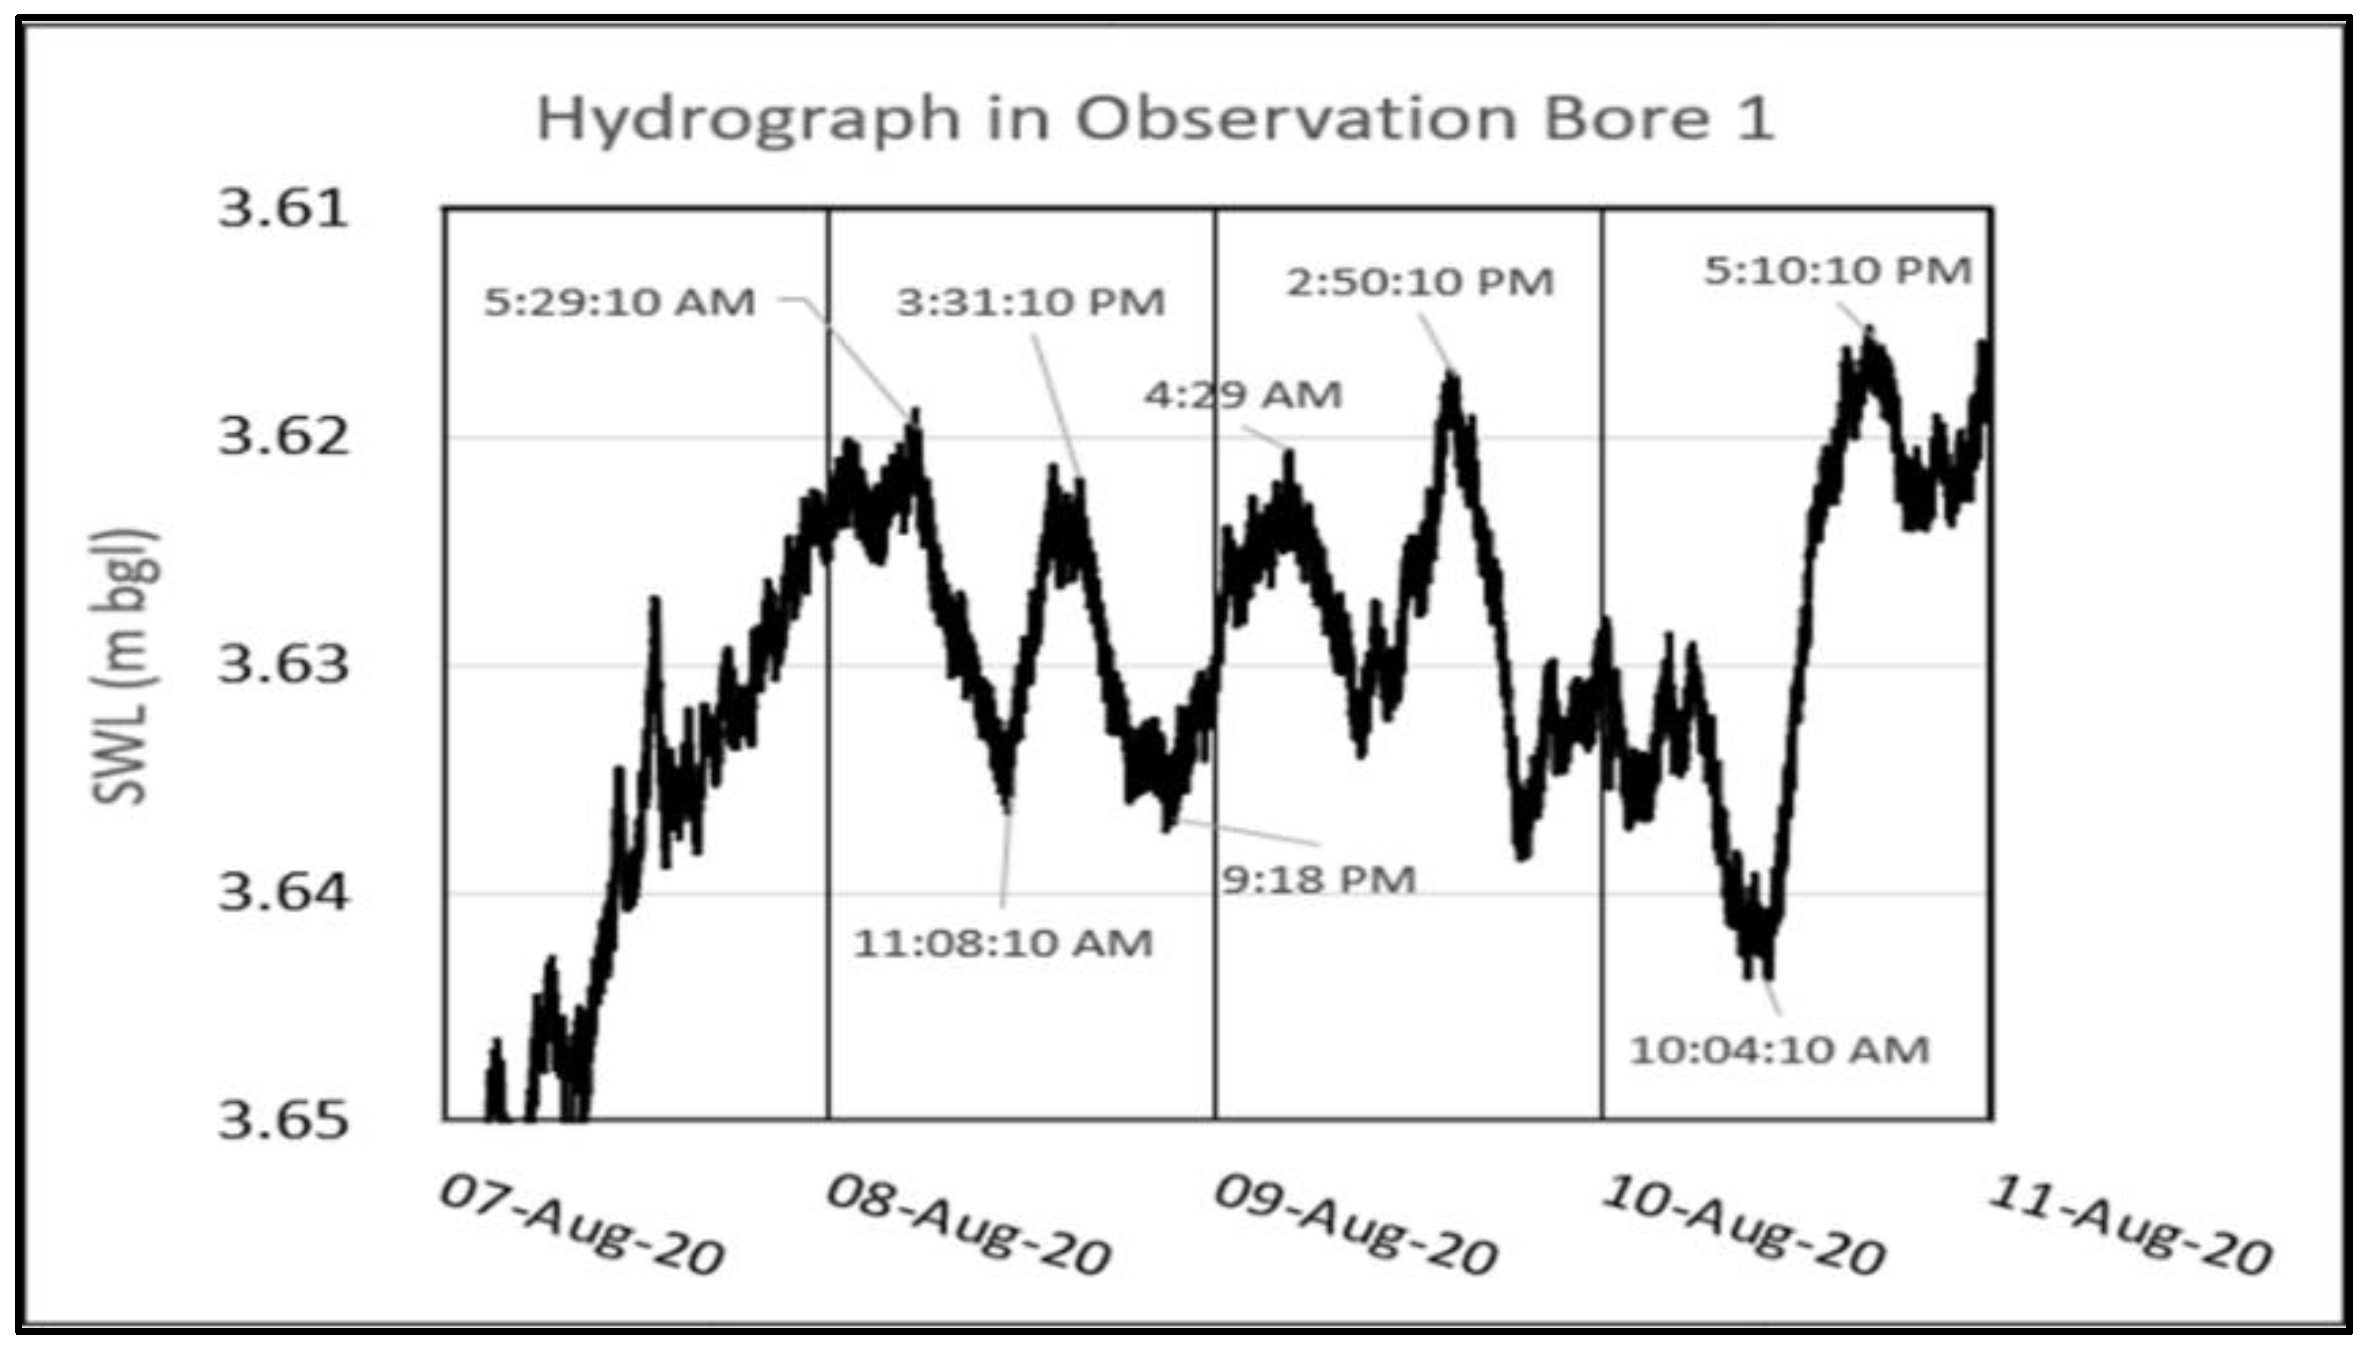
Figure 30.
Semi-diurnal fluctuations produced in OB1 in August 2020.
Figure 30.
Semi-diurnal fluctuations produced in OB1 in August 2020.
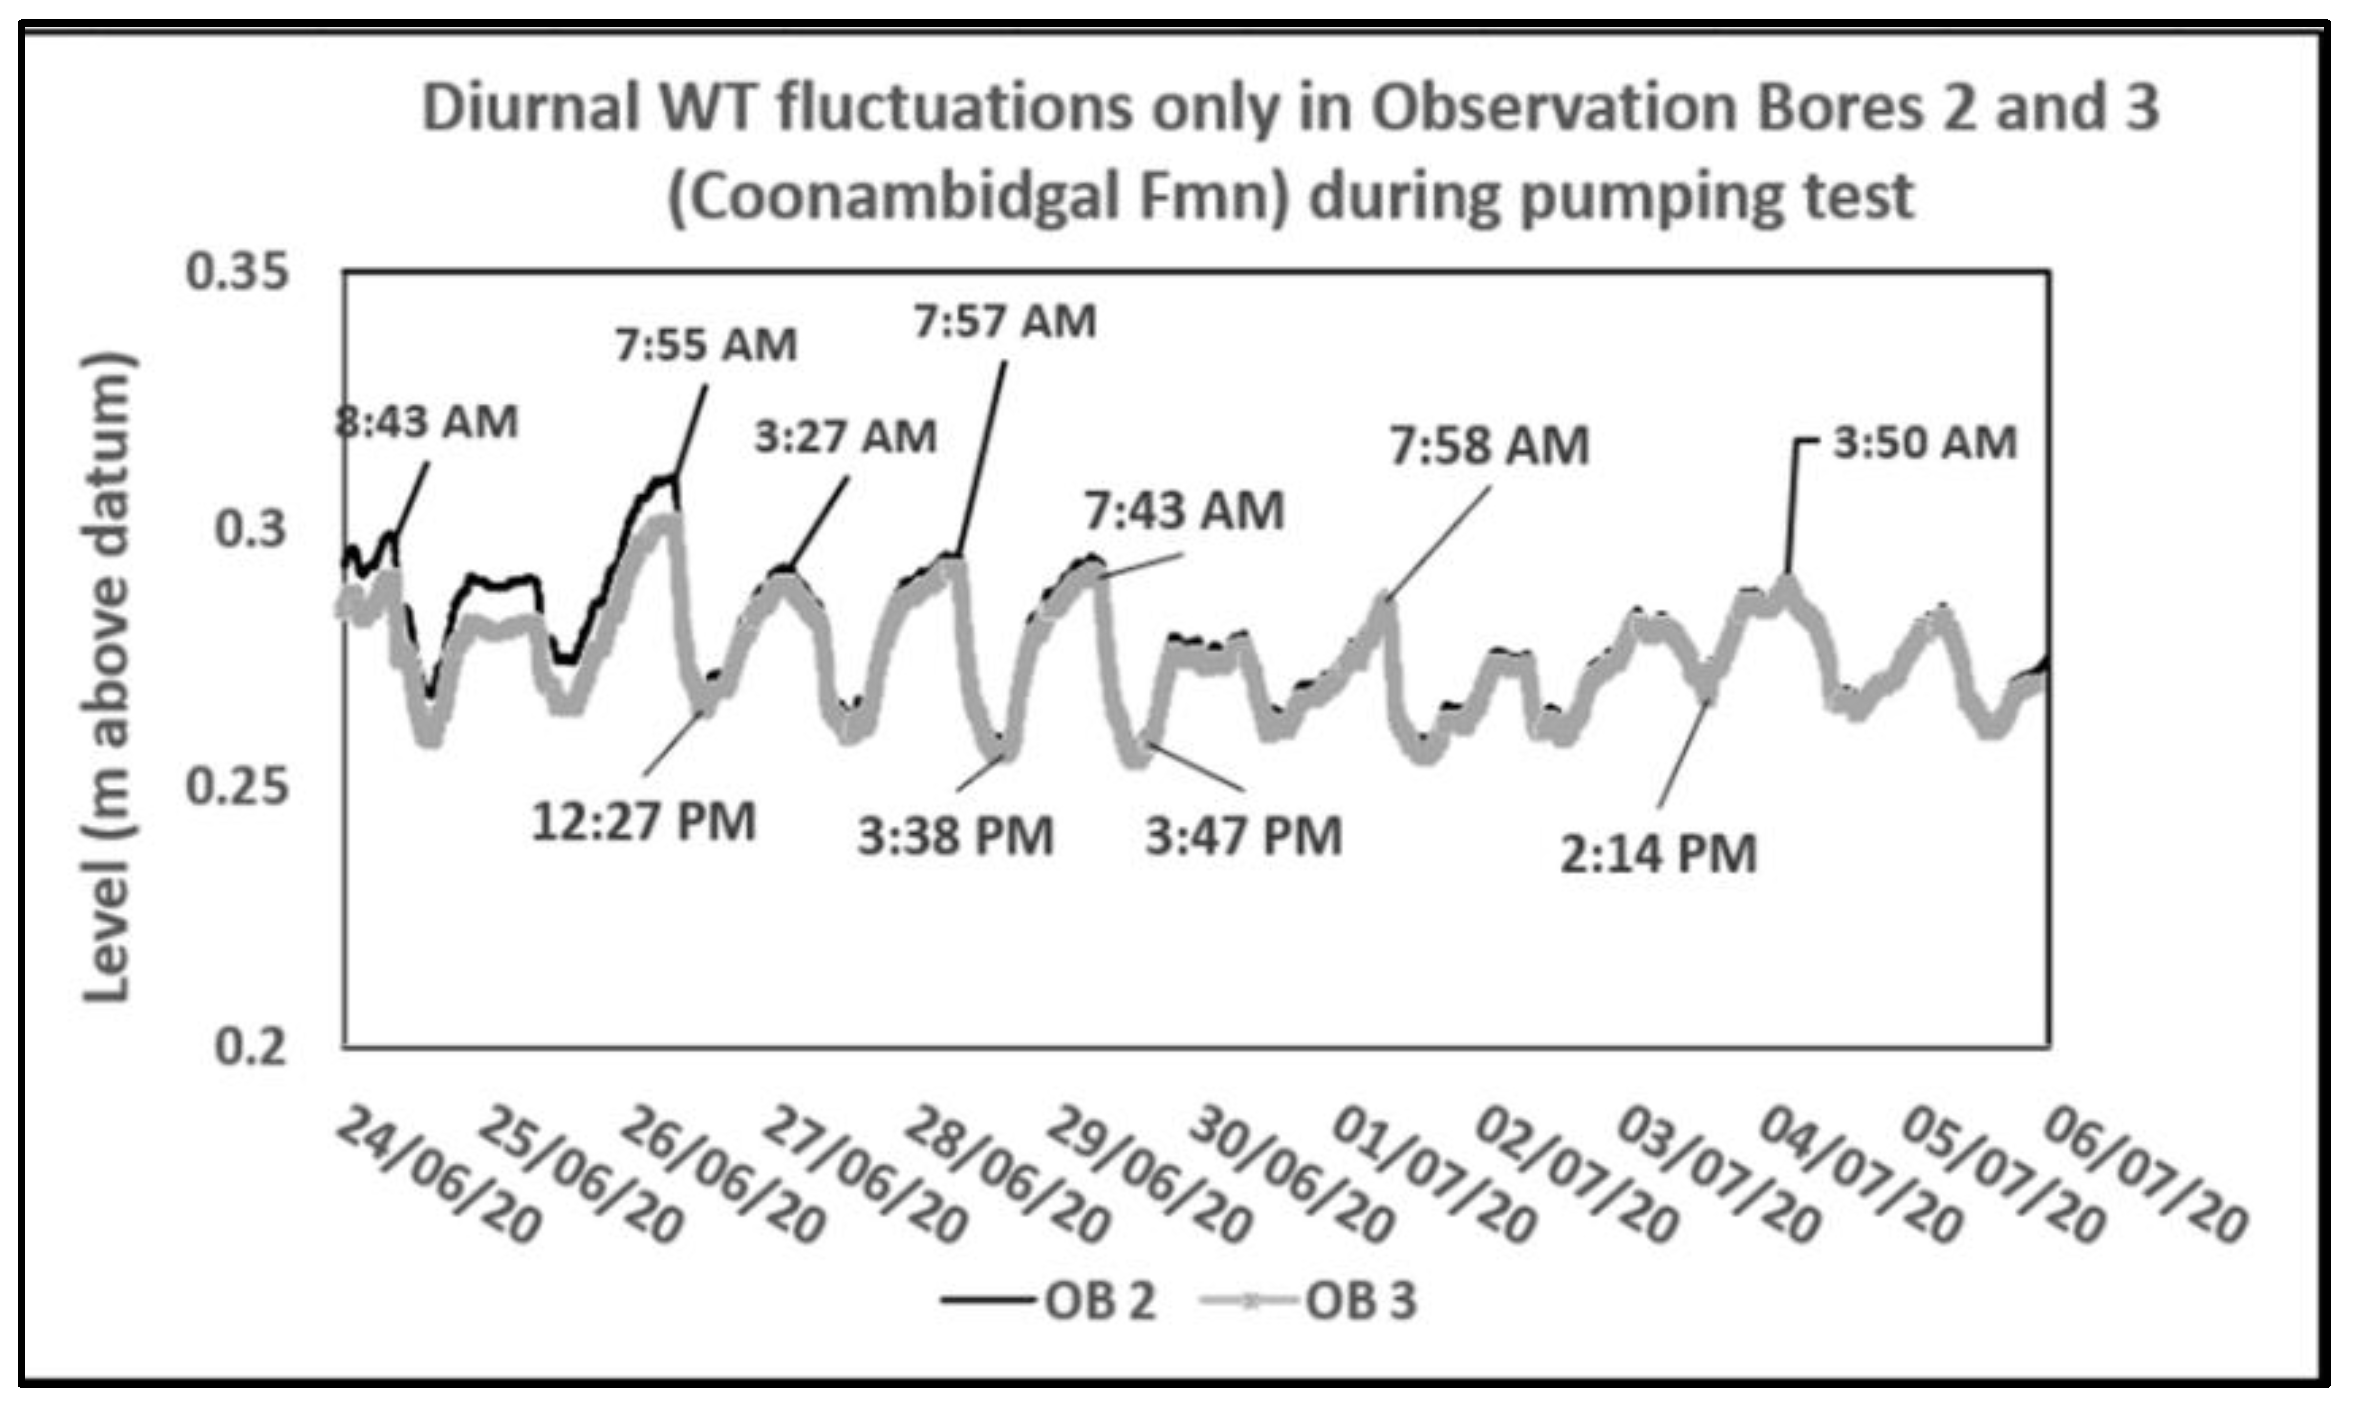
Figure 31.
Diurnal fluctuations from eucalypt evapotranspiration on the Coonambidgal terrace occur in the Coonambidgal Bores OB2 and OB3. When pumping from the Calivil Formation bore. here is no impact on the Coonambidgal bores as occurs in
Figure 29.
Figure 31.
Diurnal fluctuations from eucalypt evapotranspiration on the Coonambidgal terrace occur in the Coonambidgal Bores OB2 and OB3. When pumping from the Calivil Formation bore. here is no impact on the Coonambidgal bores as occurs in
Figure 29.
Table 1.
Lithology and stratigraphy through the Coonambidgal Fmn. AR1 trench.
Table 1.
Lithology and stratigraphy through the Coonambidgal Fmn. AR1 trench.
| Bore | From (m) | To (m) | Lithology | Stratigraphy |
|---|
| 41,592 | 4.9 | 8.5 | Yellow fine sand | Coonambidgal Fmn. |
| 41,592 | 8.5 | 13.4 | Silt, sandy and clay | |
| 41,592 | 13.4 | 20.7 | Yellow medium sand | Channel sand |
| 41,592 | 20.7 | 22.6 | Grey clay, firm and plastic | Shepparton Fmn. |
| 41,594 | 0 | 0.6 | Brownish red clay | Coonambidgal Fmn. |
| 41,594 | 0.6 | 2.4 | Brownish, orange-grey sandstone | |
| 41,594 | 2.4 | 3.7 | Brown, black, grey clay | |
| 41,594 | 3.7 | 6.1 | Brown, grey orange silty clay | |
| 41,594 | 6.1 | 7.3 | Orange and grey silt, sand and clay | |
| 41,594 | 7.3 | 11.0 | Brown fine sand | |
| 41,594 | 11.0 | 15.8 | Red silt and clay | |
| 41,594 | 15.8 | 20.7 | Yellow coarse sand | |
| 41,594 | 20.7 | 21.9 | Brown silt, sand and clay | |
| 41,594 | 21.9 | 23.2 | Yellow coarse sand | Channel sand |
| 41,594 | 23.16 | 24.38 | Red and grey clay, hard and plastic | Shepparton Fmn. |
Table 2.
Screened intervals and levels in observation bores.
Table 2.
Screened intervals and levels in observation bores.
| Bore | RWL (m AHD) | Screen (m) | Aquifer |
|---|
| Bore WRK853017 | 127.6 | 5 to 8 | Coonambidgal Fmn |
| Bore WRK853019 | 124.1 | 12 to 15 | Upper Shepparton Fmn |
| Bore WRK853018 | 124.0 | 26 to 29 | Lower Shepparton Fmn |
| Bore WRK853014 | 124.1 | 59 to 65 | Calivil Fmn |
Table 3.
Fergusons Bridge piezometer nest on Coonambidgal terrace, and nearby plain (853018).
Table 3.
Fergusons Bridge piezometer nest on Coonambidgal terrace, and nearby plain (853018).
| From (m) | To (m) | Lithology | Stratigraphy |
|---|
| 0 | 4 | Clay, brown | Coonambidgal Fmn. |
| 4 | 5 | Silt, light brown | |
| 5 | 6 | Gravel, brown | |
| 6 | 8 | Sand and gravel, grey | Bore WRK853017
Screen 5–8 m SWL |
| 8 | 9 | Clay, grey | Shepparton Fmn. |
| 9 | 11 | Clay, green and grey | (aquitard 8 to 11 m) |
| 11 | 12 | Clay and brown sand | |
| 12 | 17 | Sand, brown to red | Bore WRK853019
Screen 12–15 m |
| 17 | 19 | Clay, light grey | |
| 19 | 31 | Sand, fine-medium brown | Bore WRK853018
Screen 26–29 m |
Table 4.
Rates of water table rise across the upper Campaspe Valley 1900 to 1976 [
6,
7].
Table 4.
Rates of water table rise across the upper Campaspe Valley 1900 to 1976 [
6,
7].
| Position | Period | Rise (m/y.) |
|---|
| Goornong area | 1900 to 1957/58 | 0.24 |
| Midway between Goornong and Elmore | 1926 to 1976 | 0.2 |
| Diggora-Elmore area | 1925 to 1976 | 0.26 |
Table 5.
Comparison of depth to water in bores in the Marong Deep Lead (1904 to 1907) with that measured in new Bore 3 in 2018. The rate of water table rise is 0.23 m/y.
Table 5.
Comparison of depth to water in bores in the Marong Deep Lead (1904 to 1907) with that measured in new Bore 3 in 2018. The rate of water table rise is 0.23 m/y.
| Bore No | Bore Depth (m) | Water Level (m) * | Salinity |
|---|
| 33 | 56.4 | 49.1 | Brackish |
| 34 | 60.1 | 49.1 | Brackish |
| 37 | 73.5 | 49.4 | Brackish |
| 44 | 64.6 | 52.4 | Brackish |
| 45 | 185.4 | 53.7 | Brackish |
| 46 | 65.9 | 53.7 | Brackish |
| 11 | 61.0 | 55.5 | Brackish |
| 3 (2018) | 51.0 | 26 | Brackish |
Table 6.
Bores showing shallow perched groundwater (1907)—locality below.
Table 6.
Bores showing shallow perched groundwater (1907)—locality below.
| Bore | Depth (m) | Comment * |
|---|
| 75 | 21 | A freshwater soakage from a spring at 3.6 m but the bore was dry at 10.4 m |
| 76 | 18 | A freshwater soakage was encountered at 7 m but the bore was dry below 10 m |
| 78 | 12 | A freshwater spring was cut, but below 7 m, the bore was dry |
| 79 | 14 | A little fresh water was obtained from sand at 2.4 m, but below the strata was dry |
| 84 | 20 | Fresh water struck at 2.1 m. No water in strata below 3 m |
Table 7.
Hydrochemistry of shallow groundwater, groundwater outcrop and gravity seepage (mg/L).
Table 7.
Hydrochemistry of shallow groundwater, groundwater outcrop and gravity seepage (mg/L).
| | Dry Creek | Sand Pit | Site 2 | Site 4 | Site 5S | Site 5D |
|---|
| | G’Water
Outcrop | G’Water Outcrop | Aquifer | Aquifer | Aquifer | Seepage |
|---|
| Depth (m) | | | 2.4–3.0 m | 4.1–7.1 | 2.6–5.6 | 17 |
| TDS (mg/L) | 160 | 170 | 130 | 180 | 160 | 1900 |
| Chloride | 21 | 34 | 44 | 40 | 28 | 780 |
| pH | 6.1 | 5.8 | 6 | 5.9 | 6 | 5.7 |
| Sulphate (S) | < 5 | < 5 | 6.8 | 5.1 | 6.3 | 49 |
| Bicarbonate | 140 | 110 | 95 | 100 | 90 | 20 |
| Magnesium | 8 | 5.7 | 19 | 6.3 | 7.5 | 110 |
| Potassium | 6.6 | 7.1 | 30 | 4.6 | 8.2 | 150 |
| Sodium | 24 | 36 | 50 | 49 | 37 | 520 |
Table 8.
Lithology of Bore 10 (1904-7) alongside Bullock Creek with cemented channel sand and underlying pre-existing aquitard.
Table 8.
Lithology of Bore 10 (1904-7) alongside Bullock Creek with cemented channel sand and underlying pre-existing aquitard.
| Lithology | Thick (m) | From (m) | To (m) | Stratigraphy |
|---|
| Sand, brown | 4.88 | 0.00 | 4.88 | Coonambidgal Fmn |
| Clay, sandy, grey to yellow | 1.83 | 4.88 | 6.71 | |
| Sand and grit, cemented, brown | 1.52 | 6.71 | 8.23 | cemented channel sand |
| Clay, stiff, grey and yellow | 3.96 | 8.23 | 12.20 | Shepparton Fmn |
| Clay, sandy, white | 2.13 | 12.20 | 14.33 | |
Table 9.
Lithology of Bore 19 Section Line 2 shows distribution of ferruginous sand and pebble layers.
Table 9.
Lithology of Bore 19 Section Line 2 shows distribution of ferruginous sand and pebble layers.
| Bore 19 Section Line 2 | Thickness (m) | From (m) | To (m) |
|---|
| Clay, brown | 3.0 | 0.0 | 3.0 |
| Clays, sandy, light and dark brown | 2.4 | 3.0 | 5.5 |
| Clays, yellow and brown | 18.6 | 5.5 | 24.1 |
| Sand, quartz grit and ironstone... | 2.4 | 24.1 | 26.5 |
| Clays, sandy, yellow and grey... | 1.5 | 26.5 | 28.0 |
| Clay, with brown ironstone and slate pebbles | 0.6 | 28.0 | 28.7 |
| Clay, brown and sandy | 2.1 | 28.7 | 30.8 |
| Cement, ferruginous quartz | 6.4 | 30.8 | 37.2 |
| Clays, grey and yellow | 1.5 | 37.2 | 38.7 |
| Sands, white and yellow, with few pebbles | 1.5 | 38.7 | 39.3 |
| Gravel, with ironstone and quartz pebbles | 1.6 | 39.3 | 40.9 |
| Bedrock, white and yellow pipe clay (basement) | - | 40.9 | |
Table 10.
Lithology and stratigraphy of the Calivil Formation irrigation bore.
Table 10.
Lithology and stratigraphy of the Calivil Formation irrigation bore.
| Lithology | From (m) | To (m) | Stratigraphic Interpretation |
|---|
| Topsoil | 0 | 1 | Upper Shepparton Fmn |
| Clay | 1 | 12 | |
| Coarse sand | 12 | 18 | WT 12.7 m |
| Clay | 18 | 21 | |
| Coarse sand | 21 | 38 | Lower Shepparton Fmn |
| Clay | 38 | 39 | |
| Coarse sand | 39 | 66 | Calivil Fmn |
| Sand and wash | 66 | 78 | Screen 40.5 to 78 m |
Table 11.
Salinity, screened interval, and water levels of Loddon River, irrigation and observation bores (sampled on 10 June 2020).
Table 11.
Salinity, screened interval, and water levels of Loddon River, irrigation and observation bores (sampled on 10 June 2020).
| Source | TDS (mg/L) | Static Level (m) | From (m) | To (m) | Formation |
|---|
| Loddon River | 360 | | | | River |
| Ob bore 2 | 430 | 4.2 | 5 | 6 | Coonambidgal |
| Ob bore 3 | 370 | 4.3 | 5 | 6 | Coonambidgal |
| Ob ore 1 | 2800 | 4.2 | 10 | 13 | Shepparton |
| Irrigation bore | 1300 | 12.7 | 45 | 78 | Calivil |
Table 12.
Composite lithology and stratigraphy of Observation Bores 1 and 2 piezometer nest (see also
Figure 28).
Table 12.
Composite lithology and stratigraphy of Observation Bores 1 and 2 piezometer nest (see also
Figure 28).
| Lithology | From (m) | To (m) | Stratigraphy/Hydrology | Screen (m) | Salinity (mg/L) |
|---|
| Top soil–sandy silt | 0 | 1 | Coonambidgal Fmn | | |
| Brown fine sandy silt | 1 | 3 | Overbank deposits | | |
| Humic black clay | 3 | 5 | Channel fill deposits | | |
| Quartz pebbles in a matrix of black clay | 5 | 7 | Channel bed deposits | 5–6 m—OB 2 | 430 |
| Bluish black clay | 7 | 9 | Channel fill deposits (aquitard) | | |
| Brown sand and gravel | 9 | 13 | Shepparton
Formation | 10–13 m—OB 1 | 2800 |
Table 13.
Lithology of Bore 94114, Sandy Creek Baringhup.
Table 13.
Lithology of Bore 94114, Sandy Creek Baringhup.
| From (m) | To (m) | Lithology |
|---|
| 0 | 1 | Soil |
| 1 | 6.7 | Brown clay with gravel |
| 6.7 | 12.2 | River gravel with black clay and bands of blue pug |
| 12.2 | 18.3 | Yellow clay with gravels bands of blue pug and coarse quartz |
| 18.3 | 19.8 | Blue pug over river gravels and grey sandstone cobbles |


