1. Introduction
With the accelerated urbanization and rapid increase in the number of motor vehicles in China, road traffic accidents have become more frequent and urban traffic problems have become more aggravated in the country. Traffic accidents lead to road traffic congestion, which indirectly leads to increases in carbon dioxide emissions. The transportation industry accounts for about 10% of China’s carbon emissions, which is not conducive to environmental protection and economic development. In 2021, the death toll in traffic accidents in China was 61,703, the number of injuries in traffic accidents was 250,723 and the number of motor vehicle traffic accidents was 211,074 [
1]. The issue of road traffic safety is very serious, and the waste of resources due to traffic safety problems has become a major impediment to sustainable development.
Traffic safety evaluation can clarify possible safety problems for road users, reduce the incidence of traffic accidents, and improve the smoothness of road networks. To date, many scholars have conducted in-depth research exploring more effective traffic safety evaluation methods. Traffic safety evaluation is based on data mining and analysis by accident rate and accident severity degree. However, accident statistics are historic statistics that traffic management departments have compiled and analyzed [
2]. Traffic accidents happen for a variety of reasons and are random in nature, and there are omissions and deviations in the statistics of traffic accidents, so historic statistics cannot be used to accurately evaluate road traffic safety, and they may even produce misleading decisions regarding traffic management measures. Therefore, there are drawbacks and limitations to using statistical methods to analyze traffic accidents.
The traffic conflict technique, as a traffic safety analysis method, is important for preventing traffic accidents and can be used to improve traffic safety evaluation methods. However, most recent traffic conflict studies have explored the mechanisms of traffic conflict generation, evolution and application according to the laws of kinematics, with few studies having considered psychological changes in drivers (see
Section 2.2). In driving activities, the driver–vehicle–environment constitutes a dynamic closed-loop system, and the driver is the core element of the traffic system, as well as the direct recipient of the combined effects of the vehicle, road, and environment; further, the driver’s psychological changes are a direct reflection of these combined effects. Therefore, from the perspective of the field force and strength in psychological theory, this paper drew on the basic characteristics of physical fields in physics, combined with the kinematic principles of vehicles, to construct a psychological field model of drivers in traffic conflict environments, providing a new method for the psychological modeling of drivers. Exploring the differences between different temperament types (which include phlegmatic, sanguine, choleric and melancholic types), this method fills a gap in traffic conflict research on drivers, further reveals the mechanisms behind the generation and evolution of traffic conflict and provides more effective methods to avoid traffic conflicts. By improving the safety level of the road traffic system, the ultimate goal of sustainable development can be achieved.
2. Prior Research
2.1. Traffic Conflict Technique
Recently, traffic conflict research has mainly focused on the severity of traffic conflicts and the safety evaluation technique of traffic conflict.
The definition of traffic conflict based on risk avoidance behavior was first proposed by Perkins and Harris [
3], who defined traffic conflict and determined its occurrence based on the emergency braking and steering behavior of vehicles. Almqvist S [
4] established a comprehensive index based on the conflict speed and distance to the accident time to reflect the severity of potential accidents. Bagdadi [
5] considered the distance to the conflict time, relative vehicle speed, deceleration speed, vehicle mass, etc., to construct a composite index reflecting the conflict measure of accident severity. Guo Weiwei and Wang Nan [
6,
7] used kinematic principles to establish a critical conflict region for conflict occurrence by considering the speeds, distances, and angles of conflicting vehicles, and combined several factors to judge the conflict severity. In the above research, the driver factor was not considered. Based on this research gap, Xu Yi [
8] used drivers’ eye-movement indicators, as well as other physiological indicators, to reflect drivers’ subjective feelings about conflict, established a conflict identification method based on eye-movement characteristics, and further explored the psychological change process of drivers during conflict. Glauz W D et al. [
9] made a preliminary safety evaluation of road intersections by studying the relationship between the number of intersection conflicts and traffic accidents. Wang Dupiao [
10,
11] systematically described the current traffic conflict technology and established a safety evaluation method using traffic conflict techniques. Meng Q et al. [
12] combined the traffic volumes in construction zones to establish a rear-end conflict risk model based on the maximum deceleration rate of avoiding conflicts (DRAC). Lawalata G M [
13] evaluated the effectiveness of road facilities using the traffic conflict technique, and improved the design of intersections based on the evaluation results. Xiao Liying [
14] introduced the gray clustering evaluation model and periodic hazards into the traffic conflict hazard model to realize the comparison of the hazard degree between intersections and the comparison of the hazard degree in different time periods. Liu Miaomiao et al. [
15] proposed a method to determine the severity of vehicle conflicts at intersections by using video image processing technology, and verified this method using tests. Gettman D et al. [
16,
17,
18] used the traffic conflict software SSAM, combined with the traffic simulation software VISSIM, to realize the safety evaluation of intersections, as well as of traffic facilities. Liu Hong [
19] considered the effects of drivers, conflicting vehicles, traffic flow and other factors to establish a psychological field model for drivers based on the stimulus-sensitivity framework, and used the field strength intensity to judge the severity of conflicts.
2.2. Driver’s Psychological Field
The concept of the psychological field was proposed by psychologist Levin [
20] for describing human social behavior; this is a field formed between the human psyche and the objective material world, and which uses humans as field sources. At present, psychological field theory is widely used in teaching, mainly to study and analyze students’ behavior in learning, while psychological field theory is mainly applied to modeling driving behavior in transportation. Chen Kang [
21] proposed the concept of time distance and established the psychological field equipotential lines based on the psychological field theory, so as to obtain a framework of the psychological field model of drivers in the curved sections of highways. Mo Haiping [
22], in constructing a gravitational model of driver risk under multi-risk traffic scenarios, drew on the basic theory of psychological fields to study the gravitational interaction relationship between driving risk and drivers. Wang J [
23] and Mullakkal-Babu F A et al. [
24] analyzed the factors influencing driving risk and used the basic theory of psychological fields to establish a safety field model reflecting driving risk. Zhang T et al. [
25] applied psychological field theory to the theory of planned behavior to make the latter consistent with the behavioral characteristics of drivers. Li W et al. [
26] combined psychological field theory and mechanics to establish a two-dimensional traffic flow model by analyzing the forces on vehicles at highway toll stations in order to obtain the optimal solution for the design of toll station lane quantities. Based on psychological field theory, Kendrick A S [
27] used a stimulus-induced equilibrium point (SIEP) model to describe the interaction between drivers and vehicles in front and behind of them. Considering the intensity of the stimulus from the vehicle to the driver, the model provided sufficient reaction time for the driver to avoid a conflict. The above research results show that psychological field theory has been gradually applied to the field of transportation, facilitating the in-depth exploration of the psychological activities of drivers.
2.3. Electrocardiographic Characteristics of Drivers
Drivers’ electrocardiographic characteristics are mainly applied to the study of the effects on drivers of complex traffic environments and the characteristics of fatigue. In their study of the effects of complex traffic environments on drivers, Xiao D Q et al. [
28] evaluated changes in the patterns of tunnel illumination and drivers’ psychological states in 30 typical tunnels using illumination coefficients and heart rate growth. Wynne R A et al. [
29] used a driving simulator to simulate different traffic scenarios, and the simulation results showed that there was a correlation between drivers’ temperament and heart rate. Caffò A O et al. [
30] analyzed drivers’ biopsychological data through real-world experiments in complex traffic environments and obtained the characteristics of driver changes in different scenarios. In terms of the research on fatigue caused by driving, Yang Yushu [
31] conducted simulated driving experiments through a driving simulator, finding that the frequency domain index of the heart rate variability of the subjects and the degree of fatigue were significantly correlated, thus quantifying the drivers’ fatigue. Wang L et al. [
32] collected ECG and EMG signals from drivers based on portable real-time and non-contact sensors, collected heart rate and EMG data, and evaluated these effectively to establish a driver fatigue model. Yuhua W et al. [
33] used driving simulator experiments with an MP150 multi-channel physiological recorder to obtain drivers’ heart rate data in order to study the change characteristics of the heart rate index of drivers’ fatigue recovery time, determining the fatigue recovery time of different types of drivers.
In this paper, as research on driver psychology has been limited in the existing traffic conflict literature, and because of the current state of driver psychological field research and the traffic application of telepathy characteristics, a new psychological field model was constructed by quantifying the psychological changes in drivers while driving based on the field force and field strength theory of the psychological field. This model quantifies the heart rate changes in drivers in conflict with field strength, and calculates the threshold value of the field strength of drivers in conflict, which is used as the threshold point of driver conflict occurrence; further, this can be used as an indirect indicator to evaluate the severity of traffic conflict. The close integration of drivers’ psychological field research with the traffic system can promote the coordinated development of the human–vehicle–road framework in the traffic system, and provide new research ideas and methods for exploring the application of traffic conflict in road safety.
3. Research Method
3.1. Experimental Subjects
There are significant differences in heart rate changes among different drivers in the same conflict scenario [
34]. To reduce the individual differences caused by the characteristics of drivers, such as age, heart rate, and driving age, and to improve the accuracy of the experimental results, 60 subjects, aged between 22 and 29 years old, were recruited for the experiment. The subjects all met the following requirements:
Held a driving license with actual driving experience of at least one year.
Good physical health, normal vision, and no history of heart disease.
A heart rate range of 60–100 beats per minute, which is the heart beat range of a healthy adult under normal conditions.
Proficiency in the use of the driving simulator used in this experiment.
No bad driving habits such as changing lanes at will, answering calls while driving and not observing traffic rules; further, a good driving record and prone to no extreme emotional changes.
Adequate sleep and no consumption of coffee, alcohol or other stimulating beverages the day before the experiment.
3.2. Experimental Methods
In this paper, we used questionnaire, physiological index measurement and nonlinear regression methods to study the psychological changes in drivers in a conflict environment.
(1) Questionnaire method: the questionnaire method was used to investigate drivers’ temperaments and other basic information. According to related research [
35], a driver’s temperament type is closely related to their driving behavior, and drivers with different temperament types have different stress reactions, leading to different psychological effects. The temperaments of drivers are generally divided into four types: phlegmatic, sanguine, choleric, and melancholic. Phlegmatic drivers have rapid responses to stress and flexible operation skills, but poor self-control and low tolerance; sanguine drivers have a strong ability to adapt to environmental changes, rapid responses to stress, and better emotional self-control; choleric drivers are more cautious drivers, but have slower responses and slow movements; melancholic drivers have a poor ability to adapt to the environment and slow movements, but have strong observation and perception skills. Therefore, the temperament types of the subjects were investigated using the temperament scale [
36]. In addition, basic information of the subjects, such as gender, age, and driving age was collected in the questionnaire.
(2) Physiological index testing method: the MP150 multi-channel physiological recorder was used to test and collect the cardiac physiological signals of the subjects in real time during the experiment. The MP150 multi-channel physiological recorder has 16 analog data acquisition channels, which can accurately and reliably collect the heart rate values of drivers. Therefore, the heart rates of the subjects in the calm state were collected using the MP150 recorder, and the heart rates of the subjects in the test scenario were subsequently collected; the driving data from the driving simulator and the heart rate data of the subjects were recorded in real time.
(3) Nonlinear regression: Nonlinear functions were used to investigate the relations between a driver’s psychological field and the severity index of traffic conflict in order to obtain functional relationship models between them. These models can be used to verify the validity of using the psychological field to evaluate the conflict severity.
3.3. Experimental Scenarios
Four types of traffic conflict scenarios were built using UC-WinRoad software, namely the rear-end conflict test, cross conflict test, opposite-direction conflict test and construction conflict test. In each conflict test scenario, the road was uniformly set as four lanes in both directions, with a road width of 3.5 m and a central separation zone used.
(1) Rear-end conflict test
The subject drives at 20 km/h, 30 km/h, 40 km/h, 50 km/h, and 60 km/h, respectively, with a car in front of them at distances of 10 m, 20 m, and 30 m, respectively, and the car in front brakes randomly.
(2) Cross conflict test
The subject drives at 20 km/h, 30 km/h, 40 km/h, 50 km/h, and 60 km/h, respectively, and the conflict vehicle moves towards the subject’s vehicle with the same speed and conflict angle.
(3) Opposite-direction conflict test
The subject drives at 20 km/h, 30 km/h, 40 km/h, 50 km/h, and 60 km/h, respectively, and the conflict vehicle moves towards the subject’s vehicle at the same speed and conflict angle.
(4) Construction conflict test
The subject drives at 20 km/h, 30 km/h, 40 km/h, 50 km/h, and 60 km/h, respectively, and an obstacle is set at a distance of 200 m in front of them.
3.4. Investigation and Statistical Processing
The physiological data in this experiment were acquired by MP150 and the image acquisition data analysis software AcqKnowledge, manufactured by BIOPAC, USA. In the process, we used AcqKnowledge software for preliminary processing of ECG data, saving and counting the time periods required for the experiment, and then used the heart rate variability analysis software Kubios HRV for the analysis of heart rate data.
4. Psychological Field Model of The Driver
In order to quantify the psychological changes in drivers in traffic conflicts, drivers’ psychological responses to external objective stimuli were characterized by their physiological parameters by combining the principles and properties of fields in physics. The psychological field model of drivers in conflict environments was constructed to explore the psychological impact of traffic conflict types on drivers, and then to analyze the field strength change patterns of drivers in different conflict environments.
4.1. Construction of Driver’s Psychological Field Model
In the electric field model, the electric field exerts a force on the point charge placed in it. In an arbitrary electric field, the electric field strength is proportional to the electric field force and inversely proportional to the charge carried by the point charge, as shown in Equation (1).
In Equation (1), is the electric field strength, is the electric field force, and is the charge carried by the point charge.
In physics, a force is exerted on any object placed in a field. In an electric field, there is a force acting on a point charge placed in it. In a psychological field, a similar force is present, but the object of the force changes. A driver is affected by the combined effect of the road environment and the conflicting object vehicle in the act of driving, and this effect is called the psychological field force in this paper.
4.1.1. Influence of Road Environment
According to the research literature [
37], the influence of the road environment on the psychological field mainly includes the influence of driving visibility, the adhesion coefficient of the road surface and the curvature and slope of the road. The influence function of the road environment on the psychological field is shown in Equation (2).
where
is the influence function of the road environment on the psychological field;
,
,
and
indicate the influencing factors of driving visibility, adhesion coefficient of the road surface, and curvature and slope of the road, respectively;
indicates the weight coefficient of the influencing factors in the road environment, which takes a value between (0,1].
4.1.2. Influence of Driver Characteristics
According to the relevant research results [
38], the factors influencing the psychological field of drivers include age, gender, personality, emotion, risk perception, hazard perception, and driving purpose. The driver characteristics that influence the psychological field are mainly the driver’s temperament, driving experience, and psychological drive. The influence of the driver characteristics on the psychological field is quantified by the following mathematical expression:
where
denotes the influence function of the subject vehicle driver’s characteristics;
denotes the effect of the influencing factor of the driver’s temperament on the psychological field, which is explained in
Section 4.3;
denotes the effect of the influencing factor of the driver’s experience on the psychological field, represented by the driving time of the driver;
denotes the effect of the influencing factor of the driver’s psychological drive on the psychological field, which is affected mainly by the purpose of the driving activity;
denotes the effects of the influence weights of the driver’s temperament, driving experience and the driver’s psychological drive, respectively, on the psychological field, which take values between (0,1].
4.1.3. Influences of Conflicting Objects
The influences of conflicting objects on the driver include not only the influence of spatial location and travel speed, but also the influences of vehicle type, vehicle mass, and travel angle. According to the theory of the temporal distance function [
39], the formula of the influence of a conflicting object on the driver of the subject vehicle is as follows:
where
denotes the influence function of the conflicting object;
denotes the type correction coefficient for the influence of the object;
denotes the mass correction coefficient of the conflicting object;
denotes the speed of the subject vehicle;
denotes the speed of the object vehicle;
denotes the coordinate position of the subject vehicle;
denotes the coordinate position of the object vehicle;
denotes the relative speed difference between the subject vehicle and the object vehicle;
denotes the length of the line connecting the target vehicle and the center of the lateral object.
The driver is limited by the driving perspective during the driving process, as shown in
Figure 1. In the case of the conflicting object having the same speed, position and other attributes as the subject vehicle, the impact of the conflicting object on the driver is different in different directions. In the case of the conflicting parties having the same relative position and speed, the driver is most affected when the two vehicles drive in opposite directions.The driver is gradually affected as the direction of the conflicting object vehicle changes.
The driving angle of the conflict object and the driver’s degree of influence are negatively correlated. When the driving angle of both sides of the conflict
, the driver is most affected; when
, the driver is least affected. The relationship between the driving angle of the two sides in the conflict and the degree of influence is shown in
Figure 2.
Based on the above analysis, the relationship equation between the conflict angle and its influence on the conflict object is obtained, as shown in Equation (5).
where
is the driving angle of the two sides in the conflict.
4.1.4. Driver’s Psychological Field Model
According to the above analysis, the road environment, driver characteristics and conflicting object all have an impact on the driver’s psychological field. The driver’s psychological field model is shown in Equation (6) below.
where
denotes the field strength of the driver’s psychological field.
4.2. Heart Rate Change Pattern
4.2.1. Analysis of Heart Rate Indicators
Based on the data of the traffic conflict simulation experiment and the results of the Driving Popularity Scale questionnaire, the temperament types of the subjects were obtained. The specific temperament types of the subjects are shown in
Table 1.
The relationship between the driver temperament types and the driver heart rate growth rate was analyzed by quantifying the heart rate growth rates of the subjects in different conflict scenarios according to their driver temperament types, and the results are shown in
Table 2 and
Figure 3. (The numbers 1, 2, 3 and 4 on the horizontal scale in
Figure 3 represent rear-end conflict, cross conflict, opposite direction conflict and construction conflict, respectively).
From
Figure 3 above, it can be seen that in the same conflict scenarios, the sanguine drivers had the highest heart rate growth rates, while the phlegmatic drivers had the lowest heart rate growth rates.
4.2.2. Analysis of Conflict Severity and Heart Rate Patterns
The most common vehicle–vehicle conflict severity assessment index is the time to conflict index (TTC for short). Using the classification criteria of the TTC index [
40], for severe conflict, a TTC <1.0 s; moderate conflict, 1.0~1.6 s; a safe TTC > 1.6 s. The relationship between the severity of the traffic conflict and the drivers’ heart rate growth rates was analyzed in different conflict scenarios. The average value of the drivers’ heart rates in a calm state was used as the reference value, and the average value of the drivers’ heart rates 3 s before their taking avoidance measures in the event of a conflict was initially selected to calculate the drivers’ heart rate growth rates. According to data collected in the driving simulators when conflict occurred, the TTC was calculated and the mean values of the heart rate growth rates of the drivers under different conflict severity scenarios were obtained. The details are shown in
Table 3 and
Figure 4.
From
Figure 4 above, it can be seen that the drivers were affected by the conflict object in the opposite direction conflict scenario more than in the other conflict scenarios; the drivers’ heart rate growth rates were the lowest in the cross conflict scenario.
4.3. Calculation of the Field Strength of the Driver’s Psychological Field
From the experimental results, it is clear that the drivers’ temperament types had a significant effect on their heart rate growth rates; among the driver characteristics, only the effect of the temperament types was considered in this paper. According to the effect of a driver’s temperament on their heart rate [
41], this paper quantified the weights of the effects of the drivers’ temperament types on their mental fields. The specific values are shown in
Table 4.
According to the relevant research results [
42], the heart rate index, an effective characterization parameter of a driver’s psychological field, can directly reflect the process of the driver’s psychological changes. In the calculation of the model used in this study, the heart rate growth rates of the drivers were used as a characterization parameter of the drivers’ temperaments. The driving visibility, adhesion coefficient of the road surface, curvature of the road, slope, drivers’ heart rate growth rates and kinematic parameters of the conflict vehicle obtained from the simulation were analyzed and calculated to obtain the calculated values of the drivers’ psychological field strength in different conflict scenarios. The specific results are shown in
Table 5 and
Figure 5. (The numbers 1, 2, 3, 4 on the horizontal scale in
Figure 5 represent rear-end conflict, cross conflict, opposite direction conflict and construction conflict, respectively).
As shown in
Figure 5 and
Table 5 above, the characteristics of the field strength of the psychological field in different conflict scenarios were as follows.
(1) In different conflict scenarios, the mean values of the drivers’ mental field strength showed significant differences. The mean value of the drivers’ psychological field strength was the largest in the opposite-direction conflict; the mean value of the driver’s psychological field strength was the smallest in the construction conflict. The main reason for this was that the drivers’ heart rate growth rates were the largest in the opposite-direction conflict. Further, considering the dual influences of speed and distance, the conflict object had the smallest psychological field strength in the process of its impacting a stationary object because it was stationary and had less influence on the driver in terms of speed.
(2) In the opposite-direction conflict scenario, the standard deviation of the field strength of the mental field was the largest, which indicates that the dispersion of the field strength was larger in the opposite-direction conflict scenario than in the other conflict scenarios. Meanwhile, in the impact on the stationary object scenario, the standard deviation of the field strength was the smallest, which indicates that the dispersion of the field strength was smaller in the impact on the construction conflict scenario than in the other conflict scenarios. The test results indicate that the drivers’ stress responses also showed significant variability when they faced different conflict types.
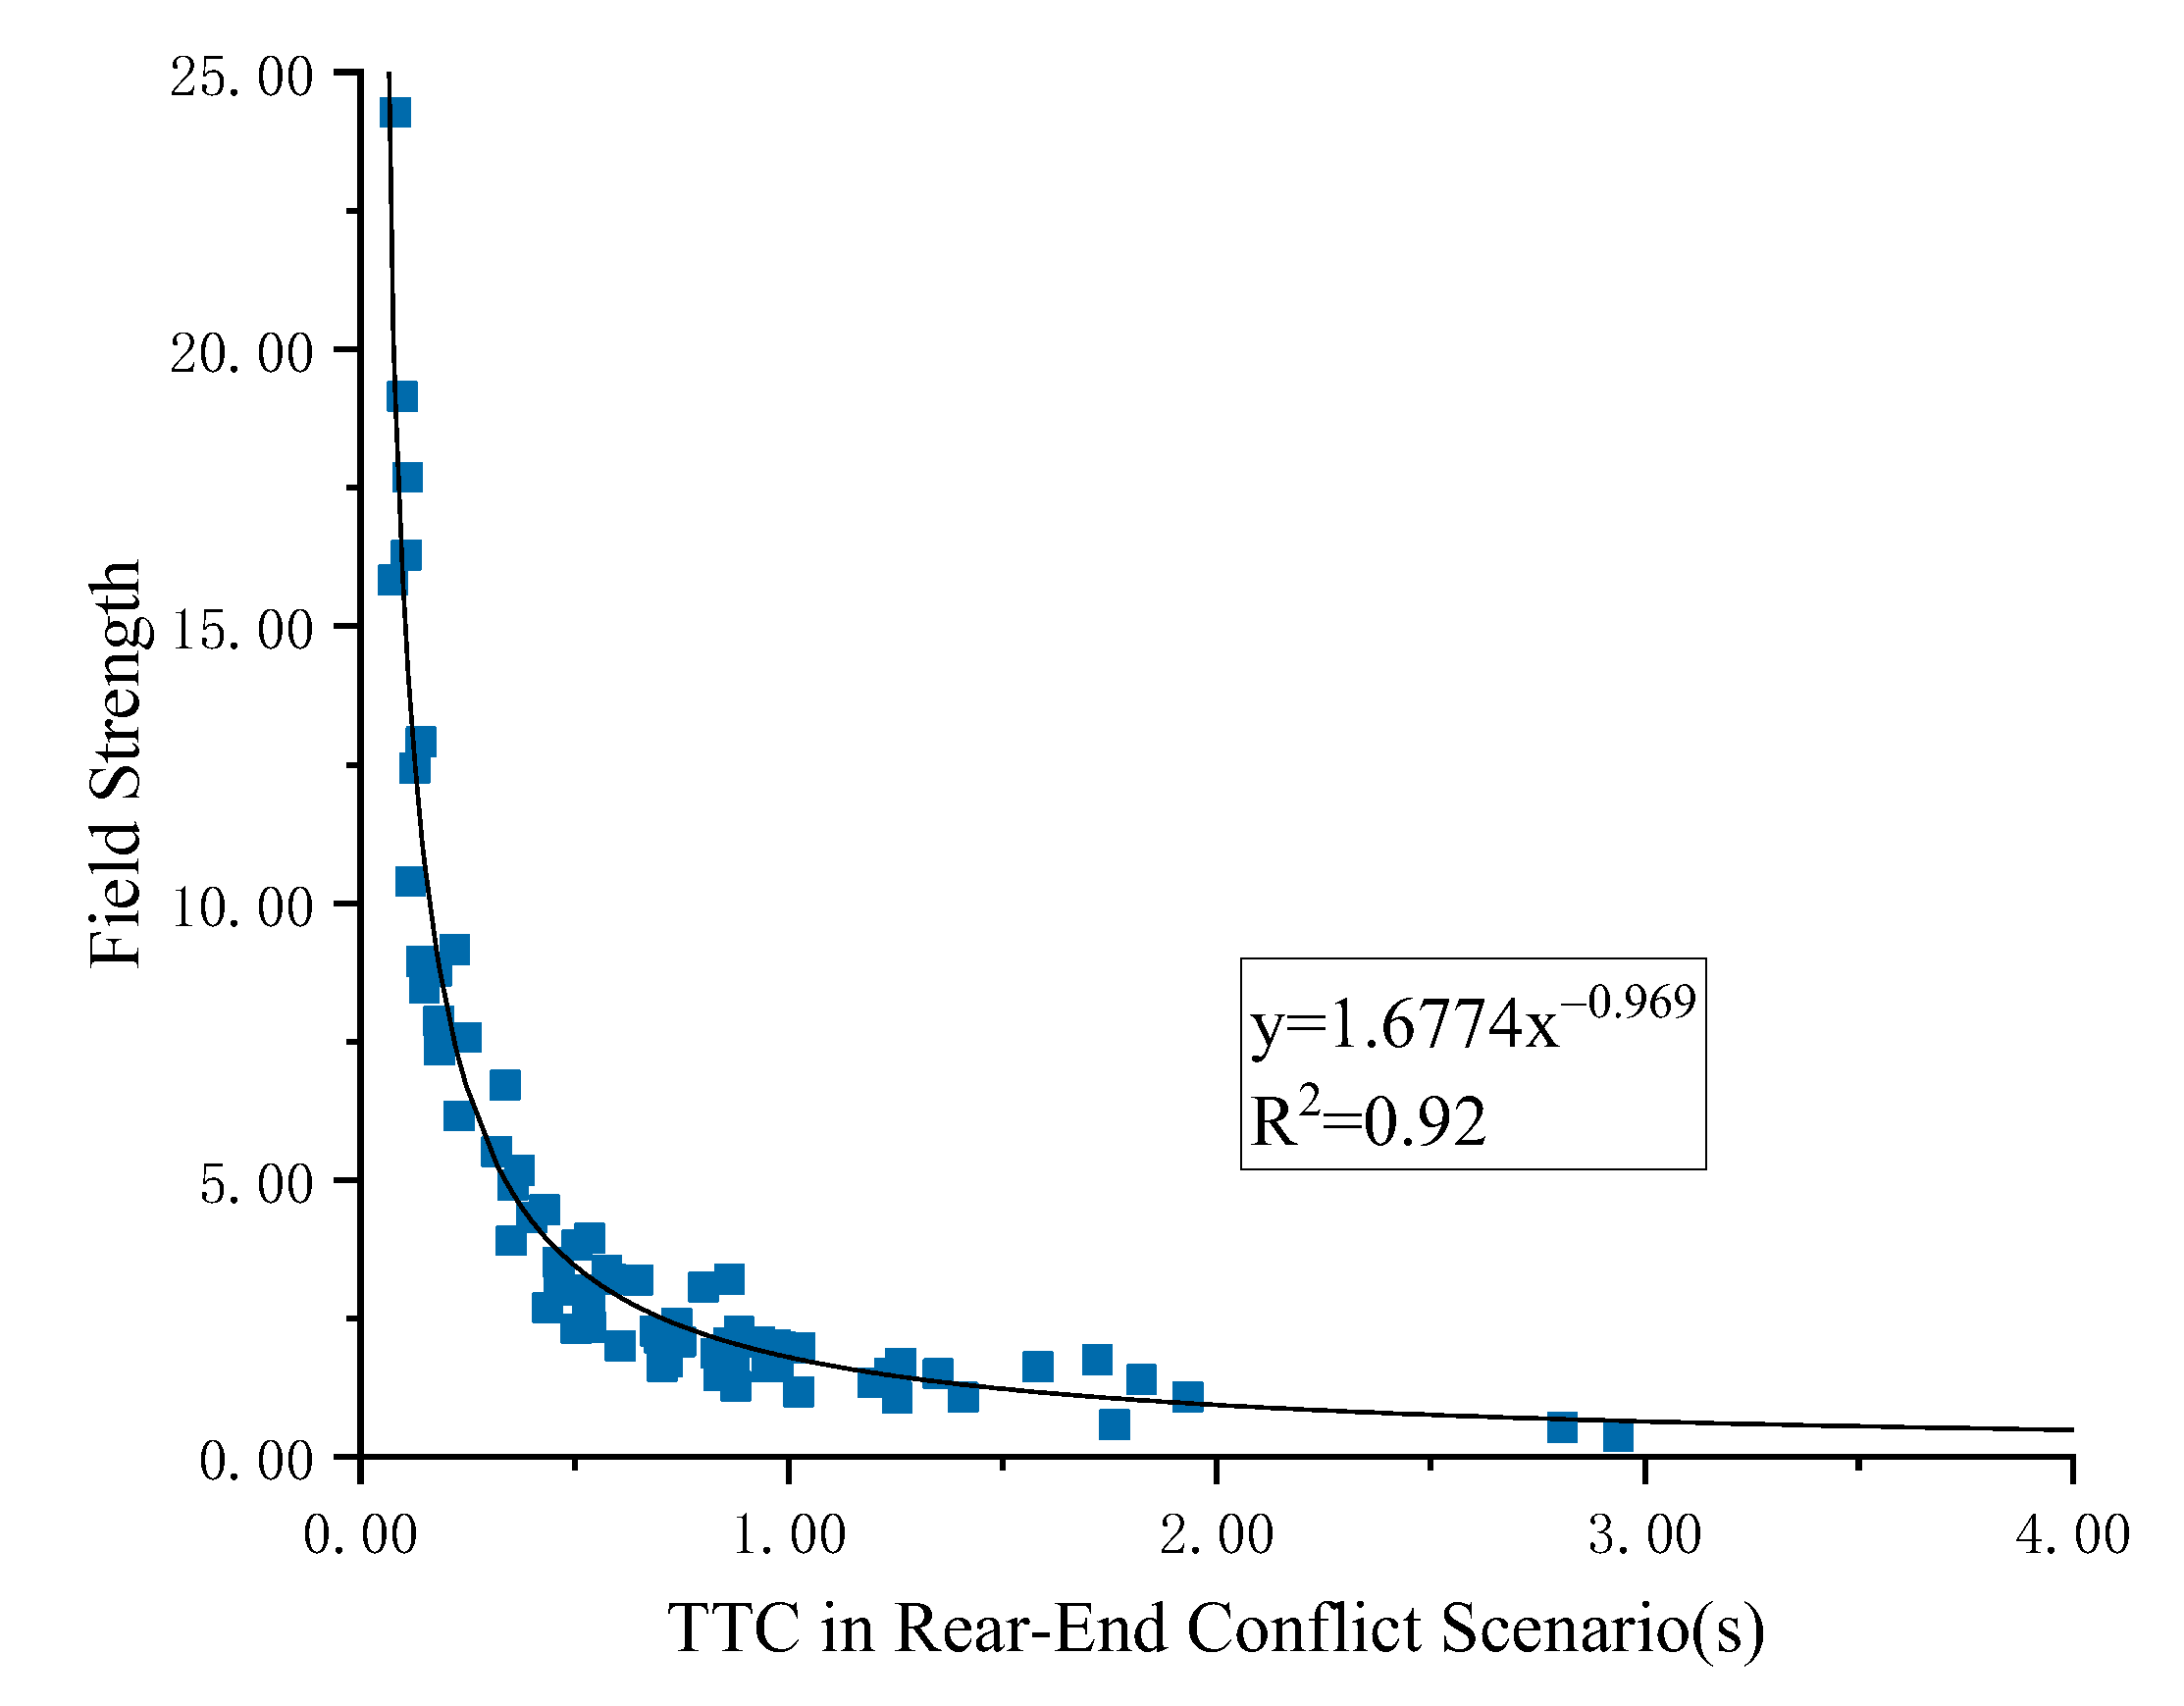
4.4. Validation of Psychological Field Model
To verify the validity of the concept of the field strength of a driver’s psychological field, the relationship between the traditional conflict severity index, the TTC index, and the psychological field strength was explored based on the field strength values obtained in the experiment, so as to verify the validity of the field strength evaluation of conflict severity, as shown in
Figure 6,
Figure 7,
Figure 8 and
Figure 9 below.
According to the above scatter plots of the field strength and the TTC index, a function model of the relationship between the TTC index and the field strength was obtained by using the regression analysis method as follows.
(1) In the rear-end conflict scenario, the model equation of the relationship between the TTC index and the field strength was as follows.
(2) In the cross conflict scenario, the relationship between the TTC index and the field strength was modeled as follows.
(3) In the opposite-direction conflict scenario, the model equation of the relationship between the TTC index and the field strength intensity was as follows.
(4) In the impacting construction conflict scenario, the relationship between the TTC index and the field strength intensity was formulated as follows.
The validity of the driver’s psychological field model was demonstrated by the model of the relationship between the TTC index and the psychological field strength.
Using the severity criteria of the TTC, the range values of the field strength intensity in the different conflict scenarios were further divided, and the range values of the field strength for the traffic conflict severity were obtained. The details are shown in
Table 6.
5. Discussion
In this study, the mechanism of the effect of three factors, namely the road environment, driver characteristics and conflict object, on a driver’s psychological field was analyzed.
The drivers’ psychological fields were found to be influenced by the road environment. The road visibility, road curvature and road slope were positively related to the drivers’ psychological field strength; the road adhesion coefficient was negatively related to the drivers’ psychological field strength. The above findings are consistent with the previous analysis and the existing research results.
The driver is the source of their psychological field. Regarding the driver characteristics, the ranges of the psychological fields formed by drivers with different characteristics were different. Driver temperament RPP had an impact on the field strength of the drivers’ psychological fields. In the same conflict scenario, drivers with different temperament types showed significant differences in their heart rate growth rates, with sanguine drivers having the highest heart rate growth rates and choleric drivers having the lowest heart rate growth rates.
Regarding the conflicting object, the psychological field is a mathematical abstraction of a driver’s psychological stress in response to changes in their external environment during the driving process. Psychological stress is related to the traffic object in the external environment, i.e., it is closely related to the relative position and relative speed of the object. The smaller the relative spatial distance of the object from the subject vehicle, the greater the speed of the object, and the higher the driver’s attention to the object vehicle, that is, the greater the degree of pressure from the object, the greater the psychological pressure produced by the driver, and the larger the field strength formed in their psychological field. Conversely, the farther the object is from the subject vehicle, the lower the object’s relative speed, the lower the driver’s degree of concern for the object, the lower the degree of pressure caused by the object, and the smaller the field strength formed in the driver’s psychological field.
6. Conclusions
This study used regression analysis and the traffic conflict technique to construct a model of a driver’s psychological field in a conflict environment, and analyzed the changes in the psychological field strength of drivers in different conflict environments. Further, the study used the constructed model to investigate the effect of the mechanism of the influences of different driver temperament types on the psychological field under four traffic conflict scenarios.
(1) The four scenarios, namely the rear-end conflict, cross conflict, opposite-direction conflict and construction conflict scenarios, were simulated using an MP150 multi-channel physiological recorder. The heart rate growth rates of the drivers in each conflict scenario were investigated according to their temperament types. In the same conflict scenario, the heart rate growth rates of the sanguine drivers were the highest and the heart rate growth rates of the choleric drivers were the lowest. Further, the relationship between the severity of conflict and the heart rate growth rates of the drivers in the different conflict scenarios was analyzed. In opposite-direction conflict, the drivers were influenced most by the conflict object; in cross conflict, the drivers had the lowest heart rate growth rates.
(2) Using the constructed driver’s psychological field model, the drivers’ heart rate changes in the conflict scenarios were quantified. The intensity of a driver’s psychological field reflects the driver’s degree of stimulation by the traffic conflict, and indirectly reflects the severity of the conflict from the driver’s perspective.
(3) Based on the data obtained from the driving simulator, the psychological field intensity values of the drivers in different conflict scenarios were calculated. An existing conflict severity index, the TTC index, was used to validate the psychological field model, and the regression function of the TTC and field strength was established, which in turn verified the validity of the psychological field model. Further, the field strength range values of the drivers, corresponding to safe, moderate and severe conflict in the different conflict scenarios, were obtained.
7. Application and Suggestions
This study considered the changes that occur in drivers’ psychological fields in traffic conflict environments and explored drivers’ field strength range values according to traffic conflict severity. The model constructed in the paper can be applied to other conflict types in different conflict scenarios.
(1) The road environment has a great psychological impact on a driver. In this paper, various factors in the road environment, namely the driving visibility, road curvature, road slope and road surface adhesion coefficient, were considered to influence the psychological fields of drivers. Drivers are familiar with various road environments, which is conducive to the improvement of overall road safety. However, this paper only discussed the influence of the road environment with fixed parameters on drivers’ psychological fields, a shortcoming which will be improved upon in terms of the parameter settings at a later stage.
(2) The driving simulator used in this paper is safe and easy to use to set experimental conditions. It can safely carry out tests of dangerous driving conditions and tests and training under extreme conditions; further, the driving simulator features environmental settings and can carry out setting changes, such as changes to vehicle characteristics, road conditions, roads, and obstacles, which eliminates the need for carrying out a large number of actual tests, which in turn saves money. However, there are errors in the traffic conflict scenes simulated by the driving simulator; therefore, it is necessary to focus on upgrading and optimizing the simulation scenes in the future in order to simulate more realistic traffic conflict scenes.
(3) This paper considered the effects of four types of roadway traffic conflict on drivers’ psychological fields, namely rear-end conflict, cross conflict, opposite-direction conflict, and construction conflict, covering the basic types of traffic conflict on urban roadways. Kinematic parameters such as the relative speeds, distances and angles of the conflicting vehicles were obtained, which laid a solid research foundation for the later work.
Author Contributions
Conceptualization, S.G. and S.F.; methodology, S.G. and S.F.; software, T.Z. and S.F.; validation, S.G. and S.W.; formal analysis, S.G. and Y.C.; investigation, Q.Z., Q.X. and L.Y.; resources, S.G. and Y.C.; data curation, S.G. and S.F.; writing—to riginal draft, T.Z. and S.F.; preparation, S.G. and Y.C.; writing—review and editing, S.G. and S.F.; visualization T.Z. and S.F.; supervision, S.G. and Y.C.; project administration S.F.; funding acquisition, S.G. All authors have read and agreed to the published version of the manuscript.
Funding
The National Student Innovation and Entrepreneurship Project of Suzhou University (No. 202210379058); the Student Innovation and Entrepreneurship Training Program of Suzhou University (No. KYLXYBXM22-066); the New Engineering Pilot Project of Suzhou University (No. szxy2018xgk04); the Key Research Project of Suzhou University (No. 2021yzd10); the Green Mine Research Center of Suzhou University (No. 2021XJPT53); the Academic Funding for Top-talents in Disciplines of Universities in Anhui Province (No. gxbjZD2022075); the Industry-University-research Cooperative School-running Project of Ministry of Education (No. 220502746033110).
Institutional Review Board Statement
Not applicable.
Informed Consent Statement
Informed consent was obtained from all subjects involved in the study. Written informed consent has been obtained from the patient(s) to publish this paper.
Data Availability Statement
Data available on request due to restrictions eg privacy or ethical. The data presented in this study are available on request from the corresponding author. The data are not publicly available due to the acquisition of data requires a lot of experiments and demonstration.
Conflicts of Interest
The authors declare no conflict of interest.
References
- Tian, Z.; Sun, Z. Study on the Influencing Factors and Management Countermeasures of Death Toll for Road Traffic Accidents in China. J. People’s Public Secur. Univ. China (Sci. Technol.) 2022, 28, 38–44. [Google Scholar]
- He, Y.; Yang, X.; Wu, B.; Zhong, M.; Yan, X. A Comparison of Statistical Survey Metheds of Traffic Accident Data Between China and the United States. J. Transp. Inf. Saf. 2018, 36, 1–9+27. [Google Scholar]
- Perkins, S.R.; Harris, J.L. Traffic conflict characteristics-accident potential at intersections. Highw. Res. Rec. 1968, 31, 225–237. [Google Scholar]
- Almqvist, S.; Hydén, C.; Risser, R. Use of speed limiters in cars for increased safety and a better environment. Transp. Res. Rec. 1991, 22, 131–148. [Google Scholar]
- Bagdadi, O. Estimation of the severity of safety critical events. Accid. Anal. Prev. 2013, 50, 167–174. [Google Scholar] [CrossRef]
- Guo, W.; Qu, Z.; Wang, D. Traffic conflict discrimination model. J. Jilin Univ. Eng. Technol. Ed. 2011, 41, 35–40. [Google Scholar]
- Wang, N. Research on Traffic Conflict Model Based on Critical Conflict Region. Master’s Thesis, North China University of Technology, Beijing, China, 2014. [Google Scholar]
- Xu, Y. Research on Driver’s Eye Movement Characteristics for Road Segment Traffic Conflict Identification. Master’s Thesis, Jilin University, Changchun, China, 2016. [Google Scholar]
- Glauz, W.D.; Bauer, K.M.; Migletz, D.J. Expected traffic conflict rates and their use in predicting accidents. Transp. Res. Rec. 1985, 28, 131–145. [Google Scholar]
- Wang, D. Research on Safety of Urban Road Near Intersection based on Traffic Collision Technology; Chongqing Jiaotong University: Chongqing, China, 2018. [Google Scholar]
- Xue, S. Vehicle convergence model and its application in Urban Road Operation Area based on Traffic Conflict Technology. Master’s Thesis, Beijing Jiaotong University, Beijing, China, 2016. [Google Scholar]
- Meng, Q.; Weng, J. Evaluation of rear-end crash risk at work zone using work zone traffic data. Accid. Anal. Prev. 2011, 43, 1291–1300. [Google Scholar] [CrossRef]
- Lawalata, G.M.; Agah, H.R. Traffic conflict analysis as a road safety diagnostic tool for urban road facilities. Int. J. Technol. 2011, 21, 5–17. [Google Scholar]
- Xiao, L. Research on TCT based Safety Evaluation of Urban Road Intersections. Master’s Thesis, Chongqing Jiaotong University, Chongqing, China, 2015. [Google Scholar]
- Liu, M.; Lu, G.; Wang, Y. Quantitative method of traffic conflict severity at intersection. J. Transp. Eng. 2012, 12, 120–125. [Google Scholar]
- Gettman, D.; Head, L. Surrogate safety measures from traffic simulation models. Transp. Res. Rec. J. Transp. Res. Board 2003, 1840, 104–115. [Google Scholar] [CrossRef]
- Huang, F. Study on Indirect Traffic Safety Evaluation Method based on SSAM. Master’s Thesis, Southeast University, Nanjing, China, 2012. [Google Scholar]
- Ye, H.; Liao, C. Evaluation of Traffic Safety at Grade Intersection Based on SSAM. Urban Road Bridge Flood Control. 2016, 4, 5–8. [Google Scholar]
- Liu, H.; Bai, H.; Liu, T. Physical model construction of driver’s psychological field in traffic conflict environment. Auto Time 2016, 4, 50–55. [Google Scholar]
- Le, W.; Zhu, P. Principles of Topological Psychology; Peking University Press: Beijing, China, 2011. [Google Scholar]
- Chen, K.; You, F.; Li, Y. A Study on Modeling and Simulation of Car-following on Curve Sections of Highways Based on Field Theory in Psychology. J. Transp. Inf. Saf. 2016, 6, 77–82. [Google Scholar]
- Mo, H. Research on the construction of driver risk gravity model under multi risk traffic scenarios. Master’s Thesis, Kunming University of Science and Technology, Kunming, China, 2016. [Google Scholar]
- Wang, J.; Wu, J.; Li, Y. The Driving Safety Field Based on Driver–Vehicle–Road Interactions. IEEE Trans. Intell. Transp. Syst. 2015, 16, 2203–2214. [Google Scholar] [CrossRef]
- Mullakkal-Babu, F.A.; Wang, M.; Farah, H.; van Arem, B.; Happee, R. Comparative assessment of safety indicators for vehicle trajectories on highways. Transp. Res. Rec. 2017, 2659, 127–136. [Google Scholar] [CrossRef]
- Zhang, T.; Wang, J. Human reliability analysis of traffic safety. In Proceedings of the International Conference on Man-Machine-Environment System Engineering; Springer: Berlin/Heidelberg, Germany, 2013; pp. 491–498. [Google Scholar]
- Li, W.; Nie, Y.; Yang, Z.; Zheng, S.; Wang, D. Research on two-dimensional traffic flow model based on psychological field theory. arXiv 2017, arXiv:1711.05254. [Google Scholar]
- Amezquita, S.K.; Chen PC, Y.; Chen, W.; Zhao, Z. Stimuli-induced equilibrium point: A psychological field theory application in ramp merging systems. In Proceedings of the 2017 17th International Conference on Control, Automation and Systems (ICCAS), Jeju, Republic of Korea, 18–21 October 2017; pp. 825–830. [Google Scholar]
- Dai-quan, X.; Zhen-wu, S.; Xue-cai, X.U. Impact of Virescence at Expressway Tunnel Portal on Driver’s Psychology. J. Highw. Transp. Res. Dev. 2016, 33, 101–106. [Google Scholar]
- Wynne, R.A.; Beanland, V.; Salmon, P.M. Systematic review of driving simulator validation studies. Saf. Sci. 2019, 117, 138–151. [Google Scholar] [CrossRef]
- Caffò, A.O.; Tinella, L.; Lopez, A.; Spano, G.; Massaro, Y.; Loisi, A.; Stasolla, F.; Catanesi, R.; Nardulli, F.; Bosco, A. The drives for driving simulation: A scientometric analysis and a selective review of reviews on simulated driving research. Front. Psychol. 2020, 11, 917–930. [Google Scholar] [CrossRef]
- Yang, Y. Ergonomic analysis and quantitative evaluation of driving fatigue. Master’s Thesis, Shanghai Jiaotong University, Shanghai, China, 2002. [Google Scholar]
- Wang, L.; Wang, H.; Jiang, X. A new method to detect driver fatigue based on EMG and ECG collected by portable non-contact sensors. Promet-Traffic Transp. 2017, 29, 479–488. [Google Scholar] [CrossRef]
- Yuhua, W.; Chunhua, Q.I.; Zhu, S.; Xie, S.; Zhao, T. Study on driving fatigue recovery time based on ECG analysis. China Saf. Sci. J. 2017, 27, 7–19. [Google Scholar]
- Feng, Z.; Yang, M.; Zhang, W.; Du, Y.; Bai, H. Effect of longitudinal slope of urban underpass tunnels on drivers’ heart rate and speed: A study based on a real vehicle experiment. Tunn. Undergr. Space Technol. 2018, 81, 525–533. [Google Scholar] [CrossRef]
- Wen, H.; Sze, N.N.; Zeng, Q.; Hu, S. Effect of music listening on physiological condition, mental workload, and driving performance with consideration of driver temperament. Int. J. Environ. Res. Public Health 2019, 16, 2766. [Google Scholar] [CrossRef]
- Zhang, X. Study on the Evolution Mechanism of Unsafe Behavior Under the Coupling Effect of Multiple Psychological Fields. Master’s Thesis, Tianjin University of Technology, Tianjin, China, 2018. [Google Scholar]
- Tang, X.; Zhou, P.; Wang, P. Real-time image-based driver fatigue detection and monitoring system for monitoring driver vigilance. In Proceedings of the 2016 35th Chinese Control Conference (CCC), Chengdu, China, 27–29 July 2016; pp. 4188–4193. [Google Scholar]
- Xu, Q. Research on Optimization and Application of Driver Risk Gravity Model. Master’s Thesis, Kunming University of Science and Technology, Kunming, China, 2017. [Google Scholar]
- Chen, S. Study on the Characteristics of Illegal Riding Behavior in Electric Bicycle-Motor Vehicle Conflict at Signalized Intersection. Master’s Thesis, Chang’an University, Xi’an, China, 2020. [Google Scholar]
- Zhang, Y.; Long, K.; Gu, J. Safety Assessment of non-traffic Conflict at signalized Intersection. Traffic Sci. Eng. 2021, 37, 98–106. [Google Scholar]
- Jiang, J.; Lu, J. An Analysis of Driving Experience and Temperament Types on Driving Behaviors. J. Transp. Inf. Saf. 2015, 33, 59–64. [Google Scholar]
- Duan, L. Evaluation of Driver Mental Load and Its Application in Assisted Driving System. Master’s Thesis, Jilin University, Changchun, China, 2013. [Google Scholar]
| Disclaimer/Publisher’s Note: The statements, opinions and data contained in all publications are solely those of the individual author(s) and contributor(s) and not of MDPI and/or the editor(s). MDPI and/or the editor(s) disclaim responsibility for any injury to people or property resulting from any ideas, methods, instructions or products referred to in the content. |
© 2023 by the authors. Licensee MDPI, Basel, Switzerland. This article is an open access article distributed under the terms and conditions of the Creative Commons Attribution (CC BY) license (https://creativecommons.org/licenses/by/4.0/).


 ,
, 


