Article

Prediction and Evaluation of Ecosystem Service Value Based on Land Use of the Yellow River Source Area

1
Department of Geological Engineering, Qinghai University, Xining 810016, China
2
Provincial Key Laboratory of Cenozoic Resources and Environment on the Northern Rim of the Qinghai-Tibet Plateau, Qinghai University, Xining 810016, China
*
Author to whom correspondence should be addressed.
Sustainability 2023, 15(1), 687; https://doi.org/10.3390/su15010687
Submission received: 18 October 2022 / Revised: 25 December 2022 / Accepted: 27 December 2022 / Published: 30 December 2022
(This article belongs to the Special Issue Bringing Ecosystem Services into Decision-Making)

Abstract

:
Land-use change plays an important role in ecological change; knowing the trends in land-use change can quickly help identify problems in regional ecosystems. In 2000 to 2020, the development of a global economy caused increasing extreme weather events worldwide and lead to exacerbating changes in types of land-use. The Yellow River source area is an important water source and a central part of ecological protection efforts in China. The fragile ecosystems make the area sensitive to environmental changes. Therefore, in protecting the ecological security of the basin, simulating changes in the ecosystem service value under different scenarios is a meaningful procedure. A patch-generating land use simulation model was used to simulate different land use scenarios in 2030, including an ecological protection scenario, a production priority scenario, a carbon neutral scenario and a natural development scenario. The analysis shows that significant progress has been made in water conservation but grassland conservation faces enormous challenges. The rate of development, occupation of farmland and land dedicated to construction has increased. Unused land increased dramatically from 2010–2020 and has not been mitigated by existing policies. Based on the unit area value equivalent coefficients, the ecosystem service value rankings for the seven land use types were as follows: Grassland > Wetland > Water Area > Forest > Farmland > Unused Land > Construction Land; the four types of ecosystem service value are ranked as follows: regulating services > supporting services > supply services > cultural services; the four scenarios of ecosystem service value are ranked as follows: ecological protection scenario > production priority scenario > carbon neutral scenario > natural development scenario. The ecosystem service value of the Yellow River source area would increase by CNY 1.641 billion in 2030 with ecological protection goals and decrease by CNY 1.421 billion with the current of development. This study provides valuable insights and implications for land use, ecological protection and sustainable development by shedding light on watershed change issues and assessing and predicting the ecological status of the Yellow River source area.

1. Introduction

The ecosystem is an important link between humans and the earth [1]. Ecosystem services (ES) are the benefits that humans derive from ecosystems, arising from biotic and abiotic interactions [2]. They absorb carbon dioxide generated from human activities and provide food and water to help humans survive and thrive [3,4]. ES include provisioning services, regulating services, supporting services and cultural services [2]. Different land use types contribute to various ES. For example, water areas and wetlands play an important role in hydrological regulation and the water supply, and forests are indispensable in terms of climate and hydrological regulation [5]. With the development of human society, the intensification of land uses and the acceleration of urbanization, human activities have an increasing impact on the natural environment [6]. In the past, biodiversity and ES were considered as free ‘commodity’ and, as a result, the uncontrolled exploitation of resources by people has destroyed ecosystems [N1]. Nowadays, humans have been paying attention to ES due to the climate changes and dramatic resource depletion, and they have realized the real value that ES contribute to society. Thus, the costs of ecosystem degradation and its effect on the supply of ES has also been properly accounted for [7,8]. Costanza et al. [1] quantified the value of global ecosystems in 1997. Subsequently, the calculation of ecosystem service value (ESV) has been increasingly accepted as a method of ecological asset valuation [9] to help the straightforward assessment and management of ecosystems by decision-makers [10,11]; quantifying ES in monetary terms can provide reliable data support for decision-makers working on the rational planning of regional development [12]. Meanwhile, further exploration of the spatial distribution, composition and influencing factors of regional ecosystems as well as ESV trends has played a significant role in coordinating the regional management of ecosystems [13,14]. According to characteristics of the environment in China, Xie et al. [15] have made an equivalence table of ESV per unit area of China terrestrial ecosystems. Chinese researchers subsequently studied the spatial and temporal variation [16,17], spatial relationships [18,19] and influencing factors [14] of ESV in different regions based on land use data. Their efforts have supported the enactment of ecological conservation policies and the scientific management of the region, and the continuous waste of global ecological resources and the ongoing decline in ecological services has been mitigated by their research.
Land use or land cover change and the impacts of climate change on ecosystems have been the focus of the International Human Dimensions Programme on Global Environmental Change (IHDP) [20]. Land use change is a consequence of human activities and changes in the natural environment. It can transform the ecosystem structure and function, thereby affecting the capacity and value of ecosystem services. Currently, scholars have mainly focused on the relationship between spatial and temporal changes in land use types [21,22], land use patterns [23,24], land use intensity [25,26] and changes in ecosystem service. The above studies are important guides for advancing ES research. For future development of the Yellow River source area (YRSA), scenario modelling is needed. Cellular automata (CA) are the basis of current land use simulation models. Based on CA algorithms, scholars have proposed CA-Markov [27], CLUE-S [27], GeoSOS [28], FLUS [29] and PLUS (patch-generating land use simulation) [30]. Scholars have used these methods to predict the situations of future land use and evaluate regional ecosystem development. The advantage of the PLUS model is that it can dynamically simulate land-use patch shifting with high accuracy through a land expansion analysis strategy and a multi-class stochastic patch seed growth mechanism [31].
Located at the northeastern end of the Qinghai–Tibet Plateau, the YRSA is the largest flow-producing area in the Yellow River basin. It is also the most important ecological function area and major recharge area for China’s freshwater resources, and a sensitive and important initiation area for climate change in Asia, the northern hemisphere and even globally. Due to the special geographical location, rich natural resources and important ecological functions, the YRSA has become one of the most important watersheds in northwest China. The development and stability of the middle and lower reaches of the Yellow River makes a major contribution to maintaining national ecological security. In recent decades, significant changes in land use have occurred in the YRSA due to global warming and the intensification of human activities on the Qinghai–Tibet Plateau [32]. Changes in natural climatic factors (e.g., precipitation, temperature) have a direct impact on the direction and number of land use types. Climate change leads to higher regional temperatures and increased precipitation. On the one hand, it causes a longer vegetation growing season, increased grass production and an overall improvement in land cover [33,34,35]. On the other hand, the increasing temperature leads to the thawing of the glacier, the decrease in grassland, the increase in soil erosion and unused land [36,37,38,39]. Social development has also had an important impact on the shift in land use types in the YRSA. Accelerated urbanization, increased population and increased intensity of human activities such as overgrazing have led to an increase in the area of construction land, farmland and wasteland along with a decline in the grassland [40,41,42,43]. It is necessary to estimate land use changes and their corresponding ESVs in the past and future of the YRSA [44,45] in order to promote ecological environmental protection and sustainable development of natural resources in the YRSA. In this study, regional differences were considered and the ESV per unit area equivalence table for terrestrial ecosystems in China was revised using data from the YRSA to form an ESV per unit area equivalence table applicable in YRSA. Using the PLUS model, four scenarios were constructed to assess the changes in ESV in the YRSA under different development goals. There are three research goals: (1) study the spatial and temporal characteristics of land use in the YRSA from 2000 to 2020 based on the data selected from the land use transfer matrix model; (2) improve the equivalent factor table of Xie et al. [15] to calculate the trend of ES changes in the YRSA in 2000, 2010, 2020 and 2030; (3) define four scenarios based on the regional characteristics of the YRSA and simulate the changes in spatial distribution of land use in the YRSA in 2030 based on the PLUS (Patch-generating land use simulation) model. This study provides a scientific and theoretical basis for the strategic goals of ecological conservation and sustainable social development in the Yellow River source area. Meanwhile, these results are expected to provide some references for the future land use planning and management of the YRSA as well as the construction of ecological civilization in other ecologically sensitive areas.

2. Materials and Methods
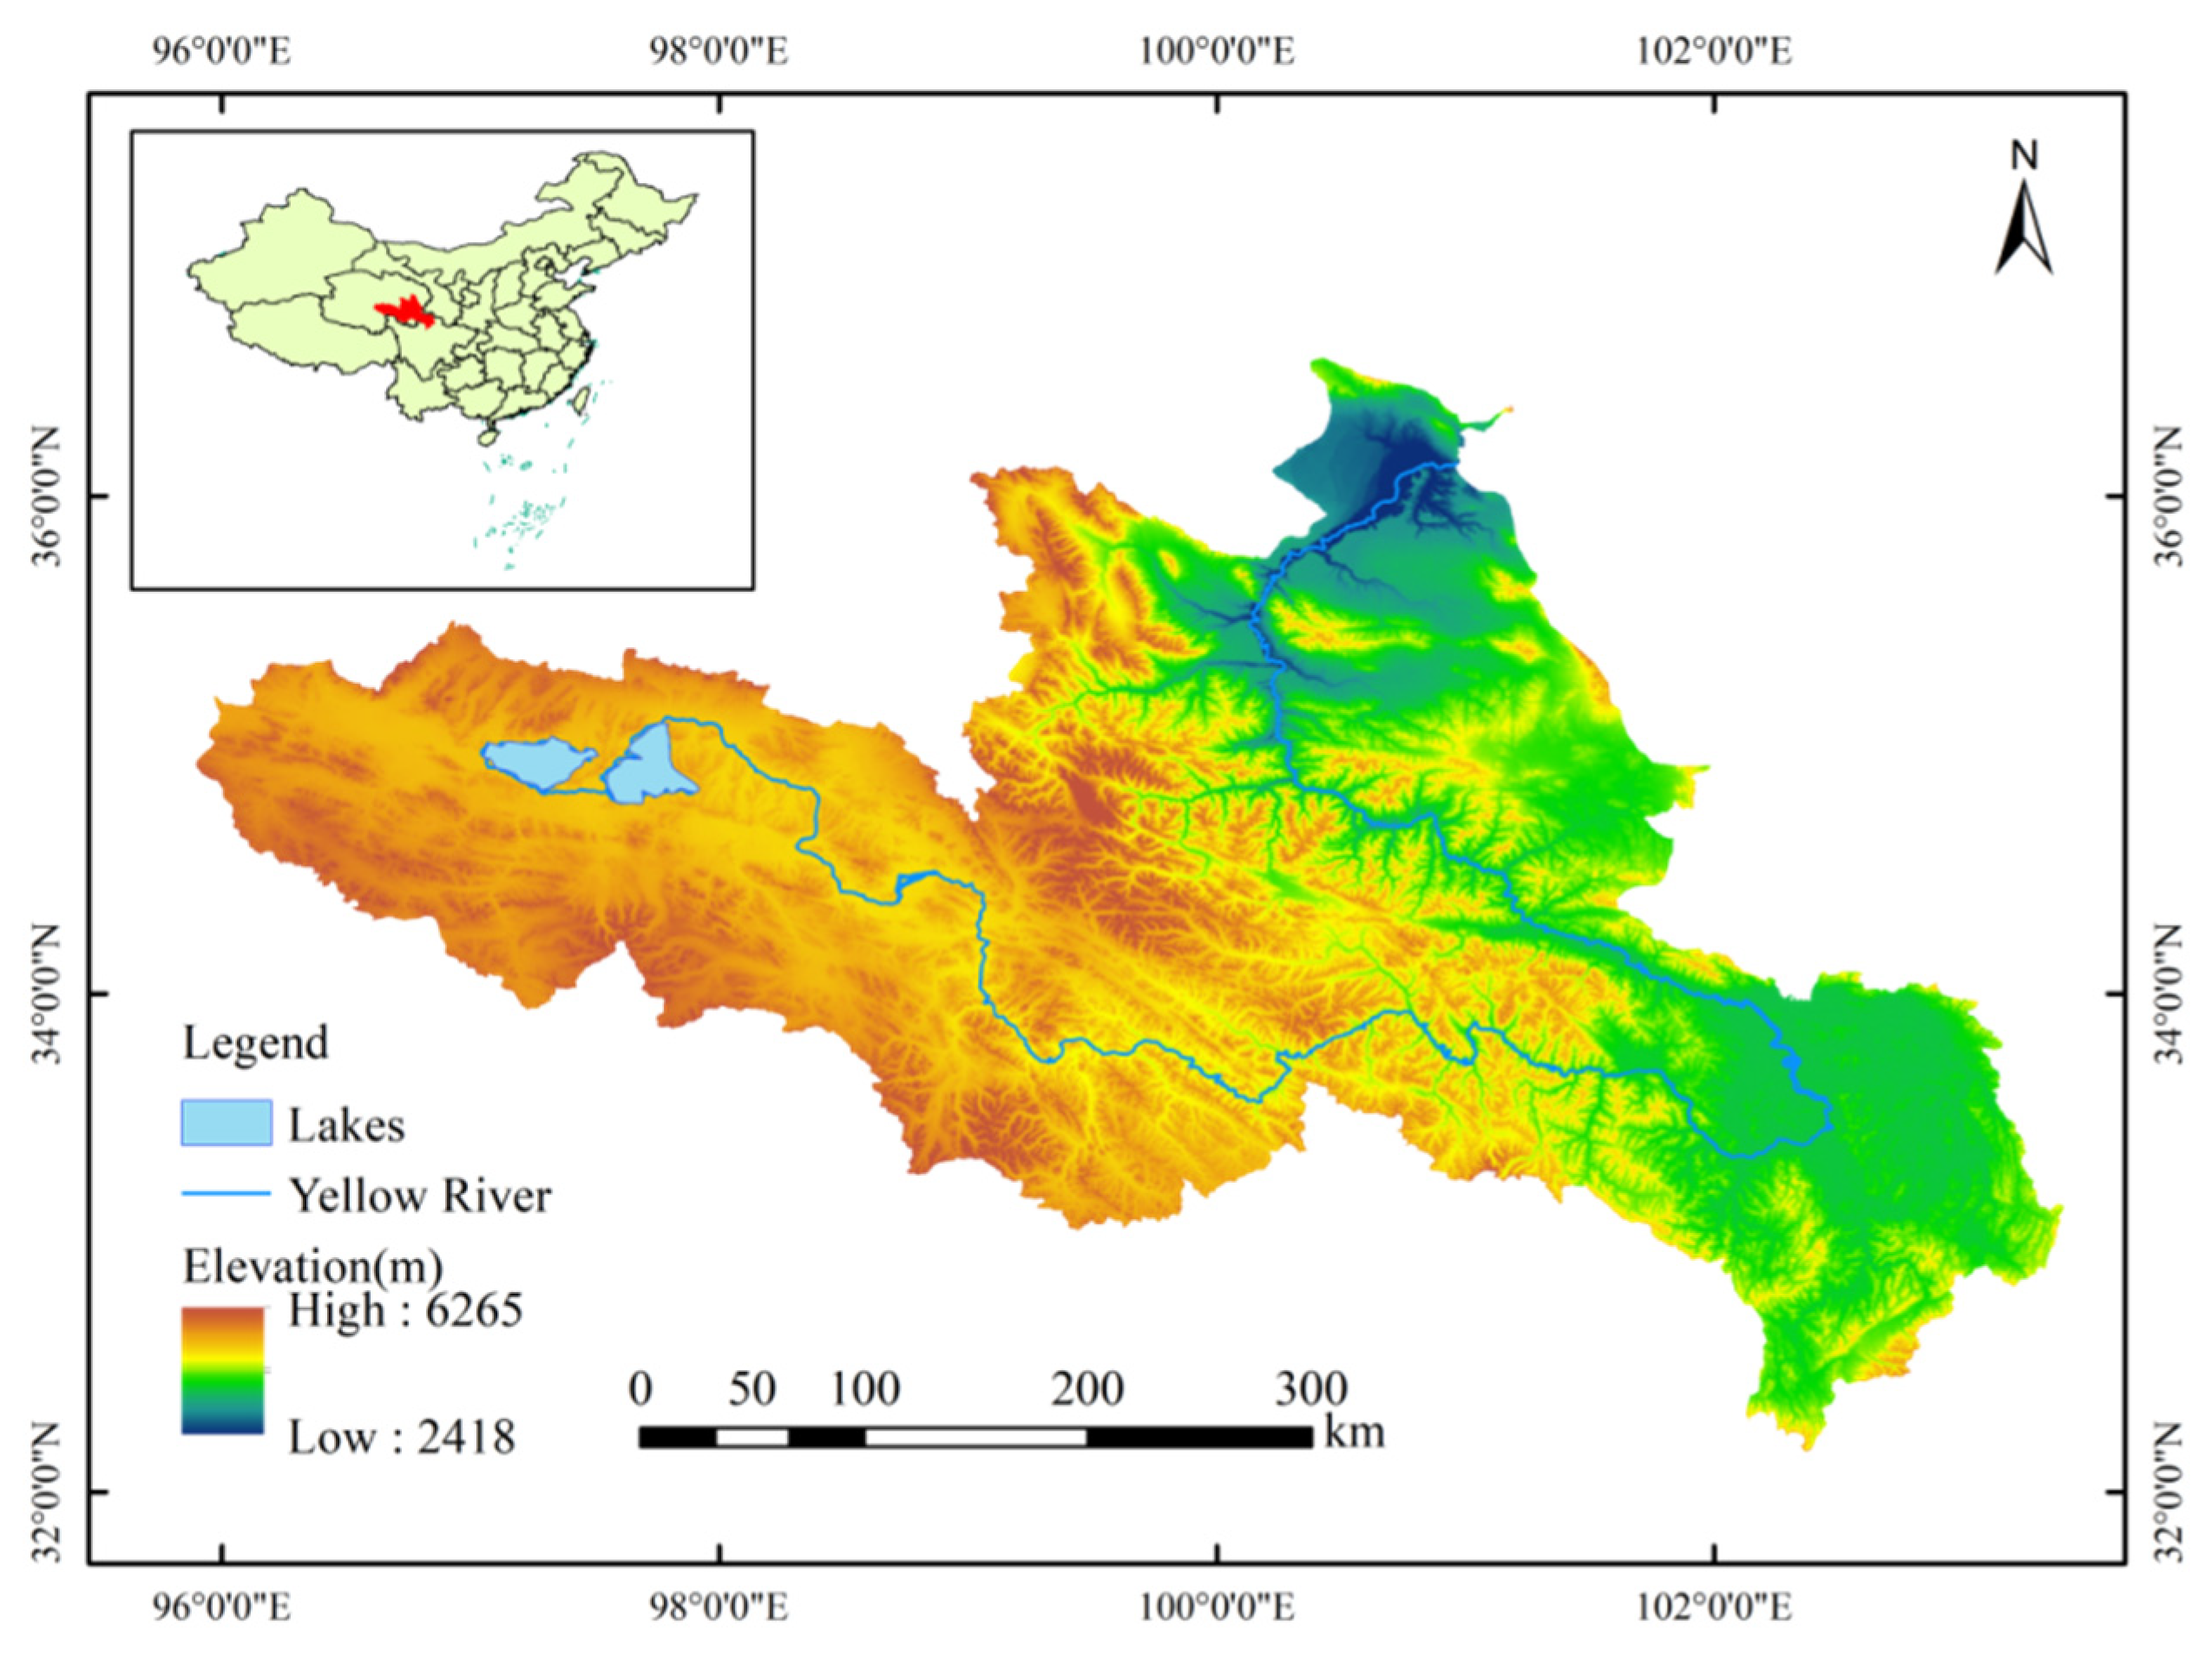
2.1. Study Area

The Qinghai–Tibet Plateau is one of the most ecologically fragile areas in China and the YRSA is located in the northeastern part of the plateau. It is the first line of defense against the destruction of natural resources. The YRSA is the largest producing stream in the Yellow River basin, which is an important part of the freshwater recharge area and ecological function protection zone in China [45], comprising around 130,000 km2 with an average elevation of 4500 m. The terrain is high in the west and low in the east with the highest elevation of 6265 m located at the Animaqing Mountain and the lowest elevation of 2418 m located in the Longyangxia Reservoir. The YRSA mainly has a highland continental climate with distinct dry and wet seasons, long sunshine hours, decreasing precipitation from southeast to northwest and the dominant land use type is grassland. In recent years, due to global warming, the permafrost is rapidly melting and the water volume in the watershed is increasing, leading to a series of problems such as soil erosion [46]. The location of the study area is shown in Figure 1.

2.2. Data Sources

As part of the global land cover data, the land use dataset is derived from Globeland 30 (www.globallandcover.com, accessed on 1 February 2022) [47,48] where the dataset is mainly processed by multispectral imaging. The spatial resolution of the multispectral image shows 30 m × 30 m in 2000, 2010 and 2020, with an overall accuracy of 85% and a Kappa coefficient of 0.8. According to the current China land-use classification (No. GB/T21010-2007) and geographical characteristics of the study area, the study reclassified the land use dataset into seven land-use types as follows: farmland, forest, grassland, water area, wetland, construction land and unused land. The land use intensity was derived from the research from Hoque et al. [49], Felipe-Lucia et al. [50] and the geographical characteristics of the YRSA (Table 1). Nine drivers were selected for analysis in the PLUS (patch-generating land use simulation) model (Table 2), which include natural factors (e.g., DEM, slope, aspect, soil type, precipitation, temperature, distance from rivers) and social factors (e.g., distance from high level roads, such as highways and primary roads, and distance from low level roads, such as county roads and district roads). Panel datasets are mainly used to calculate the ESV, including agricultural economic benefits published by China Statistical Yearbook (http://www.stats.gov.cn/tjsj/ndsj/, accessed on 5 February 2022) and the National Farm Product Cost-benefit Survey.

2.3. Land Use Transfer Matrix Model

The land use transfer matrix is a two-dimensional matrix based on the relationship of land use changes in the same area at different times [52]. By analyzing the results of the land use transfer matrix, the direction and quantity of the transfer of different land use types during the study period can be obtained [53]. The study made the land use change of the YRSA from 2000 to 2020 as a Sankey map to show the land use change. The land use transfer matrix formula is as follows:
A i j = A 11 A 12 A 1 n A 21 A 22 A 1 n A n 1 A n 2 A n n
where A ij represents the state of ecological land from the early to the end of the study and n represents the number of ecological land types.

2.4. Ecosystem Service Value Model
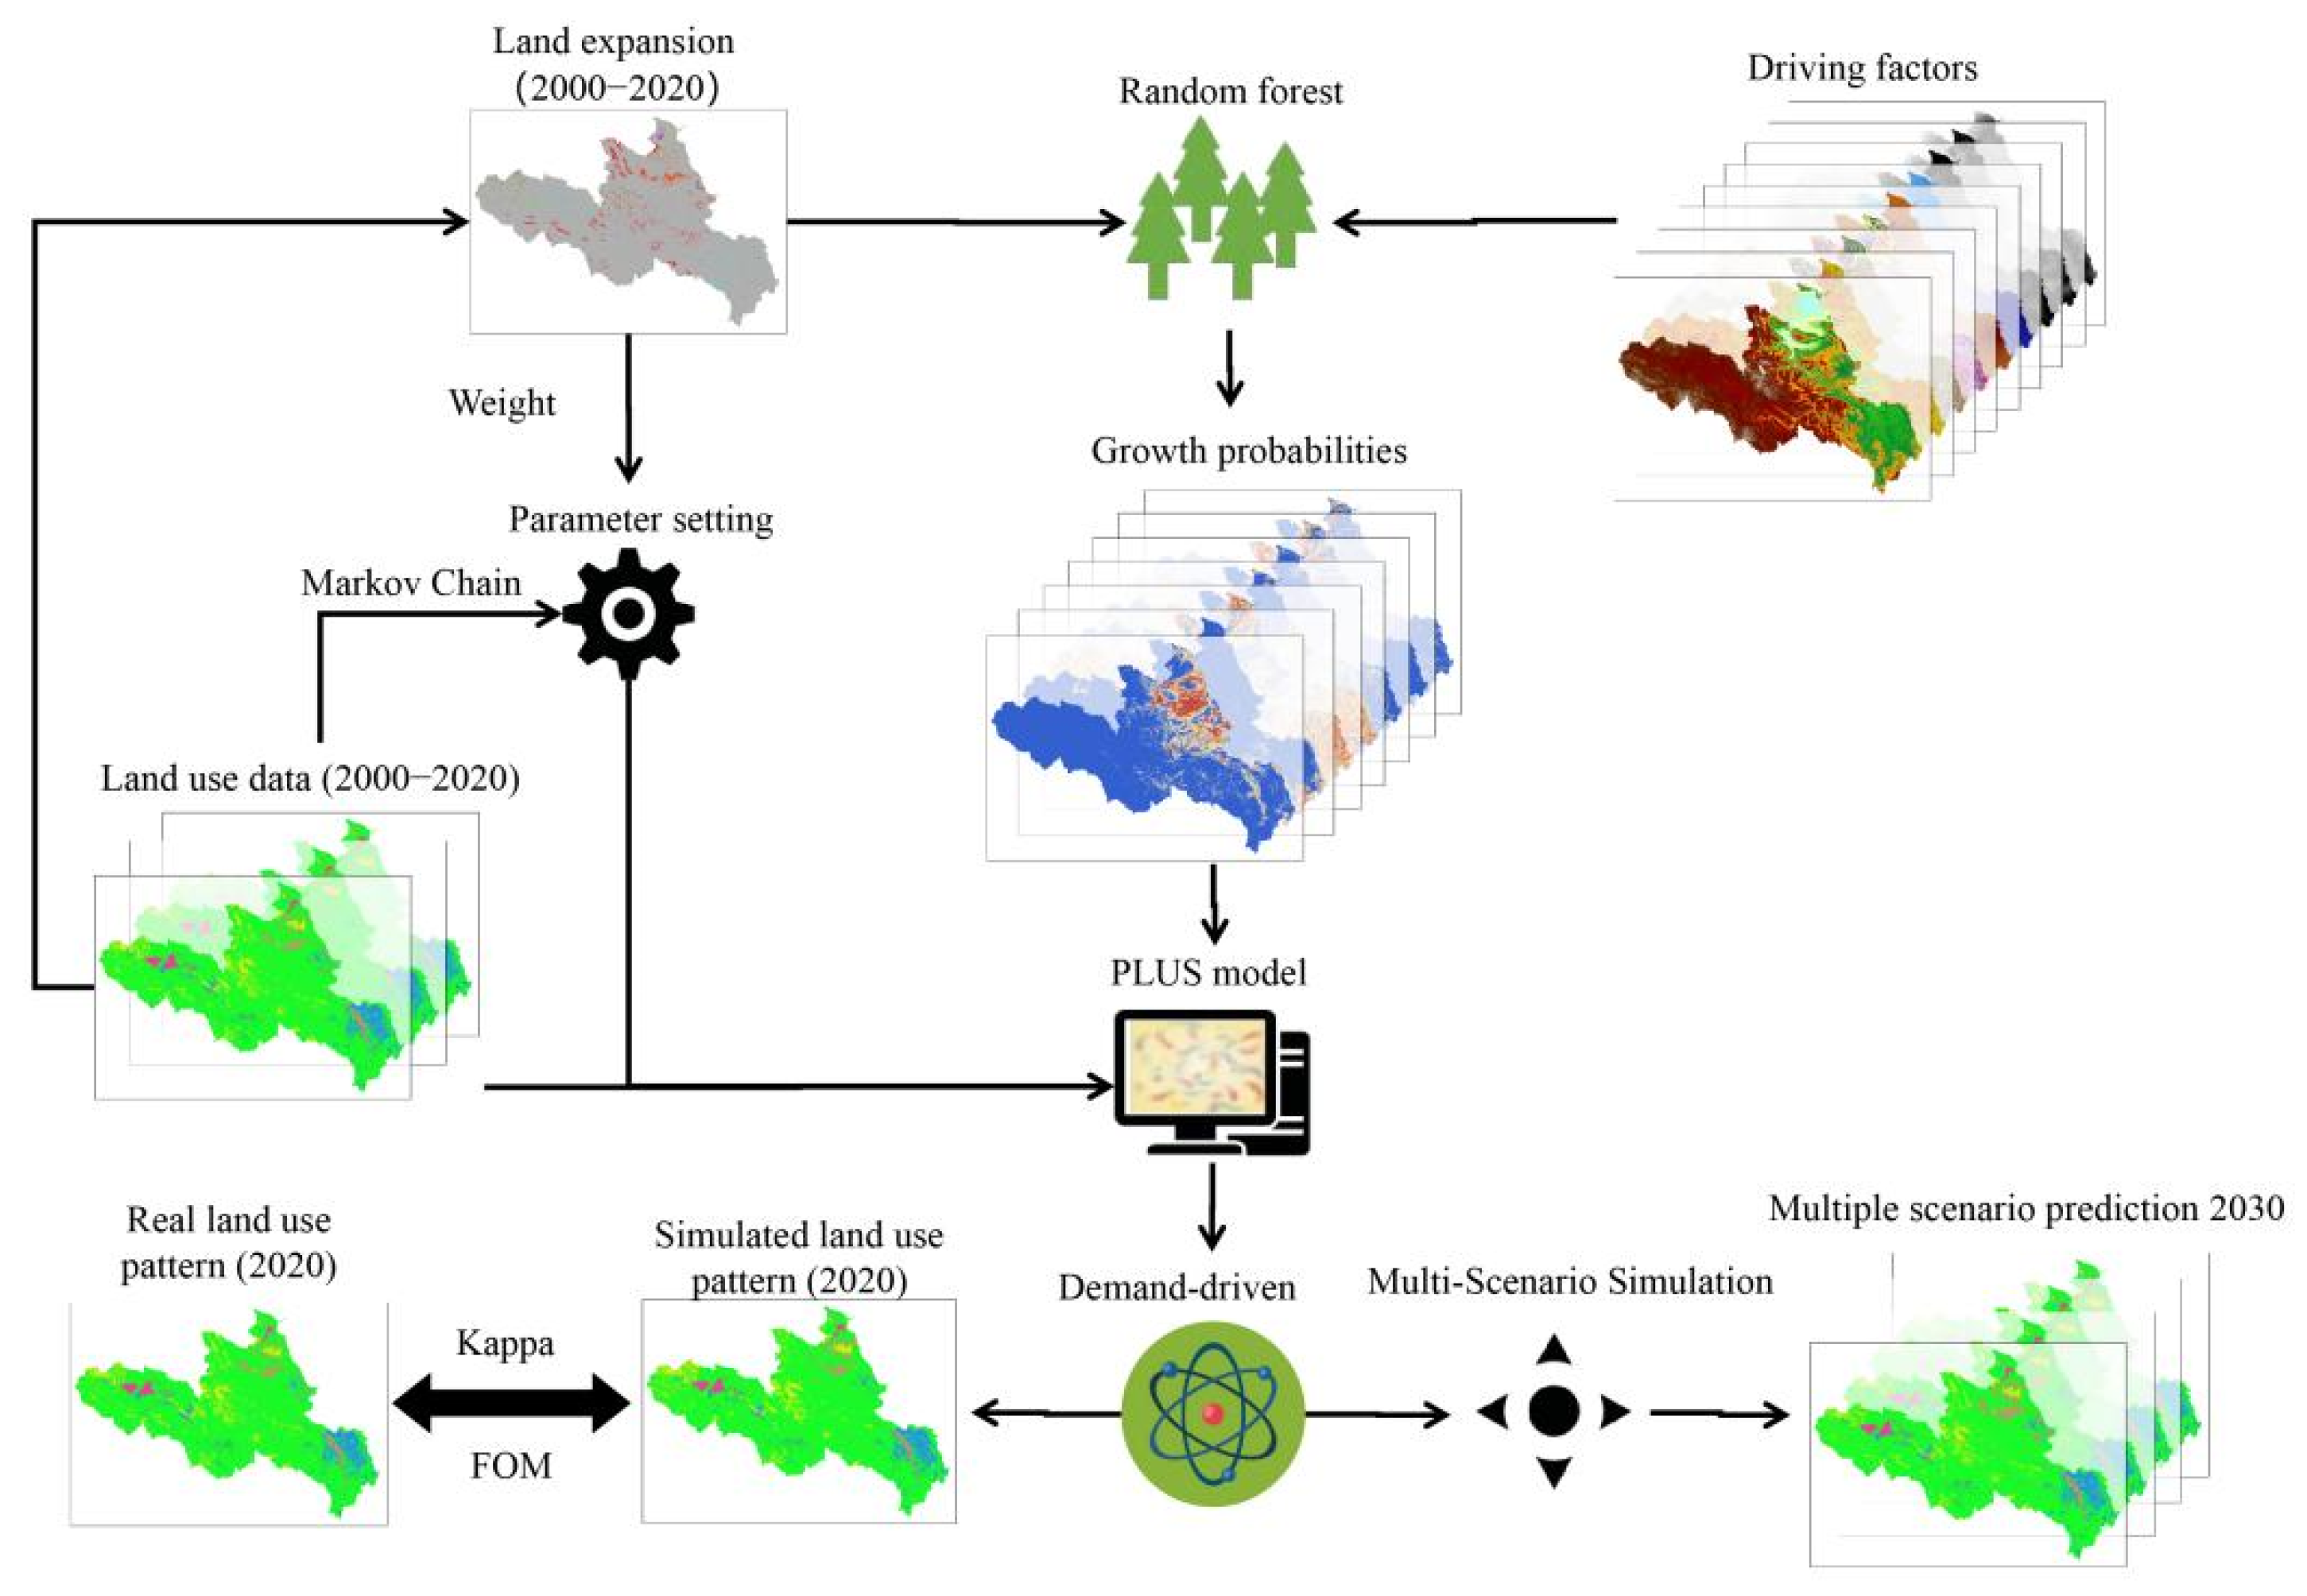
This study calculates and corrects the actual ESV of the YRSA based on the evaluation of ESV by Xie et al. [15]. According to the grain planting area of Qinghai Province in 2000, 2010 and 2020, three main grain crops were selected: wheat, corn and rapeseed. We use average food production and average food prices for three years to reduce the problem of food price volatility caused by socioeconomic instability. According to Xie et al. [15], the value of a single equivalent factor is about 1/7 of the actual value of average grain yield per unit area. The formula is as follows [15]:
ESV a = 1 7 i = 1 n m i p i q i M
where ESV a is the economic value of providing food production function per unit area of farmland ecosystem (CNY/ha), i is the type of crop, p i is the national average price of i crops in the study year (CNY/ton), q i is the yield per unit area of i crops (tons/ha); m i is the planting area of i crops (hectare) and M is the planting area (hectare) of all crops.
Referring to the equivalent coefficient proposed by Xie [15], the ESV per unit area of each land use type is calculated. The formulae are as follows [15]:
ESV i = j = 1 m A i × VC ij
ESV j = i = 1 m A i × VC ij
ESV = i = 1 m j = 1 m A i × VC ij
VC ij = ESV a × φ ij
where ESV i is the ESV of land use type i , A i is the area of land use type i (hm2), VC ij is the value coefficient of land use type i and ecosystem services category j , ESV j is the ESV of ecosystem services category j , ESV is the total ecosystem services value, and φ ij is the equivalent table of ecosystem services per unit area of land use type i and ecosystem services category j in China [15].
Referring to China Statistical Yearbook and National Farm Product Cost-benefit Survey, the study calculates the average market price per unit area of wheat, corn and rapeseed in the YRSA from 2000 to 2020 at 915.28 CNY/ha. The calculation is based on 1/7 of the total price per unit area of the three crops. The study calibrated the unit value coefficients for the seven land use types in this study (Table 3). The YRSA has little construction land, so its ESV is neglected.

2.5. PLUS Model

The patch-generating land use simulation (PLUS) model was developed by the High-Performance Spatial Computational Intelligence Lab (HPSCIL) of China University of Geosciences (Wuhan) and the Institute of Information Engineering and National GIS Engineering Research Center [31]. The PLUS model is a cellular automata (CA) model used to simulate land use change at patch scale based on raster data. It can be used to explore the driving factors of land expansion and predict the patch change of the land use landscape. Our processing flow is shown in Figure 2. The formula is as follows [31]:
OP i , j d = 1 = p i , j d = 1 × r × μ j × H j t   if   Ω i , j t = 0   and   r < P i , j d = 1 P i , j d = 1 × Ω i , j t × H j t   all   others
where r is a random value between 0 and 1 and μ j is the threshold of new land use patches with land use type determined by the model user.
If the new land use type wins a competition round, the decreasing threshold τ is used to evaluate the candidate land use type c selected by the roulette wheel. The formula is as follows [31]:
If j = 1 N G c t 1 j = 1 N G c t < Step   Then , I = I + 1
Change   P i , j d = 1 > τ   and   T j , c = 1 No   change   P i , c d = 1 τ   or   T j , c = 0
where Step is the step of PLUS model, which is used to approximate the demand of land use, δ is the attenuation threshold τ, ranging from 0 to 1, set by an expert, r 1 is a random value with normal distribution, with an average value of 1, ranging from 0 to 2 and l denotes the decay steps. Parameter TM j , c is the transfer matrix that defines land use type [54].
In order to better test the accuracy of the simulated image, the Kappa coefficient [55] and the FoM coefficient [56] are introduced to verify the simulation accuracy of the PLUS model. The verification results show that the PLUS model simulates the land use and real land use in 2020 with coefficients of 76% and 0.12, respectively. The accuracy is high and can reflect the future land use change pattern of the YRSA with higher precision; therefore, the PLUS model can be used to simulate future land use changes in multiple scenarios. The formulae are as follows [55,56]:
Kappa = P 0 P c 1 P c
P c = a 1 × b 1 + a 2 × b 2 + + a n × b n / S × S
where Kappa denotes classification accuracy indicators, P 0 is the total accuracy, n is the number of categories, a 1 , a 2 , …, a n are the area of each type of land use in the real results, b 1 , b 2 , …, b n are the land use area of each type in the simulation results and S is the number of samples;
FoM = B / A + B + C + D
where FoM denotes the quality of the classification results, A represents the area where the actual transformation occurs and the simulated non-transformation occurs, B represents the area of actual and simulated conversion, C represents the actual conversion, but the simulation results are different from the actual area, and D represents the area where there is no actual change, but the simulation is transformed.
The YRSA is located in an alpine and ecologically fragile region where the development plans (e.g., ecological protection policy, economic construction patterns, production methods) in this region are different from those of the Yellow River basin. Referring to the policy, the natural environment, and the simulation scenarios researched by Lou et al. [57] and Wang et al. [58], four scenarios for 2030 were simulated as follows: a natural development scenario (NDS), an ecological protection scenario (EPS), a carbon neutral scenario (CNS) and a production priority scenario (PPS). The specific rules are shown below.
(1)
Natural development scenario (NDS): Ruling out the influences arising from policy and regional planning, the land use in 2030 was simulated according to the rate of land use change in the YRSA in 2000, 2010 and 2020. In this scenario, the transfer direction of land use types is not limited in the transfer matrix when the transfer direction is in order;
(2)
Ecological protection scenario (EPS): Based on the NDS, this scenario is aimed at ecological protection where the probability of the ecological land (e.g., forest, water area) transferring to anthropogenic land (e.g., farmland, construction land) shall be reduced and the probability of grassland transferring to ecological land (e.g., forest, wetland) shall be increased while the rapid expansion of construction land shall be slowed. In addition, the large water area is considered a restricted development area in this scenario;
(3)
Carbon neutral scenario (CNS): The goal of this scenario is to respond to the call of carbon neutral plans proposed by China. Based on EPS, the probability of construction land used for solar and water facilities in the YRSA shall be increased and the transferring probability that certain land use types (e.g., forest, water area) could contribute to the goal of carbon neutrality shall be increased to a lesser extent. In addition, the forest is considered a restricted development area in this scenario;
(4)
Production priority scenario (PPS): This scenario is aimed for food security. Based on EPS, the retention of farmland in the YRSA is guaranteed and the amount of farmland replenishment is increased. The probability of transferring grassland to farmland is increased while the probability that farmland transferring to other land use types is reduced. Meanwhile, the probability of transferring to farmland is increased with the intact wetland and water area. In this scenario, the water area and wetland that supply water resources for farmland are considered restricted development areas.

3. Results and Analysis

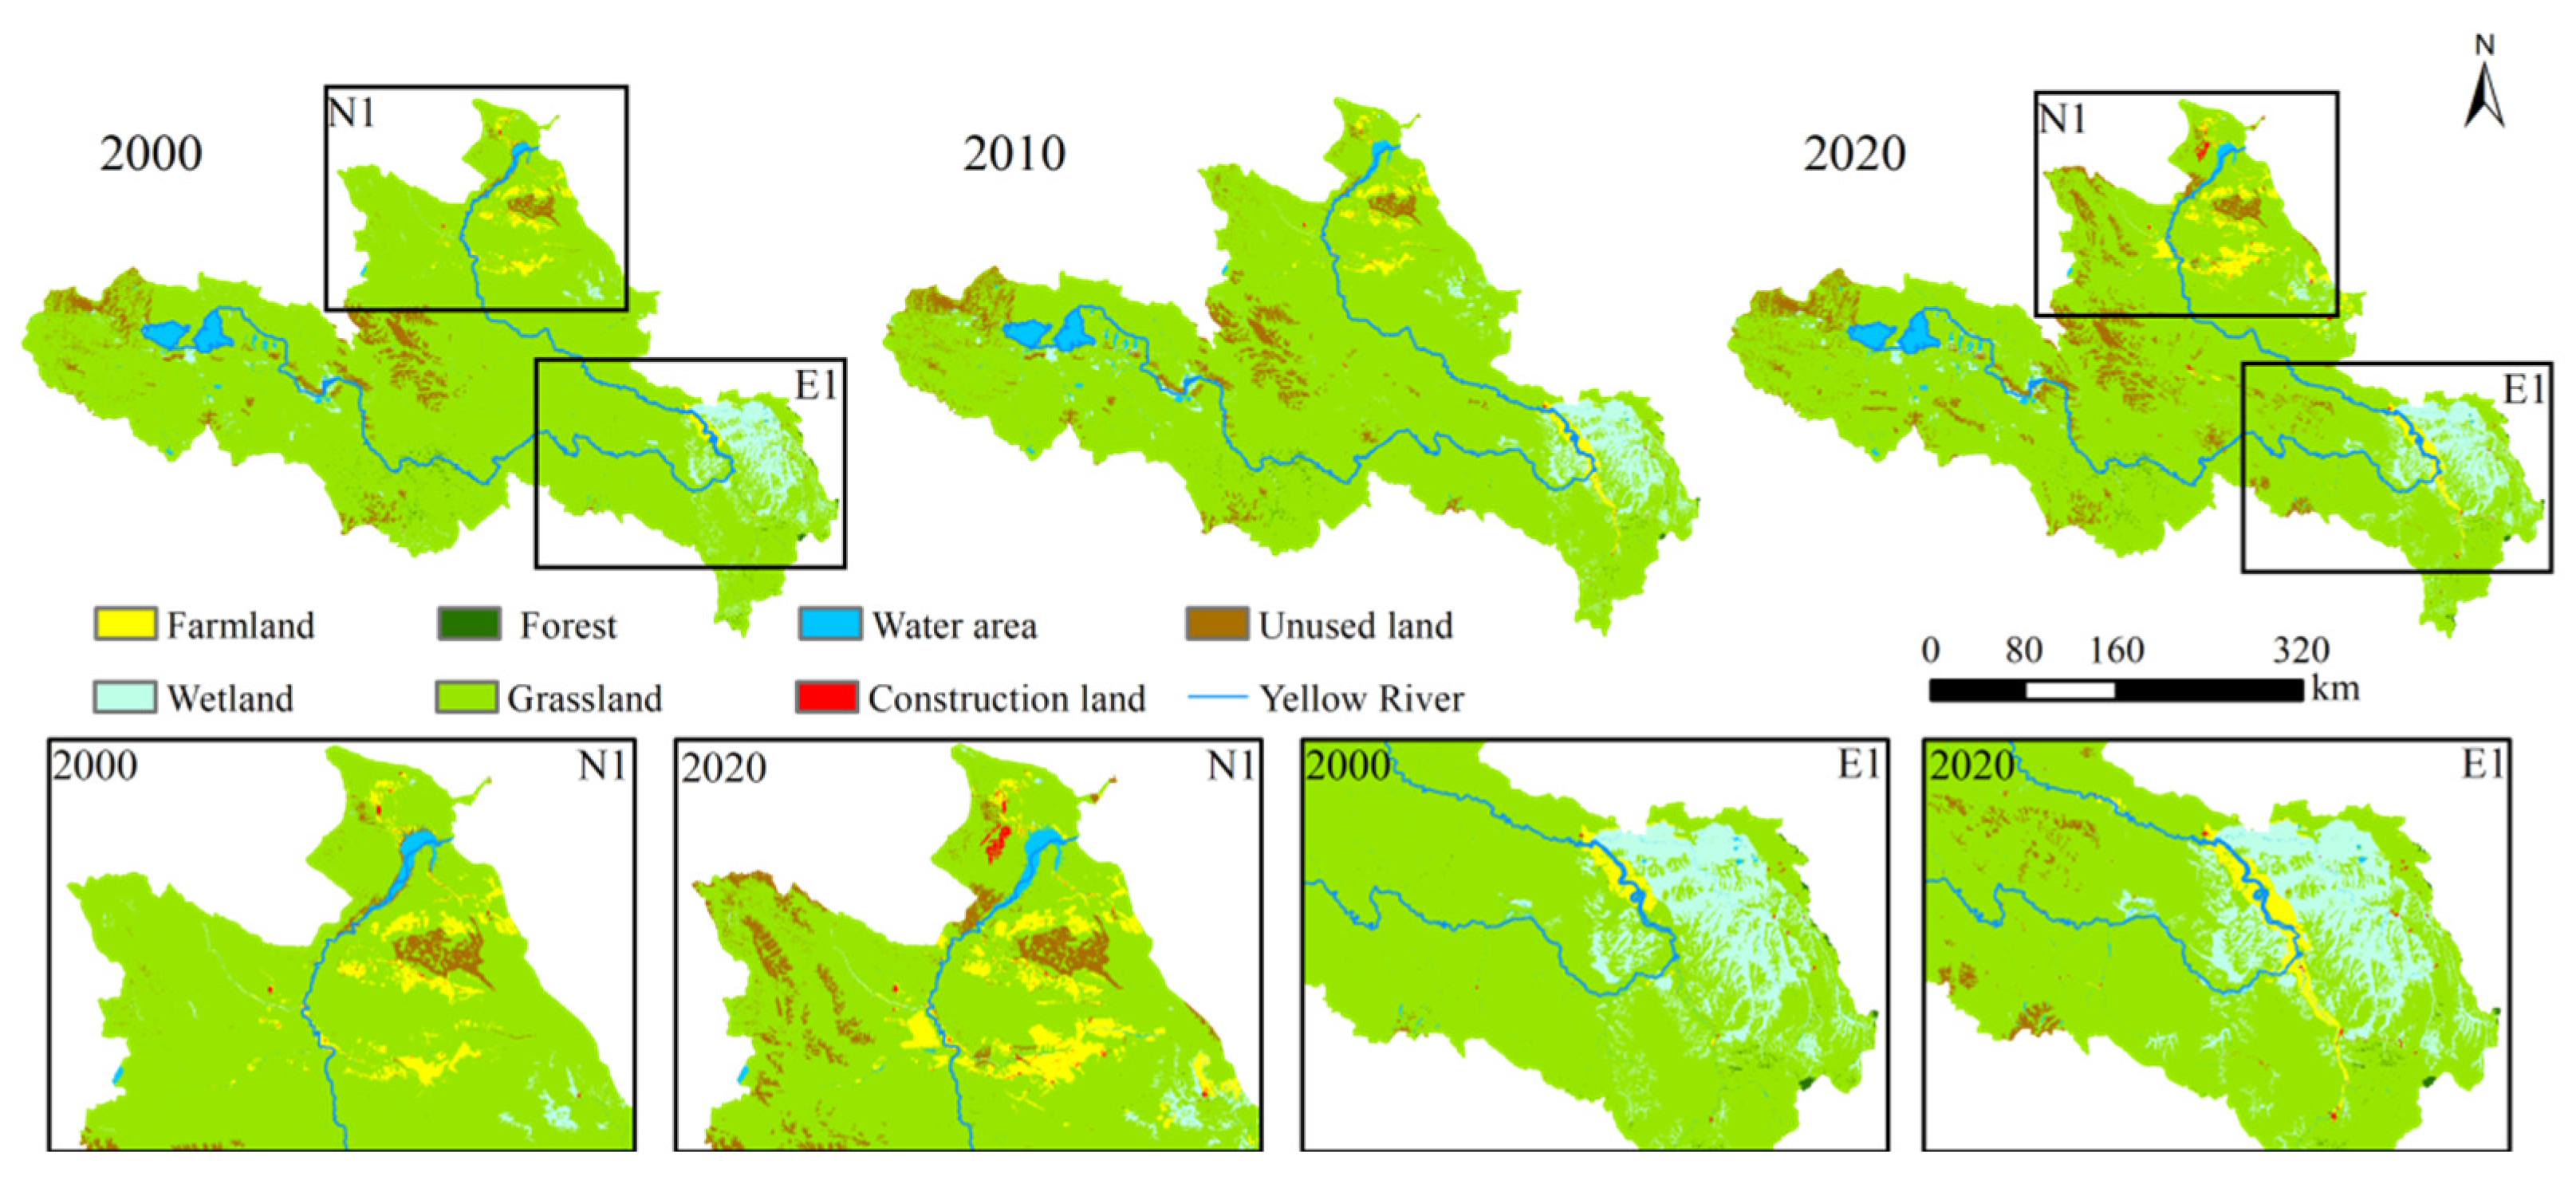
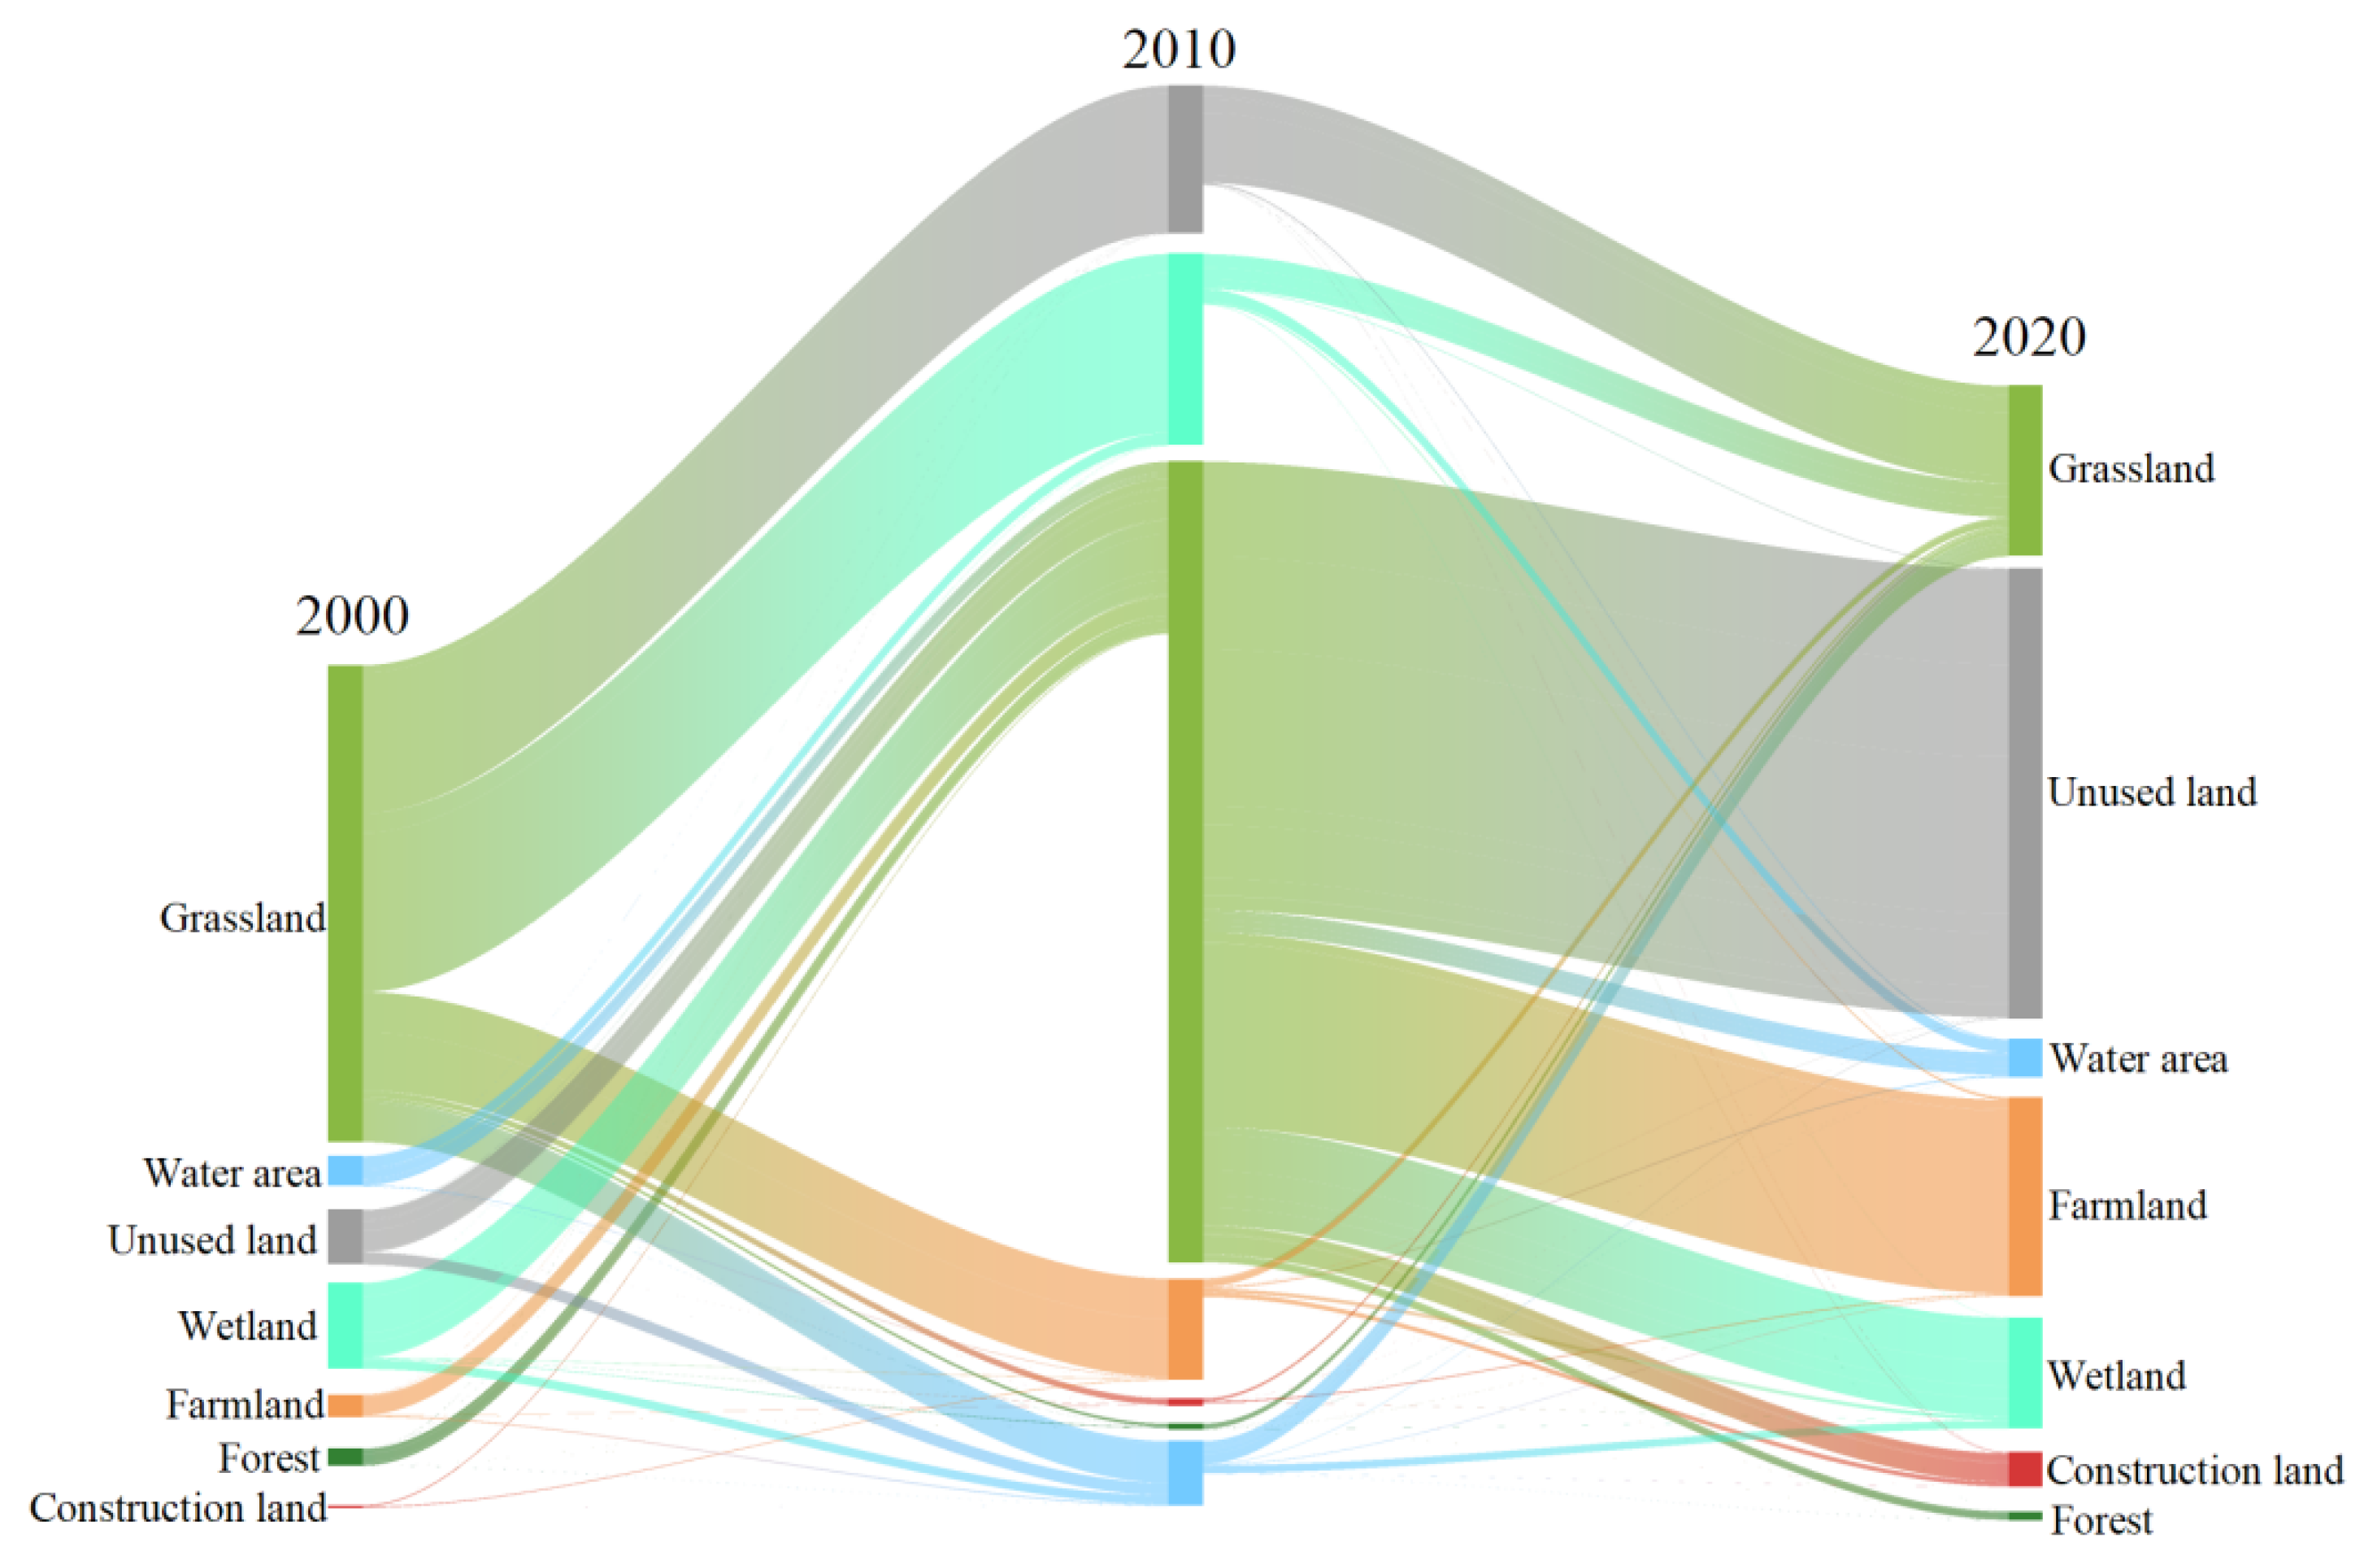
3.1. Land Use Change from 2000 to 2020

The study processed the land use data of YRSA in 2000, 2010 and 2020 and reclassified the data using ArcMap 10.8 to obtain the distribution maps of grassland, forest, construction land, unused land, farmland, wetland and water area in YRSA (Figure 3). Based on the spatial distribution of land use during the YRSA study period (Figure 3), the overall land use characteristics of the YRSA are as follows: the west is dominated by grassland, water area and unused land; the east is dominated by grassland, wetland and farmland; the north is dominated by farmland and construction land. From 2000 to 2020, the N1 and E1 regions have increased by a large amount of arable and unused land.
Figure 4, generated from the land use transfer model, shows that grassland accounts for the largest proportion of the YRSA land use type structure (84.12%), unused land for about 6.02%, water area for about 1.83%, wetland for about 5.06% and farmland for about 2.52%. Forest land and construction land account for the smallest proportion of the area, about 0.21% and 0.24%, respectively. From 2000 to 2020, grassland decreased by 6161.44 km2 (4.71% of the total area), unused land increased by 2927.30 km2 (2.24% of the total area), and wetland increased by 1094.78 km2 (0.84% of the total area). Farmland and construction land were 1580.24 km2 and 85.90 km2 in 2000, and 3292.05 km2 (increase of 108.33%) and 314.33 km2 (increase of 265.92%) in 2020, respectively.

3.2. Change in the Ecosystem Services Value from 2000 to 2020

Figure 5 shows the spatial distribution of ESV in the YRSA in 2000, 2010 and 2020. The areas with high ESV are mainly located near Zaling Lake, Eling Lake in the west (area N3), Longyangxia Reservoir in the north (area N1) and the wetland in the east (area N4). During the study period, ESV was decreasing in the N2 region and increasing in the N3 and N4 regions. It is concluded that ESV in different areas of the YRSA was decreasing in areas away from the water area and wetland and increasing in areas close to them.
Table 4 calculates the corresponding ESV of different land use types in the YRSA from 2000 to 2020. With the development of the YRSA and the continuous changes in ecological protection policies, the ESV showed a transitional change during the 20 years. As shown in Table 4, the overall ESV of the YRSA first increased during 2000–2010, and then gradually decreased during 2010–2020, showing a slightly increasing trend overall. In the past 20 years, the total ESV has changed from CNY 169.466 billion in 2000 to CNY 170.187 billion in 2020, an increase of CNY 721 million.
Different land use types provide different ESV. Grassland, the main land use type in the YRSA, has a greater impact on the ESV, with the proportion constantly decreasing from 75.75% to 71.43% in the past 20 years, and the amount of ESV decreasing by CNY 6.803 billion. The area of wetland and water area, although accounting for a smaller proportion in the YRSA, has a greater impact on the ESV, with the proportion of wetland increasing from 15.53% in 2000 to 18.52% in 2020, and the ESV rising by CNY 5.213 billion. The water area’s ESV has also increased over the past 20 years, from 7.85% to 8.77%, with a value of CNY 1.628 billion. The remaining farmland, forest and unused land have less impact on the ESV in the YRSA, with the proportion of ESV of forest decreasing from 0.36% in 2000 to 0.29% in 2020, and the value decreasing by CNY 120 million, while the ESV of farmland and unused land increased by 0.37% and 0.11%, respectively.
The changes in land use intensity and ESV through MATLAB software (Figure 6) was tested by applying Pearson. The results show that there is a significant negative correlation between land use intensity and ESV changes in most areas of the YRSA from 2000 to 2020, indicating that the transfer from grassland to construction land and farmland reduces ESV and vice versa. The transfer of unused land to grassland and wetland leads to an increase in land use intensity and ESV in the YRSA.

3.3. Changes in the Ecosystem Services Value by Function

Table 5 presents the ESV corresponding to different functions in the YRSA from 2000 to 2020. Regulating services provide the highest ESV, accounting for more than 66% of total ESV, followed by supporting services, accounting for more than 22% of total ESV, and then provisioning services and cultural services, accounting for 7% and 5% of total ESV, respectively. Among them, except for the provisioning services, which showed a stable increasing trend in 20 years, the regulating services, supporting services and cultural services showed a trend of rising first and then declining, compared with 2000. The primary classification services with the highest value increase in 2020 was regulating services, which increased by CNY 631 million. The value of provisioning services and cultural services also increased slightly, by CNY 266 million and CNY 177 million, respectively. Compared with the above three services, the value of supporting services showed a decreasing trend, with a cumulative decrease of CNY 353 million.
Among all ES secondary classifications, hydrological regulation contributed the most to the ESV—nearly CNY 50 billion—accounting for about 29%, and the value increased by CNY 2.473 billion in 20 years. This is followed by climate regulation, accounting for about 20% of the ESV. The value decreased by CNY 1.37 billion in 20 years. Biodiversity, soil formation and retention, gas regulation and environmental purification ranked third to sixth in terms of ESV, accounting for 10.96%, 9.93%, 8.14% and 8.05% of the total ESV, respectively. The value of maintaining nutrient cycling accounted for the least, accounting for only 0.77% of total ESV.

3.4. Future Changes in Land Use and Ecosystem Service Value under Different Scenarios

3.4.1. Land Use Changes in 2030

Figure 7 shows the spatial distribution of different land use types in 2030 under four scenarios obtained by the PLUS model. As shown in the figure, there are significant differences between the land use in 2020 and the four scenarios in 2030. The spatial patterns of land use under NDS, EPS, PPS and CNS in 2030 are basically the same, but there are differences in local areas (Figure 7, Table 6).
In the NDS, the areas of farmland, forest, grassland, wetland, water area, construction land and unused land in the future 2030 are 4398.39 km2, 287.39 km2, 106,383.85 km2, 7011.14 km2, 2444.72 km2, 477.89 km2 and 9885.73 km2, respectively (Table 6). Compared with 2020, the area which decreased and changed the most is grassland, by 3720.88 km2. The land use types that change the most among the four scenarios are construction land and unused land, which increase by 163.55 km2 and 2002.24 km2, respectively. The third largest area change is farmland, which increases by 1106.01 km2. Wetland and water area increased by 390.41 km2 and 44.73 km2, respectively, and forest is the least variable of the four scenarios, with an increase of only 13.94 km2.
In the EPS, the area of farmland and construction land is the smallest among the four scenarios, nearly 3254.30 km2 and 366.41 km2, while the area of forest and wetland is the largest, 473.55 km2 and 7062.83 km2, respectively, and the area of water area is 2480.58 km2. Compared with the NDS, the area of farmland, construction land and unused land are reduced by 1144.09 km2, 111.48 km2 and 1524.60 km2, respectively. The area of forest and grassland increased significantly, 186.16 km2 and 2506.46 km2, respectively, and wetland and water area increased slightly, 51.69 km2 and 35.86 km2, respectively. It shows that if effective ecological conservation measures are established, the ecological environment of the YRSA will improve in the future, mainly in the increasing forest and grassland areas.
In the CNS, with ecological protection as the direction, achieving carbon neutrality as the goal, and encouraging the development of photovoltaic energy and water area conservancy energy, the watershed is the largest among the four scenarios, with 2496.06 km2, and the construction land area is relatively more than the EPS and PPS, with 443.75 km2. The grassland area has the highest proportion among the four scenarios at 11,199.61 km2. However, wetland has the lowest share at 6266.29 km2. Compared with the NDS, farmland is a key land use type for carbon emission, and the CNS decreases by 674.43 km2. Forest and grassland, as important land use types for carbon absorption in the YRSA, increase by 9.61 km2 and 3815.76 km2, respectively, compared with the NDS.
In the PPS, with the direction of ecological protection guaranteeing sufficient food supply and protecting farmland, the area of farmland accounts for the largest proportion of the four scenarios, 4798.71 km2, while bringing an increase in the area of construction land of 441.84 km2. Forest accounts for the smallest proportion, only 285.50 km2. Compared to the NDS, the PPS shows a decrease in wetland and forests of 5.32 km2, 79.53 km2 and 1.89 km2, respectively.

3.4.2. Changes in ESV under Different Scenarios in 2030

Table 7 and Figure 8 show the ESV of different services in the YRSA in 2030 under multiple scenarios. Under the NDS in 2030, the ESV in the YRSA shows a decreasing trend, decreasing by CNY 1.421 billion compared to 2020. If the ecological protection system is enhanced and the type of land is planned reasonably, under the EPS in 2030, the ESV in the YRSA will increase by CNY 1.640 billion compared to 2020. If ecological protection is the goal and achieving carbon neutrality is the direction, under the EPS in 2030, the ESV in the YRSA will increase by CNY 612 million compared with the NDS. The overall results all indicate that we should pay attention to the protection of ecological environment and natural resources, and that the development of ecological protection will effectively enhance the ESV in the YRSA.
Among the four scenarios, the ESV generated by the EPS is the highest, by CNY 171.828 billion, which is CNY 3.062 billion, CNY 2.450 billion and CNY 1.038 billion higher compared to the NDS, CNS and PPS, respectively. ESV under PPS was higher than NDS and CNS by CNY 2.024 million and CNY 1.413 million, respectively, caused by the increase in unutilized land.
In terms of ES types, regulating services, supporting services, provisioning services and cultural services accounted for 66%, 22%, 7% and 5% of total ESV, respectively. Among the regulating services, EPS is the highest with an increase of CNY 1.173 million over 2020 and NDS is the lowest with decrease of CNY 979 million over 2020. The EPS has the highest value of gas regulation, environmental purification, and hydrological regulating services among the four scenarios at CNY 13.694 billion, CNY 13.733 billion and CNY 51.702 billion, respectively. Among the supporting services, the EPS is the highest with an increase of CNY 194 million over 2020. Among the provisioning services, the PPS is the highest with an increase of CNY 192 million over 2020, and PPS’s food production and raw material supply, at CNY 3.115 billion and CNY 3.956 billion, is the highest among the subtypes of ES. Water supply is the highest in the EPS at CNY 4.781 billion. The four scenarios have the largest differences in regulation services.

3.5. Discussion

The research results showed that different areas of YRSA present various characteristics of land use. The western part was mainly water area, the eastern part was mainly wetland and the northern part was mainly farmland and construction land. Human activities were concentrated in the northern part of YRSA, resulting in a large increased in unused land and construction land in the north in 2020. Due to the increase in extreme weather events and social development, land use changes have become more dramatic between 2010 and 2020 in YRSA. The changes led to a significant expansion of farmland and wetland in the east and unused land in the west. Currently, most scholars focus on the study of the Yellow River basin. Economic construction downstream of the Yellow River basin dominated land use change, and the natural climate of the upstream region played an important role in land use Change [23]; therefore, YRSA showed different results from the Yellow River basin in land use change. Between 2000 and 2020, unused and farmland increased and forested land decreased in the YRSA, differing from the study by Liu [59] for the Yellow River Basin. During the study period, the construction land in the YRSA showed an increasing trend, which is the same as the study by Zhang [60]. The increased area of construction land in the YRSA is much less than the increased area of construction land in the Yellow River Basin because the construction land in the YRSA was dominated by energy facilities and the construction land downstream was dominated by urban land.
ESV are the basis and foundation for natural asset accounting and ecological compensation decisions, and ES can demonstrate spatial and temporal dynamics that are closely related to ecological structure and function. This study quantitatively assessed the ecosystem services of the YRSA. The results showed that the ESV of the YRSA showed an increase followed by a decrease during the study period, which was consistent with the findings of Duan [23] for the three river sources (the sources of the Yangtze, Yellow and Lancang rivers). The reason for the unstable trend is that the implementation of the Protection Programme of National Ecological Environment in 2000 led to a small increase in ESV from 2000 to 2010. During this period, the ESV decreased in the YRSA resulting from the degradation of grasslands and the increase in unused lands and construction lands that were caused by the frequent global climate changes and increasing social development. The study found that the ESV in 2020 was higher than in 2000. The reason for this phenomenon was global temperatures rising and glaciers melting, which led to an increase in the river flow, the water area and the wetland. By comparing the ESV change map of YRSA from 2000 to 2020 (Figure 5) and the spatial distribution of land use (Figure 3), it was found that ESV increased in area N3 (near water area) and area N4 (near wetland), and the common feature of such areas is the abundance of water resources. However, there was not much increase in ESV in area N1 (near water area) due to the artificially constructed reservoir in area N1. During the study period, ESV was reduced in the N2 region, which was far from water resources and high human activity, because of the large amount of unused land in the region and the difficulty of changing the surface cover by the natural environment. Therefore, in the future, more attention must be paid to the ecological situation away from the water area and to regularly monitor changes in the unused land. Table 5 showed that the value of hydrological regulation and water supply of the YRSA has improved significantly during the study period, which is beneficial to the sustainable development of the Yellow River basin. However, the declining value of environmental purification, climate regulation and soil conservation had a serious impact on the ecosystem of the YRSA. Therefore, regulating and supporting services need to be enhanced by strengthening woodland plantations, monitoring and protecting changes in grasslands and building nature reserves to ultimately achieve ecosystem stability.
Exploring the structure of land use under different development goals is of great importance for sustainable regional development and efficient use of resources. In terms of land use simulation, the cellular automata model has a wider application and can achieve more accurate results. In this study, four scenarios were selected based on the PLUS model depending on the regional characteristics of YRSA. The natural development scenario has the lowest ESV of the four scenarios because population and economic growth lead to a large increase in farmland and construction land which, at current trends, will reduce the YRSA by CNY 1.421 million in 2030. The ESV in both the carbon neutral scenario and the production priority scenario are higher than the natural development scenario, showing that rational planning of land use in the YRSA under an efficient ecological conservation policy can protect forestland, the water area and wetland and increase the ESV of the basin. The value of supply services under the PPS is the highest of the four scenarios and is consistent with the set production priority objective, demonstrating that the model has reliable accuracy. EPS has the highest ESV attributed to a significant increase in forest and grassland, a small increase in wetland and water area and an effective limitation of farmland, construction land and unused land. The value of regulating services and supporting services of EPS is the highest among the four scenarios, and the hydrological regulation of the secondary classification is significantly higher than the other ES and has a crucial role in the sustainable development of the YRSA. In general, with the development of society, it is obvious that humans are damaging the fragile ecological environment and natural resources of the YRSA, leading to increased difficulty with respect to ecological protection and the sustainable development of natural resources. According to current development trends, the area of arable land, construction land and unused land has increased significantly, leading to a decline in ESV, so it is a question of considering how to balance the contradiction between the ecological sustainability of the Yellow River source area and the increase in social needs. It is the obvious option for the future to develop the YRSA with ecological conservation and its coexistence with economic construction the fundamental goals. The results of the current simulations show that enhanced ecological protection of the YRSA will result in the ESV in 2030 returning to 20 years ago, further illustrating the difficulty of ecological protection in the basin. Therefore, focusing on protecting grassland, enhancing plantation forest, stabilizing water area and wetland, reducing farmland and construction land expansion and managing unused land are important measures to maintain the stability of the YRSA’s ecosystem. Before 2020, GeoSOS-FLUS [61,62] and FLUS models [63] were applied for scenario simulations by most scholars. Nowadays, the PLUS model has optimized the CA model in terms of the transformation rule mining strategy and the landscape dynamic change simulation strategy to enhance the prediction accuracy [64]. Based on the PLUS model, Lou et al. [57] and Chang et al. [65] performed multiple scenario simulations and proposed guidance with regional characteristics based on the changes to the ecosystem service value. Although the study areas were different (Yellow River basin [57] and Chang’s [65] study on the downstream area of Yellow River basin), the value of ecosystem services in their simulated ecological priority scenarios were all enhanced and the same is true of the simulation results in this study. In conclusion, the researchers obtained accurate and reliable simulation results in the Yellow River basin by using the PLUS model, providing substantial guidance to decision-makers and confirming the scientific validity of the model, as well as confirming the reliability of this study. This study analyzes past patterns of land use and ESV change and uses qualitative analysis to explore the impact of future land use structures on ESV under the influence of different development goals. The results precisely demonstrate the impact of land use change on the future ESV in the source area of the Yellow River Basin. It also provides a reference for the study of land use change and ESV in the source areas of other river basins. However, this study has some limitations: (1) the classification of ecosystem services based on Xie [15] is outdated and could be improved; (2) when calculating ESV, the ESV of built-up land was ignored in this study due to the small proportion of construction land in the YRSA, which affected the total ESV to a lesser extent. In studies of other watersheds, the ESV of construction land could be added.

4. Conclusions

Against the background of global ecologically sustainable development demands, this study quantified the spatial and temporal characteristics of past land use change and explored the impact of land use change on ESV. Through qualitative analysis, the relationship between future land use change and ESV under different scenarios was explored under the conditions of different development goals. Reasonable suggestions for protecting and improving ecosystems were made from the perspectives of regional characteristics, policy regimes and national development.
Firstly, the study results indicated that, from 2000 to 2020, the farmland, construction land and unused land of the YRSA exhibited rapid growth, which was an important factor in the decline of ecosystem services in the region. The forest decreased at the early stage and then increased showed that the national forest conservation and land use strategy formulated by the state in 2010 has elicited positive responses in the YRSA. The continuous degradation of grassland is a long-standing problem in the YRSA, and more efforts should be made to curb this situation in order to stabilize the local ecosystem. Secondly, the ESV of the YRSA showed a trend of increasing and then decreasing during the study period, with the ESV in 2020 being higher than that in 2000. Compared with the Yellow River Basin [57], the YRSA covers 7.69% of the basin and the ESV is only 4.01% of the basin. This indicates that the ecosystems of the YRSA are more fragile than other river sections in the Yellow River basin and are in greater need of support in terms of ecological conservation. The ESV of the grassland, water area and wetland is much higher than other land use types, so it is more important to focus on their changes when conducting surface cover monitoring. The ESV is ranked as follows: regulating services > supporting services > provisioning services > cultural services. The value of hydrological regulating has improved over the study period due to the increase in water area and wetland, which is beneficial to the sustainable development of the Yellow River basin. Finally, the study simulated the evolution of future land use in YRSA with the PLUS model. Under different settings, the four simulations show different characteristics. In the EPS, ESV was the highest because the area of construction land and farmland was smaller than the other scenarios, limiting the urbanization of the YRSA. In the PPS, the farmland increased, resulting in stronger supply services than the other scenarios. In the CNS, the construction land was more abundant than the other scenarios. In the NDS, degradation of grassland led to a significant decrease in ESV. Therefore, the study concludes that the ecological conservation approach may be more suitable for the future development of the YRSA from the perspective of national ecological priority development and regional characteristics. From the perspective of site-specific and categorical approaches, the four scenarios are informative for future land use restructuring and ecosystem service optimization in the YRSA. In order to achieve sustainable development faster and maximize the ESV of the watershed, and to further improve the analytical accuracy of the model, we will make efforts to integrate land use and ecosystem data and combine multiple approaches to study the spatial response of ESV in the basin in future studies.

Author Contributions

Z.L. contributed to all aspects of this work. Q.S. contributed to the preparation of the framework and first draft of the study and supervision. J.Z. contributed to resource acquisition. S.W. contributed to the data processing. All authors have read and agreed to the published version of the manuscript.

Funding

This research was funded by National Natural Science Foundation of China, grant number 42161068.

Institutional Review Board Statement

Not applicable.

Informed Consent Statement

Not applicable.

Data Availability Statement

Not applicable.

Acknowledgments

Acknowledgement of funding from the Geological Resources and Geological Engineering discipline building project.

Conflicts of Interest

The authors declare no conflict of interest.

References

  1. Costanza, R.; d’Arge, R.; de Groot, R.; Farber, S.; Grasso, M.; Hannon, B.; Limburg, K.; Naeem, S.; O’Neill, R.V.; Paruelo, J.; et al. The value of the world’s ecosystem services and natural capital. Nature 1997, 387, 253–260. [Google Scholar] [CrossRef]
  2. MEA. Millennium Ecosystem Assessment. Ecosystems and Human Well-Being; Island Press: Washington, DC, USA, 2005. [Google Scholar]
  3. Braat, L.C.; de Groot, R. The ecosystem services agenda:bridging the worlds of natural science and economics, conservation and development, and public and private policy. Ecosyst. Serv. 2012, 1, 4–15. [Google Scholar] [CrossRef] [Green Version]
  4. Calvin, K.; Bond-Lamberty, B.; Clarke, L.; Edmonds, J.; Eom, J.; Hartin, C.; Kim, S.; Kyle, P.; Link, R.; Moss, R. The SSP4: A world of deepening inequality. Glob. Environ. Change 2016, 42, 284–296. [Google Scholar] [CrossRef] [Green Version]
  5. Polasky, S.; Nelson, E.; Pennington, D.; Johnson, K.A. The Impact of Land-Use Change on Ecosystem Services, Biodiversity and returns to landowners: A Case Study in the State of Minnesota. Environ. Resour. Econ. 2011, 48, 219–242. [Google Scholar] [CrossRef]
  6. Deng, X.Z.; Huang, J.K.; Rozelle, S.; Zhang, J.P.; Li, Z.H. Impact of urbanization on cultivated land changes in China. Land Use Policy 2015, 45, 1–7. [Google Scholar] [CrossRef]
  7. Blignaut, J.; Moolman, C. Quantifying the potential of restored natural capital to alleviate poverty and help conserve nature: A case study from South Africa. J. Nat. Conserv. 2022, 14, 237–248. [Google Scholar] [CrossRef] [Green Version]
  8. Ten Brink, P.; Kettunen, M.; Vakrou, A.; Wittmer, H.; Armstrong, J.; Rayment, M.; Ruhweza, A.; Shine, C.; Berghöfer, A.; Neuville, A.; et al. The Economics of Ecosystems and Biodiversity in National and International Policy Making; Earthscan: London, UK; Washington, DC, USA, 2011; ISBN 9781849775496. [Google Scholar]
  9. Xie, G.D.; Lu, C.X.; Zheng, D.; Li, S.C. Ecological assets valuation of the Tibetan Plateau. J. Nat. Resour. 2003, 18, 189–196. [Google Scholar]
  10. Daily, G.; Postel, S.; Bawa, K.; Kaufman, L. Nature’s Service: Social Dependence on Natural Ecosystems; Island Press: Washington, DC, USA, 1997; ISBN 1-55963-476-6. [Google Scholar]
  11. Samantha, S.K.S.; Van Teeffelen, A.J.; Verburg, P.H. Integrating socio-cultural perspectives into ecosystem service valuation: A review of concepts and methods. Ecol. Econ. 2015, 114, 67–68. [Google Scholar]
  12. De Groot, R.; Brander, L.; van der Ploeg, S.; Costanza, R.; Bernard, F.; Braat, L.; Christie, M.; Crossman, N.; Ghermandi, A.; Hein, L.; et al. Global estimates of the value of ecosystems and their services in monetary units. Ecosyst. Serv. 2012, 1, 50–61. [Google Scholar] [CrossRef]
  13. Zhang, X.B.; Liu, J.; Shi, P.J.; Zhou, L. Spatial-temporal evolution pattern and terrain gradient differentiation of ecosystem service value in Zhangye, Northwest China at the grid scale. J. Appl. Ecol. 2020, 31, 543–553. [Google Scholar]
  14. He, C.J.; Shao, H.Y.; Xian, W. Spatiotemporal Variation and Driving Forces Analysis of Eco-System Service Values: A Case Study of Sichuan Province, China. Int. J. Environ. Res. Public Health 2022, 19, 8595. [Google Scholar] [CrossRef] [PubMed]
  15. Xie, G.D.; Zhen, L.; Lu, C.X.; Xiao, Y.; Li, W.H. Applying Value Transfer Method for Eco-Service Valuation in China. J. Resour. Ecol. 2010, 1, 51–59. [Google Scholar]
  16. Ye, Y.Q.; Zhang, J.E.; Wang, T.; Bai, H.; Wang, X.; Zhao, W. Changes in Land-Use and Ecosystem Service Value in Guangdong Province, Southern China, from 1990 to 2018. Ecol. Indic. 2021, 10, 426. [Google Scholar] [CrossRef]
  17. Gao, X.; Shen, J.Q.; He, W.J.; Zhao, X.; Li, Z.C.; Hu, W.F.; Wang, J.Z.; Ren, Y.J.; Zhang, X. Spatial-temporal analysis of ecosystem services value and research on ecological compensation in Taihu Lake Basin of Jiangsu Province in China from 2005 to 2018. J. Clean. Prod. 2021, 317, 128241. [Google Scholar] [CrossRef]
  18. Guo, X.M.; Fang, C.L.; Mu, X.F.; Chen, D. Coupling and coordination analysis of urbanization and ecosystem service value in Beijing-Tianjin-Hebei urban agglomeration. Ecol. Indic. 2022, 137, 108782. [Google Scholar]
  19. Niu, Y.N.; Xie, G.D.; Xiao, Y.; Qin, K.Y.; Gan, S.; Liu, J.Y. Spatial and Temporal Changes of Ecosystem Service Value in Airport Economic Zones in China. Land 2021, 10, 1054. [Google Scholar] [CrossRef]
  20. Deng, X.; Li, Z.; Huang, J.; Shi, Q.G.; Li, Y.F. A Revisit to the Impacts of Land Use Changes on the Human Wellbeing via Altering the Ecosystem Provisioning Services. Adv. Meteorol. 2013, 2013, 907367. [Google Scholar] [CrossRef] [Green Version]
  21. Zhang, D.; Wang, X.R.; Qu, L.P.; Li, S.C.; Lin, Y.P.; Yao, R.; Zhou, X.; Li, J.Y. Land use/cover predictions incorporating ecological security for the Yangtze River Delta region, China. Ecol. Indic. 2020, 119, 106841. [Google Scholar] [CrossRef]
  22. Tang, Z.X.; Zhou, Z.X.; Wang, D.; Luo, F.B.; Bai, J.Z.; Fu, Y. Impact of vegetation restoration on ecosystem services in the Loess plateau, a case study in the Jinghe Watershed, China. Ecol. Indic. 2022, 142, 109183. [Google Scholar] [CrossRef]
  23. Duan, X.Y.; Chen, Y.; Wang, L.Q.; Zheng, G.D.; Tao, L. The impact of land use and land cover changes on the landscape pattern and ecosystem service value in San jiang yuan region of the Qinghai-Tibet Plateau. J. Environ. Manag. 2023, 325, 116539. [Google Scholar] [CrossRef]
  24. Fan, F.F.; Xiao, C.W.; Feng, Z.M.; Chen, Y. Land-planning management based on multiple ecosystem services and simulation in tropical forests. J. Environ. Manag. 2022, 325, 116216. [Google Scholar] [CrossRef] [PubMed]
  25. Williams, A.; Hedlund, K. Indicators of soil ecosystem services in conventional and organic arable fields along a gradient of landscape heterogeneity in southern Sweden. Appl. Soil Ecol. 2013, 65, 1–7. [Google Scholar] [CrossRef]
  26. Xia, C.; Li, Y.; Xu, T.; Ye, Y.; Shi, Z.; Peng, Y.; Liu, J. Quantifying the spatial patterns of urban carbon metabolism: A case study of Hangzhou, China. Ecol. Indic. 2018, 95, 474–484. [Google Scholar] [CrossRef]
  27. Tang, F.; Fu, M.C.; Wang, L.; Zhang, P.T. Land-use change in Changli County, China: Predicting its spatio-temporal evolution in habitat quality. Ecol. Indic. 2020, 127, 106719. [Google Scholar] [CrossRef]
  28. Xiao, Y.; Huang, M.L.; Xie, G.D.; Zhen, L. Evaluating the impacts of land use change on ecosystem service values under multiple scenarios in the Hunshandake region of China. Sci. Total Environ. 2022, 850, 158067. [Google Scholar] [CrossRef]
  29. Ding, Q.L.; Chen, Y.; Bu, L.T.; Ye, Y.M. Multi-Scenario Analysis of Habitat Quality in the Yellow River Delta by Coupling FLUS with In VEST Model. Int. J. Environ. Res. Public Health 2021, 18, 2389. [Google Scholar] [CrossRef] [PubMed]
  30. Sun, J.F.; Zhang, Y.; Qin, W.S. Estimation and Simulation of Forest Carbon Stock in Northeast China Forestry Based on Future Climate Change and LUCC. Remote Sens. 2022, 14, 3653. [Google Scholar] [CrossRef]
  31. Liang, X.; Guan, Q.; Clarke, K.C.; Liu, S.; Wang, B.; Yao, Y. Understanding the drivers of sustainable land expansion usinga patch-generating land use simulation (PLUS) model: A case study in Wuhan, China. Comput. Environ. Urban Syst. 2021, 85, 101569. [Google Scholar] [CrossRef]
  32. Yang, J.; Wang, Y.C.; Guo, L.; Xue, D. Patterns and structures of land use change in the Three Rivers Headwaters region of China. PLoS ONE 2015, 10, e119121. [Google Scholar] [CrossRef] [Green Version]
  33. Yu, H.; Luedeling, E.; Xu, J. Winter and spring warming result in delayed spring phenology on the Tibetan Plateau. Proc. Natl. Acad. Sci. USA 2010, 107, 22151–22156. [Google Scholar] [CrossRef] [Green Version]
  34. Chen, Q.; Zhou, Q.; Zhang, H.F.; Liu, F.G. Spatial disparity of NDVI response in vegetation growing season to climate change in the Three-River Headwaters Region. Ecol. Environ. 2010, 19, 1284–1289. [Google Scholar]
  35. Ding, M.; Zhang, Y.; Sun, X.; Liu, L.; Wang, Z.; Bai, W. Spatiotemporal variation in alpine grassland phenology in the Qinghai-Tibetan Plateau from 1999 to 2009. Sci. Bull. 2012, 57, 3185–3194. [Google Scholar] [CrossRef] [Green Version]
  36. Wang, G.X.; Liu, G.S.; Li, C.J. Efects of changes in alpine grass land vegetation cover on hllslope hydrological processes in a permafrost watershed. J. Hydrol. 2012, 444–445, 22–33. [Google Scholar]
  37. Liu, J.Y.; Bing, L.F.; Shao, Q.Q. Characteristic of Land Cover Changes in the Yellow River Headwaters Region over the Past 30 Years. Geo-Spat. Inf. Sci. 2011, 13, 289–296. [Google Scholar]
  38. Huang, L.; Shao, Q.; Liu, J. Spatial-temporal Analysis of Soil Erosion in Grassland over the Past Three Decades in Sanjiangyuan Region, Qinghai Province, China. Geo-Spat. Inf. Sci. 2011, 13, 12–21. [Google Scholar] [CrossRef]
  39. Wu, X.F.; Li, G.X.; Pan, X.P.; Wang, Y.; Zhang, S.; Liu, G.; Shen, Y. Response of vegetation cover to temperature and precipitation in the source region of the Yellow River. Resour. Sci. 2015, 37, 512–521. [Google Scholar]
  40. Liu, L.L.; Cao, W.; Shao, Q.Q. Different Characteristics of Land Cover Changes in Source Regions of the Yangtze River and the Yellow River in the Past 30 Year. Sci. Geogr. Sin. 2017, 37, 311–320. [Google Scholar]
  41. Zhang, L.; Fan, J.; Shao, Q.; Tang, F.; Zhang, H.; Li, Y. Changes in grassland yield and grazing pressure in the Three Rivers headwater region before and after the implementation of the eco-restoration project. Acta Prataculturae Sin. 2014, 23, 116–123. [Google Scholar]
  42. Zhang, Y.; Liu, L.; Wang, Z.; Bai, W.; Ding, M.; Wang, X.; Yan, J.; Xu, E.; Wu, X.; Zhang, B.; et al. Spatial and temporal characteristics of land use and cover changes in the Tibetan Plateau. Chin. Sci. Bull. 2019, 64, 2865–2875. [Google Scholar]
  43. Chen, Q.; Zhang, Y.L.; Liu, F.G.; Zhou, Q.; Wang, S.Z.; Cheng, Y.; Guo, R.; Zhi, Z.M.; Xu, H.Y. A review of land use change and its influence in the source region of Yellow River. Resour. Sci. 2020, 42, 446–459. [Google Scholar] [CrossRef]
  44. Sun, S.; Shi, Q. Global Spatio—Temporal Assessment of Changes in Multiple Ecosystem Services Under Four IPCC SRES Land-use Scenarios. Earth’s Future 2020, 8, e2020EF001668. [Google Scholar] [CrossRef]
  45. Bryan, B.A.; Gao, L.; Ye, Y.; Sun, X.; Connor, J.D.; Crossman, N.D.; Stafford-Smith, M.; Wu, J.; He, C.; Yu, D.; et al. China’s response to a national land-system sustainability emergency. Nature 2018, 559, 193–204. [Google Scholar] [CrossRef] [PubMed]
  46. Cao, W.; Liu, L.L.; Wu, D.; Huang, L. Spatial and temporal variations and the importance of hierarchy of ecosystem functions in the Three-river-source National Park. Acta Ecol. Sin. 2019, 39, 1361–1374. [Google Scholar]
  47. Chen, J.; Chen, J.; Liao, A.P. Remote Sensing Mapping of Global Land Cover; Science Press: Beijing, China, 2016; ISBN 9787030494351. [Google Scholar]
  48. Chen, J.; Ban, Y.; Li, S. Open access to Earth land-cover map. Nature 2014, 514, 434. [Google Scholar]
  49. Hoque, M.Z.; Islam, I.; Ahmed, M.; Hasan, S.S.; Prodhan, F.A. Spatio-temporal changes of land use land cover and ecosystem service values in coastal Bangladesh. Egypt. J. Remote Sens. Space Sci. 2022, 25, 173–180. [Google Scholar]
  50. Felipe-Lucia, M.R.; Soliveres, S.; Penone, C.; Fischer, M.; Ammer, C.; Boch, S.; Boeddinghaus, R.S.; Bonkowski, M.; Buscot, F.; Fiore-Donno, A.M.; et al. Land-use intensity alters networks between biodiversity, ecosystem functions, and services. Proc. Natl. Acad. Sci. USA 2020, 117, 28140–28149. [Google Scholar] [CrossRef]
  51. Fischer, G.; Nachtergaele, F.; Prieler, S.; van Velthuizen, H.T.; Verelst, L.; Wiberg, D. Global Agro-Ecological Zones Assessment for Agriculture (GAEZ 2008); IIASA Laxenburg Austria and FAO: Rome, Italy, 2008. [Google Scholar]
  52. Zhang, H.; Wang, Z.Q.; Chai, J. Land use\cover change and influencing factors inside the urban development boundary of different level cities: A case study in Hubei Province, China. Heliyon 2022, 8, e10408. [Google Scholar] [CrossRef]
  53. Hu, Y.; Zhen, L.; Zhuang, D. Assessment of Land-Use and Land-Cover Change in Guangxi, China. Sci. Rep. 2019, 9, 2189. [Google Scholar] [CrossRef] [Green Version]
  54. Verburg, P.H.; Overmars, K.P. Combining top-down and bottom-up dynamics in land use modeling: Exploring the future of abandoned farmlands in Europe with the Dyna-CLUE model. Landsc. Ecol. 2009, 24, 1167–1181. [Google Scholar] [CrossRef]
  55. McHugh, M.L. Interrater reliability: The kappa statistic. Biochem. Med. (Zagreb) 2012, 22, 276–282. [Google Scholar] [CrossRef]
  56. Balian, H.G.; Eddy, N.W. Figure-of-merit (FOM), an improved criterion over the normalized chi-squared test for assessing goodness-of-fit of gamma-ray spectral peaks. Nucleaar Instrum. Methods 1977, 145, 389–395. [Google Scholar] [CrossRef]
  57. Lou, Y.; Yang, D.; Zhang, P.; Zhang, Y.; Song, M.; Huang, Y.; Jing, W. Multi-Scenario Simulation of Land Use Changes with Ecosystem Service Value in the Yellow River Basin. Land 2022, 11, 992. [Google Scholar] [CrossRef]
  58. Wang, Z.; Li, X.; Mao, Y.; Li, L.; Wang, X.; Lin, Q. Dynamic simulation of land use change and assessment of carbon storage based on climate change scenarios at the city level: A case study of Bortala, China. Ecol. Indic. 2022, 134, 108499. [Google Scholar] [CrossRef]
  59. Liu, B.; Pan, L.; Qi, Y.; Guan, X.; Li, J.S. Land Use and Land Cover Change in the Yellow River Basin from 1980 to 2015 and Its Impact on the Ecosystem Services. Land 2021, 10, 1080. [Google Scholar] [CrossRef]
  60. Zhang, P.; Geng, W.; Yang, D.; Li, Y.; Zhang, Y.; Qin, M. Spatial and temporal evolution of land use and ecosystem service values in the lower reaches of the Yellow River. Trans. Chin. Soc. Agric. Eng. 2020, 36, 277–288. [Google Scholar]
  61. Liu, X.P.; Liang, X.; Li, X.; Xu, X.C.; Ou, J.P.; Chen, Y.M.; Li, S.Y.; Wang, S.J.; Pei, F.G. A future land use simulation model (FLUS) for simulating multiple land use scenarios by coupling human and natural effects. Landsc. Urban Plan. 2017, 168, 94–116. [Google Scholar] [CrossRef]
  62. Dong, N.; You, L.; Cai, W.J.; Li, G.; Lin, H. Land use projections in China under global socioeconomic and emission scenarios: Utilizing a scenario-based land-use change assessment framework. Glob. Environ. Change 2018, 50, 164–177. [Google Scholar] [CrossRef]
  63. Huang, Y.; Huang, J.L.; Liao, T.J.; Liang, X.; Tian, H. Simulating urban expansion and its impact on functional connectivity in the Three Gorges Reservoir Area. Sci. Total Environ. 2018, 643, 1533–1561. [Google Scholar] [CrossRef]
  64. Zhai, H.; Lv, C.; Liu, W.; Yang, C.; Fan, D.; Wang, Z.; Guan, Q. Understanding Spatio-Temporal Patterns of Land Use/Land Cover Change under Urbanization in Wuhan, China, 2000–2019. Remote Sens. 2021, 13, 3331. [Google Scholar] [CrossRef]
  65. Zhang, D.; Wang, J.P.; Wang, Y.; Xu, L.; Zhang, L.; Zhang, B.Z.; Bi, Y.Z.; Yang, H. Is There a Spatial Relationship between Urban Landscape Pattern and Habitat Quality? Implication for Landscape Planning of the Yellow River Basin. Environ. Res. Public Health 2022, 19, 11974. [Google Scholar] [CrossRef]
Figure 1. Location map of the study area, Yellow River Source Area (YRSA).
Sustainability 15 00687 g001
Figure 2. PLUS model flow chart.
Sustainability 15 00687 g002
Figure 3. Land use distribution in the YRSA from 2000 to 2020. (N1 and E1 are strongly changed areas).
Sustainability 15 00687 g003
Figure 4. Land use transfer Sankey map (only areas of land use type change are retained).
Sustainability 15 00687 g004
Figure 5. Distribution of ESV in the YRSA from 2000 to 2020.
Sustainability 15 00687 g005
Figure 6. Land use intensity and ESV correlation coefficients and significance coefficients.
Sustainability 15 00687 g006
Figure 7. Spatial distribution of land use types in the YRSA under different scenarios.
Sustainability 15 00687 g007
Figure 8. (a) ESVs of the YRSA under different scenarios; (b) the value of different ecosystem services in YRSA under different scenarios.
Sustainability 15 00687 g008
Table 1. Land use type classification and intensity.
Macro LULC ClassesMicro LULC Classes Information Level of Intensity
Construction landSurface formed by man-made construction activities, including various residential areas, industrial mines and transportation facilities in towns.7
FarmlandLand used for growing crops, including paddy fields, dry land, vegetable fields, pastureland, orchards.6
ForestThe land covered by trees with crown coverage over 30% and the land covered by shrubs with shrub coverage over 30% are forest, shrub land, open forest land and immature forest land.5
GrasslandThe land covered by natural herbaceous vegetation with coverage higher than 10% includes grassland, meadow, savanna and desert grassland.4
WetlandLand with shallow water or over-wet soil, including inland marshes, lake marshes and shrub wetlands.3
Water areaLiquid water covered areas and ice-covered areas, including rivers, lakes, glaciers, beaches.2
Unused landNaturally covered land with less than 10% vegetation cover, including saline, sandy, bare rock and bare tundra.1
Table 2. Nine sources of drivers chosen for the study.
Driving FactorsData Source
PrecipitationNOAA (https://www.noaa.gov/, accessed on 1 October 2021)
Temperature
DEMGeospatial Data Cloud (www.gscloud.cn, accessed on 1 October 2021)
Slope
Aspect
Soil typeHarmonized World Soil Database v 1.2 [51] (https://www.fao.org/soils-portal/soil-survey/soil-maps-and-databases/harmonized-world-soil-database-v12/en/, accessed on 1 October 2021)
Distance from senior roadsOpenStreetMap (https://www.openstreetmap.org/, accessed on 1 October 2021)
Distance from minor roads
Distance from the river
Table 3. Ecosystem service value per unit area of different land use types in the YRSA (CNY/hm2).
Ecosystem ServicesLand Use Types
Primary ClassificationSecondary ClassificationFarmlandForestGrasslandWetlandWater AreaConstruction LandUnused Land
Provisioning servicesFood supply777.98231.11213.56466.79366.110.004.58
raw material supply366.11530.86314.24457.64105.260.0013.73
Water supply18.31274.58173.902370.574782.320.009.15
Regulating servicesGas regulation613.241745.891104.431739.02434.760.0059.49
Climate regulation329.505223.942919.733294.991295.120.0045.76
Purify environment91.531530.80964.093294.992613.110.00187.63
Hydrological regulation247.123418.562138.7022,177.1450,051.880.00109.83
Supporting servicesSoil formation and retention942.732125.731345.462114.29425.600.0068.65
Maintain nutrient cycling109.83162.46103.73164.7532.030.004.58
Biodiversity protection118.991935.811223.427203.221171.550.0064.07
Cultural servicesRecreation and culture54.92848.92540.014329.26906.120.0027.46
Total3670.2618,028.6511,041.2847,612.6762,183.860.00594.93
Table 4. The YRSA’s ESV for different land use types from 2000 to 2020 (CNY 108).
YearFarmlandForestGrasslandWetlandWater AreaConstruction LandUnused LandTotal
2000ESV5.86.131283.73263.1132.9602.951694.66
Proportion (%)0.34%0.36%75.75%15.53%7.85%0.00%0.17%
2010ESV7.724.561261.59296.21146.9803.311720.38
Proportion (%)0.45%0.27%73.33%17.22%8.54%0.00%0.19%
2020ESV12.084.931215.7315.23149.2404.691701.87
Proportion (%)0.71%0.29%71.43%18.52%8.77%0.00%0.28%
Table 5. YRSA Value of different ecosystem services in 2000 to 2020 (CNY 108).
Primary
Classification
Secondary Classification200020102020
Provisioning servicesFood supply29.5229.8930.14Sustainability 15 00687 i001
Raw material supply40.1239.9839.34
Water supply43.7146.0846.53
Regulating servicesGas regulation140.80140.10137.13
Climate regulation362.97359.44349.27
Purify environment137.48138.46136.44
Hydrological regulation480.32502.64505.05
Supporting servicesSoil formation and retention171.58170.80167.39
Maintain nutrient cycling13.2913.2513.03
Biodiversity protection185.71188.47186.63
Cultural servicesRecreation and culture89.1691.2690.92
Total1694.661720.381701.87
Table 6. Future land use quantities in the YRSA under different scenarios.
LULCArea (km2)
NDSEPSCNSPPS
Farmland4398.393254.303723.964798.71Sustainability 15 00687 i002
Forest287.39473.55297.00285.50
Grassland106,383.85108,890.31110,199.61108,593.89
Wetland7011.147062.836266.296931.61
Water area2444.722480.582496.062439.40
Construction land477.89366.41443.75441.84
Unused land9885.738361.137462.447398.14
Total130,889.11130,889.11130,889.11130,889.11
Table 7. ESV of YRSA in 2030 under different scenarios (CNY 108).
Primary ClassificationSecondary Classification2020NDSEPSCNSPPS
Provisioning servicesFood supply30.1430.4230.1430.3731.15
Raw material supply39.3438.8039.2739.3839.56
Water supply46.5347.0647.8146.1747.22
Total116.01116.28117.22115.93117.93
Regulating servicesGas regulation137.13134.54136.94136.94136.93
Climate regulation349.27340.28348.34348.75346.48
Purify environment136.44134.75137.33135.61136.17
Hydrological regulation505.05508.53517.02502.34511.04
Total1127.881118.101139.631123.641130.62
Supporting servicesSoil formation and retention167.39164.43167.14167.23167.44
Maintain nutrient cycling13.0312.8413.0113.0313.09
Biodiversity protection186.63185.23188.84184.38187.24
Total367.05362.51368.99364.65367.77
Cultural servicesRecreation and culture90.9290.7792.4489.5691.57
Total90.9290.7792.4489.5691.57
Total1701.871687.661718.281693.781707.90
Disclaimer/Publisher’s Note: The statements, opinions and data contained in all publications are solely those of the individual author(s) and contributor(s) and not of MDPI and/or the editor(s). MDPI and/or the editor(s) disclaim responsibility for any injury to people or property resulting from any ideas, methods, instructions or products referred to in the content.

