Article

Spatial-Temporal Changes in Water Supply and Demand in the Citarum Watershed, West Java, Indonesia Using a Geospatial Approach

1
Research Center for Geospatial, National Research and Innovation Agency of Indonesia (BRIN), Jalan Raya Jakarta-Bogor KM 46 Cibinong, Bogor 16911, Indonesia
2
Faculty of Agriculture, Djuanda University, Jl. Tol Ciawi No.1, Ciawi, Bogor 16720, Indonesia
3
Research Center for Ecology and Ethnobiology, National Research and Innovation Agency of Indonesia (BRIN), Jalan Raya Jakarta-Bogor Km. 46, Cibinong, Bogor 16911, Indonesia
*
Author to whom correspondence should be addressed.
Sustainability 2023, 15(1), 562; https://doi.org/10.3390/su15010562
Submission received: 14 November 2022 / Revised: 2 December 2022 / Accepted: 13 December 2022 / Published: 28 December 2022

Abstract

:
Balancing water supply demand is vital for sustaining livelihoods. Spatial mapping and calculating water yield dynamics due to land use changes over decades are needed to manage land resources and formulate ecological protection policies. This study mapped the supply, demand, and matching status of water product service using the Integrated Valuation of Ecosystem Service and Tradeoff (InVEST) biophysical models in the Citarum Watershed (CW) in 2000, 2010, and 2020. Moreover, this study used Exploratory Spatial Data Analysis (ESDA) and Geographic Information System (GIS) techniques to study the agglomeration characteristics and evolutionary trajectories of supply–demand over two decades. The results showed that between 2000–2010 and 2010–2020, the water supply decreased by 19.01 × 10⁸ m3 (18.28%) and 12.97 × 10⁸ m3 (15.27%), respectively. However, the water demand in the same period increased by 6.17 × 10⁸ m3 (23%) and 15.74 × 10⁸ m3 (47%), respectively. Over the decades, the contribution of land use land cover (LULC) changes to variations in water supply has yielded values ranging from 2.87% to 6.37%. The analysis of the water supply–demand imbalance indicated that the entire CW experienced water shortage, and the type of spatial matching for supply and demand is dominated by a high supply and high demand class (16.09% of the total area). Based on the level of water deficit calculation, the upstream and downstream areas were identified as zones that require ecological conservation, while the middle CW area requires ecological restoration or ecological improvement.

1. Introduction

Water scarcity and groundwater depletion are severe problems in many countries, including Indonesia [1,2], especially north and south of West Java Province [3,4]. Population growth is one factor that directly affects the increase in water consumption and indirectly for the increase in food production and consumption. Recent advances in economic growth, accelerating urban expansion, substantial population increases, and the impacts of climate change have been found to cause a net mass loss of water balance systems in specific locations. The imbalance of water supply demand is due to an increase in water consumption, while the volume of water per capita has consistently decreased [5,6]. According to [7], the rapid increase in population growth and the rapid development of human society have led to an imbalance between the supply and demand for food, leading to a significant effect on land use change, particularly the growth of agricultural land.
The water supply (WS) and water demand (WD) imbalance will affect regional ecosystems and sustainable socioeconomic development [8]. The ratio of WS to WD provides a valuable index for geographic assessment of water value and the health of ecosystems, thereby revealing the essential locations to conserve water yield. Determining whether regions have WD that are not being fully satisfied requires a spatial assessment of supply and demand [9]. The greatest imbalance between supply and demand was found in domestic use, while the minimum was in the industry sector [10].
One of the reasons why the water imbalance occurred is the LULC changes in the CW, which increased the surface runoff coefficient [11] due to the growth in the area of built-up land and plantations in the upstream CW. This ultimately has the potential to increase flooding occurrences, as well as lower water infiltration [8], which has a negative impact on land degradation [12].
On the other hand, water resource management must assess the impact of LULC change on hydrology. The increase in the area defined by each class of LULC is not ne-cessarily linear to the observed flow, and LULC classes with widely disparate characteristics may exhibit similar flow responses. In contrast, classes of similar characteristics could have dissimilar impacts on flows within a sub-basin. To put it another way, the hydrolo-gical processes are too complex to simplify at the subbasin level [13].
One of the watersheds that is a priority for the government of Indonesia to accelerate pollution and damage control is the CW, a crucial source of water for Bandung and Jakarta. The ecosystem services provided by the CW are essential for comprehending hydrological conditions through estimating factors influencing water production. They are also a critical asset for urban and industrial growth, along with economic growth, agriculture, fisheries, and hydroelectric power generation of West Java Province and Jakarta City [14]; the total WD in the Citarum region was 52.20 × 10⁸ m3/year in 2000 [15].
To monitor and evaluate water resources, extensive research is needed. Recent research has examined water resources originating from watersheds. Several studies have investigated the influence of changes in water yield (WY) on watersheds at the local scale in Indonesia that do not yet incorporate water demand (WD). However, most studies have not spatially considered the relationship between WS and WD [16].
On the other hand, analyzing the watershed is also necessary to increase the location precision. One of the tools is Exploratory Spatial Data Analysis (ESDA), a set of several spatial data analysis methods used to define and represent the spatial distribution of information, which can explain spatial discrepancies in data and reveal the mechanisms underlying spatial relationships between events [17]. ESDA allows the description and display of spatial distributions, the detection of unusual places or spatial outliers, and the discovery of spatial patterns. Thus, ESDA can aid in developing a hypothesis for spatial regimes or other types of spatial heterogeneities [18]. ESDA was initially only applied in the economic and social sciences [18,19], but in its development, ESDA has been widely used in several other fields such as geography, environmental science [20,21] and water resources [6,22].
One of the methods for monitoring and evaluating WY is using the Integrated Valuation of Ecosystem Service and Tradeoff (InVEST) Model. The InVEST model is extensively used and has been demonstrated to be particularly helpful for establishing ecosystem services, such as WY [17], in numerous river basin areas, among others, in the China watershed [23] and also in several locations in Indonesia [24,25,26].
Many studies in various regions of the world, including Indonesia, have examined WS changes in watersheds that only consider the aspect of WS and do not involve WD. However, only a few investigations have been carried out that also pay attention to aspects of WS and WD and their relationship. Therefore, this study focuses on filling the gap in the availability of a WS model that considers the WS and WD aspects. The main objectives of this study are to (1) evaluate the spatial-temporal changes in the WY period 2000 to 2020 and its relationship to LULC change; (2) analyze the status of water scarcity based on spatial and temporal in the CW; and (3) examine the spatial characteristics of supply and demand of WY service. This study is expected to enrich the sustainable understanding of LULC and watershed management.

2. Materials and Methods

2.1. Overview of the Study Area

The research was conducted in the CW area, which divides into three sub-watersheds (Downstream Citarum Watershed (Downstream CW), Middle Citarum Watershed (Middle CW), and Upstream Citarum Watershed (Upstream CW)) (Figure 1).
The CW covers an 11,317 km2 area located in West Java Province that encompasses 13 regencies and is situated between 106°51′36′′–107°51′ E and 7°19′–6°24′ S. CW’s climate is characterized by at least three dry months with an average rainfall of 2358 mm. The Citarum River is crossed by three main dams: Saguling, Cirata, and Jatiluhur as storage dams for electricity, agriculture, and freshwater for society living in several regencies in West Java [27].
Morphological conditions are present in various landscapes ranging from volcanic edifices to hillsides. Furthermore, the mountains upstream of the Citarum tributary range in elevation from 750 to 2300 m above sea level, with slopes ranging from 5 to 15% at the foot, 15 to 30% at the mountain slope, and 30 to 90% at the peak, whereas the plains upstream are morphologically in the form of volcanic edifices with mild relief characteristics [27,28].

2.2. Data Sources and Processing

For data processing, we used the ArcGIS ver. 10.3 software, Integrated Valuation of Ecosystem Service and Tradeoff (InVEST) Model, GeoDa, and R Studio [18,29,30].
InVEST is a spatially explicit tool for exploring how changes in ecosystems tend to lead to changes in benefits to people. GeoDa is an open-source and cross-platform desktop software program for spatial data analysis. It is not a geographic information system, but it can be used for the visualization and exploration of geospatial data [18,31].
The input data were converted from vector data into raster data format with 30 m spatial resolution and the WGS84 datum was referred to as input for InVEST. The source of remote sensing data and a series of secondary data are listed in Table 1.
In this study, the data source comes from secondary data sources. The data used include watershed and sub-watershed boundaries, rainfall (mm), LULC maps, soil depth (mm), average yearly evapotranspiration potential (mm), and plant available water content (PAWC) percentage. All of the input data can be explained as follows:
LULC. Ministry of Environment and Forestry used Landsat as a primary satellite source to delineate LULC changes from 1996 until 2017. The primary imagery for the LULC product in 2000 and 2010 was Landsat-7 with 30 m spatial resolution. Furthermore, both LULC products used the same methodology to create the LULC product with different periods as follows: (a) extracting satellite images; (b) preprocessing satellite images for correcting the geometric, atmospheric, saturation, topographic error and SLC-off error; (c) identification and masking the clouds and shadows; (d) mosaicking the images into single clear images; extracting the NDVI values with formula NDVI = (NIR-Red)/(NIR + Red); and the experts interpreting/digitizing on screen-based of the satellite images and NDVI values using its local expertise and some baseline surveys. There are 23 classes of the classification map, including forestry (seven classes), bushes (three classes), agriculture (four classes), the build-up (three classes), water bodies (four classes), open mines, and clouds. The accuracy of each LULC product is 91.2% for 2000 and 91.7% for 2010, respectively (http://pktl.menlhk.go.id/, accessed 30 November 2021). The limitations of LULC for 2000 and 2010 from the Ministry of Environment and Forestry are that the classification process had high labor costs, and the resolution was still course (<10 m), which may have underestimated the small patch area, especially in the small agriculture expansion area.
Changes in the forest (woody plants) in Landsat imagery can be easily recognized when a ten-year period is chosen. All LULC data were classified into 11 categories: virgin forest, plantation forest, shrub, estate crops plantation, settlement area, bare land, dry agriculture, paddy field, fishpond, lake, and airport.
In modelling with InVEST, information about LULC and the corresponding code, root depth, and crop coefficient (Kc) are necessary. The root depth information does not need to be included for land without vegetation cover [29]. In this research, the vegetated LULC class is assigned a value of one, while the non-vegetated LULC class (such as water bodies, buildings, and settlements) is zero.
Rainfall. The statistics on yearly precipitation for the past 18 years come from different authorities. The National Bureau of Meteorology, Climatology, and Geophysics (BMKG), PT Jasa Tirta II, and Citarum Ciliwung River Basin Center (CCRB) provided rainfall data collected from 26 climatological stations (Figure 1).
Rainfall data analysis is grouped into three periods with the same period length of ten years. In the first ten years (1990–2000), the average yearly rainfall in the CW varied from 676 to 3894 mm/year. Moreover, for the following two analysis periods (2000–2010 and 2010–2020), the average rainfall at the study site is 817–3446 mm/year and 789–3284 mm/year, respectively. The need for an annual rainfall map in modelling with InVEST is met by making statistics on the average annual rainfall for each period and then using a spline interpolation technique. A similar technique is also used to construct monthly rainfall maps that play a role in calculating the monthly reference.
Evapotranspiration. The extraterrestrial solar energy, minimum and maximum air temperatures and monthly rainfall are used to compile the annual reference evapotranspiration map. Daily extraterrestrial solar radiation was calculated for each rainfall station and the results were accumulated to obtain monthly values. The spline interpolation technique was again applied to prepare the monthly outer space solar radiation map.
The air temperature data collected from local meteorological stations were limited and incomplete, so it was challenging to analyze changes in air temperature over time. Therefore, we used Landsat data to compute the temperature data. The materials used are Landsat 8 OLI/TIRS Path image 122 Row 64–65 Band 10 and Band 11, respectively, temporally from 2010 to 2018. The study in [32] calculated Land Surface Temperature (LST) using the Statistical Mono-Window (SMW) for deriving LST climate data records. The method employs simple linear regression and is based on an empirical relationship between top-of-atmosphere (TOA) brightness temperatures in a single TIR channel and LST. We used the Google earth engine (GEE) for land surface geospatial analysis using Landsat 8 Collection 1 Tier 1 calibrated TOA reflectance data collection. Details on the computation of Radiance and Reflectance are part of TOA computation [33]. Based on the Landsat 8 imagery and the ground-based LST, a linear regression model was applied to validate LST. The validation was conducted using 60 points distributed among the LST in situ stations.
The soil humus depth and the Plant Available Water Content (PAWC). Based on soil type data published by Balai Besar Wilayah Sungai Citarum (BBWS Citarum), the research area has ten soil types: (1) alluvial, (2) latosol, (3) regosol, (4) andosol, (5) lithosol, (6) grumusol, (7) Mediterranean, (8) Podsolic, (9) gley humus, and (10) resin. Soil solum depth is compiled based on the land system map. PAWC was estimated using specific software [34] based on soil type and texture. Default values are used for other factors in the InVEST model to deal with the scarcity of soil properties data.
Watershed Boundaries. The watershed and its 3 sub-watersheds boundary data are required as one of the inputs (shapefile) in the InVEST model. Information on the CW and sub-watershed boundaries was obtained from the Citarum-Ciliwung River Basin Center. To provide further detail for this study, we changed district boundaries (174 districts) to sub-watershed boundaries, resulting in 174 sub-watersheds.
Topographic Data and Digital Elevation Model. The data used include a 1:25,000 topographic digital map of Indonesia and an 8 m resolution DEM (Digital Elevation Model). These data are available openly (open-data) through the Geospatial Information Agency geoportal [35,36].
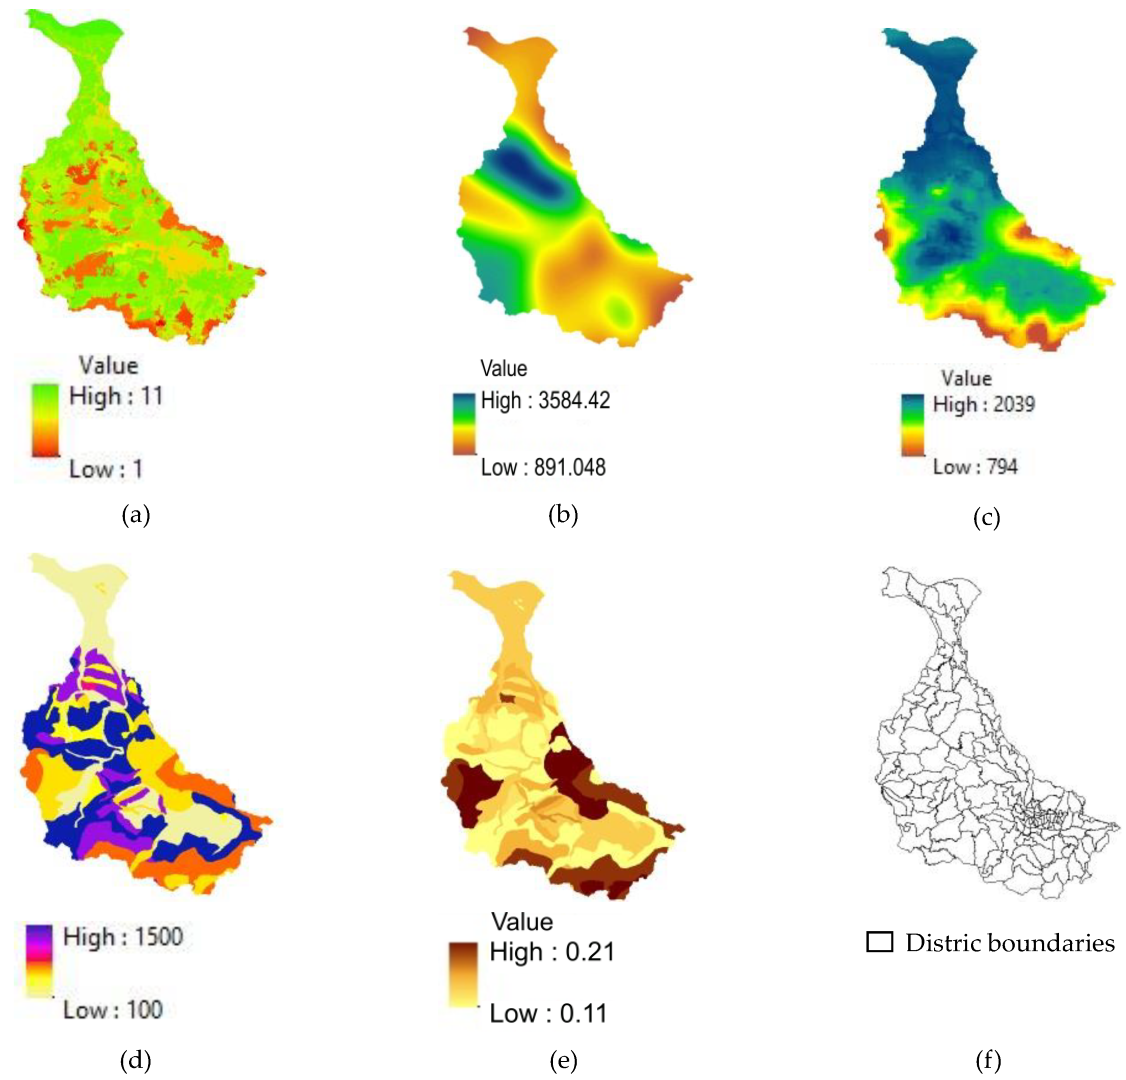
Data for WD. Due to limited access to data on industrial water, the demand for water services is limited to only agricultural water consumption, livestock water, and domestic water (rural and urban residents). Farm irrigation and cattle in rural areas both rely on agricultural water. Agricultural, household and ecological water use contribute to the total demand for water resources. CW population projections for 2000, 2010, and 2020 were culled from the relevant issues of Indonesia’s Statistical Yearbook [37,38,39]. Meanwhile, the standard document from the National Standardization Agency (BSN) provided information on water resource demand from various sectors [40]. An example of input data used for WY analysis using InVEST is presented in Figure 2.

2.3. Research Framework

Based on the WS and WD approach, we built a research framework in the CW to explore the supply–demand relationship and the spatial characteristics of the distribution of WY services (Figure 3).
  • With the prepared primary spatial data and the WY module from the InVEST model, the WY service from the Citarum is calculated and evaluated quantitatively (i.e., supply quantity). The results of model calculations are validated with water results from Badan Informasi Geospasial (BIG) and the Ministry of Public Works or previous research (Figure 3a). Furthermore, the WS map and WD map (grid data) are summarized by type of LULC using the zonal statistical tool in GIS software.
  • Water consumption (total WD) in the study area is calculated based on the standard of domestic WD, livestock and agriculture water use data from Badan Pusat Statistik (BPS) or Ministry of Public Works and the results of previous studies. In the study of WD for industry, no calculations were carried out. The calculation results present a demand model, exploring the spatial and temporal variations in WD in the Citarum (Figure 3b).
  • Water Scarcity Index (WSI). Based on activities 1 and 2, modelling the supply–demand balance, calculating the WSI and exploring the water security situation in the CW (Figure 3c).
  • Analysis of Supply and Demand Characteristics of WY.
    The relationship between supply and demand for water services in the area and their spatial distribution characteristics are obtained through the calculation of the supply–demand ratio and local Moran’s I, respectively (Figure 3d).
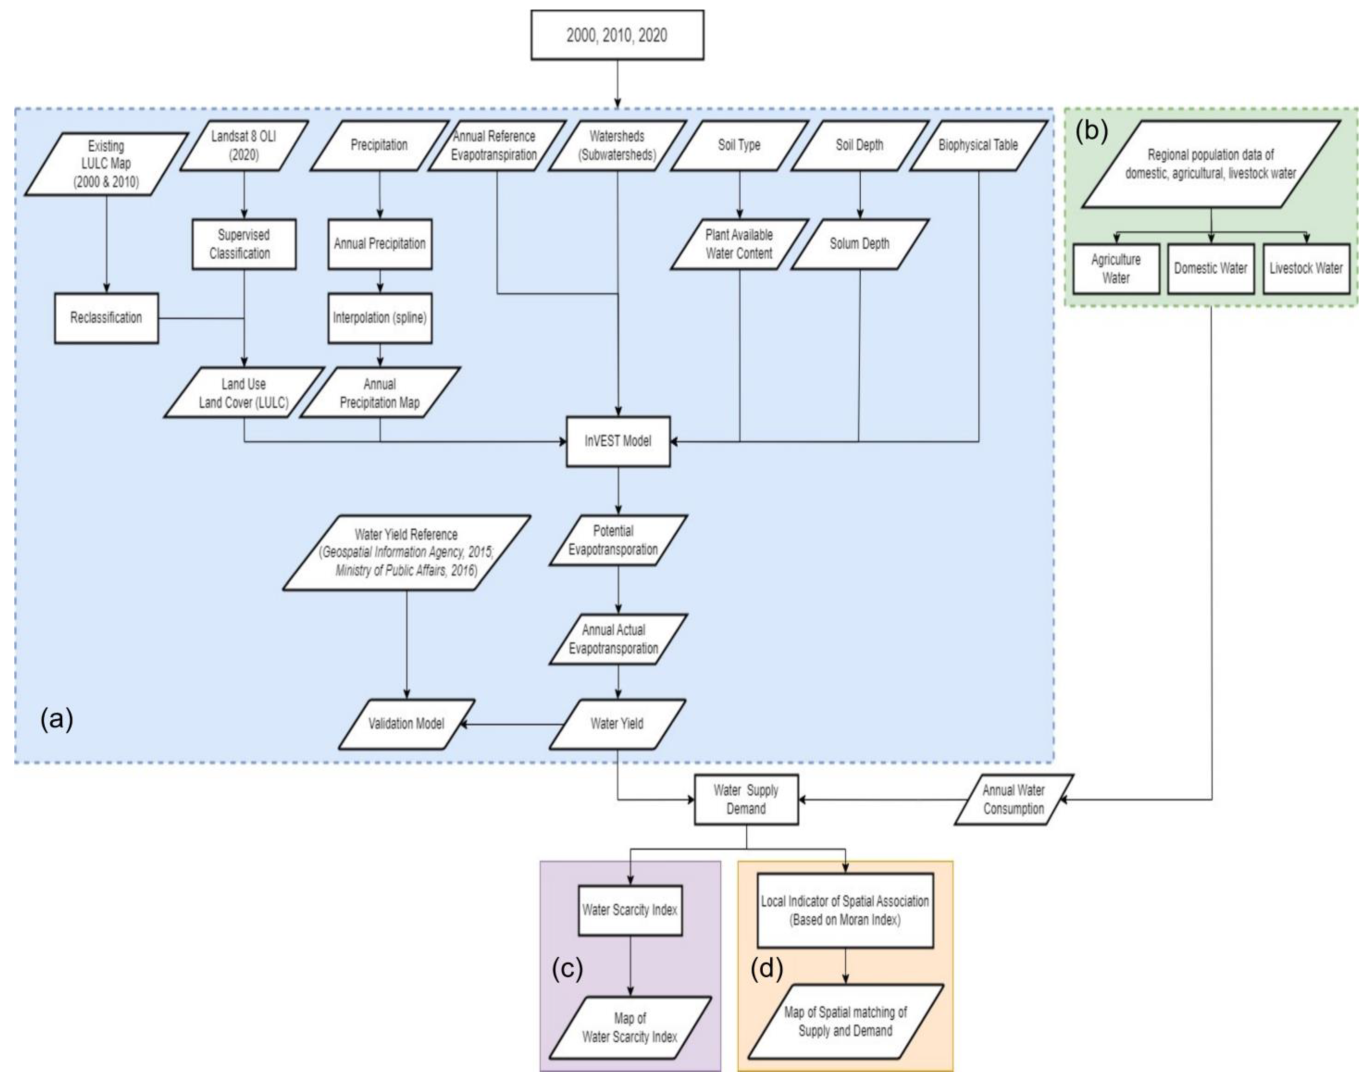
Figure 3. Research flowchart.
Sustainability 15 00562 g003

2.3.1. Spatial Patterns of WS

The InVEST model (https://naturalcapitalproject.stanford.edu/software/InVEST, accessed on 18 March 2022) was used to calculate the WY of CW. The inputs included LULC in the CW, annual precipitation, annual evapotranspiration, and a solum depth, with a result of annual WY. It was calculated using Equation (1) [41,42].
Y x = 1 A E T x P x × P x
where Y x is the annual precipitation on pixel x and A E T x is the actual annual evapotranspiration for pixel x.
The actual annual evapotranspiration is quite impossible to measure on a broad scale. AET was calculated using potential evapotranspiration (PET) in the InVEST model. Based on PET, calculating AET was simple [43], which was calculated by multiplying the reference evapotranspiration by the crop coefficient for each grid square. The specific equation is as follows [44]:
A E T x P x = 1 + P E T x P x 1 + P E T x P x ω 1 ω
ω x = Z   A W C x P x + 1.25
where ω x is calculated based on the plant’s available water content (AWC), the empirical constant Z, and precipitation [29,45]. Z is an empirical constant ranging from 1 to 30, reflecting regional hydrogeological characteristics. AWC, or available vegetation water content, is determined by the effective soil depth and texture. Consult the InVEST 3.2.0 Users Guide and earlier studies for further information [24,29].

2.3.2. Spatial Patterns of WD

WD was calculated in this study using the water consumption of anthropogenic activities such as agricultural water (Wagr), livestock water (Wliv), and domestic water (Wdom). The specific equation was listed as follows [9]:
W D   = W a g r + W l i v + W d o m
W D = (   A r e a Agr ×   W a t e r Agr   +   N Liv ×   W a t e r Liv   + P o p u × D o m ]
where Wagr is the agricultural water consumption, which was calculated by multiplying the area of agricultural lands (AreaAgr) by the average irrigation water per hectare (WaterAgr), while Wliv refers to the unit virtual water content of the livestock product (livestock water use), which was calculated by multiplying the number of livestock Nliv by the annual water consumption per livestcok (WaterLiv). The production of the livestock product is the total number of significant livestock products consumed in the region. Wdom refers to domestic water use, which was calculated by multiplying the population (Popu) by the annual water consumption per resident (Dom). The amount of water used for household in area and domestic WD were calculated using the formula referring to Indonesia National Standard Number SNI 19-6728.1-2002 [40]:
W dom = 365   d a y s   ×   q u 100   ×   P u
where, Wdom is WD for domestic water (m3/year), q(u) is water consumption (liter/resident/day) and P(u) is the total population
The dataset from the Geospatial Information Agency validated the WY resulting from InVEST [46]. The coefficient of determination (R2), root mean square error (RMSE), and Pearson correlation coefficient (r) were calculated to validate the model. The actual observed data and the model were subjected to linear regression analysis. R software was used for all statistical analyses.

2.3.3. The Imbalance between WS and WD

Water scarcity is defined as a condition where the available water resources fail to satisfy demand. In this case, there is an imbalance between water supply and water demand [22]. It is possible to gain insight into the nature of the regional water service surplus or shortfall by calculating the WY service supply (WS) ratio to the WD. According to [47], the formula for the computation is as follows:
S D R = S i D i
The acronym SDR denotes the ratio of available water to the water used. Sub-watershed i has a supply, denoted by Si, and a demand, denoted by Di. When it comes to water, a surplus occurs when supply is more significant than demand, and a deficit occurs when demand is more significant than supply.
By tallying up the amount of available water and how much is used, we can obtain the SDR for the entire CW. One standard dividing line between WS and demand surplus and the deficit is the point where supply equals demand (demand exceeds supply).
We utilized mismatches among WS and WD, which could signify conflicts between supply and demand, measured by the ratio (S:D) of WS (S) to WD (D). The relationship between WS and WD can also be calculated based on the Water Security Index (WSI) [48,49] using equation:
W S I = l o g S i D i
When WSI > 0, the WS exceeds WD (water surplus); when WSI < 0, the WS falls short of WD (water deficit). According to the WSI value, to emphasize the regional WS and WD, as well as the characteristics of spatiotemporal variation, the WSI is divided into four categories: <−0.5, 0.5–0, 0–0.5, and >0.5.

2.3.4. Spatial Characteristics of Supply and Demand of WY Service

Statistical principles, visuals, and charts are utilized in exploratory spatial data analysis (ESDA) to examine data with a spatial component, discover the spatial distribution pattern guiding the data, and expose the spatial dependency and heterogeneity [50]. The primary focus of ESDA is spatial autocorrelation analysis, which examines the relationships between data collected at several geographical locations for the same variable. The CW’s geographic variations were determined using spatial autocorrelation coefficients.
Water supply and demand in the CW were analyzed using multivariate Global Moran’s I to disclose the existence and degree of spatial autocorrelation throughout the study area. The Global Moran’s I index was adopted to explore the spatial correlations and spatial supply and demand differences among 174 sub-districts. The calculation formula is as follows [51]:
I i x y = n i j w j × i j w j   D i D i ¯ S i S i ¯ i D i D i ¯ 2 j S i S i ¯ 2
The spatial weight matrix (Wij) between regions i and j represents the contiguity between region i and region j. If there is a distinct boundary between the two regions, then Wij = 1; if not, then Wij = 0 [50].
Di represents the region i water requirement. Dj and Sj are the water sources for region j. S is the mean value of the water supply and D is the water demand in the sample, and n is the total number of regions. Iixy is Global Moran’s I between −1 and 1. The value of Iixy can be divided into three classes as follows:
  • Iixy > 0 represents a positive spatial connection between the two variables; a higher value suggests a stronger spatial correlation.
  • Iixy < 0 shows the negative spatial correlation, emphasizing the latter as the value decreases.
  • Iixy = 0 reflects a randomly distributed pattern over space.
The Local indicators of spatial association (LISA) data that consist of local Moran’s I and local Geary’s c statistics is one of the most commonly used local statistics. While global spatial autocorrelation reveals an index that shows the extent of the spatial correlation between all unit areas, a local spatial autocorrelation displays spatial correlation between one region and its neighbours. This study implements multivariate local Moran’s I to visualize regions with significant spatial autocorrelation. Local Moran’s I can be described by using the formula as shown below [18]:
I x y = n i j   w i j D i D i ¯ S S ¯ i j   w i j   j   D i D i ¯
The LISA will generate four categories of clusters: (1) a cluster of regions with high–high values, (2) a cluster of regions with high–low values, (3) a cluster of regions with low–high rates, and (4) a cluster of regions with low–low rates.

3. Results

3.1. Spatial Patterns of WS

The total WS of the CW in 2020 which decreased by 31.98 × 10⁸ m3 or approximately 30.76% (Table 2 and Table 3). The total decrease was from 103.98 × 10⁸ m3 in 2000 to 72.00 × 10⁸ m3 in 2020. The WS of the CW displayed a significant spatial variation in the same year, with the unit WS of the middle stream > upstream > downstream.
The WS decline occurred in all sub-watersheds with varying declining levels (2000–2010) and (2010–2020). From 2000–2010 the water discharge in the upstream, middle, and downstream areas decreased by 15.44%, 17.42%, and 21.63%, respectively. Meanwhile, in the 2010–2020 period, the decrease was smaller than in the 2000–2010 period, except for the downstream water discharge. The water discharge in the upstream, middle, and downstream areas decreased by 10.09%, 11.66%, and 24.61%, respectively.
Changes in WS based on watersheds/sub-watersheds (Table 3) show that: (a) in the period 2000–2010, both on the watershed and sub-watershed scales, it is included in the class no change (NC) and (b) in 2010–2020, it is included in the no change class, except for the sub-watershed scales, where downstream CW belongs to the declining class (C); meanwhile, in 2000–2020, changes to the watershed scale are shown and CW is decreased (D), while at the sub-watershed scale, the upstream CW shows no change (NC), the middle CW is decreased (D), and the downstream CW is included in the extreme change (EC) class.
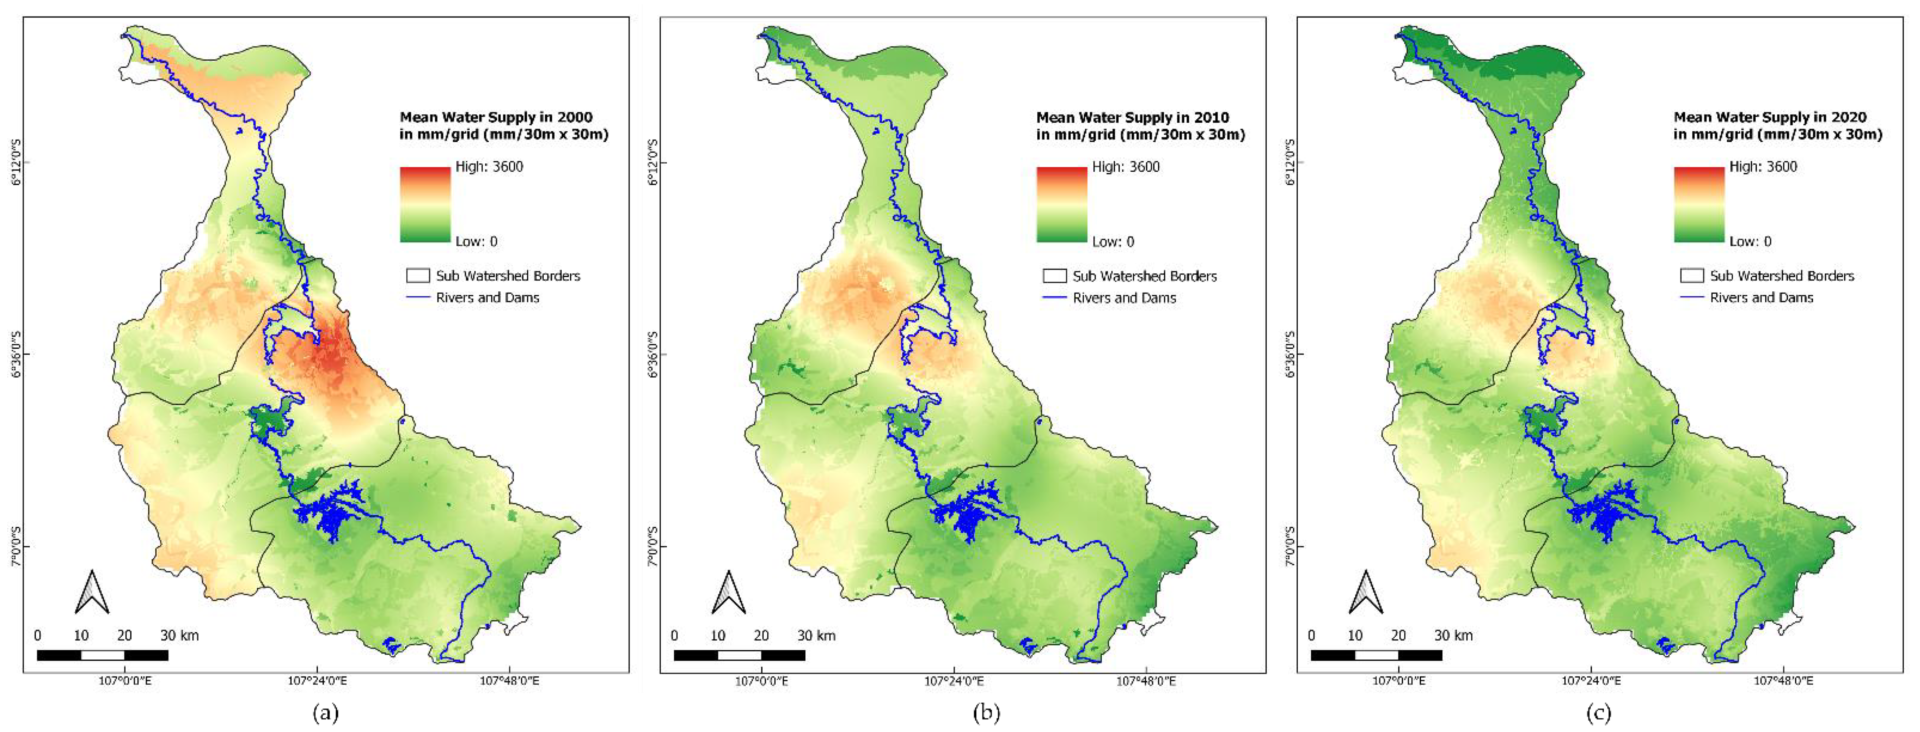
The spatial distribution of WS in the CW in 2000, 2010, and 2020 is presented in Figure 4. In 2000, the spatial pattern of WS capacity was dominated by the middle-class–high class. The distribution of classes is mostly in the middle and downstream sub-watersheds. High grade WS is in the southwest and low is in the northeast, and the upstream WS capacity is strong at our location.
Meanwhile, in 2010, the spatial pattern of WS capacity was dominated by the middle class–low class. In general, there appears to be a decline in the high class to the low, while the middle class (in 2000) changes to the low WS class. This change mainly occurs in the middle and downstream sub-watersheds.
In 2020, the spatial pattern of water product supply capacity was dominated by the low class, around 70%, and the rest were in the middle class. No high-grade WS was found. Low WS classes were found in the downstream and upstream sub-watersheds. In contrast, the middle class was in the middle watershed area. The classes of changes in WS in the period 2000–2010 and 2010–2020 are shown in Figure 5.
In 2000–2010 (Figure 5a), the class of no change/NC (green) was evenly distributed across the three sub-watersheds, i.e., in the north-northwest (downstream CW), west-southwest (middle CW), and east-southeast (upstream CW). Meanwhile, the ex-tremely decreased class (red) was found in the north (downstream CW), northeast east (middle CW), and southeast (upstream CW). The existence of the change class no change was (55%), decreased (28%), and extremely decreased (18%).
Changes that occurred in the 2010–2020 period (Figure 5b) indicated that there were changes in additions and also subtractions for class changes, namely a decrease in class that did not change by 30%, as well as an increase for ED (100%) and D (40%). This condi-tion shows a more significant decline in WS compared to the period 2000–2010.
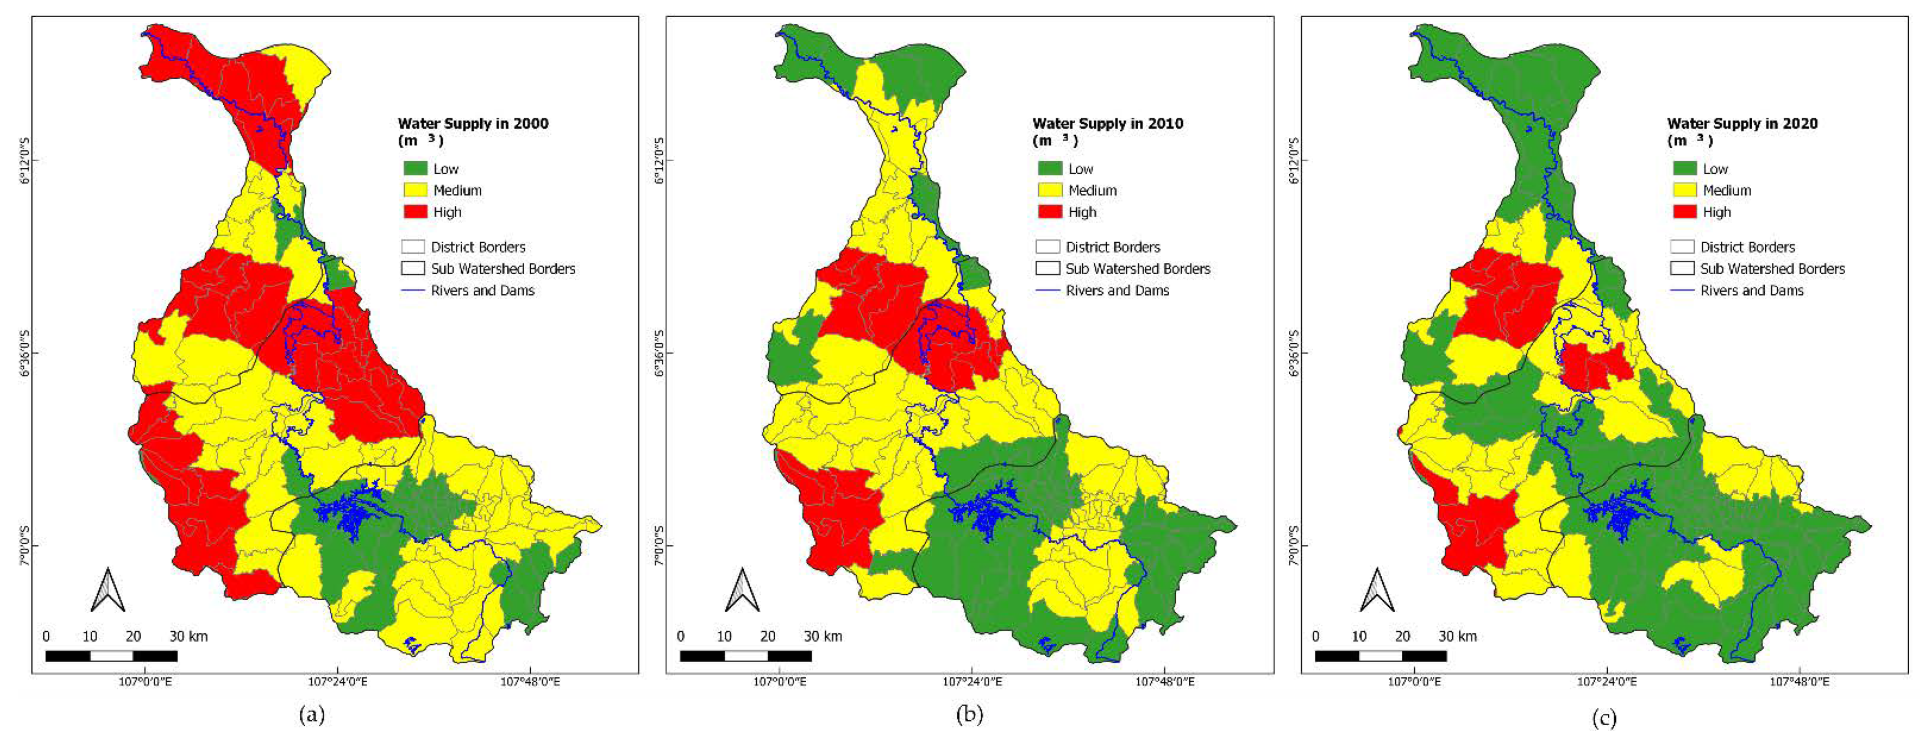
In Table 3 and Table 4, the total WS availability in the CW shows a downward trend. In 2000, water availability was 103.98 × 10⁸ m3, which decreased to 84.97 × 10⁸ m3 in 2010, and 72.00 × 10⁸ m3 in 2020. Within 20 years, the WY decreased by 31.98 × 10⁸ m3 or 30.75%. The WS in 2000 was more significant than in 2010, and the WS in 2010 was greater than in 2020. More specifically, the change in the WS is presented in Figure 6.
Based on the dominance and distribution, the condition of the WS in 2000 (Figure 6a) and 2010 (Figure 6b) was relatively the same, namely dominated by WS with medium and high class, which were spread in the central part of CW and downstream CW areas. Meanwhile, areas with relatively low water availability were located upstream of Citarum.
Considering the conditions in 2020 based on spatial distribution, WS in the CW showed the dominance of the middle class (55%), low (25%), and high (20%). With a high distribution class, WS was found in the central part of the Citarum sub-watershed, pointedly at the west-northwest and southwest. Meanwhile, low WS was found in the downstream Citarum sub-watershed (north) and upstream (southeast) Citarum areas. On the other hand, the middle-class WS was spread over most of the upstream, middle, and downstream Citarum sub-watershed areas.
The InVEST model was validated using WY data published by [46]. When comparing the WY data and the model, the results of linear regression analysis are obtained: coefficient of determination (R2) = 0.7780, Pearson correlation coefficient (r) = 0.8825, and mean square error (RMSE) = 0.7 with the regression equation Y = 0.8682x + 0.2798. When considering LULC types, the results of the WY zone statistical tool show that the relationship between LULC, WY, and rainfall varies by type of LULC (Table 4).
From 2000 to 2020, the average WY coefficient for vegetated land cover ranged from 0.55 to 0.74 (Table 4). Meanwhile, non-vegetated areas ranged from 0.23 (bare land) to 0.64 (settlement area). The coefficient of WY for shrubs has the highest ratio (0.74), while plantation forest has the lowest ratio (0.55). From the perspective of WY per unit area, in 2020, the highest average WY for shrubs was 1511 mm/year. The second largest WY is virgin forest (1306 mm/year), followed by dry agriculture (1333 mm/year) and plantation (1205 mm/year). Based on the area and volume of water for each type of LULC, the relationship presented in Table 5 can be analyzed. It shows water results: shrubs > virgin forest > dry agricultural.
By monitoring the WS coefficient for the vegetated lands, the shrubs have the highest ratio in 2000, 2010, and 2020 by 0.77, 0.81 and 0.63 of the coefficient value, respectively. Then, the lowest is the plantation forest in 2000 and 2010 and the paddy field in 2020 by 0.61, 0.58 and 0.40, respectively. Meanwhile, regarding the coefficient ratio for the non-vegetated areas, the settlement area had the highest ratio in 2000 and 2010 and the airport in 2020 by 0.66, 0.70 and 0.60 of the coefficient value, respectively. Conversely, the lowest WS coefficient was the bare land in 2000, 2010 and 2020 by 0.23, 0.27 and 0.19, respectively.
In general, a large LULC area will result in high water production. The study area was dominated by paddy fields (31.94%), dry agriculture (28.52%), plantation forest (11.05%), and settlements (12.65%) in 2020. Meanwhile, based on water production, the study area was dominated by dry agriculture (35.05%), paddy fields (29.57%), settlements (11.27%), and plantation forests (11.20%). An analysis of LULC changes from 2010 to 2020 shows an increase in paddy fields (2.79%), plantation forest (1.18%), settlement area (1.08%), and shrubs (1.06%), respectively. On the other hand, the areas that experienced a decline were dry agriculture (2.39%), estate crops plantation 1.089%), virgin forest (1.23%), and bare land (0.65%). Meanwhile, an increase in water production occurred in almost all LULC areas, except for estate crops plantations, shrubs, fishponds, and bare land.

3.2. Spatial Patterns of WD

The total WD of the CW in 2020 increased by 21.91 × 10⁸ m3 or approximately 81.66% for 20 years (Table 6 and Table 7). The total increase was about specifically from 26.83 × 10⁸ m3 in 2000 to 33.00 × 10⁸ m3 in 2010 to 48.74 × 10⁸ m3 in 2020. In the same year, the WY of the CW showed an extensive differentiation in space, with the unit WY: of upstream > middle stream > downstream.
The increase in WD occurs in all sub-watersheds with varying rates of increase (2000–2010) and (2010–2020). In 2000–2010, WD in the upstream, middle and downstream areas increased by 28.35%, 26.79%, and 11.83%, respectively. Meanwhile, in the 2010–2020 period, there was also an increase with a greater value than in the 2000–2010 period. The WD in the upstream, middle and downstream areas increased by 40.11%, 46.91%, and 59.95%, respectively.
Changes in WD based on watersheds/sub-watersheds (Table 6) show: (a) in the period 2000–2010, both on the watershed and sub-watershed scales included in the class, did not change (NC), except for downstream CW classified as in the NC class, and (b) in the years 2001–2020 and 2010–2020 was included EI class. The spatial distribution of WYs in the CW in 2000, 2010, and 2020 is shown in Figure 7.
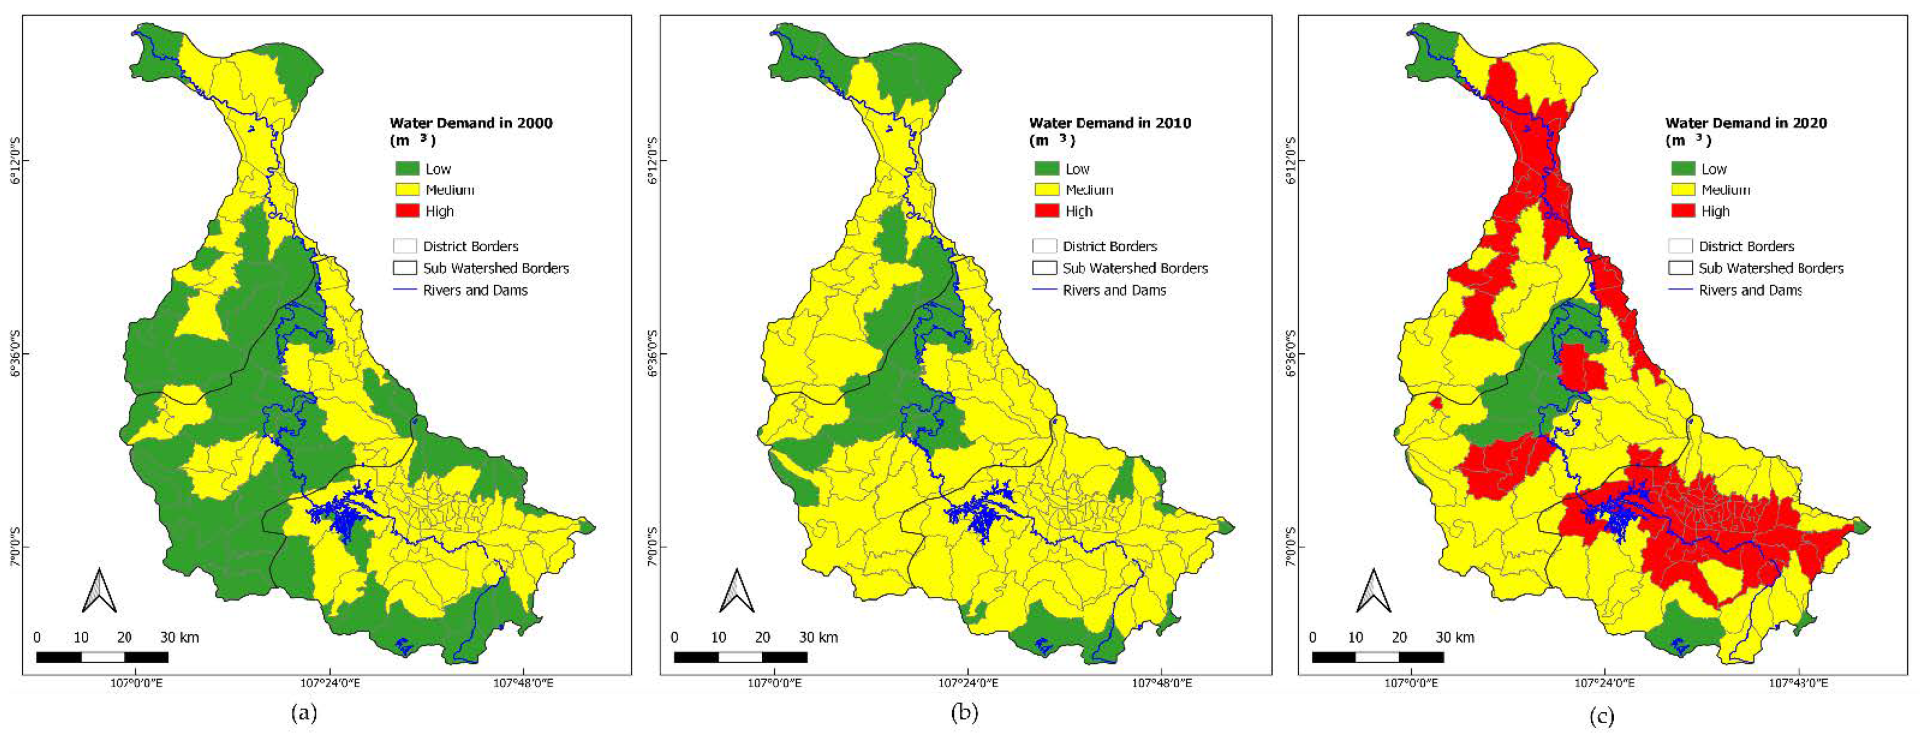
Referring to Figure 7a, in 2000, the spatial pattern of WD was dominated by the middle–low class. The distribution of the low class was mostly in the middle and downstream sub-watersheds. Meanwhile, medium water needs were almost found throughout the CW, especially the middle and upstream CW.
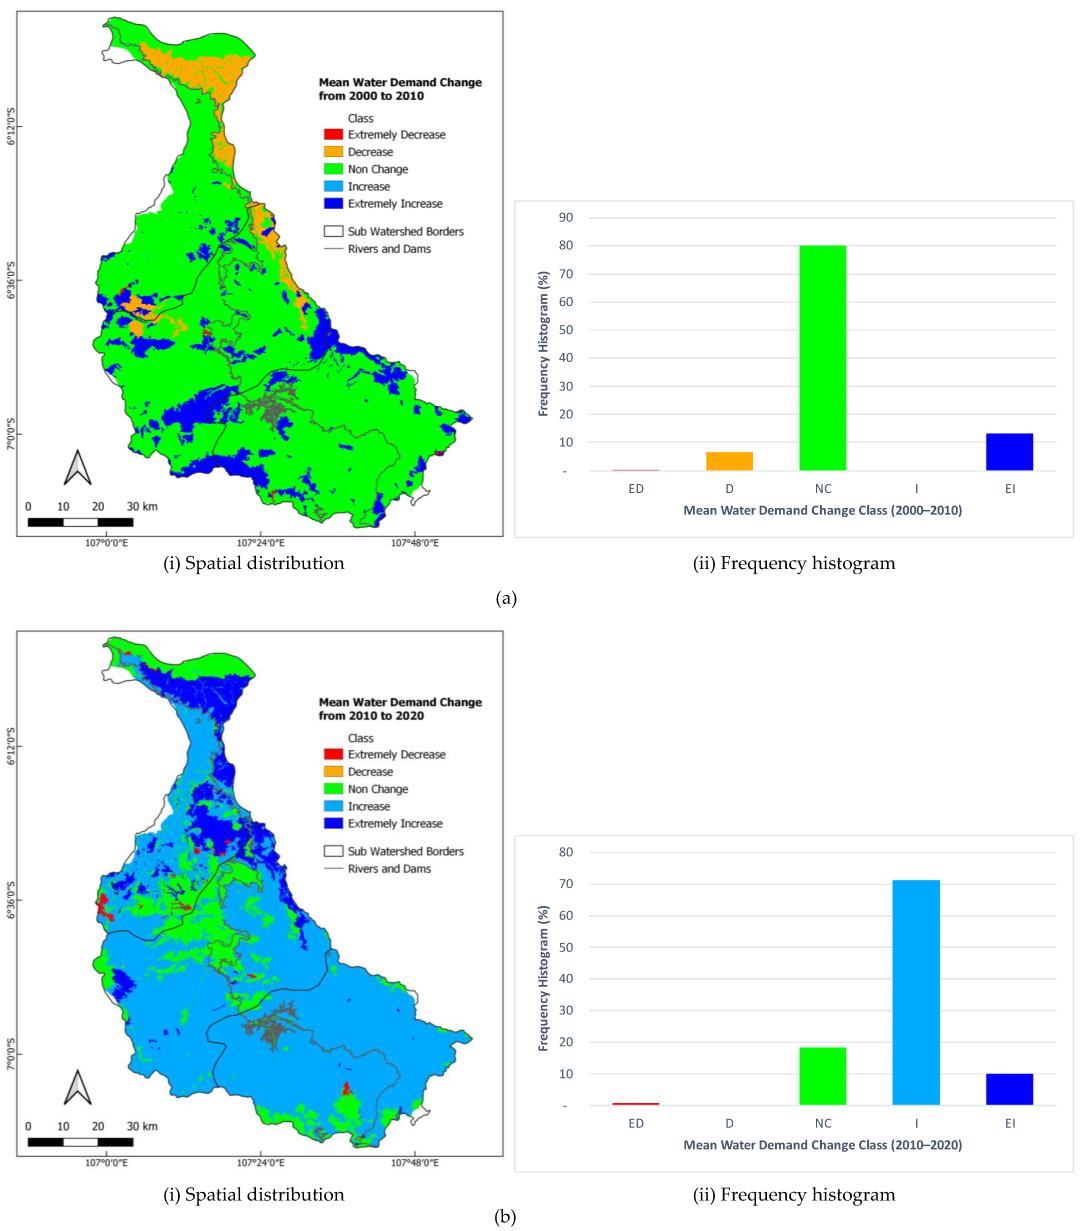
Meanwhile, in 2010 (Figure 7b), the middle-high class dominated the spatial pattern of water needs. In general, it can be seen that there was an increase in WD from the low class to the middle class, while the middle class (in 2000) turned into the high class. Most of these changes occurred in the middle and downstream sub-watersheds. Figure 7c shows a relatively similar pattern that also occurred in 2020, where the value of the increase and the distribution of the increase in WD became widespread. The class of changes in WD in the period 2000–2010 and 2010–2020 is presented in Figure 8.
Changes in WD that occurred in the 2010–2020 period (Figure 9b) indicate a class shift, namely the addition to the increased class and a reduction to the unchanged class. Class changes were dominated by the increased class, which reached 70% of the entire CW area. Meanwhile, the NC class decreased (about 75%) to 19%, and the EI decreased to 10%. This condition indicates that there was a significant increase in WD. Based on the area and volume of WD for each type of LULC, the relationship can be analyzed and presented in Table 8.
In general, connections between large areas of LULC will require high water requirements, except in the settlement area. The study area was dominated by rice fields (31.94%), dry agriculture (28.52%), plantation forests (11.05%), and settlements (12.65%) in 2020. Meanwhile, based on water needs in each LULC, the study area was dominated by paddy fields (49.50%), agriculture (31.34%), settlements (13.86%), and plantation forests (4.96%). This is in line with the previous study [2,22], which stated that LULC such as agricultural area, urban and industrial areas consumed the most water. Due to the large irrigated area in Java Island, it consumed the most water to support the rice production [52].
Almost all LULC experienced a decrease in WD, except for the paddy field area. The analysis of changes in LULC from 2010 to 2020 shows a successive increase in paddy fields (2.79%), plantation forests (1.18%), settlements (1.08%), and shrubs (1.06%). While the areas that experienced a decline were: dry agriculture (2.38%), estate crop plantations (1.08%), virgin forest (1.23%), and vacant land (0.65%).
Based on sub-districts area, water needs have a different pattern than water needs based on watersheds and sub-watersheds (Figure 9). Based on the spatial distribution of 2000–2010 (Figure 9a), the most dominant change class is no change (green) evenly in the three sub-watersheds, namely in the north-northwest (downstream CW), west-southwest (middle CW) and east-southeast (upstream CW). The decreased class is found in downstream CW (brown). While the extreme increase class (dark blue) is found in middle CW. There was a change in no change (80%), EI (13%), and D (7%).
In general, the WD in the CW area is relatively the same, namely the dominance of water needs belonging to the middle class. In 2010 (Figure 9b), there was an increase in the number of sub-districts belonging to the medium class and high class compared to the initial condition in 2000 (Figure 9a). It was dominated by middle-class WD (50%) and high-class (30%).
Areas with high WD were spread downstream, covering the north, northwest, and northeast part of the CW and upstream in the south to southeast of the CW. Areas with medium water needs were found throughout the CW. Meanwhile, the class of low WD was found in the downstream (north) and central areas of CW. The condition of WD in 2020 shows an increase in the number of high-class countries, which occurred in the downstream CW, while for the other two classes, it is relatively constant (Figure 9c).

3.3. The Imbalance between WS and WD

Based on the calculation of the InVEST model, fluctuations in the availability of supply and demand for WY are presented in Table 9.
The input of rainwater strongly influences the availability of water supply. Based on research from [53], annual rainfall in the CW from 1981 to 2019 showed an increasing trend, with dry years occurring in 1982, 1997, 2002, 2003, 2006, 2015, 2018, and 2019, with rainfall in below 2500 mm/year and wet years occurring in 1992, 2001, 2010, 2013 and 2016, with annual rainfall above 3500 mm/year. Nonetheless, as we found in this study, land use and land cover change are the main factors in the imbalance between water supply and demand in the CW.
The WSI value from 2000 to 2010 was relatively good, indicating that the available WS can still meet water needs. The WSI value ranged from 0.04 to 0.07 in 2000–2020. The WSI value ranged from 0.41 to 0.70 in 2000, from 0.23 to 0.51 in 2010, and from 0.04 to 0.29 in 2020. The condition of the WSI in 2020 indicated that the water had reached a critical level.
Based on the WSI value in the 2000–2010 period, the WSI value decreased by 0.18 (30.51%), while in the 2010–2020 period, it was 0.24 (58.54%). Compared to the initial conditions in 2000, there was a WSI value hunter of 0.42 (71.19%) in 2020. In general, a positive WSI value indicated no water deficit. A WSI value, slightly above one, indicates a warning in managing water products to keep water resources sustainable. Further details based on sub-districts area, the distribution pattern of WSI watersheds and sub-watersheds can be found in Figure 10.
Figure 10a shows that in 2000, almost all 166 counties (95.40%) of the CW had a WSI value > 0, almost 74 sub-districts (43.10%) had a WSI value > 0.5, and areas with a WSI value of less than 0 were only (8 counties) 4.60%. In 2000, the WS was very abundant compared to the demand. While Figure 10b shows almost the same conditions as WSI conditions in 2000, there was an addition of WSI < 0 (Downstream CW) and WSI greater than 0 in around 162 counties (93.10%), consisting of WSI values 0–0.5 in around 124 (71, 26%) and WSI > 0.5 reduced to 38 counties (21.84%).
Referring to Figure 10c, areas experiencing water depletion (WSI < 0) reached 80 counties (45.97%), namely in the downstream CW area (Karawang Regency and Bekasi Regency) and upstream CW (Bandung Regency and West Bandung Regency). There are as many as 94 sub-districts (54.02%). Of the areas that supply water, 19 sub-districts (Middle CW) (10.92%) have WSI greater than 0.5. On the other hand, other areas scattered in the middle and upstream of CW still look safe, namely surplus water (WSI > O).

3.4. Spatial Characteristics of Supply and Demand of WY Service

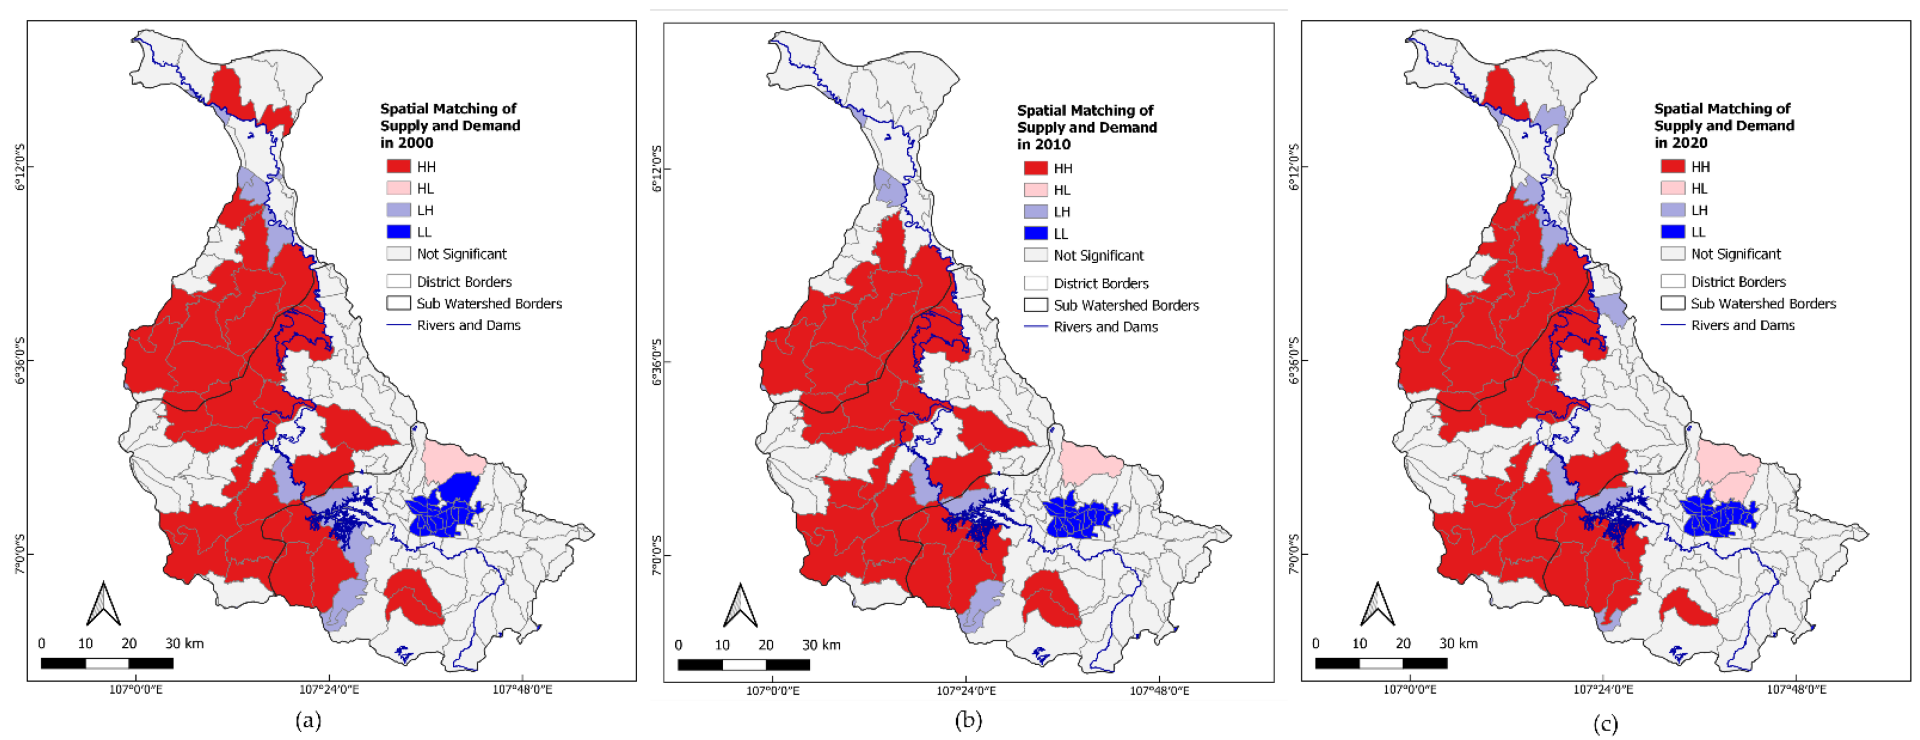
The spatial characteristics relationship between supply and demand for WY services in the CW was analyzed using the Global Moran Index. The computation was performed using the GeoDa software separately for 2000, 2010 to 2020 (Table 10 and Figure 11). This software is an open-source and cross-platform desktop software program for spatial data analysis. It is not a geographic information system, but it can be used for the visualization and exploration of geospatial data.
Referring to Table 10, Global Moran’s I is 0.344 (in 2000), 0.346 (in 2010) and 0.368 (in 2020). The results yielded positive Z values, which are 10.2678, 11.9778, and 12.430 in 2000, 2010, and 2020, respectively, where all p values were 0.001. All variables passed the significance test by 1%, indicating a significant spatial relationship between the availability of supply and demand of water in the CW. The relatively similar Moran’s I value shows that the spatial agglomeration of the influence of WS and WD in the CW from 2000 to 2020 shows a slight growth trend. The results of the bivariate local autocorrelation analysis are presented in Figure 12.
It shows the supply and demand distribution pattern for water products in the CW, which can be categorized into four types: (1) high–high (HH: high supply and high demand), (2) low–low (LL: low supply and low demand), (3) low–high (LH: low supply and high demand), and (4) high–low (HL: high supply and low demand).
Conditions in 2000, 2010, and 2020 are relatively the same. According to the distribution, the dominant type of suitability in the supply and demand of water products is high–high spatial suitability (16.09%), followed by low–low spatial suitability (13.79%), low–high spatial suitability (18.16%), low–high spatial suitability (6.90%), and high–low spatial suitability (6.90%). However, the area with a non-significant class reached about 62.07%.
Referring to Figure 12c, areas with high–high spatial matching are mainly distributed in Middle CW (West Bandung Regency, Cianjur Regency) and downstream CW (Bekasi Regency and Karawang Regency). The existence of this class reached 16.09% of the total area or around 44.44% of the significant area.

4. Discussion

4.1. Spatial Patterns of WS and WD

CW has a WS of 103.98 × 10⁸ m3/year in the year 2020, with a mean WS of roughly 935 mm/year. These results are consistent with published data [46,54], which shows that the WS at the CW was 129.51 × 10⁸ m3/year, and the mean WS was 994 mm/year. Spatially, the higher WS was distributed in the middle and the southwest of the CW (Figure 4). This pattern is similar to the pattern of annual rainfall in the study area (Figure 2b), in which the high rainfall was found in the middle and the southwest of the CW. Previous studies reported that the spatial pattern of WY within the watershed is mainly influenced by precipitation [55,56]. Using a correlation analysis, ref. [57] found that precipitation has the strongest correlation to WS. Thus, the area with higher precipitation tended to have higher WS.
The spatial distribution pattern and magnitude of the WS from the modelling outcomes are comparable to [26]. Apart from that, the WS value in this study is lower than the previous result. Referring to Patuha’s research by [26], the WS in Citarum (935.26–1079.27) is lower compared to the WS in the Patuha Mountains area, Bandung Regency, West Java (2163 mm/year), which has the same climatic conditions.
As referred to in [58], the WS coefficient is the ratio between WS and rainfall per hectare for each type of LULC. The WS coefficient indicates the amount of WS converted from precipitation, considering evapotranspiration, degree of saturation, and infiltration.
Depending on the kind of land use, the WS coefficient values in the CW ranged from 0.00 to 0.76 and from 0.39 to 0.64 for each watershed. This coefficient is very similar to the Liang study results in the Qinghai Watershed, China [59], which are 0.00–0.82. However, there are variations depending on the land cover type. In the CW, vegetation regions have a higher yield coefficient value than bare ground and populated areas.
The problem of findings of different WS coefficients was identified by [60]. They discovered that research based on catchment regions with limited control makes it impossible to regulate changes in LULC and that the association between LULC and water resources is complex and challenging to forecast. According to [61], in addition to soil texture, surface runoff depth, stakeholders’ interests, and stream order, LULC is the most important characteristic to consider while studying WS.
The simulation results of land cover alteration in WS in the CW showed that WS reduction is affected by deforestation. According to [61], forest loss results in a reduction in the forest’s function, manifested by higher river flow fluctuations throughout the dry and wet seasons or heavier currents, increased floods, and reduced reservoir capacity due to increased sedimentation. Previous authors [62] discovered that reduction in WS due to deforestation is consistent with studies conducted in the CW, where deforestation has been shown to lower discharge, significantly increase runoff coefficients, and decrease low flow during the dry season.
As shown in [63], the impact of LULC on surface runoff in urbanized tropical watersheds (Brantas, East Java) using the SWAT tool was able to explain InVEST model limitations (that is, it cannot distinguish between water, subsurface water, and flow). The study found that increased urbanization and reduced forest cover resulted in moderate changes in long-term runoff (+8%), WS (+0.28%), reduced groundwater (−1.8%), and evapotranspiration (−1.15%).
Annual WS depends on the main land use types. WS’s primary performance is agricultural land > grassland > forest, following the results acquired by [64], which explains that plants need to consume large amounts of water for every plant growth process. Furthermore, they also function as water conservators. At the same time, plant branches and leaves have interception and transpiration effects on rainfall, prolonging the WS time to a certain extent and providing certain conditions for evaporation [65]. The effect of changing LULC on hydrological regimes is a complicated procedure, with different effects relying on land use, the size of the affected area, and the location of the landscape [66].
Referring to the research of [67], the relationship between forest cover and rainfall with WS on the micro and mesoscale is not related. On the other hand, there is a relatively high correlation coefficient (r = 0.77, p < 0.05) between forest cover and WS on a global scale. The analysis results show that deforestation in regional watersheds causes an increase in high discharge and flooding in the rainy season. On the other hand, it causes a worsening of the dry season flow. The spatial scale of the watershed plays a vital role in determining the hydrological impact of forest cover for long-term studies [67]. Forests with high canopy have a higher evapotranspiration capacity than those with sparse canopy forest and scrub [68], so newly reforested land or areas with sparse forest may have a higher WS coefficient than existing agricultural land with year-round cultivation. WS in waterbody areas (paddy fields and ponds) is the lowest because natural rainfall quickly runs off the site or vaporizes severely in lakes.
Table 6 shows that in the period 2000–2010 and 2010–2020, there was an average increase in WD by an average of 1.83% and 1.53%, respectively. This condition has been predicted by the study [15], in which the simulation results assume that if the population growth is 2.21% and there is no change in sectoral WD and also no increase in the agricultural area, the WD in Citarum SWS will increase by 0.55% per year. In the initial conditions (2003), the WD is 5220.16 × 106 m3/year, and in 2055 it will be 6708.65 × 106 m3/year. The increase in WD for 52 years is 1488.49 × 106 m3/year (28.51%). The rate of increase in WD is 0.55% per year. Meanwhile, the results of research on water needs in Jakarta for the 2016–2020 period [69] Jakarta experienced an increase in WD by 0.30 × 10⁸ m3/year or 0.49% per year. In 2016 WD was 12.21 × 10⁸ m3/year and 12.51 × 10⁸ m3/year in 2020. Domestic demand averaged 61.5% of total demand, with commercial demand accounting for 35.5%. Domestic demand accounts for 61 to 62% of total demand, with a volume of 7.48 × 10⁸ m3 in 2016 and 7.69 × 10⁸ m3 in 2020.
A beneficiary area is a sub-catchment that cannot meet the real water demand with its water supply and must be supplemented by an upstream sub-catchment; conversely, a water supply area is designated. The agricultural water, industrial water, home water (rural and urban people), and livestock water were the key components of the water demand service model [49].
Research on WD in Bogor by [70] shows a trend of decreasing WS in Bogor by around 0.6% per year, while there is a trend of increasing WD by 1.7% per year. The dominant increase in demand for water is domestic demand by 48%. Based on the supply and demand ratio, water adequacy in Bogor for the 2009–2019 period is still sufficient. Referring to [71], in 2014, in the Bandung watershed area, the need for water for households, industrial and irrigation purposes in the greater Bandung area was estimated at 17.6 billion m3 per year. WD is expected to increase from 1 to 1.7% per year. The water needs that can be met by surface WS is around 50%, while groundwater sources will cover the rest.
Water yield service is spatially heterogeneous. It is helpful to maximize ecosystem services by analyzing the differences in water yield service under various land cover types [72]. Land cover factors and climate change are important factors in planning and managing the Upper CW infrastructure. In more detail, it is explained by [2,52,73,74] that the phenomena decreased WS and increased WD as the percentage of farmland, population density, and forestland increased. This significantly impacts the water criticality index in the CW. Meanwhile, [75] stated that anthropogenic and climate change combinations could result in a steep decline in discharge in the upper CW.
Changes in land use (settlements increase and forest area decreases) affect irrigation water availability, which is influenced by land use changes. The findings of Tarigan’s research in the Citarum watershed show that the increase in residential areas and decrease in forest areas has an impact by (a) decreasing reservoir storage capacity due to sedimentation and (b) decreasing watershed storage capacity (hydrological function) during the dry season [62].

4.2. The Imbalance between WS and WD

In this study, it was found that in different periods, an area has different WSI values. In the upstream area, which is a water-producing area, some counties have a WSI value of less than 0. On the other hand, in the downstream region, several counties have a higher WSI value, especially in 2000 and 2010. This shows the excess and shortage of water. It does not only depend on natural geographical conditions but is primarily related to the pattern and condition of regional economic development. This finding is in line with the research results of [76,77,78].
Water scarcity not only caused by natural factors but also unnatural factors such as the growth of populations and industries, which increases regional water demand [76]. This unnatural factor becomes a major problem in many countries and regions, triggering social conflict [77]. In the context of rapid socio-economic development, the gap between water demand and supply has become more intense because water has become a bottleneck for sustainable development [78].
The CW WSI from 2000 to 2020 maintains a spatial pattern of highs and lows in the southwest and northeast, respectively (Figure 11). The middle and downstream regions maintain a high level of WSI. This condition is influenced by nature and society, the WD in the middle and lower regions is greater than the WS, which is in a condition of water shortage, and the deficit scope is increasing. Figure 11c shows that in 2020, the WD upstream and downstream was not being met.
Referring to Figure 11c, the area experiencing water depletion reached 25% in the downstream CW area (Karawang Regency and Bekasi Regency) and upstream CW (Bandung Regency, Bandung City, and West Bandung Regency). While other areas still looked safe (water surplus), some areas experienced a water surplus of WSI 0.0–0.5 (light green). The results of the overlay on the WSI map with the LULC map and the administrative map show that areas with a water deficit and areas with a water surplus with a WSI of 0.0–0.5 are areas with a high population density and are also industrial areas. The increase in population by about 12.5% compared to the conditions in 2000 led to a rise in WD, which was 27.91 × 10⁸ m3 or 81.66% in 20 years (4.09% per year).
Referring to Figure 11, the number of sub-districts experiencing water shortages in 2000, 2010, and 2020 were 8, 12, and 80, respectively. This condition shows that there is an increasing trend in areas experiencing a water deficit. The WSI value decreased from 2000 to 2010 and from 2010 to 2020. The decrease in WSI is due to rapid population growth, increasing human WD, and increasing consumption for agricultural activities due to an increase in land area. The impact of the economy and infrastructure development is growing, resulting in changes in LULC, causing a decrease in WS and an increase in WD. This finding is reinforced by the research that land use change causes unequal water resource distribution, WS and WD imbalances, and other problems, severely limiting sustainable development [79].
Changes in land cover patterns, where there is a decrease in the amount of forest and an increase in the agricultural area and urban areas, cause the decline in WSI, due to an increase in WD. Referring to research [24], in the Citarum area, the impact of changes in Citarum in the 2006–2018 period resulted in a decrease in WY (WS) by 10.29–12.96%. This decrease in the WS is due to a reduction in the extent of the rice fields 4%, virgin forests 23.75%, and land used for plantations 2.38%. In contrast, settlement areas had grown 13.84%, dryland agriculture 20.40%, and mixed dryland agriculture 12.26%.
Broer’s research in the Citarum area found that in 2020, in the scenario of no climate change and if the rate of water withdrawal from river flows is limited to 10% of the average annual flow (it will directly meet the WD), all sub-districts in the CW, especially downstream in a number of sub-districts in Karawang, Bekasi, and Purwakarta, will experience water deficit problems and will not be able to meet their needs. The water deficit in these sub-districts will reach more than 60 m3 per year. Further analysis shows that if water intake increases by 10%, accompanied by an increase in rainfall by 10–20%, it will not significantly change the status of the water deficit in the CW. The sub-districts will still experience a deficit [14]. In more detail, if there is an increase in water intake from river flows, it is limited to 20% of the average annual flow (it will directly reduce WD). It is found that in all sub-districts in the CW area, the status of the water balance in several sub-districts in Sukabumi Regency and central Purwakarta will be surplus [14].
Referring to Hatmoko’s research, the water security score in West Java belongs to the “capable” class (score 3). Meanwhile, Ciliwung Cisadane and Citarum were “engaged” (score 2). Both watersheds suffer from “dangerous” environmental water security because of the shortage of water allocated for environmental purposes [80]. Juwana’s research (2020) on the water sustainability index shows that all conditions of water resources in the CW are considered poor [81].
This finding is in line with the results of Hasbiah and Kurniasih’s research conducted in one of the areas in the CW, namely the city of Bandung. The results showed that the impact of population growth and development activities increases water consumption in Bandung. Regional drinking water company (Perusahaan Daerah Air Minum, PDAM) Kota Bandung only served 73.13% of the total population in 2017. In more detail, concerning the results of the projected water needs, the City of Bandung will experience a water deficit in 2034. The City of Bandung will not be able to meet the projected WD if it does not manage its WS and WD properly [82]. Meanwhile, according to [83], water management is a complex issue.

4.3. Spatial Characteristic of Supply and Demand of WY Service

As shown in Table 9 and Figure 12, all variables passed the 1% significance test, indicating a significant spatial relationship between WS availability and demand in the CW and spatial agglomeration. The spatial distribution of watershed-level spatial relationships is not random but clustering [56], and the larger the Global Moran index value the more vital it is to cluster [6]. The Global Moran’s I scores, which are relatively the same, show that the spatial agglomeration of WS and WD relationships in the CW from 2000 to 2020 shows a slight growth trend.
Figure 10 shows the spatial distribution showing the role of the location at the local level. The LISA cluster map shows information about the importance of local spatial patterns [18]; this study is dominated by high–high class. The pattern of high–high and low–low relationships is a pattern of sustainable use of resources. When the resource is still high, the utilization tends to be excessive, while conversely, when the resource has been reduced, the utilization tends to be more efficient. This finding is corroborated by research in the Wei River Basin, which explains that the relationship between supply and demand was influenced by local characteristics, dominated by the class farmland and grassland [6].
Research on WD in Bogor shows that there is a trend of decreasing WS in Bogor by around 0.6% per year, while there is a trend of increasing WD by 1.7% per year. The dominant increase in demand for water is domestic demand by 48%. Based on the supply and demand ratio, water adequacy in Bogor for the 2009–2019 period is still sufficient. Based on the supply–demand ratio and ESS spatial matching, the supply–demand state of WY in the study area can be identified. There are three types: supply–demand balance, surplus, and deficit. Simultaneously, four types of areas, namely, low supply–high demand, high supply–high demand, low supply–low demand, and high supply–low demand, were also identified [70].
Upstream CW requires appropriate land use policies, i.e., restrain the increasing trend of land use change and develop more alternatives to increase the capacity of WS systems [75]. To reduce the impact of water-related hazards in the future, good land use and water resource management, good infrastructure operations and maintenance, climate forecasting, hazard mitigation, and dissemination of information are considered necessary [84].
Although it is only based on WY services, it can already be used as an ESS indicator. Referring to the results of supply–demand matching for water production services, we propose that the CW area is divided into conservation areas (high supply-low demand), restoration (low supply-high demand), and improvement (low supply-low demand) (Table 11).
This study provides a reference for formulating appropriate planning recommendations [8]. Referring to [82], efforts to improve the performance of water resources in the CW area need to be improved so that the final index can increase from 20.04 to a minimum of 37.19.

5. Conclusions

The results showed that between 2000–2010 and 2010–2020, the WS decreased by 19.01 × 10⁸ m3 (18.28%) and 12.97 × 10⁸ m3 (15.27%), respectively. However, the WD in the same period increased by 6.17 × 10⁸ m3 (23%) and 15.74 × 10⁸ m3 (47%), respectively. Over the decades, the contribution of LULC has changed to variations in WS values ranging from 2.87 to 6.37%. Analysis of the water supply–demand imbalance indicated that the entire CW experienced water shortage, and the type of spatial matching for supply and demand is dominated by a high supply and high demand class (16.09% of the total area). Based on the level of water deficit calculation, the upstream and downstream areas were identified as zones that require ecological conservation, while the middle CW area requires ecological restoration or ecological improvement.
In evaluating the spatial pattern of WS and demand in the CW, we used the InVEST Model and the ArcGIS spatial analysis module to evaluate the supply–demand relationship and test the supply–demand fit of WY with the supply–demand index, SDI. The study’s findings point to inconsistencies in WS and demand, culminating in spatial incompatibilities and imbalances in both supply and demand. The potential for elevated WS is distributed throughout the middle and upstream. This change in the WS is primarily due to LULC changes resulting from human activities such as unreasonable land use conversion, industrialization, and urbanization. Our findings also suggest that WD should be considered when evaluating WY services.

Author Contributions

I.N., F.A., Y.W., W.A., Y.S., N.S., T.T., D.C., N.P.N., F.R. (Fadhlullah Ramadhani), D.R.S., J.S., A.W.R., Y.L.-G., V.K., F.R. (Farid Rifaie) and M.M. had an equal role as the main contributors to this article, who contributed to the conceptualization, methodology, analysis, validation, writing the manuscript and revising the manuscript, providing feedback. I.N., F.A., Y.W., W.A., Y.S., N.S., J.S. and A.W.R. analyzed part of the article: water yield, water supply, and water demand. Meanwhile: T.T., D.C., N.P.N., F.R. (Fadhlullah Ramadhani), D.R.S., Y.L.-G., V.K., F.R. (Farid Rifaie) and M.M. worked on and analyzed part of the article: Spatial Characteristics of WY Service Supply and Demand. All authors have read and agreed to the published version of the manuscript.

Funding

Funding for Priority Watershed and Lake Resources Management Research (Batch 2) Fiscal Year 2022, National Research and Innovation Agency of Indonesia (BRIN) (WBS2-31 Sustainable management of water resources in the Citarum watershed with a geoecology model approach).

Institutional Review Board Statement

Not applicable.

Informed Consent Statement

Not applicable.

Data Availability Statement

Not applicable.

Acknowledgments

National Research and Innovation Agency of Indonesia (BRIN), the West Java Province Regional Government, and Citarum River Basin Territory Organization or Balai Besar Wilayah Sungai (BBWS). All contributed to this endeavor. We want to thank the anonymous reviewers for their contributions to this article. The authors appreciate the data and laboratory facilities provided by the Head of Research Center for Geospatial, National Research and Innovation Agency of Indonesia (BRIN).

Conflicts of Interest

The authors declare no conflict of interest.

References

  1. Koopman, J.F.L.; Kuik, O.; Tol, R.S.J.; van der Vat, M.P.; Hunink, J.C.; Brouwer, R. Distributing Water Between Competing Users in the Netherlands. In Economy-Wide Modeling of Water at Regional and Global Scales; Wittwer, G., Ed.; Advances in Applied General Equilibrium Modeling; Springer: Singapore, Singapore, 2019; pp. 159–192. ISBN 9789811361005. [Google Scholar]
  2. Sathre, R.; Antharam, S.M.; Catena, M. Water Security in South Asian Cities: A Review of Challenges and Opportunities. CivilEng 2022, 3, 873–894. [Google Scholar] [CrossRef]
  3. Figueroa, A.J.; Smilovic, M. Groundwater Irrigation and Implication in the Nile River Basin. In Global Groundwater; Elsevier: Amsterdam, The Netherlands, 2021. [Google Scholar]
  4. Suroso, D.; Setiawan, B.; Abdurahman, O. Impact of Climate Change on the Sustainability of Water Supply in Indonesia. In Proceedings of the Second International Workshop on Water Supply Management System and Social Capital, Surabaya, Indonesia, 15–16 March 2010. [Google Scholar]
  5. Nie, Y.; Avraamidou, S.; Xiao, X.; Pistikopoulos, E.N.; Li, J.; Zeng, Y.; Song, F.; Yu, J.; Zhu, M. A Food-Energy-Water Nexus Approach for Land Use Optimization. Sci. Total Environ. 2018, 659, 7–19. [Google Scholar] [CrossRef] [PubMed] [Green Version]
  6. Li, Y.; Yao, S.; Deng, Y.; Jia, L.; Hou, M.; Gong, Z. Spatio-Temporal Study on Supply and Demand Matching of Ecosystem Water Yield Service—A Case Study of Wei River Basin. Pol. J. Environ. Stud. 2021, 30, 1677–1693. [Google Scholar] [CrossRef]
  7. Lambin, E.F.; Meyfroidt, P. Global Land Use Change, Economic Globalization, and the Looming Land Scarcity. Proc. Natl. Acad. Sci. USA 2011, 108, 3465–3472. [Google Scholar] [CrossRef] [PubMed] [Green Version]
  8. Xue, D.; Wang, Z.; Li, Y.; Liu, M.; Wei, H. Assessment of Ecosystem Services Supply and Demand (Mis)Matches for Urban Ecological Management: A Case Study in the Zhengzhou–Kaifeng–Luoyang Cities. Remote Sens. 2022, 14, 1703. [Google Scholar] [CrossRef]
  9. Boithias, L.; Acuña, V.; Vergoñós, L.; Ziv, G.; Marcé, R.; Sabater, S. Assessment of the Water Supply: Demand Ratios in a Mediterranean Basin under Different Global Change Scenarios and Mitigation Alternatives. Sci. Total Environ. 2014, 470–471, 567–577. [Google Scholar] [CrossRef]
  10. Mirdashtvan, M.; Najafinejad, A.; Malekian, A.; Sa’doddin, A. Sustainable Water Supply and Demand Management in Semi-Arid Regions: Optimizing Water Resources Allocation Based on RCPs Scenarios. Water Resour. Manag. 2021, 35, 5307–5324. [Google Scholar] [CrossRef]
  11. Yulianto, F.; Khomarudin, M.R.; Hermawan, E.; Budhiman, S.; Sofan, P.; Chulafak, G.A.; Nugroho, N.P.; Brahmantara, R.P.; Nugroho, G.; Priyanto, E.; et al. Flood Inundation Modelling Using an RProFIM Approach Based on the Scenarios of Landuse/Landcover Change and Return Periods Differences in the Upstream Citarum Watershed, West Java, Indonesia; In Review; Springer: Berlin/Heidelberg, Germany, 2022. [Google Scholar]
  12. Ambarwulan, W.; Nahib, I.; Widiatmaka, W.; Suryanta, J.; Munajati, S.L.; Suwarno, Y.; Turmudi, T.; Darmawan, M.; Sutrisno, D. Using Geographic Information Systems and the Analytical Hierarchy Process for Delineating Erosion-Induced Land Degradation in the Middle Citarum Sub-Watershed, Indonesia. Front. Environ. Sci. 2021, 9, 710570. [Google Scholar] [CrossRef]
  13. Sujarwo, M.W.; Indarto, I.; Mandala, M. The Impact of Land Use and Land Cover Change on Hydrological Processes in Brantas Watershed, East Java, Indonesia. Kuwait J. Sci. 2021, 49, 1–16. [Google Scholar] [CrossRef]
  14. Boer, R.; Dasanto, B.D.; Perdinan; Marthinus, D. Hydrologic Balance of Citarum Watershed under Current and Future Climate. In Climate Change Management; Springer: Berlin/Heidelberg, Germany, 2012. [Google Scholar]
  15. Sampurna, A.T. Analisis Kebutuhan Dan Ketersediaan Air Wilayah Sungai Citarum. Master’s Thesis, Brawijaya University, Malang, Indonesia, 2006. [Google Scholar]
  16. Qin, T.; Boccelli, D.L. Estimating Distribution System Water Demands Using Markov Chain Monte Carlo. J. Water Resour. Plan. Manag. 2019, 145, 04019023. [Google Scholar] [CrossRef]
  17. Yang, X.; Chen, R.; Meadows, M.E.; Ji, G.; Xu, J. Modelling Water Yield with the InVEST Model in a Data Scarce Region of Northwest China. Water Sci. Technol. Water Supply 2020, 20, 1035–1045. [Google Scholar] [CrossRef]
  18. Anselin, L.; Sridharan, S.; Gholston, S. Using Exploratory Spatial Data Analysis to Leverage Social Indicator Databases: The Discovery of Interesting Patterns. Soc. Indic. Res. 2007, 82, 287–309. [Google Scholar] [CrossRef]
  19. Gallo, J.; Ertur, C. Exploratory Spatial Data Analysis of the Distribution of Regional per Capita GDP in Europe, 1980–1995. Pap. Reg. Sci. 2000, 82, 175–201. [Google Scholar] [CrossRef]
  20. Moura, A.C.M.; Fonseca, B.M. ESDA (Exploratory Spatial Data Analysis) of Vegetation Cover in Urban Areas-Recognition of Vulnerabilities for the Management of Resources in Urban Green Infrastructure. Sustainability 2020, 12, 1933. [Google Scholar] [CrossRef] [Green Version]
  21. Zhang, J.; Zhang, K.; Zhao, F. Research on the Regional Spatial Effects of Green Development and Environmental Governance in China Based on a Spatial Autocorrelation Model. Struct. Change Econ. Dyn. 2020, 55, 1–11. [Google Scholar] [CrossRef]
  22. Liu, K.; Xue, Y.; Lan, Y.; Fu, Y. Agricultural Water Utilization Efficiency in China: Evaluation, Spatial Differences, and Related Factors. Water 2022, 14, 684. [Google Scholar] [CrossRef]
  23. Pei, H.; Liu, M.; Shen, Y.; Xu, K.; Zhang, H.; Li, Y.; Luo, J. Quantifying Impacts of Climate Dynamics and Land-Use Changes on Water Yield Service in the Agro-Pastoral Ecotone of Northern China. Sci. Total Environ. 2022, 809, 151153. [Google Scholar] [CrossRef]
  24. Nahib, I.; Ambarwulan, W.; Rahadiati, A.; Munajati, S.L.; Prihanto, Y.; Suryanta, J.; Turmudi, T.; Nuswantoro, A.C. Assessment of the Impacts of Climate and LULC Changes on the Water Yield in the Citarum River Basin, West Java Province, Indonesia. Sustainability 2021, 13, 3919. [Google Scholar] [CrossRef]
  25. Siswanto, S.Y.; Francés, F. How Land Use/Land Cover Changes Can Affect Water, Flooding and Sedimentation in a Tropical Watershed: A Case Study Using Distributed Modeling in the Upper Citarum Watershed, Indonesia. Environ. Earth Sci. 2019, 78, 550. [Google Scholar] [CrossRef]
  26. Kusratmoko, E.; Semedi, J.M. Water Availability in Patuha Mountain Region Using InVEST Model “Hydropower Water Yield”. E3S Web Conf. 2019, 125, 01015. [Google Scholar]
  27. Sholeh, M.; Pranoto, P.; Budiastuti, S.; Sutarno, S. Analysis of Citarum River Pollution Indicator Using Chemical, Physical, and Bacteriological Methods. AIP Conf. Proc. 2018, 2049, 020068. [Google Scholar]
  28. Citarum, P.B.C. Profile of B. Balai Besar Wilayah Sungai Citarum-Ciliwung (BBWS Citarum Ciliwung). Profil BBWS Citarum. Available online: https://sda.pu.go.id/balai/bbwscitarum/profil-bbws-citarum/ (accessed on 13 November 2022).
  29. Sharp, R.; Tallis, H.; Ricketts, T.; Guerry, A.D.; Wood, S.A.; Chaplin-Kramer, R.; Nelson, E.; Ennaanay, D.; Wolny, S.; Olwero, N. InVEST+ VERSION+ User’s Guide; The Natural Capital Project: Stanford, CA, USA, 2016. [Google Scholar]
  30. Team, R.D.C. A Language and Environment for Statistical Computing. 2009. Available online: http://www.R-project.org (accessed on 14 March 2022).
  31. Anselin, L. GeoDa (Spatial Statistical Program). Encycl. Res. Methods Criminol. Crim. Justice 2021, 2, 839–841. [Google Scholar]
  32. Ermida, S.L.; Soares, P.; Mantas, V.; Göttsche, F.M.; Trigo, I.F. Google Earth Engine Open-Source Code for Land Surface Temperature Estimation from the Landsat Series. Remote Sens. 2020, 12, 1471. [Google Scholar] [CrossRef]
  33. Chander, G.; Markham, B.L.; Helder, D.L.; Chander, G.; Markham, B.L.; Helder, D.L. Summary of Current Radiometric Calibration Coefficients for Landsat MSS, TM, ETM+, and EO-1 ALI Sensors. Remote Sens. Environ. 2009, 113, 893–903. [Google Scholar] [CrossRef]
  34. Saxton, K.E. Soil Water Characteristics: Hydraulic Properties Calculator. 2009. Available online: https://hrsl.ba.ars.usda.gov/soilwater/Index.htm (accessed on 13 March 2022).
  35. Amhar, F. The Problematics of Indonesian Geoportal and Its Future Strategies. In Proceedings of the 39th Asian Conference on Remote Sensing, Kuala Lumpur, Malaysia, 15–19 October 2018; Volume 3, pp. 1868–1877. [Google Scholar]
  36. Amhar, F. Quality Test Various Existing Dem in Indonesia toward 10 Meter National Dem. Int. Arch. Photogramm. Remote Sens. Spat. Inf. Sci.-ISPRS Arch. 2016, 41, 111–116. [Google Scholar] [CrossRef] [Green Version]
  37. BPS-Statistics of Jawa Barat Province. BPS Jawa Barat Dalam Angka 2000; BPS-Statistics of Jawa Barat Province: Bandung, Indonesia, 2000. [Google Scholar]
  38. BPS-Statistics of Jawa Barat Province. BPS Jawa Barat Dalam Angka 2010; BPS-Statistics of Jawa Barat Province: Bandung, Indonesia, 2010. [Google Scholar]
  39. BPS-Statistics of Jawa Barat Province. BPS Jawa Barat Dalam Angka 2020; BPS-Statistics of Jawa Barat Province: Bandung, Indonesia, 2020. [Google Scholar]
  40. BSN. SNI 19-6728.1-2002 Penyusunan Neraca Sumber Daya-Bagian 1: Sumber Daya Air Spasial; Badan Standardisasi Nasional: Jakarta Pusat, Indonesia, 2002. [Google Scholar]
  41. Budyko, M. Climate and Life; Miller, D., Ed.; Academic Press: New York, NY, USA; London, UK, 1974. [Google Scholar]
  42. Canqiang, Z.; Wenhua, L.; Biao, Z.; Moucheng, L. Water Yield of Xitiaoxi River Basin Based on InVEST Modeling. J. Resour. Ecol. 2012, 3, 50–54. [Google Scholar] [CrossRef]
  43. Zhang, L.; Hickel, K.; Dawes, W.R.; Chiew, F.H.S.; Western, A.W.; Briggs, P.R. A Rational Function Approach for Estimating Mean Annual Evapotranspiration. Water Resour. Res. 2004, 40, 89–97. [Google Scholar] [CrossRef]
  44. Baw-puh, F. On the Calculation of the Evaporation from Land Surface. Sci. Atmospherica Sin. 1981, 5, 23–31. [Google Scholar]
  45. Donohue, R.J.; Roderick, M.L.; McVicar, T.R. Roots, Storms and Soil Pores: Incorporating Key Ecohydrological Processes into Budyko’s Hydrological Model. J. Hydrol. 2012, 436–437, 35–50. [Google Scholar] [CrossRef]
  46. Badan Informasi Geospasial. Pemetaan Dinamika Sumberdaya Alam Terpadu Wilayah Sungai Citarum; Mapping of the Dynamics of Integrated Natural Resources of the Citarum River Basin; Badan Informasi Geospasial: Cibinong, Indonesia, 2015. [Google Scholar]
  47. Shiksha, B.; Seong, Y.J.; Lee, S.Y.; Jung, Y. Water Yield Estimation of the Bagmati Basin of Nepal Using GIS Based InVEST Model. J. Korea Water Resour. Assoc. 2019, 52, 637–645. [Google Scholar] [CrossRef]
  48. Khan, S.; Guan, Y.; Khan, F.; Khan, Z. A Comprehensive Index for Measuringwater Security in an UrbanizingWorld: The Case of Pakistan’s Capital. Water 2020, 12, 166. [Google Scholar] [CrossRef] [Green Version]
  49. Zou, Y.; Mao, D.H. Analysis of Water Yield Service of Lianshui River Basin in China Based on Ecosystem Services Flow Model. Water Supply 2022, 22, 335–346. [Google Scholar] [CrossRef]
  50. Liu, K.; Wang, X.; Zhang, Z. Assessing Urban Atmospheric Environmental Efficiency and Factors Influencing It in China. Environ. Sci. Pollut. Res. 2022, 29, 594–608. [Google Scholar] [CrossRef] [PubMed]
  51. Guo, B.N.; Tang, L.; Zhang, H. Spatial Effects of Environmental Regulation and Ecological Welfare Performance in Yangtze River Economic Belt. Reform Econ. Syst. 2021, 3, 73–79. [Google Scholar]
  52. Mediawan, Y.; Montarcih, L.; Soetopoi, W.; Prayogo, T.B. Water Balance Supporting the Irrigation Water Demand in Java Island, Indonesia. Indones. J. Geogr. 2021, 53, 9–19. [Google Scholar] [CrossRef]
  53. Rahmad, R.; Wirda, M.A. Long-Term Spatiotemporal Trend Analysis of Precipitation and Temperature in Citarum Watershed, Indonesia. IOP Conf. Ser. Earth Environ. Sci. 2021, 930, 012038. [Google Scholar] [CrossRef]
  54. Kementerian Pekerjaan Umum dan Perumahan Rakyat. Rencana Pengelolaan Sumber Daya Air Wilayah Sungai Citarum Tahun. Management Plan of Citarum River Basin. 2016. Available online: https://www.coursehero.com/file/60545948/Rencana-Pengelolaan-Sumber-Daya-Air-WS-Citarumpdf/ (accessed on 23 March 2022). (In Indonesian).
  55. Niu, P.; Zhang, E.; Feng, Y.; Peng, P. Spatial-Temporal Pattern Analysis of Land Use and Water Yield in Water Source Region of Middle Route of South-to-North Water Transfer Project Based on Google Earth Engine. Water 2022, 14, 2535. [Google Scholar] [CrossRef]
  56. Zhang, X.; Zhang, G.; Long, X.; Zhang, Q.; Liu, D.; Wu, H.; Li, S. Identifying the Drivers of Water Yield Ecosystem Service: A Case Study in the Yangtze River Basin, China. Ecol. Indic. 2021, 132, 108304. [Google Scholar] [CrossRef]
  57. Wang, X.; Chu, B.; Feng, X.; Li, Y.; Fu, B.; Liu, S.; Jin, J. Spatiotemporal Variation and Driving Factors of Water Yield Services on the Qingzang Plateau. Geogr. Sustain. 2021, 2, 31–39. [Google Scholar] [CrossRef]
  58. Goel, M.K. Runoff Coefficient. In Encyclopedia of Snow, Ice and Glaciers; Singh, V.P., Singh, P., Haritashya, U.K., Eds.; Springer: Dordrecht, The Netherlands, 2011; p. 952. ISBN 978-90-481-2641-5. [Google Scholar]
  59. Lian, X.H.; Qi, Y.; Wang, H.W.; Zhang, J.L.; Yang, R. Assessing Changes of Water Yield in Qinghai Lake Watershed of China. Water 2020, 12, 11. [Google Scholar] [CrossRef] [Green Version]
  60. DeFries, R.; Eshleman, K.N. Land-Use Change and Hydrologic Processes: A Major Focus for the Future. Hydrol. Process. 2004, 18, 2183–2186. [Google Scholar] [CrossRef]
  61. Harka, A.E.; Roba, N.T.; Kassa, A.K. Modelling Rainfall Runoff for Identification of Suitable Water Harvesting Sites in Dawe River Watershed, Wabe Shebelle River Basin, Ethiopia. J. Water Land Dev. 2020, 47, 186–195. [Google Scholar] [CrossRef]
  62. Tarigan, S.; Tukayo, R. Impact of Land Use Change and Land Management on Irrigation Water Supply in Northern Java Coast. J. Trop. Soils 2013, 18, 169–176. [Google Scholar]
  63. Astuti, I.S.; Sahoo, K.; Milewski, A.; Mishra, D.R. Impact of Land Use Land Cover (LULC) Change on Surface Runoff in an Increasingly Urbanized Tropical Watershed. Water Resour. Manag. 2019, 33, 4087–4103. [Google Scholar] [CrossRef]
  64. Wei, P.; Chen, S.; Wu, M.; Deng, Y.; Xu, H.; Jia, Y.; Liu, F. Using the InVEST Model to Assess the Impacts of Climate and Land Use Changes on Water Yield in the Upstream Regions of the Shule River Basin. Water 2021, 13, 1250. [Google Scholar] [CrossRef]
  65. Im, S.; Kim, H.; Kim, C.; Jang, C. Assessing the Impacts of Land Use Changes on Watershed Hydrology Using MIKE SHE. Environ. Geol. 2009, 57, 231–239. [Google Scholar] [CrossRef]
  66. Woldesenbet, T.A.; Elagib, N.A.; Ribbe, L.; Heinrich, J. Hydrological Responses to Land Use/Cover Changes in the Source Region of the Upper Blue Nile Basin, Ethiopia. Sci. Total Environ. 2017, 575, 724–741. [Google Scholar] [CrossRef]
  67. Muhammed, H.H.; Mustafa, A.M.; Kolerski, T. Hydrological Responses to Large-Scale Changes in Land Cover of River Watershed: Review. J. Water Land Dev. 2021, 50, 108–121. [Google Scholar] [CrossRef]
  68. Allen, R.G.; Pereira, L.S.; Raes, D.; Smith, M.; Ab, W. Crop Evapotranspiration—Guidelines for Computing Crop Water Requirements—FAO Irrigation and Drainage Paper 56. Irrig. Drain. 1998, 300, D05109. [Google Scholar] [CrossRef]
  69. Ardhianie, N.; Daniel, D.; Purwanto, P.; Kismartini, K. Jakarta Water Supply Provision Strategy Based on Supply and Demand Analysis. H2Open J. 2022, 5, 221–233. [Google Scholar] [CrossRef]
  70. Tarigan, N.; Dasanto, B.D. Bogor Water Adequacy Status for 2009–2019. Agromet 2022, 36, 42–50. [Google Scholar] [CrossRef]
  71. Citarum Kondisi Fisik Dan Spasial—Citarum. Physical and Spatial Conditions. Available online: http://citarum.org/tentang-kami/sekilas-citarum/kondisi-fisik-dan-spasial.html (accessed on 23 July 2022).
  72. Wang, X.; Liu, G.; Lin, D.; Lin, Y.; Lu, Y.; Xiang, A.; Xiao, S. Water Yield Service Influence by Climate and Land Use Change Based on InVEST Model in the Monsoon Hilly Watershed in South China. Geomat. Nat. Hazards Risk 2022, 13, 2024–2048. [Google Scholar] [CrossRef]
  73. Liu, Y.; Yang, Y.; Wang, Z.; An, S. Quantifying Water Provision Service Supply, Demand, and Spatial Flow in the Yellow River Basin. Sustainability 2022, 14, 10093. [Google Scholar] [CrossRef]
  74. Ningrum, W.S.; Widyaningsih, Y.; Indra, T.L. Spatial Modeling on the Upperstream of the Citarum Watershed: An Application of Geoinformatics. AIP Conf. Proc. 2017, 1827, 20017. [Google Scholar] [CrossRef] [Green Version]
  75. Kuntoro, A.A.; Cahyono, M.; Soentoro, E.A. Land Cover and Climate Change Impact on River Discharge: Case Study of Upper Citarum River Basin. J. Eng. Technol. Sci. 2018, 50, 364–381. [Google Scholar] [CrossRef]
  76. Zhou, J.; Chen, X.; Xu, C.; Wu, P. Assessing Socioeconomic Drought Based on a Standardized Supply and Demand Water Index. Water Resour. Manag. 2022, 36, 1937–1953. [Google Scholar] [CrossRef]
  77. OhIsson, L. Water Conflicts and Social Resource Scarcity. Phys. Chem. Earth Part B Hydrol. Ocean. Atmos. 2000, 25, 213–220. [Google Scholar] [CrossRef]
  78. Zeng, Z.; Liu, J.; Savenije, H.H.G. A Simple Approach to Assess Water Scarcity Integrating Water Quantity and Quality. Ecol. Indic. 2013, 34, 441–449. [Google Scholar] [CrossRef]
  79. Hanjra, M.A.; Ejaz Qureshi, M. Global Water Crisis and Future Food Security in an Era of Climate Change. Food Policy 2010, 35, 365–377. [Google Scholar] [CrossRef]
  80. Hatmoko, W.; Firmansyah, R.; Fathony, A. Water Security of River Basins in West Java. In Proceedings of the IOP Conference Series: Earth and Environmental Science, Changsha, China, 18–20 September 2020; Volume 419. [Google Scholar]
  81. Juwana, I.; Muttil, N.; Perera, B.J.C. Application of West Java Water Sustainability Index to Three Water Catchments in West Java, Indonesia. Ecol. Indic. 2016, 70, 401–408. [Google Scholar] [CrossRef]
  82. Hasbiah, A.W.; Kurniasih, D. Analysis of Water Supply and Demand Management in Bandung City Indonesia. In Proceedings of the IOP Conference Series: Earth and Environmental Science, Moscow, Russia, 27 May–6 June 2019; Volume 245. [Google Scholar]
  83. Gonzales, P.; Ajami, N.K. Urban Water Sustainability: An Integrative Framework for Regional Water Management. Hydrol. Earth Syst. Sci. Discuss. 2015, 12, 11291–11329. [Google Scholar] [CrossRef] [Green Version]
  84. Kartiwa, B.; Murniati, E.; Bormudoi, A. Application of Hydrological Model, RS and GIS for Flood Mapping of Citarum Watershed, West Java Province, Indonesia. J. Remote Sens. Technol. 2013, 1, 1. [Google Scholar] [CrossRef]
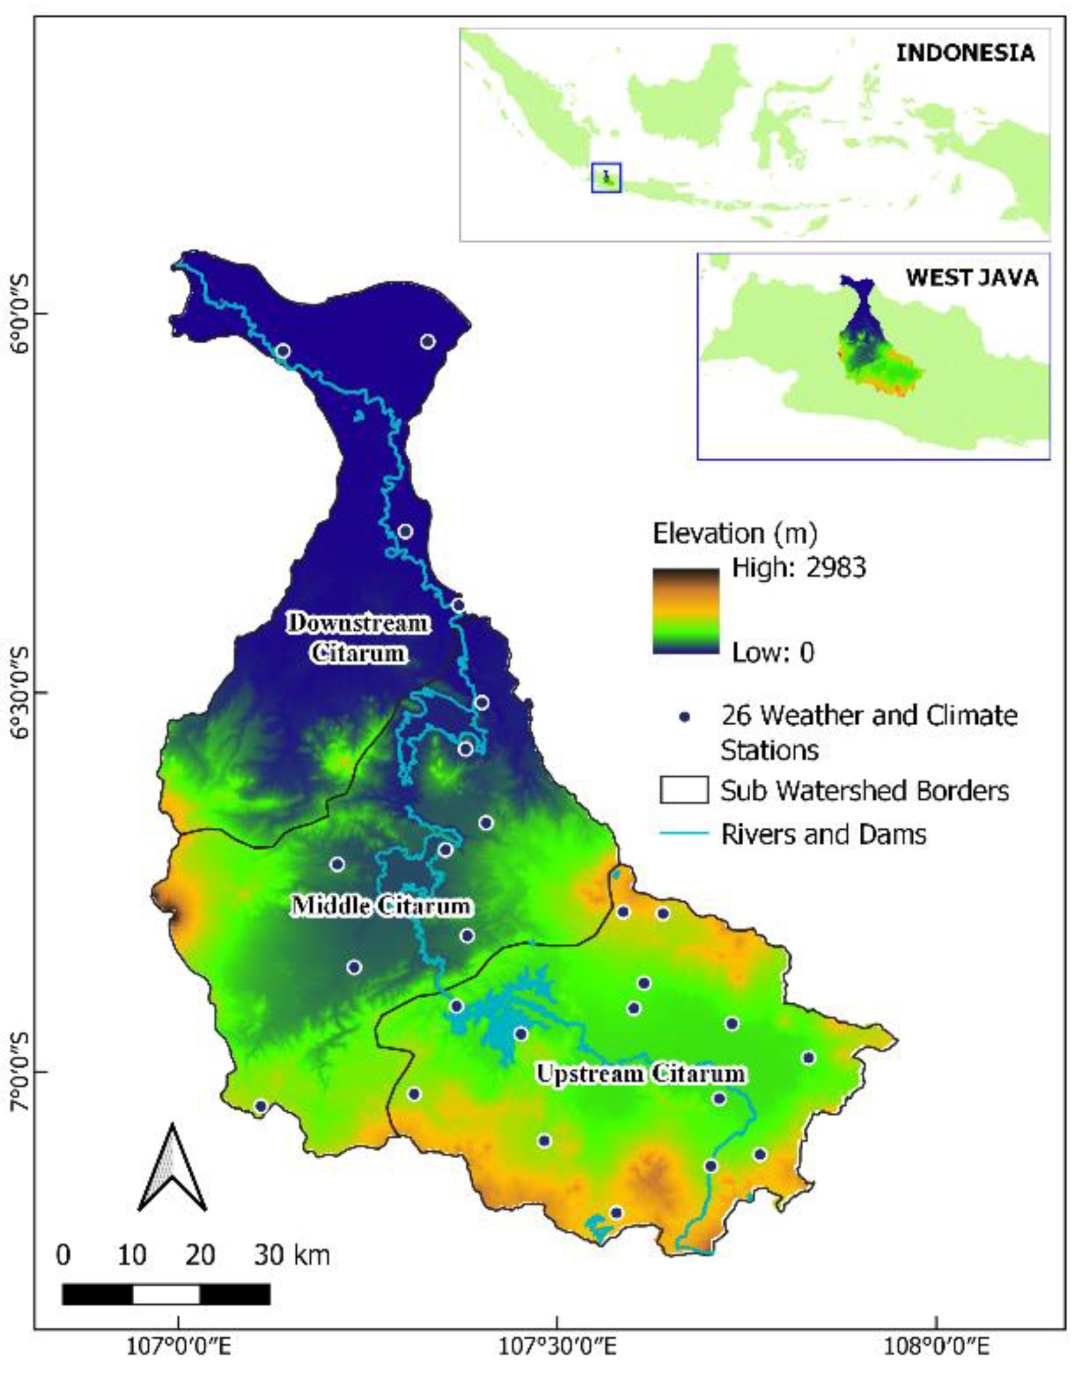
Figure 1. Location and topography of CW in West Java, Indonesia.
Sustainability 15 00562 g001
Figure 2. Input data used for WY analysis using InVEST: (a) LULC, (b) annual rainfall, (c) reference evapotranspiration (ETO), (d) root depth, (e) PAWC and (f) Watershed with sub-districts of WY for the CW.
Sustainability 15 00562 g002
Figure 4. Spatial distribution of WS: (a) in the year 2000, (b) in the year 2010, (c) in the year 2020.
Sustainability 15 00562 g004
Figure 5. Spatial distribution of WS change from in CW: (a) in the year 2000–2010, (b) in the year 2010–2020.
Sustainability 15 00562 g005
Figure 6. Spatial changes in the supply of WY service in the CW: (a) 2000, (b) 2010, and (c) 2020.
Sustainability 15 00562 g006
Figure 7. Spatial distribution of WD (a) in the year 2000, (b) in the year 2010, (c) in the year 2020.
Sustainability 15 00562 g007
Figure 8. Spatial distribution of WD change from in CW (a) in the year 2000–2010, (b) in the year 2010–2020.
Sustainability 15 00562 g008
Figure 9. Spatial changes in the WD for WY service in the CW: (a) 2000, (b) 2010, and (c) 2020.
Sustainability 15 00562 g009
Figure 10. WSI map in the CW: (a) 2000, (b) 2010, and (c) 2020.
Sustainability 15 00562 g010
Figure 11. Global Moran index of WY service in the CW: (a) 2000, (b) 2010, and (c) 2020.
Sustainability 15 00562 g011
Figure 12. Spatial matching of supply and demand of WY service in the CW: (a) 2000, (b) 2010, and (c) 2020.
Sustainability 15 00562 g012
Table 1. The data set used in this research.
Type of DatasetData SourcesProcessingData Format
LULC maps (2000, 2010)Ministry of Environment and ForestryConverting polygon to rasterRaster data with a spatial
resolution of 30 m
LULC maps
2020
US Geological Survey, http://www.usgs.govUSGSpath/row122-121/64 (accessed on 17 March 2022)Supervised ClassificationRaster data with a spatial
resolution of 30 m
Rainfall and temperatureThe National Bureau of Meteorology, Climatology, and Geophysics; Citarum Ciliwung River Basin Center; PT. Jasa Tirta IINumerical/Table Data, with location coordinates; a spline interpolation techniqueRaster data with a spatial
resolution of 30 m
Evapotranspiration mapWorldClim https://worldclim.org/data/index.html (accessed on 17 March 2022)a spline interpolation techniqueRaster data with a spatial resolution of 30 m
Soil type data: soil texture, organic matter content, and effective rooting depthCitarum Ciliwung River Basin CenterExtraction and resampling, conversion from polygon to rasterRaster data with a spatial
resolution of 30 m
Watershed boundariesCitarum Ciliwung River Basin CenterDigital watershed: extraction from DEMVector, CSV
Table 2. WS in the CW in 2000, 2010, and 2020.
WatershedArea200020102020
(ha)108 m3%108 m3%108 m3%
Upstream CW245,41326.1825.1822.1426.0619.9127.65
Middle CW 251,37344.2042.5136.5042.9632.2444.78
Downstream CW 194,13033.6032.3126.3330.9919.8527.57
Total690,916103.98100.0084.97100.0072.00100.00
Table 3. WS change in the CW from 2000 to 2020.
Watershed2000–20102010–20202000–2020
108 m3%Predicate108 m3%Predicate108 m3%Predicate
Upstream CW−4.04−15.44NC−2.24−10.09NC−6.28−3.97NC
Middle CW −7.70−17.42NC−4.26−11.66NC−11.96−27.05D
Downstream CW −7.27−21.63NC−6.48−24.61D−13.75−40.92ED
Total−19.01−18.28NC−12.97−15.27NC−31.98−30.76D
ED = Extremely Decrease (<−40%); D = Decrease (−20–−40%); NC = No Change (−20–20%); I = Increase (20–40%); EI = Extremely Increase (>40%).
Table 4. LULC, water supply, and rainfall in the CW from 2000 to 2020.
LULC Type200020102020Average
WSC *
WSR *WSC *WSR *WSC *WSR *WSC *
mmmm mmmm mmmm
Shrubs183823820.77177921970.81151123820.630.74
Dry Agriculture158122800.69125418550.68120522800.530.63
Virgin Forest159424500.65135822310.61130624500.530.60
Estate Crops Plantation160925120.64135921490.63109925120.440.57
Paddy Field157024260.65128319990.6496524260.400.56
Plantation Forest141423110.61116020110.58104523110.450.55
Settlement Area133520110.66117716880.70109520110.540.64
Airport82414960.5593014660.6389514960.600.59
Fishpond125433300.3856112940.4384533300.250.35
Lake73626600.2889322540.4069626600.260.31
Bare land50121870.2351219160.2741021870.190.23
* R = Rainfall * WSC = WS coefficient.
Table 5. The relationship between the LULC area and WS in the CW from 2000 to 2020.
LULC Type200020102020Change 2010–2020
AreaWSAreaWSAreaWSAreaWS
%%%%%%%%
Paddy Field 35.3636.9527.5728.7730.3629.572.790.8
Dry Agriculture 24.5625.8430.9531.5728.5635.05−2.393.48
Plantation Forest 10.7410.1110.8710.2712.0511.201.180.93
Settlement Area 9.188.1511.5711.0812.6511.271.080.19
Estate Crops Plantation 6.516.976.417.094.525.62−1.89−1.47
Virgin Forest 4.624.93.593.972.364.38−1.230.41
Shrubs 2.63.182.573.723.631.191.06−2.53
Fishpond 2.792.332.831.292.8800.05−1.29
Lake 2.261.112.261.642.261.290.000.00
Bare land 1.330.441.340.560.690.42−0.65−0.14
Airport 0.030.020.030.020.030.020.000.00
Table 6. WD in the CW in 2000, 2010, and 2020.
WatershedArea200020102020
(ha)108 m3%108 m3%108 m3%
Upstream CW245,41310.1637.8713.0439.5018.2737.48
Middle CW251,3738.8132.8411.1733.8416.4133.67
Downstream CW194,1307.8629.308.7926.6314.0628.85
Total690,91626.83100.0033.00100.0048.74100.00
Table 7. WD change in the CW from 2000 to 2020. The predicate * of each watershed is based on the percentage change.
Watershed2000–20102010–20202000–2020
108 m3%Predicate108 m3%Predicate108 m3%Predicate
Upstream CW2.8828.35I5.2340.11EI8.1179.82EI
Middle CW2.3626.79I5.2446.91EI7.6086.27EI
Downstream CW0.9311.83NC5.2759.95EI6.2078.88EI
Total6.1723.00I15.7447.70EI21.9181.66EI
ED = Extremely Decrease (<−40%); D = Decrease (−20–−40%); NC = No Change (−20–20%); I = Increase (20–40%); EI = Extremely Increase (>40%).
Table 8. LULC and WD in the CW from 2000 to 2020.
LULC Type200020102020Average
AreaWDAreaWDAreaWDAreaWD
%%%%%%%%
Paddy Filed35.3659.2227.5745.0330.3649.502.794.47
Dry Agriculture24.5627.6030.9533.8828.5631.44−2.38−2.44
Plantation Forest10.742.0910.875.1112.054.961.18−0.15
Settlement Area9.1812.8111.5715.7112.6513.861.08−1.85
Estate Crops Plantation6.510.086.410.074.520.06−1.89−0.02
Virgin Forest4.620.023.590.022.360.02−1.230.00
Shrubs2.600.022.570.023.630.011.06−0.01
Fishpond2.790.012.830.012.880.010.05−0.00
Lake2.260.092.260.092.260.090.00−0.00
Bare land1.330.021.340.020.690.01−0.65−0.00
Airport0.030.050.030.050.030.04−0.00−0.00
Table 9. Changes in supply and demand of WY service in the CW.
Sub-WatershedArea200020102020
(ha)WC *
108 m3
SDRWSIWC *
108 m3
SDRWSIWC *
108 m3
SDRWSI
Upstream CW 245,41310.162.580.4113.041.700.2318.271.090.04
Middle CW 251,3738.815.020.7011.173.270.5116.411.960.29
Downstream CW 194,1307.864.270.638.793.000.4814.061.410.15
Total690,91626.833.880.5933.012.570.4148.741.480.17
* WC = Water consumption.
Table 10. Global Moran’s I in the CW from 2000 to 2020.
YearMoran’s IZ Valuep Value
20000.34410.26780.001
20100.34611.97780.001
20200.36812.43050.001
Table 11. Management strategies and actions of the CW management.
Supply–Demand Matching TypeSupply–Demand Matching TypeZone ManagementRegency and
Sub-District
Planning Recommendations
Surplus High supply-low demandConservation areaUpstream CW: Bandung Regency (1 sub-district) and West Bandung Regency (1 sub-district)Strict ecological protection policy, efforts to maintain the supply capacity of water production services in the area, and maintain the ecological quality do not decline.
DeficitHigh supply-high demand Upstream CW: Bandung Regency (2 sub-districts), West Bandung Regency (6 sub-districts)
Downstream CW: Bekasi Regency (2 sub-districts), Bogor Regency (4 sub-districts), Cianjur Regency (7 sub-districts), Karawang Regency
Middle CW: Purwakarta (2 sub-districts)
DeficitLow supply-high demandRestoration areaUpstream CW:
Bandung Regency (1 sub-district) and West Bandung (1 sub-district)
Downstream CW: Bekasi Regency (3 sub-districts), Bogor Regency (1 sub-district), Karawang Regency (3 sub-districts)
Middle CW: Cianjur Regency (3 sub-districts), Purwakarta Regency (1 sub-district)
Socialization and community empowerment in strict water-saving efforts throughout the community; planting and reforestation of open areas; and control of watertight areas of newly added construction sites.
DeficitLow supply-low demandImprovement areaDownstream CW: Bandung City (23 sub-districts)Establish ecological control guidelines that focus on protecting water resources based on a socio-ecological approach, strengthening ecological protection and restoration strategies; utilization of engineering technology for ecological management of the main water system (Citarum and Ciliwung river).
Disclaimer/Publisher’s Note: The statements, opinions and data contained in all publications are solely those of the individual author(s) and contributor(s) and not of MDPI and/or the editor(s). MDPI and/or the editor(s) disclaim responsibility for any injury to people or property resulting from any ideas, methods, instructions or products referred to in the content.