Article

Multi-Scenario Simulations of Land Use and Habitat Quality Based on a PLUS-InVEST Model: A Case Study of Baoding, China

1
School of Landscape Architecture, Beijing Forestry University, 35-Qinghua East Road, Beijing 100083, China
2
School of Art and Design, Beijing Forestry University, 35-Qinghua East Road, Beijing 100083, China
*
Author to whom correspondence should be addressed.
Sustainability 2023, 15(1), 557; https://doi.org/10.3390/su15010557
Submission received: 18 November 2022 / Revised: 22 December 2022 / Accepted: 26 December 2022 / Published: 28 December 2022
(This article belongs to the Special Issue Urban Planning and Sustainable Land Use)

Abstract

:
Habitat quality and ecosystem service value (ESV) are important foundations for sustainable development. Baoding, as the strategic hinterland of Beijing–Tianjin–Hebei, is of great significance to regional ecological conservation and sustainable urban development. Based on land-use data from 2000 to 2020, the land-use scenarios of natural development (ND), water protection (WP), forest rehabilitation (FR), and cultivated land protection (CP) in 2030 were predicted by the PLUS model and adopt the InVEST model and equivalent ESV table to assess ecological sustainability. The results show that: (1) From 2000 to 2020, the construction land in Baoding has increased by 812 km2, and the cultivated land and forest land decreased by 708 km2 and 154 km2. Habitat quality is obviously deteriorating in 4.66% of the city. (2) Under different scenarios, the order of habitat quality is CP > FR > WP > ND. The habitat quality under each scenario is dominated by medium habitat quality. (3) Under different scenarios, the order of ESV is FR > CP> WP > ND. The fluctuation of forest land and cultivated land scale is affecting the ESV. (4) CP and FR will form a land-use pattern that has “high ecological quality and value”, which better balances the economic development and ecological protection of Baoding. This research study will provide a reference for the effective allocation of land resources and will guide the formulation of urban land space planning policy in Baoding.

1. Introduction

To achieve urban–rural integration in the new era, harmonizing regional ecological quality and ecological values is key to promoting regional economic sustainability at the macro level [1,2]. Thus, it is important to accurately assess the future evolution of regional habitat quality trends and calculate the future value of regional ecosystem services. Land-use change represents an important link between human socio-economic activities and natural environment evolution, habitat quality, and ecosystem service values (ESV) [3,4]. Currently, the analysis and prediction of land-use change can be achieved using various models; for example, Logistic-CA [5], CLUES [6,7], and FLUS [8,9], which are based on meta-cellular automata (CA) [10], have been widely used for the spatial optimization of land-use patterns as well as ecological red line delineation. The PLUS model, which is a novel land-use simulation model, exhibits higher simulation accuracy than that of the above-mentioned models and can be better integrated with planning policies to support regional sustainable development studies [11]. For instance, Li et al. coupled the grey multi-objective optimization model (GMOP) and the PLUS model to analyze the spatial and temporal evolution of ESV in the Sichuan–Yunnan region for 2026 under three scenarios: the business-as-usual scenario, the ecological development priority scenario, and the ecological and economic balance scenario [9]. Moreover, Lin et al. obtained the spatial and temporal distributions of carbon stocks in Guangdong Province from 1990 to 2020 by using the InVEST and PLUS models [12], while Lin et al. used the PLUS model for simulating land-use and land-cover change in the Fuxian Lake basin [13]. The above-mentioned studies demonstrated the applicability of the PLUS model for the analysis and prediction of land-use change.
Land-use change tends to affect the regional habitat quality, which is the ability of an ecosystem to provide space for sustainable survival and the development of suitable individuals and populations within a certain spatial and temporal scale [14,15]. Stable habitats are the prerequisite and basis for ecosystem services and functions, and they are essential for maintaining and enhancing biodiversity [16]. Habitat quality assessment methods have evolved from single-indicator analyses to multi-indicator integrated measurements and then to distributed model dynamic assessments. With the increasing concern for urban ecological environments and the quality of life, researchers constructed mathematical models such as ARIES [17], SolVES [18], and InVEST [19,20] to carry out a long time-series dynamic assessment, among which the InVEST model based on the distributed algorithm of 3S technology has been widely used. Furthermore, changes in land-use type can affect the structures, processes, and functions of ecosystems, which in turn significantly affect the ESV [21]. Accordingly, scholars studied spatial and temporal changes in ESV in different study areas [22,23], watersheds [24], and ecological zones [25]. Previous studies used the InVEST model to measure habitat quality in different regions, which effectively assesses the impact of changes in natural and social conditions on ecosystem service quality. Consequently, combining the InVEST and ESV will explore the synchronicity of ecological “quality” and “value” to characterize the relationship between ecological development and ecological economy.
With economic development and changes in urban spatial structure, Baoding, as an important city in the Beijing–Tianjin–Hebei city cluster, is facing ecological and environmental problems such as air pollution, water shortage, degradation, and the shrinkage of wetland and loss of biodiversity [26,27], which have become bottlenecks limiting the development of the region. In 2017, it was listed by the Ministry of Housing and Construction as the third batch of pilot cities for “Double Urban Repairs” [28]. To relieve the pressure on the ecological environment of Baoding and promote the development of ecological industries and the ecological integration of Beijing, Tianjin, and Hebei, this paper checks the ecological development-related policy documents of Baoding between 2000 and 2020 and innovatively extracts four policy focuses as the basis for setting scenarios, while combining the results of the scenarios with the highest ecological quality and value for re-validation to provide a reference for the effective allocation of land resources and the spatial planning of land under ecological protection.

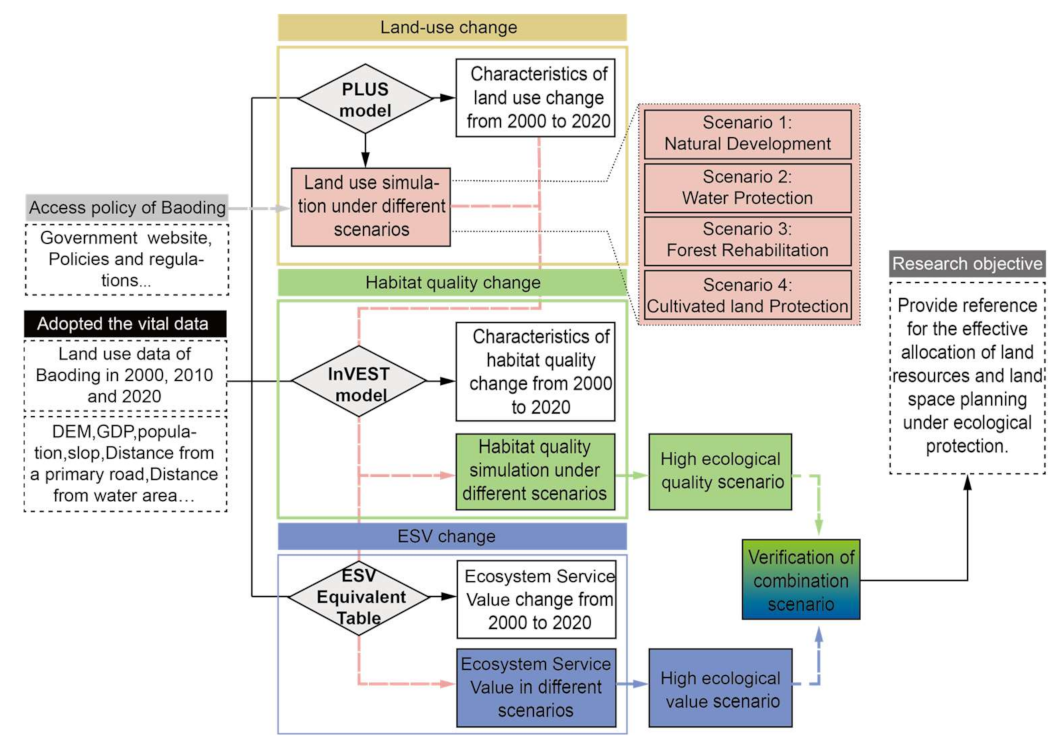
2. Materials and Methods

This paper uses the PLUS model and multi-period high-precision land-use data to identify the land-use change patterns in Baoding from 2000 to 2020 and to simulate the land-use situation in Baoding in 2030 under the guidance of four important urban development policies. On this basis, the InVEST model was used to calculate the habitat quality of Baoding in different periods and situations, and the ecological service value equivalence table was introduced to estimate the value of ecosystem services in different situations in Baoding to identify the land-use pattern of “high ecological quality-high ecological value”, and to further validate this land-use pattern. The land-use model was further validated to provide reference for the effective allocation of land resources and land space planning under ecological protection (Figure 1).

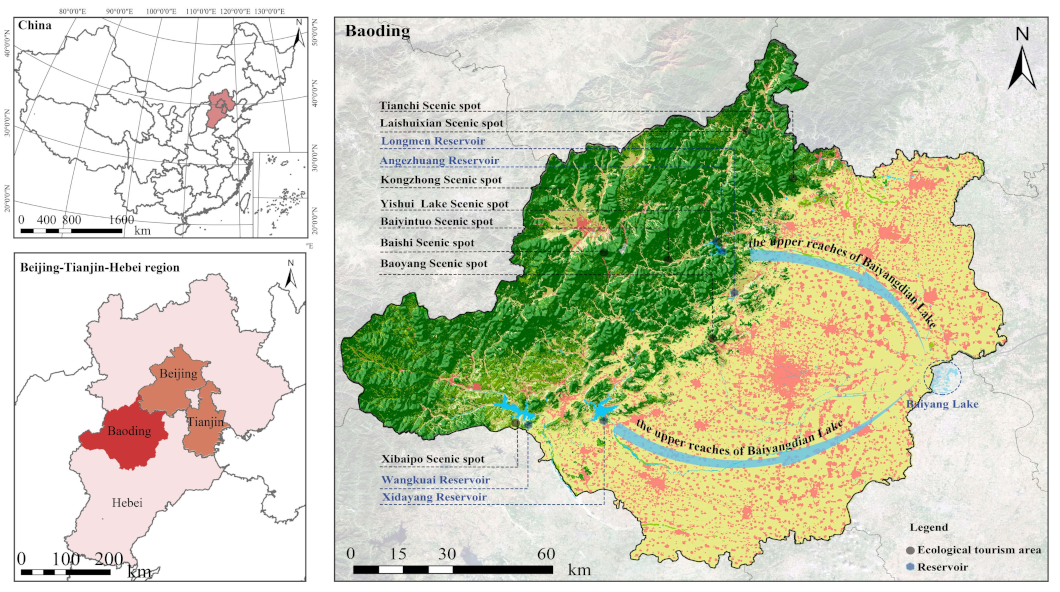
2.1. Overview of the Study Area

Baoding is in the western part of the central Hebei province and between the eastern foothills of Taihang Mountains and the western part of the Jizhong Plain (113°45′32″–116°19′41″ E and 38°14′29″–39°57′3″ N) (Figure 2). It is adjacent to Beijing and Zhangjiakou in the north, Langfang and Cangzhou in the east, Shijiazhuang and Hengshui in the south, and Shanxi in the west. The topography of the city is high in the northwest and low in the southeast, while the landscape consists of mountains and plains and an uneven regional distribution of river resources. Furthermore, 5 municipal districts, 4 county-level cities, and 15 counties are under its jurisdiction, thereby exhibiting a total area of 22,190 km2, a resident population of 11,546,000 in 2020, a GDP of CNY 335.33 billion (accounting for 9.38% of the total GDP of Hebei Province) and one of the best economic growth rates in the province [29].

2.2. Data Source

The main data sources used in this study include the following: (1) Baoding grain production data and acreage data from the Baoding Statistical Yearbook and grain price data from the National Compilation of Cost and Benefit Information on Agricultural Products [30]; (2) land-use data from the Globeland30 global surface use database (http://www.globallandcover.com, accessed on 10 September 2022), in which the images for the land cover classification of development and update of GlobeLand30 are mainly 30 m multispectral images, including Landsat TM5 ETM+ [31]; (3) elevation data from the geospatial data cloud platform of the Computer Network Information Center of the Chinese Academy of Sciences (http://www.gscloud.cn, accessed on 10 September 2022), with a spatial resolution of 30 × 30 m; (4) temperature and precipitation data from the National Science and Technology Infrastructure Platform at the National Earth System Science Data Centre—Loess Plateau Sub-Center (http://loess.geodata.cn, accessed on 12 September 2022) [32]; (5) GDP and population data from the Resource and Environment Science Data Registration and Publication System; (6) roads, water, and railway data are cited from the National Geographic Information Resources Catalogue Service (www.webmap.cn). To unify the spatial accuracy of the data, the above data were processed by using the cropping and resampling tools of ArcGis 10.5 to convert them into 30 m × 30 m raster files.

2.3. Research Methodology

2.3.1. PLUS Model

Based on the metacellular automata model, the PLUS model integrates a land expansion strategy analysis module and a simulation model of future land-use changes via multi-class random patch seeding [11]. First, it analyzes the spatial characteristics of various land-use expansion forces and elucidates the driving factors between the two phases of land-use data. Second, it employs the random forest algorithm to sample and calculate the land-use expansion forces one by one to obtain the development probability of each land-use type. Finally, based on the roulette wheel strategy, it combines random patch generation, the transition transfer matrix, and the decreasing threshold mechanism to achieve optimization and to determine the final land-use pattern.
  • Selection of land-use change factors
Land-use change factors are affected by multiple factors. On the basis of considering the accuracy and reality of the model, the factors of the natural environment, social economy, and traffic accessibility are comprehensively considered. According to the principles of availability, quantification, and the consistency of driving factors, 10 driving factors were selected (Table 1).
  • Setting neighborhood effects
The neighborhood effects can reflect the expansion capacity of different land types [33]. When applying the PLUS model, it is necessary to determine the ease of interconversion between different land-use types by using neighborhood weights as follows [11]:
Ω i , k t = con c i t 1 = k n × n 1 × w k
where con c i t 1 = k represents the total number of grid cells occupied by land-use type k at the last iteration within the n × n window ( n   is   generally   taken   as   3) [34]; and w k is the weight among the different land-use types between   0 , 1 . The neighborhood weights are set based on existing research results and the actual conditions of Baoding (Table 2).
  • Verification of model accuracy
The PLUS model is often tested using point-by-point comparisons or random validations. Random validations are generally suitable for large-scale simulations, whereas point-by-point comparisons are suitable for relatively small areas [35]. In this study, based on the actual land-use data in the Baoding, this study uses a Kappa coefficient and overall accuracy to test the simulation accuracy of the model. The overall accuracy (OA) refers to the ratio of the number of correctly classified class cells to the total number of classes. The Kappa coefficient is often used to compare the similarity between two images [13]. The expression of the kappa coefficient is as follows:
kappa = P 0 P c P p P c
where P 0 is the observed agreement rate between the reference map and the simulation results; P c is the expected proportion of correct simulations in the random case; and P p is the proportion of correct simulations in the ideal classification case and is generally taken as 1.
The results show that the Kappa coefficient of the predicted images in 2020 is 0.869 and the overall accuracy is 0.925, indicating that the PLUS simulation results are spatially consistent and exhibit good applicability. Thus, this approach can be used for future land-use simulation models based on Baoding.

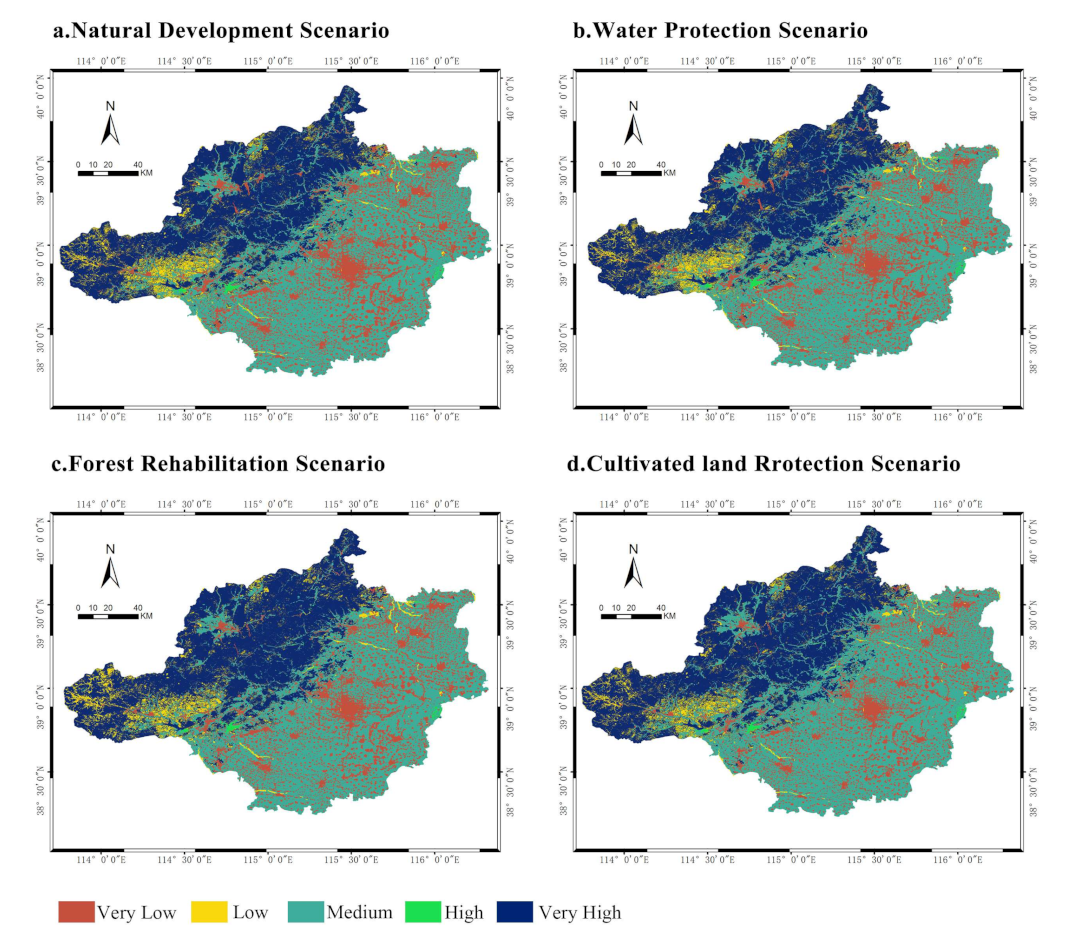
2.3.2. Scenario Setting

Baoding is the ecological environment support area of Beijing–Tianjin–Hebei. According to the characteristics of land-use change in Baoding and the guidance of urban development policies, this study set up 4 scenarios, natural development, water protection, forest rehabilitation, and cultivated land protection, to predict the land-use change in Baoding in 2030. Simulation parameters include the land-use demand, conversion constraint, transition matrix, and neighborhood weights.
  • Natural development: This scenario simulates habitat quality and EVS development until 2030 when the land is not affected by any policies and fully complies with the current situational changes from 2000 to 2020, so no restricted area and land-use change restrictions are set in this scenario. Based on the high-precision land-use data released by the government in 2000, 2010, and 2020, the Markov chain of the PLUS model was used to identify the changing rules for various types of land in the past 20 years, and the identification results were used as the basis for land-use changes in this scenario. It is also the control group.
  • Water protection: Baoding’s rich wetland resources are important for the ecological management of northern China and the Beijing–Tianjin–Hebei ecosystem [36]. The scenario simulates habitat quality and EVS development until 2030 under water protection policies. The scenario is based on the State Council’s “Wetland Protection Plan for Hebei Province [37]“ and the “Baoding Ecological and Environmental Protection Plan [38]“, which propose increasing the wetland and water protection rate in Baoding by 9% by 2030 and to enhance the stability of wetland and water ecosystems, as well as the core strategy of converting degraded cultivated land into wetland and water. Firstly, this condition was input into the model to adjust the land demand predicted by a Markov chain. Then, the existing wetland and water were used as restricted areas and the change of wetland and water was restricted. Next, neighborhood weight parameters were set according to Table 2. Lastly, the proportion and spatial distribution of land-use under this scenario were obtained.
  • Forest rehabilitation: Forestland is the root of the survival and development of forests and wildlife and has an important position in maintaining ecological security. Forestland resources in Baoding play an important role in the ecological space of Beijing–Tianjin–Bao and the water conservation of the Yanshan–Taihang Mountains. The scenario simulates habitat quality and ESV development to 2030 under forestland conservation policies. The scenario is based on the government’s documents, including the “Baoding Forest and Water Ecosystem Construction Plan [39]“, which proposes an optimal proportion of forested land in Baoding of 35% by 2030, and the State Council document “New Round of Returning Cultivated Land to Forest [40]“ and “14th Five-Year Plan for Forestry and Grassland Protection and Development in Hebei Province”, which specifically propose the conversion of severely sandy land to forestland. The core strategy involves converting cultivated land into forest land. Firstly, this condition was input into the model to adjust the land demand predicted by the Markov chain. Then, the existing forestlands in the nature reserve were used as restricted areas and the change of forestland was restricted. Next, neighborhood weight parameters were set according to Table 2. Lastly, the proportion and spatial distribution of land-use under this scenario were obtained.
  • Cultivated land protection: Cultivated land is an important foundation for consolidating and improving food production capacity and ensuring national food security [36], and Baoding’s cultivated land resources are important for the construction of the Beijing–Tianjin Agricultural Circle, the Yanshan–Taihang Mountains, and the pre-mountain agricultural area. The scenario simulates habitat quality and ESV development up until 2030 under cultivated land protection policies [41]. The scenario is based on the State Council’s documents 24 and 44 of 2020 and the Baoding government’s “Spring Thunder Action” for cultivated land protection from 2021, which strictly controls the extent of existing cultivated land and focuses on improving its quality according to the optimal protection model. Firstly, this condition was input into the model to adjust the land demand predicted by the Markov chain. Then, the existing permanent basic cultivated land was used as restricted areas and the change of cultivated land was restricted. Next, neighborhood weight parameters were set according to Table 2. Lastly, the proportion and spatial distribution of land-use under this scenario were obtained.

2.3.3. InVEST Model

The habitat quality module of the InVEST model assesses habitat quality, while reflecting the genetic variation and species reproduction potential; this is achieved by considering the sensitivity of each land cover type relative to threat factors as well as the intensity of external threats [42]. Consequently, the statuses of different resources and conditions in the environment are determined for the survival and development of individuals or populations. The relative impacts of each threat and the distance between the habitat grid and the threat need to be calculated before habitat quality can be calculated using the InVEST model. The formula is as follows:
i r x y = 1 d x y d r   m a x   if   linear
i r x y = e x p 2.99 d r   m a x d x y   if   exponential
where d x y   is the linear distance between grid cells x   and y , and d r   m a x   is the maximum effective distance of threat r ’s reach across space.
Habitat degradation is calculated as follows:
D xj = r = 1 R y = 1 Y r w r r = 1 R w r r y i rxy β x S jr
where y indexes all grid cells on r ’s raster map, and Y r indicates the set of grid cells on r ’s raster map.
The final measure of biodiversity and ecosystem function is based on a habitat quality index, which is calculated as follows:
Q xj = H j 1 D xj z D xj z + k z
where Q xj is the habitat quality index for land-use type j in grid x , and H j is the habitat suitability for land-use type j , D xj is the habitat degradation for land-use type j in grid x , k is the half-saturation constant, and z is the default parameter of the model (usually taken as 2.5).
Since the sensitivity of different land-use types varies toward habitat quality threats, only the impact of human activities on the habitat is considered; the more sensitive the land-use unit, the lower its ability to resist disturbances and the more severe the degradation. Habitat suitability and its sensitivity to different threat factors were determined based on relevant information regarding Baoding and previous studies in the neighboring areas [43] (Table 3). Four types of areas with high population activity were selected as stressors, namely: cultivated land, construction land, roads, and railways (Table 4).

2.3.4. Calculating the ESV

The ESV in Baoding was determined by referring to the model proposed by Costanza et al. [21]. Then, it was combined with the ESV equivalent factor proposed by Xie et al. [22,23]. The standard equivalent is the economic value of the natural food produced by one hectare of cropland in a year at the national average yield level. It is generally considered to be equivalent to one-seventh of the economic value of food produced on a hectare of cropland at market prices [44,45]. Table 5 shows the ESVs of grain yield per unit area of the ecosystem in Baoding (1567.76 CNY/hm2/a).
ESV = f = 1 m i = 1 n C f × E fi × A i
where ESV is the ecosystem service value in CNY/yr, i is the land-use type and n is the number of land-use types (n = 7 in this study), f is the ecosystem service type and A i is the area of land-use type i in hm2. E fi is the equivalent value of ecosystem service f for land-use type i , m is the number of ecosystem service types ( m   = 11 in this study), and C f is the economic value of 1 unit of ecosystem services in CNY hm−2yr−1. This equation can also be represented as follows:
E = 1 7 i = 1 n m i p i q i TotalArea
where E   is the economic value of 1 unit of ecosystem services, i is the grain crop type, m i is the average price of grain crop i in Baoding, p i is the yield of grain crop i in kg/hm2,   q i is the planting area of grain crop i in hm2, and TotalArea is the total area planted in grain crops (hm2).

3. Results

3.1. Analysis of Land-Use Change

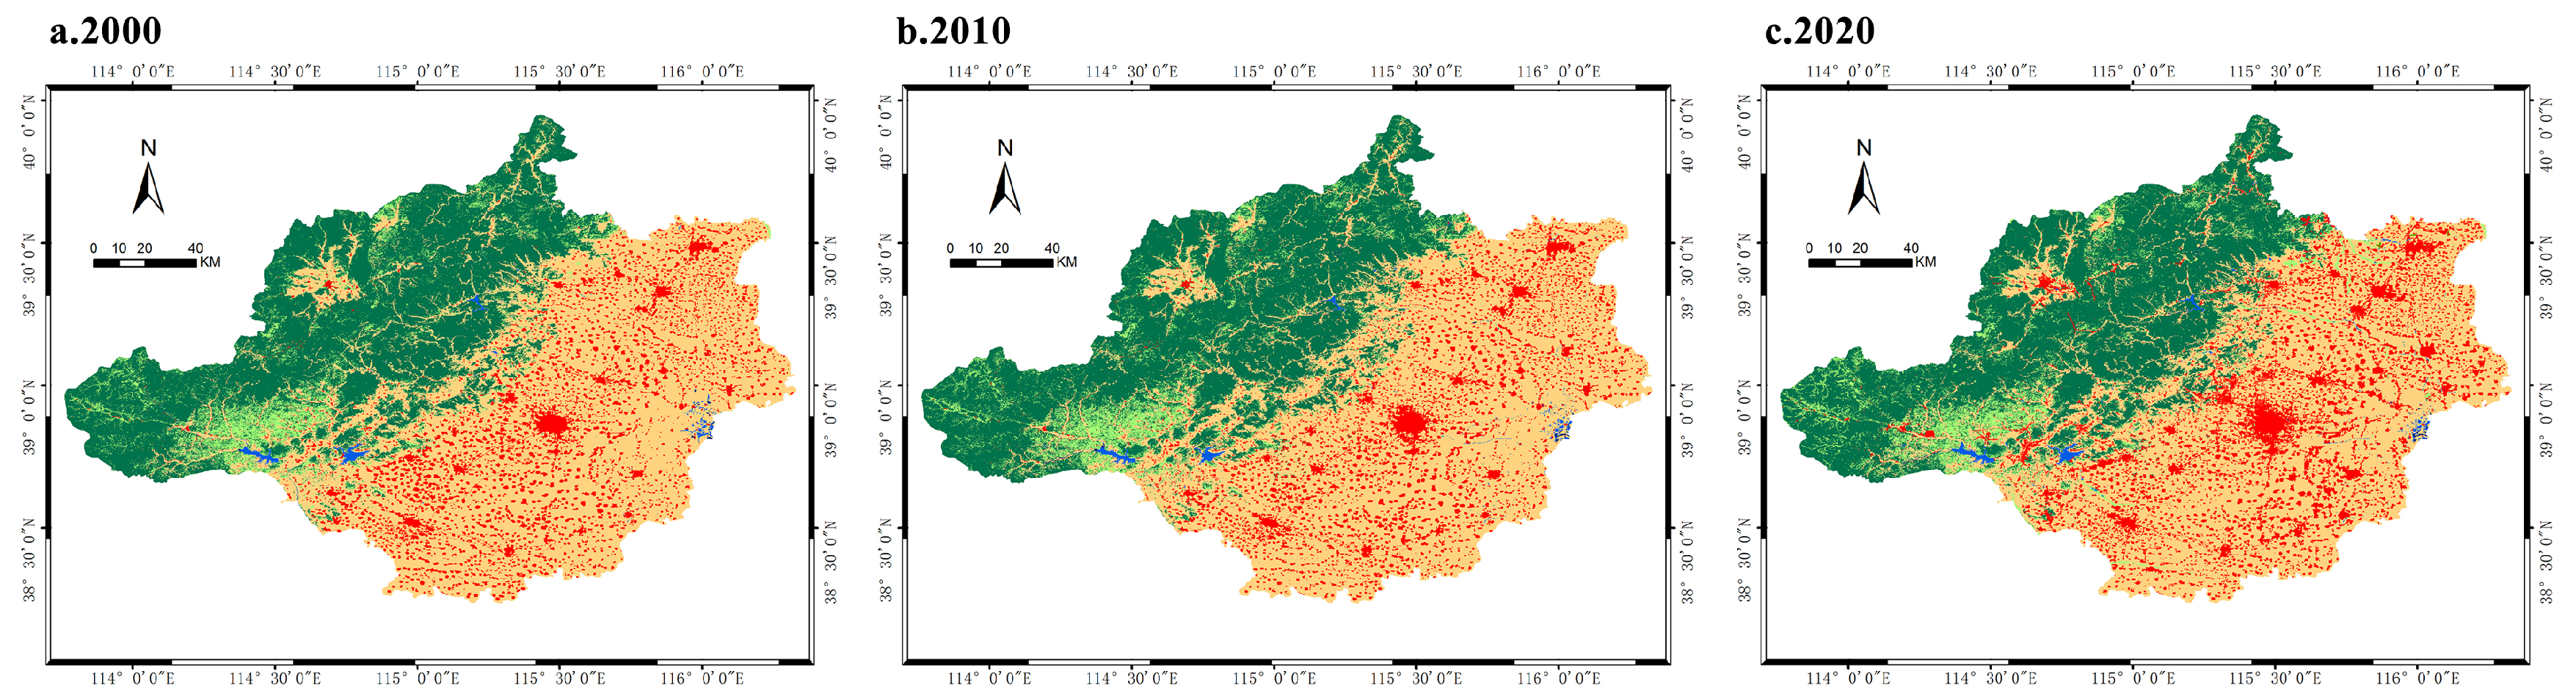
3.1.1. Characteristics of Land-Use Change from 2000 to 2020

During 2000–2020, the land-use of Baoding was dominated by cultivated land, forestland, and construction land, with the sum of the areas of these land types accounting for over 90%, cultivated land and forestland accounted for 49% and 34% of the total area on average per year, respectively (Table 6). Over the past 20 years, forestland in the middle- and low-lying mountainous areas of Baoding was gradually converted to cultivated land and construction land (Figure 3). Meanwhile, the grassland area in the hilly region, which acts as a border between the mountainous area and the plain area, slightly increased. Overall, the expansion of construction land in the plain area is prominent, and the main urban area shows a clear trend of expansion toward the north.
Cultivated land and forestland account for the highest share of the total area of Baoding. However, the area of cultivated land and forestland slightly increased during 2000–2020, which was followed by a significant reduction; that is, cultivated land decreased from 11,090 km² in 2000 to 10,380 km² in 2020, while forestland decreased from 7510 km² in 2000 to 7360 km² in 2020. Accordingly, there is a dire need to conserve cultivated land and forestland. In 20 years, the area of construction land grew by 812 km², which represents the highest increase in the area of any land type. Meanwhile, the area of wetland has decreased by 0.53 km², and the area of water areas has increased by 5 km²; this contrasting trend shows that some wetland gradually transformed into water lands, and that the ecological protection of the wetland is necessary. Grassland and shrubland slowly increased over these 20 years by 41 km² and 4 km², respectively. Overall, the land-use patterns in Baoding show a significant increase in construction land, a significant decrease in cultivated land and forestland, and a slight shift in other land types.

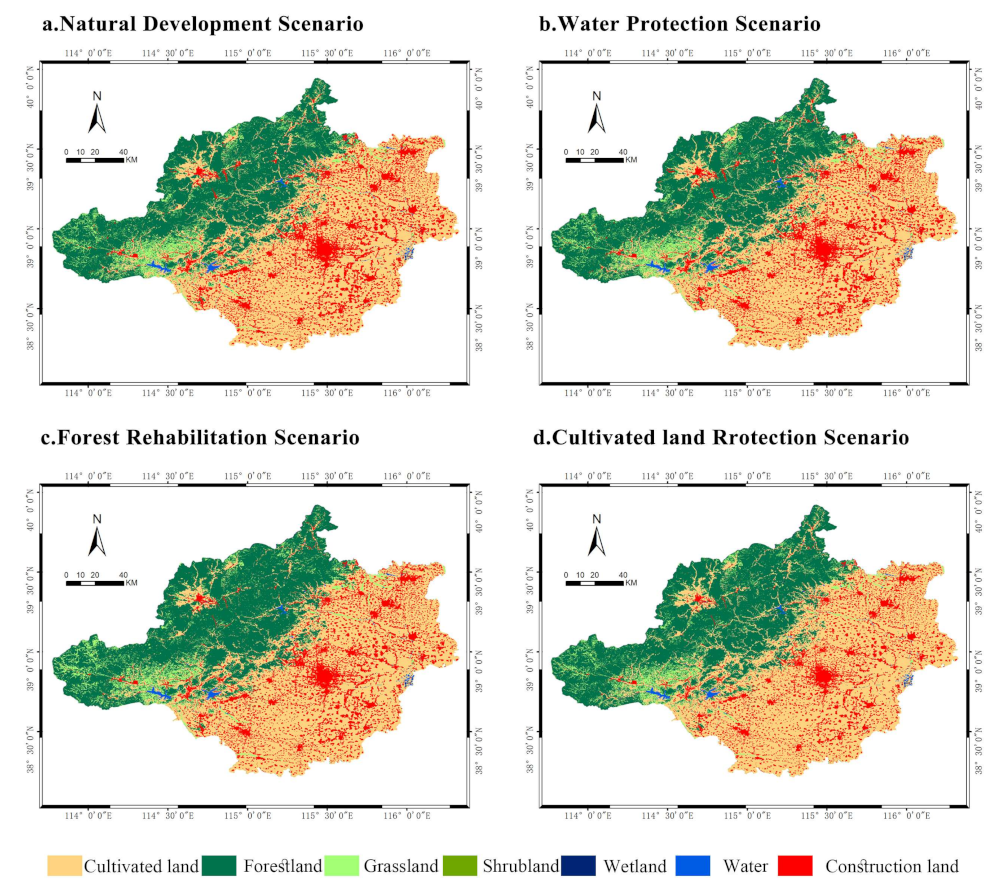
3.1.2. Land-Use Simulation under Different Scenarios

Land-use simulations for 2030 were carried out based on the neighborhood weights in Table 2 and the transfer cost matrix under different scenarios. Compared with the 2020 land-use data, the change in the land-use areas in Baoding in 2030 varied under different scenarios (Table 7); the specific scenario settings and corresponding results have been mentioned below.
Natural development scenario: The increase in construction land area is higher than the other three scenarios, and cultivated land and forestland are still the main contributors to the increase in construction land area. Under this scenario, the forestland area in Baoding decreased by 130 km², and the cultivated land area decreased by 541 km² (becoming the largest land type to be transformed). Meanwhile, the area of construction land increased by 636 km², whereas the area of other land types only changed slightly. Based on the spatial distribution of land-use changes (Figure 4), there is a tendency for cultivated land to transform into forestland in the northwestern part of the mountainous area and at the edge of the nature reserve in the southwestern part of Baoding. Nevertheless, construction land in the northern part of the hilly area, the northeastern part of the plain area, and the central city will continue to expand outward along the urban edges, whereas construction land in the southern part of the plain area is likely to transform into cultivated land.
Water protection scenario: The land-use change trend in this scenario is similar to ND, the reduction in forestland and cultivated land has not been effectively curbed, but the transfer of ecological land is lower and the range of change is smaller. Meanwhile, the water body and wetland will, respectively, increase by 13 km² and 2 km², because a series of ecological restoration and comprehensive management measures have been carried out in the upstream rivers of Baiyangdian Lake, the water area along the rivers and lakes in the mountainous and hilly areas has increased.
Forest rehabilitation: The area of cultivated land in Baoding was further compressed compared with the ND, with a reduction of 838 km2, which was the largest reduction in the four scenarios. The expansion of construction land was still obvious, but its expansion rate was effectively controlled from 3% in the ND to 2% because the development of construction land will also be restricted to a certain extent when returning cultivated land to forest. Meanwhile, cultivated land in mountainous and hilly areas (mainly concentrated in the southwest with complex terrain and developed water systems) transferred to woodland.
Cultivated land protection: Under the CP, land use was maintained correspondingly with the land-use situation in 2020. The area of cultivated land remained unchanged, the area of forestland increased by 156 km2, the area of grassland decreased by 164 km2, and the area of construction land only increased by 8 km2. With respect to the areas of land-use change concentrated along the southwest waters of mountainous areas, cultivated land protection manifested as the transfer of grassland to forestland at the edge of the water body and the transfer of grassland to construction land at the junction of hilly area and plain area, and the expansion of construction land in plain areas no longer has the phenomenon of large-scale diffusion due to the strict restriction of cultivated land protection systems and policy guidance with respect to national stock development.

3.2. Analysis of Habitat Quality Change

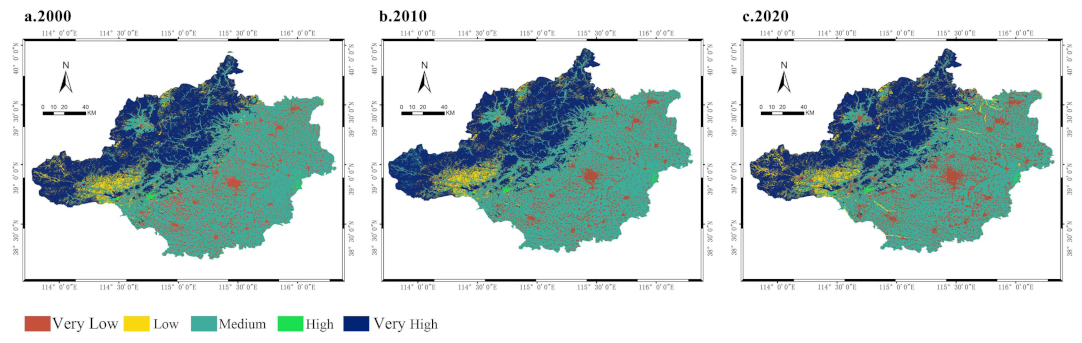
3.2.1. Characteristics of Habitat Quality Change from 2000 to 2020

Based on previous studies on habitat quality and the actual situation in Baoding [46], the natural breakpoint method was used to classify habitat quality into five categories: very low (0.0–0.1), low (0.1–0.4), medium (0.40–0.68), high (0.68–0.90), and very high (0.90–1.0). Table 8 shows that the habitat quality in Baoding is relatively stable between 2000 and 2010, exhibiting an average change of 67 km² or <1% for all land types. However, during 2010–2020, the changes in habitat quality increased sharply, with an average annual change of 413 km² being observed for all land types. In particular, the low habitat quality area increased by 827 km², the medium habitat quality area decreased by −874 km², and the habitat quality in other areas changed relatively slightly (1% on average). Therefore, a continuous transformation trend of medium habitat quality areas to low habitat quality areas was observed.
To further analyze the changes in habitat quality, the spatial distribution of habitat quality in Baoding was calculated (Figure 5). The land-use type is mainly woodland and the ecological environment faces decreased human disturbance, thereby exhibiting strong stability. Areas with low and medium habitat quality are mainly concentrated in mountainous counties and towns because these contain large construction, agricultural, and forestlands; since they exhibit a strong heterogeneity, habitat degradation is higher. Habitat quality in hilly areas is mainly influenced by the land-use types controlled by natural factors within the area; for example, water and grasslands dominate the land-use types along the irrigation areas and reservoirs in the southwestern part of Baoding, with patches of woodland being fragmented and interspersed with grasslands, thereby resulting in a low overall habitat quality. In plain areas, due to the significant increase in urban land-use and human activity, habitat quality is degrading and has been mainly categorized as low and medium.
The ESV in Baoding from 2000 to 2020 showed a decreasing trend year by year, which was CNY 340, 339 and 332 billion. Forestland has the highest ESV, with an average value of CNY 230 billion (accounting for 68% of the total value); this indicates that although forestland is not the largest land type in Baoding, it plays a more important role in ecological protection and development. Cultivated land, which is the largest land type in terms of area, has an average ESV of CNY 68 million (accounting for 20% of the total value). Because of economic, social, and regional development, cultivated land is more prone to encroachment. Furthermore, it plays the role of restraining the uncontrolled expansion of construction land, which has a significant positive impact on ecological development. Variations in the ecological value of water, and grassland are low, indicating that changes in these regions have less influence on the ESV in Baoding. Therefore, when formulating relevant policies, government departments can consider improving or protecting forestland and cultivated land to improve the ecological quality of Baoding’s regional environment to maintain its ecosystem.

3.2.2. Habitat Quality Simulation under Different Scenarios

Under the natural development scenario, the area of medium and high habitat quality changed to low habitat quality (Table 9). The area of low habitat quality expanded by 636 km2, the area of medium habitat quality decreased by 539 km2, and the area of high habitat quality decreased by 124 km2. The natural development focuses on meeting the needs of future population growth and urban construction, while the infrastructure of the old city has difficulty bearing the load and cannot meet the conditions for the large-scale development of new projects, which results in the annexation of cultivated land and forestland by construction land to maintain the expansion trend, resulting in a significant decline in habitat quality. The ESV of the scenario is calculated to be CNY 33 billion (Table 10).
Under the water protection scenario, the changing trend with respect to habitat quality was similar to natural development (Figure 6), but the decrease in habitat quality was lower. The low habitat quality area increased by 620 km2, the high habitat quality area decreased by 108 km2, and the higher habitat quality increased by 8 km2. Meanwhile, the habitat improvement area is concentrated on the coast of Yishui Lake in the central part of Baoding where social capital is introduced to protect and comprehensively develop the lake, and a national water conservancy scenic spot will be established so that the habitat quality along the coast of Yishui Lake will continue to improve. The total value of ESV in this scenario is CNY 33 billion, an increase of CNY 207 million compared with the natural development.
Under the forest rehabilitation scenario, the area of low habitat quality area increased by 397 km2, and the area of high habitat quality area increased by 419 km2. The project of returning cultivated land to forest in Baoding involves 17 counties and 210,000 farmers. The entire area has a wide coverage and the mountainous area has also been protected in a large area. Therefore, the area of habitat quality improvement has increased significantly, and it is mostly concentrated on key areas such as both sides of traffic arteries, around towns, around lakes and reservoirs, and eco-tourism areas, initially forming the first ecological barrier of sandstorm invasions to the south. The ESV reached CNY 34 billion, an increase of CNY 859 million over 2020.
Under the cultivated land protection scenario, the low and very low habitat quality areas respectively decreased by 138 km2 and 173 km2, and the medium and high habitat quality areas increased by 147 km2 and 164 km2. Cultivated land protection is related to national food security. Baoding has carried out strict non-agricultural and non-grain supervision on permanent basic cultivated land. Thus, the amount of cultivated land is effectively guaranteed in this scenario, slowing down the expansion rate of construction land. However, the cultivated land use in the western mountainous and hilly areas of Baoding is greatly affected by natural conditions, and its own ecological environment is relatively fragile, which makes the middle habitat quality level area increase compared with other scenarios. The ESV of the cultivated land protection scenario was CNY 33 billion, and it increased by CNY 164 million compared with 2020.

3.3. Verification of Combination Scenario

The results of the four scenarios show that the habitat quality of the cultivated land protection scenario is the best and the ecosystem service value of the forest rehabilitation scenario is the highest, so combining the cultivated land protection and forest rehabilitation scenarios can balance urban economic development and ecological protection. In order to verify this conclusion, a combination scenario was established, which combined the cultivated land protection and forest rehabilitation scenarios as follows: the forestland cover reached 35%; the probability of transferring cultivated land to forestland appropriately increased; the existing forestland was used as the restricted conversion area; the probability of transferring cultivated land to grassland, water, and construction land was reduced; the permanent basic agricultural land was used as the restricted conversion area. The results are shown in Figure 7.
The combination scenario increased the area of forestland and water by 408 km² and 10 km², decreased the area of cultivated land by 246 km², and increased the area of construction land by 6 km². The low and medium habitat quality areas decreased by 153 km² and 193 km², respectively, and the high habitat quality area increased by 432 km², and this is the scenario with the highest decrease in low habitat quality and increase in high habitat quality area. The value of ecosystem services for this scenario is CNY 34.2 billion, an increase of CNY 886 million from 2020, which is higher than the other four scenarios. This is a land-use model that meets the goal of “high ecological quality-high ecological value”.
In order to explore the specific changes in land use, four scenic areas with a significant shift in habitat quality levels from low to high were selected. For example, a1 in Figure 7 is the Baishi Mountain Scenic Area. The area has been actively reforested in recent years. The forest plantation of Chinese herbs is used as an effective method for adjusting the structure of plantation and increasing farmers’ income. Therefore, b1 shows that the cultivated land in this scenic area is transformed into forestland. As a2 is the scenic area of Longmen Mountain, the area has been gradually greening and building up the surrounding forestable barren hills in recent years. Therefore, b2 shows that the forestland in this scenic area increased. For example, a3 is the Xibaipo scenic area (national 5A level scenic area). In recent years, driven by the scenic spot, the surrounding villages and towns actively carried out the construction of a beautiful countryside and strengthened the protection and construction of the forest around the village. Therefore, b3 shows the change from grassland to forestland at the edge of water bodies in this scenic area. For example, a4 is Xidayang Reservoir. The function of this reservoir has changed from flood control and water supply to water conservation reserve. Therefore, b4 shows the increase of forestland on the north side of the reservoir. Since the cultivated land in this area is a restricted conversion area, b4 shows the conversion from grassland to forestland.

4. Discussion

The research data of this paper are from the National Bureau of Statistics. It includes statistical monitoring data with a 10-year cycle, which is consistent with the national development process and the implementation cycle of relevant policies. Therefore, the research also takes a 10-year cycle to observe the dynamic changes of land use, habitat quality, and ESV. However, in future, if the real-time ecological assessment with shorter cycles can be supplemented, it will be more effective for supporting assessments. We hope to continue to explore this content in future work.
This paper provides model-driven research results, which are different from the very complex actual ecological and habitat changes and issues. However, via a comparative study, it can be observed that the changing trend with respect to urban land use, habitat quality, and ESV expressed by the model is consistent with the actual situation. In future, we hope that more accurate simulation results can be obtained by improving data accuracy and model simulation accuracy in order to guide urban development more specifically.

5. Conclusions and Recommendations

In this paper, the PLUS-InVEST model and ESV were used to simulate and analyze the evolution of land use and habitat quality in Baoding. The spatio-temporal change and driving mechanism have the following characteristics:
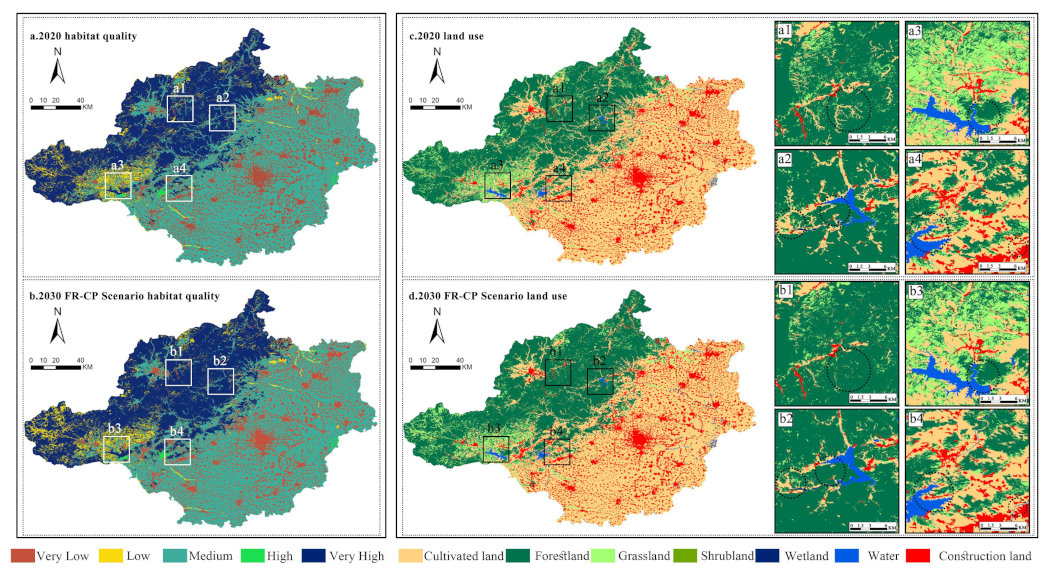
  • Cultivated land and forestland are the two types of land with the largest proportion in Baoding. The combination scenario verifies that the overall habitat quality and ESV of the city are optimal under the priority protection of cultivated land and forestland. In the future, cultivated land protection and forest rehabilitation scenarios should continue to be used as the main policies to guide urban development, strictly delineate the scope of cultivated land protection, and improve the forestland’s coverage to the optimum level.
  • Habitat quality in Baoding contrasts significantly between the forestland in the northwest and the cultivated and built-up land in the southeast. The existing ecological tourism area and reservoir within the forestland are important ecological barriers for protecting the city from infringement and should be protected with emphasis. The land-use situation in the cultivated land and construction land area is complex, and the efficiency of land resource use should be improved by strengthening rural land improvement and urban infrastructure construction.

Author Contributions

Conceptualization, N.H. and D.X.; methodology, N.H.; software, N.Z.; validation, D.X., N.H. and Y.L.; formal analysis, D.X.; investigation, N.H. and D.X.; resources, N.H.; data curation, D.X.; writing—original draft preparation, N.H.; writing—review and editing, S.F. and P.W.; visualization, N.Z.; supervision, Y.L.; project administration, N.H. All authors have read and agreed to the published version of the manuscript.

Funding

This research was funded by the Beijing Municipal Science and Technology Planning Project (No. D171100007117003).

Institutional Review Board Statement

Not applicable.

Informed Consent Statement

Not applicable.

Data Availability Statement

The data will be available upon request to the corresponding author.

Conflicts of Interest

The authors declare no conflict of interest.

References

  1. Pastor, A.V.; Tzoraki, O.; Bruno, D.; Kaletová, T.; Mendoza-Lera, C.; Alamanos, A.; Brummer, M.; Datry, T.; De Girolamo, A.M.; Jakubínský, J.; et al. Rethinking ecosystem service indicators for their application to intermittent rivers. Ecol. Indic. 2022, 137, 108693. [Google Scholar] [CrossRef]
  2. Awasthi, P.; Bargali, K.; Bargali, S.S.; Jhariya, M.K.J.L.D. Structure and functioning of Coriaria nepalensis dominated shrublands in degraded hills of Kumaun Himalaya. I. Dry matter dynamics. Land Degrad. Dev. 2022, 33, 1474–1494. [Google Scholar] [CrossRef]
  3. Moreno-Conn, L.M.; Rodriguez-Hernandez, N.S.; Arguello, J.O.; Baquero, J.E.; Bernal-Riobo, J.H.; Arango, M. Land use change and its effect on ecosystem services in an Oxisol of the eastern High Plains of meta department in Colombia. Front. Environ. Sci. 2022, 2113. [Google Scholar] [CrossRef]
  4. Feng, S.; Sun, R.H.; Chen, L.D. Spatio-temporal characteristics of habitat quality based on land-use changes in Guangdong Province. Acta Ecol. Sin. 2022, 42, 6997–7010. [Google Scholar] [CrossRef]
  5. Dongjie, G.; Zulun, Z.; Jing, T. Dynamic simulation of land use change based on logistic-CA-Markov and WLC-CA-Markov models: A case study in three gorges reservoir area of Chongqing, China. Environ. Sci. Pollut. Res. 2019, 26, 20669–20688. [Google Scholar]
  6. Abdurrahim, A.; Remzi, E. Future land use/land cover scenarios considering natural hazards using Dyna-CLUE in Uzungöl Nature Conservation Area (Trabzon-NE Türkiye). Nat. Hazards 2022, 114. [Google Scholar] [CrossRef]
  7. Shahidul, I.; Yuechen, L.; Mingguo, M.; Anxu, C.; Zhongxi, G. Simulation and Prediction of the Spatial Dynamics of Land Use Changes Modelling Through CLUE-S in the Southeastern Region of Bangladesh. J. Indian Soc. Remote Sens. 2021, 49, 2755–2777. [Google Scholar]
  8. Haiyan, H.; BingBing, Z.; Fengsong, P.; Guohua, H.; Zhongbo, S.; Yijian, Z.; Han, Z.; Yukun, G.; Meng, L.; Xia, L. Future Land Use/Land Cover Change Has Nontrivial and Potentially Dominant Impact on Global Gross Primary Productivity. Earth’s Future 2022, 10, e2021EF002628. [Google Scholar]
  9. Yingxue, L.; Zhaoshun, L.; Shujie, L.; Xiang, L. Multi-Scenario Simulation Analysis of Land Use and Carbon Storage Changes in Changchun City Based on FLUS and InVEST Model. Land 2022, 11, 647. [Google Scholar]
  10. Chaturvedi, V.; de Vries, W.T. Machine Learning Algorithms for Urban Land Use Planning: A Review. Urban Sci. 2021, 5, 68. [Google Scholar] [CrossRef]
  11. Liang, X.; Guan, Q.; Clarke, K.C.; Liu, S.; Wang, B.; Yao, Y. Understanding the drivers of sustainable land expansion using a patch-generating land use simulation (PLUS) model: A case study in Wuhan, China. Comput. Environ. Urban Syst. 2021, 85, 101569. [Google Scholar] [CrossRef]
  12. Tong, L.; Muzhuang, Y.; Dafang, W.; Feng, L.; Jinhai, Y.; Yingjia, W. Spatial correlation and prediction of land use carbon storage based on the InVEST-PLUS model- A case study in Guangdong Province. China Environ. Sci. 2022, 42, 4827–4839. [Google Scholar] [CrossRef]
  13. Zhiqiang, L.; Shuangyun, P. Comparison of multimodel simulations of land use and land cover change considering integrated constraints—A case study of the Fuxian Lake basin. Ecol. Indic. 2022, 142, 109254. [Google Scholar] [CrossRef]
  14. Jihwan, K.; Heejoon, C.; Wonhyeop, S.; Jiweon, Y.; Youngkeun, S. Complex spatiotemporal changes in land-use and ecosystem services in the Jeju Island UNESCO heritage and biosphere site (Republic of Korea). Environ. Conserv. 2022, 49, 272–279. [Google Scholar]
  15. Katherine, H.P.; Patricio, P.; Mauricio, F. Sixty years of land-use and land-cover change dynamics in a global biodiversity hotspot under threat from global change. J. Land Use Sci. 2021, 16, 467–478. [Google Scholar]
  16. Eggleton, P.; Vanbergen, A.J.; Jones, D.T.; Lambert, M.C.; Rockett, C.; Hammond, P.M.; Beccaloni, J.; Marriott, D.; Ross, E.; Giusti, A. Assemblages of Soil Macrofauna across a Scottish Land-Use Intensification Gradient: Influences of Habitat Quality, Heterogeneity and Area. J. Appl. Ecol. 2005, 42, 1153–1164. [Google Scholar] [CrossRef]
  17. Masteel; Ling, P.; Zenghui, M. Ecosystem Service Evaluation Model and Empirical Research. Anhui Agric. Bull. 2021, 27, 141–143. [Google Scholar] [CrossRef]
  18. Hongjuan, Z.; Yan, G.; Yawei, H.; Yanyan, L.; Yue, Z.; Kang, L. Response of a SolVES model value transfer method to different spatial scales. Acta Ecol. Sin. 2019, 39, 9233–9245. [Google Scholar] [CrossRef]
  19. Salata, S.; Garnero, G.; Barbieri, C.A.; Giaimo, C. The Integration of Ecosystem Services in Planning: An Evaluation of the Nutrient Retention Model Using InVEST Software. Land 2017, 6, 48. [Google Scholar] [CrossRef] [Green Version]
  20. Rakesh, K.; Chandrakant, G.; Ankush, R.; Asheesh, S.; Chandrasekhar, M.; Rajesh, B. Quantification of heat mitigation by urban green spaces using InVEST model—A scenario analysis of Nagpur City, India. Arab. J. Geosci. 2021, 14, 82. [Google Scholar] [CrossRef]
  21. Costanza, R.; d’Arge, R.; de Groot, R.; Farber, S.; Grasso, M.; Hannon, B.; Limburg, K.; Naeem, S.; O’Neill, R.V.; Paruelo, J.; et al. The value of the world’s ecosystem services and natural capital. Ecol. Econ. 1998, 25, 3–15. [Google Scholar] [CrossRef]
  22. Gaodi, X.; Caixia, Z.; Leiming, Z.; Wenhui, C.; Shimei, L. Improvement of the Evaluation Method for Ecosystem Service Value Based on Per Unit Area. J. Nat. Resour. 2015, 30, 1243–1254. [Google Scholar] [CrossRef]
  23. Gaodi, X.; Chunxia, L.; Method, C.P.; Du, Z.; Shuangcheng, L. Value evaluation of ecological assets in qinghai-tibet plateau. J. Nat. Resour. 2003, 18, 189–196. [Google Scholar]
  24. Alves, F.; Roebeling, P.; Pinto, P.; Batista, P. Valuing ecosystem service losses from coastal erosion using a benefits transfer approach: A case study for the Central Portuguese coast. J. Coast. Res. 2009, 56, 1169–1173. [Google Scholar]
  25. Ning, W.; Guang, Y.; Xueying, H.; Guangpu, J.; Feng, L.; Tao, L.; Jianing. Land Use Change and Ecosystem Service Value in Inner Mongolia from 1990 to 2018. J. Soil Water Conserv. 2020, 34, 244–250. [Google Scholar] [CrossRef]
  26. Ren, Y.; Ruitong, L. Rural Comprehensive Land Consolidation and Territorial Ecological Restoration:Cohesion and Integration. Mod. City Res. 2021, 3, 23–32. [Google Scholar] [CrossRef]
  27. Jie, J. Spatio-temporal Differentiation of Ecosystem Service Value in Dianchi Basin and Its Influencing Factors Based on land Use. J. Soil Water Conserv. 2022, 29, 344–351. [Google Scholar] [CrossRef]
  28. Zhaoxu, L. Study on the Conservation Planning of Historic and Cultural Cities under the Concept of “Double Urban Repairs”. Master’s Thesis, Hebei Agricultural University, Baoding, China, 2019. [Google Scholar]
  29. Baoding Statistics Bureau. Baoding Statistical Yearbook; Baoding Statistics Bureau: Baoding, China, 2020; p. 59. [CrossRef]
  30. National Development and Reform Commission. Compilation of National Agricultural Product Cost Income Data; China Statistics Press: Beijing, China, 2020; p. 625.
  31. Liu, T.; Chen, X. Application of deep learning in globeland30-2010 product refinement. Int. Arch. Photogramm. Remote Sens. Spat. Inf. Sci. 2018, 42. [Google Scholar] [CrossRef] [Green Version]
  32. Xinliang, X. Kilometre grid dataset of China’s population spatial distribution. Resour. Environ. Sci. Data Regist. Publ. Syst. 2017. [Google Scholar] [CrossRef]
  33. Liu, X.; Liang, X.; Li, X.; Xu, X.; Ou, J.; Chen, Y.; Li, S.; Wang, S.; Pei, F. A future land use simulation model (FLUS) for simulating multiple land use scenarios by coupling human and natural effects. Landsc. Urban Plan. 2017, 168, 94–116. [Google Scholar] [CrossRef]
  34. Feng, H.; Yan, Z.; Yu, G.; Panpan, Z.; Shuai, L.; Changchun, Z. Spatial and temporal changes in land use and habitat quality in the Weihe River Basinbased on the PLUS and InVEST models and predictions. Geogr. Arid. Area 2022, 45, 1125–1136. [Google Scholar]
  35. Rui, Z.; Xuemin, L. A Study on the Spatial and Temporal Pattern Evolution of “Three Generations” in Beijing Tianjin Hebei Metropolitan Circle and Its Driving Forces. Ecol. Econ. 2021, 37, 201–208. [Google Scholar]
  36. Shandong, N.; Xiao, L.; Guozheng, G. What Is the Operation Logic of Cultivated Land Protection Policies in China? A Grounded Theory Analysis. Sustainability 2022, 14, 8887. [Google Scholar]
  37. The People’s Government of Hebei Province. Regulations of Hebei Province on Wetland Protection. Hebei For. 2016, 6–9. [Google Scholar]
  38. Zhengyan, L.; Xianqiang, M. Research on the Key Directions and Tasks of Ecological Environment Protection during the Fourteenth Five Year Plan Period. China Environ. Manag. 2019, 11, 40–45. [Google Scholar] [CrossRef]
  39. Tianni, Z.; Tongwen, J. Baoding Re energizes Standard Xiong An Chuangshen. Hebei For. 2018, 26–27. [Google Scholar]
  40. Qi, W. In 20 years, 500 million mu of farmland has been returned to forests and grasslands nationwide. Land Green. 2019, 5–6. [Google Scholar]
  41. Xiaoyan, Y.; Yinjun, C. Analysis on the influencing factors of farmers’ conversion to cultivated land and their “non grain” planting behavior and scale—Based on the survey data of farmers in Zhejiang and Hebei provinces. Rural. Obs. China 2010, 2–10+21. [Google Scholar]
  42. Luijten, J.C. A systematic method for generating land use patterns using stochastic rules and basic landscape characteristics: Results for a Colombian hillside watershed. Agric. Ecosyst. Environ. 2003, 95, 427–441. [Google Scholar] [CrossRef]
  43. Yifan, G.; Jianghui, D.; Aomeng, L. Spatio-temporal difference of coupling coordinative degree of productive ecological carrying capacity and ecological function in Baoding, Hebei Province. Acta Ecol. Sin. 2020, 40, 7175–7186. [Google Scholar]
  44. Xuesong, Z.; Wei, R.; Hongjie, P. Urban land use change simulation and spatial responses of ecosystem service value under multiple scenarios: A case study of Wuhan, China. Ecol. Indic. 2022, 144, 109526. [Google Scholar]
  45. Jingheng, W.; Yecui, H.; Rong, S.; Wei, W. Research on the Optimal Allocation of Ecological Land from the Perspective of Human Needs—Taking Hechi City, Guangxi as an Example. Int. J. Environ. Res. Public Health 2022, 19, 12418. [Google Scholar]
  46. Mengdi, Z.; Fen, Z.; Xiong, L. Evaluation of Habitat Quality Based on InVEST Model: A Case Study of Tongzhou District of Bejjing, China. Landsc. Archit. 2020, 27, 95–99. [Google Scholar] [CrossRef]
Figure 1. Research Framework.
Sustainability 15 00557 g001
Figure 2. Location of the study area.
Sustainability 15 00557 g002
Figure 3. Spatial distribution of land-use from 2000 to 2020.
Sustainability 15 00557 g003
Figure 4. Spatial distribution of land-use change under different scenarios in 2030.
Sustainability 15 00557 g004
Figure 5. Spatial distribution of habitat quality from 2000 to 2020.
Sustainability 15 00557 g005
Figure 6. Spatial distribution of habitat quality change under different scenarios in 2030.
Sustainability 15 00557 g006
Figure 7. Spatial distribution of habitat quality and land-use in 2020 and 2030 under combination scenario.
Sustainability 15 00557 g007
Table 1. Land-use change factors.
Influencing FactorsDriving FactorsData Source
Natural environmentalElevationComputer Network Information Center of the Chinese Academy of Sciences
(http://www.gscloud.cn, accessed on 10 September 2022)
Slope
Average annual precipitationNational Science and Technology Infrastructure Platform-National Earth System Science Data Centre–Loess Plateau Sub-centre (http://loess.geodata.cn, accessed on 12 September 2022)
Average annual temperature
Distance to waterNational Geographic Information Resources Catalogue Service (www.webmap.cn, accessed on 8 September 2022)
Social economyGDPResource and Environment Science Data Registration and Publication System (https://www.resdc.cn, accessed on 9 September 2022)
Population
Traffic accessibilityDistance to railwayNational Geographic Information Resources Catalogue Service (www.webmap.cn, accessed on 8 September 2022)
Distance to high speed
Distance to the road
Table 2. Neighborhood weights parameters.
Type of
Land-Use
Neighborhood WeightsType of
Land-Use
Neighborhood Weights
Cultivated land1.00Forestland0.69
Grassland0.11Shrubland0.00
Wetland0.00Water0.01
Construction land0.24
Table 3. Sensitivity parameters of different land types to habitat threat factors.
Type of Land-UseHabitat
Suitability
Threats Factors
Cultivated
Land
Construction
Land
RailwaysRoads
Cultivated land0.50.30.90.70.7
Forestland10.80.90.80.7
Grassland0.40.30.30.550.55
Shrubland10.50.70.350.35
Wetland0.70.70.80.40.4
Water0.90.80.850.70.65
Construction land00000
Table 4. Threat factor parameters.
Threats FactorsMaximum Duress Distance/kmWeight
Cultivated land30.5
Construction land50.8
Railways51
Roads30.6
Table 5. ESVs per unit area of the ecosystem (CNY/hm2).
Types of Ecosystem ServicesCultivated
Land
Forest
Land
Grass
Land
Water
Food production1332.60395.86365.811026.89
Supply
Services
Raw material production627.11909.31538.27572.24
Water supply31.36470.33297.888528.65
Gas regulation1050.402990.521891.772092.97
Mediation
Services
Climate regulation564.408948.035001.184617.08
Purifying the environment156.782622.091651.387172.54
Hydrological regulation423.305855.613663.3599,137.77
Soil conservation1614.803641.142304.622539.78
Support
Services
Maintaining nutrient circulation188.13278.28177.68195.97
Biodiversity203.813315.832704.408168.07
Cultural
Services
Aesthetic Landscape94.071454.10877.955189.31
Table 6. Proportion of land-use types in Baoding from 2000 to 2020 (%).
YearType of Land-Use
Cultivated
Land
Forest
Land
Grass
Land
Shrub
Land
Wet
Land
WaterConstruction Land
200049.9633.855.370.010.030.4610.32
201050.1833.935.180.010.030.4410.24
202046.7733.165.560.020.030.4913.97
Table 7. Proportion (%) and decadal change (km²) of land-use types in Baoding under different scenarios in 2030.
Type of
Land-Use
Natural
Development
Water
Protection
Forest
Rehabilitation
Cultivated Land
Protection
Proportion Decadal ChangeProportionDecadal ChangeProportion Decadal ChangeProportion Decadal Change
Cultivated land44.33−540.5444.33−540.5442.99−837.9146.770.00
Forestland32.58−129.7132.62−120.7835.00407.8233.87156.46
Grassland5.6928.645.6928.645.6928.644.82−164.25
Shrubland0.02−0.030.02−0.120.02−1.210.02−0.12
Wetland0.01−3.600.031.660.02−2.470.030.00
Water0.515.690.5513.320.527.820.490.11
Construction land16.86639.5516.76617.8315.76397.3114.017.80
Table 8. Proportion of each habitat quality category in Baoding from 2000 to 2020 (%).
YearHabitat Quality Rating
Very LowLowMediumHighVery High
200010.325.3649.970.3134.03
201010.254.6850.710.3334.04
202013.975.5946.770.3433.32
Table 9. Proportion (%) and decadal change (km²) of habitat quality in Baoding under different scenarios in 2030.
Type of
Land-Use
Natural
Development
Water
Protection
Forest
Rehabilitation
Cultivated Land
Protection
Proportion Decadal ChangeProportionDecadal ChangeProportion Decadal ChangeProportion Decadal Change
Very low16.84636.0216.77619.5515.76397.3713.35−137.85
Low5.6820.125.6820.565.6719.104.81−173.46
Medium44.34−539.3344.34−539.7643.01−835.6647.44147.63
High0.387.060.388.040.350.160.340.10
Very high32.76−123.8732.83−108.3935.21419.0334.06163.58
Table 10. ESV in Baoding under different scenarios in 2030 (CNY billion).
Type of Land-Use20202030 Scenario Simulation
Natural
Development
Water
Protection
Forest
Rehabilitation
Cultivated Land
Protection
Cultivated land6.526.186.186.006.52
Forestland and shrubland22.7422.3422.3724.0023.22
Grassland2.402.462.462.462.08
Water and wetland1.591.621.801.661.59
Total33.2532.6032.8034.1133.42
Disclaimer/Publisher’s Note: The statements, opinions and data contained in all publications are solely those of the individual author(s) and contributor(s) and not of MDPI and/or the editor(s). MDPI and/or the editor(s) disclaim responsibility for any injury to people or property resulting from any ideas, methods, instructions or products referred to in the content.

