Article

Experimental Study on Mechanical Properties and Failure Mechanism of Damaged Sandstone

1
National Energy Group, Beijing Low-Carbon Clean Energy Research Institute, State Key Laboratory of Coal Mining Water Resources Protection and Utilization, Beijing 100011, China
2
Shenhua Energy Company Limited, Beijing 100011, China
3
National Energy Investment Group Co., Beijing 100011, China
4
College of Energy and Mining Engineering, Shandong University of Science and Technology, Qingdao 266590, China
5
Shendong Coal Group Co., Ltd., Shenmu 719315, China
*
Authors to whom correspondence should be addressed.
Sustainability 2023, 15(1), 555; https://doi.org/10.3390/su15010555
Submission received: 14 November 2022 / Revised: 10 December 2022 / Accepted: 16 December 2022 / Published: 28 December 2022
(This article belongs to the Special Issue Coal and Rock Dynamic Disaster Monitor and Prevention)

Abstract

:
Solid materials such as rocks can contain primary defects, and internal defects are activated in the event of mining disturbance, which causes rock damage and destruction. Therefore, it is of great significance for rock engineering to study the mechanical properties and failure mechanism of damaged rock. In this study, damaged prefabricated crack sandstone specimens were prepared with the cyclic loading-unloading test, and the uniaxial loading test was carried out with damaged specimens. The evolution law of peak strength, elastic modulus, and peak strain of specimens with different damage degrees was studied, the quantitative relationship between the P-wave velocity and the damage degree was obtained, and the acoustic emission (AE) count and energy evolution characteristics of specimens with different damage degrees were analyzed. The energy evolution law of damaged specimens was revealed, and with the increase in damage degree, the elastic energy stored in the specimens can be converted into crack propagation more quickly, and the dissipated energy density increases rapidly, resulting in complete rock failure. The research results can provide theoretical support for the stability analysis and control of underground engineering rock mass in the event of multiple disturbances.

1. Introduction

Typically, Chinese coal resources are distributed abundantly in the west, north, and south and scarce in the east. However, with the gradual depletion of coal resources in Eastern China, the focus of coal mining has shifted toward western mining areas [1,2,3]. The western coal mining area of China, represented by Eerduosi, Yulin, houses shallow buried coal seam resources and presents geological characteristics such as simple mining structures. Therefore, high-intensity mining has become the primary focus in western coal mining areas; however, such mining is expected to inevitably damage the surrounding rock mass. The term “damage” is generally used to describe the macro damage caused before the onset of microcracks in rocks. The process of formation, expansion, coalescence, and final development of microcracks is collectively referred to as damage evolution [4,5]. Affected by mining disturbances, damaged rock mass is in a failure state until it loses its bearing capacities, which seriously threatens the safety of coal resource production and the surface ecological environment [6,7,8]. Therefore, it is of great significance to study the failure mechanism of damaged rock for the stability control of underground rock mass engineering.
To that end, scholars have conducted numerous studies on rock damage mechanics behavior using constitutive models of rock damage. The influences of confining pressure, weathering erosion, and dynamic load disturbance on rock mechanical properties were studied [9,10,11]. Moreover, the damage occurring due to rock deformation, strain softening, and impact bias characteristics [12,13,14] has been analyzed, and a preliminary understanding of the mechanical properties of damaged rock has been established. Furthermore, scholars have assessed plastic deformation and energy density based on the rock damage evolution process according to the elastic moduli obtained from stress-strain curves [15,16,17]. However, owing to the nonlinear characteristics of native defects, the elastic moduli of tested rock specimens exhibit a rising trend during the initial loading phase, and rock specimens subjected to varying loading stages exhibit different plastic deformation mechanisms. Notably, plastic deformation can be characterized as the external manifestation of specimen damage; however, it cannot accurately describe the rock damage process [18]. Moreover, the deformation of specimens is typically driven by the total energy. Hence, researchers have studied the relationship between the dissipated energy and input energy, the energy proportion at different loading stages. Several researchers have hypothesized that characterizing the rock damage evolution process from the perspective of energy, which is more consistent with the characteristics of rock instability and failure, is more universal [19,20].
Rock mass generally contains joints and cracks of varying degrees, and these structures open, close, expand, and penetrate, eventually forming macroscopic cracks and leading to rock mass failure. Therefore, the investigation of the mechanical properties of cracked rock mass has emerged as an important research field [21,22]. The earliest study on cracked rock mass can be traced back to 1968 when Bombolakis carried out uniaxial compression testing with specimens containing a single crack [23]. Later, to gain deeper insights into the influence of cracks on the rock strength, deformation, and failure mode, scholars conducted systematic studies on the influence of factors such as the spatial distribution, geometric parameters, and number of prefabricated cracks on the mechanical properties of rocks [24,25,26]. Typically, in engineering applications, a rock mass is subjected to multi-directional stresses. Certain scholars have also studied the influence of the lateral pressure coefficient and confining pressure on the mechanical behavior and crack growth mode of prefabricated crack specimens [27]. Furthermore, some scholars have monitored the failure process of cracked rock via acoustic emission (AE), electromagnetic radiation, infrared imaging, digital speckle, and ultrasonic non-destructive testing [28,29]. Ma et al. [30] used infrared radiation characteristics to predict the expansion point of sandstone with different levels of water content and proposed a machine learning method.
Notably, cracked rock mass is generally subjected to repeated loading–unloading tests during construction processes, particularly the roadways near fields surrounding rocks or roofs, which usually incur damage in the event of repeated excavation disturbances [31]. Therefore, evaluating the mechanical damage characteristics and failure mechanisms of cracked rocks is of considerable theoretical significance and engineering value. To correctly comprehend the damage and failure mechanisms of rock mass and scientifically assess their long-term stability, researchers have conducted numerous studies on the energy dissipation law and crack evolution characteristics of rock specimens subjected to cyclic loading. The variation law and mutual relationship between various forms of energy and damage variables during rock loading, the energy evolution, and the distribution characteristics, as well as the influence of stress paths on energy evolution, have already been discussed [32,33]. Khan, N. M. et al. [34] developed a new bursting liability index based on energy evolution for coal with different loading rates. However, few studies have focused on the mechanical damage behavior and energy evolution of cracked rocks.
Thus, this study focused on the characterization of rock damage variables. Damaged prefabricated crack sandstone specimens were prepared via cyclic loading–unloading tests, based on which an experimental study on the mechanical secondary loading properties was conducted. Consequently, the influence of the damage degree on basic mechanical properties, P-wave velocity, and AE evolution of the damaged prefabricated crack sandstone specimens was analyzed. This paper discusses the influence of damage degrees on the failure mechanisms of rock, providing a theoretical basis for the stability analysis of underground rock mass and control applications in underground engineering activities subjected to extensive mining actions or disturbances.

2. Specimen Preparation and Test Scheme

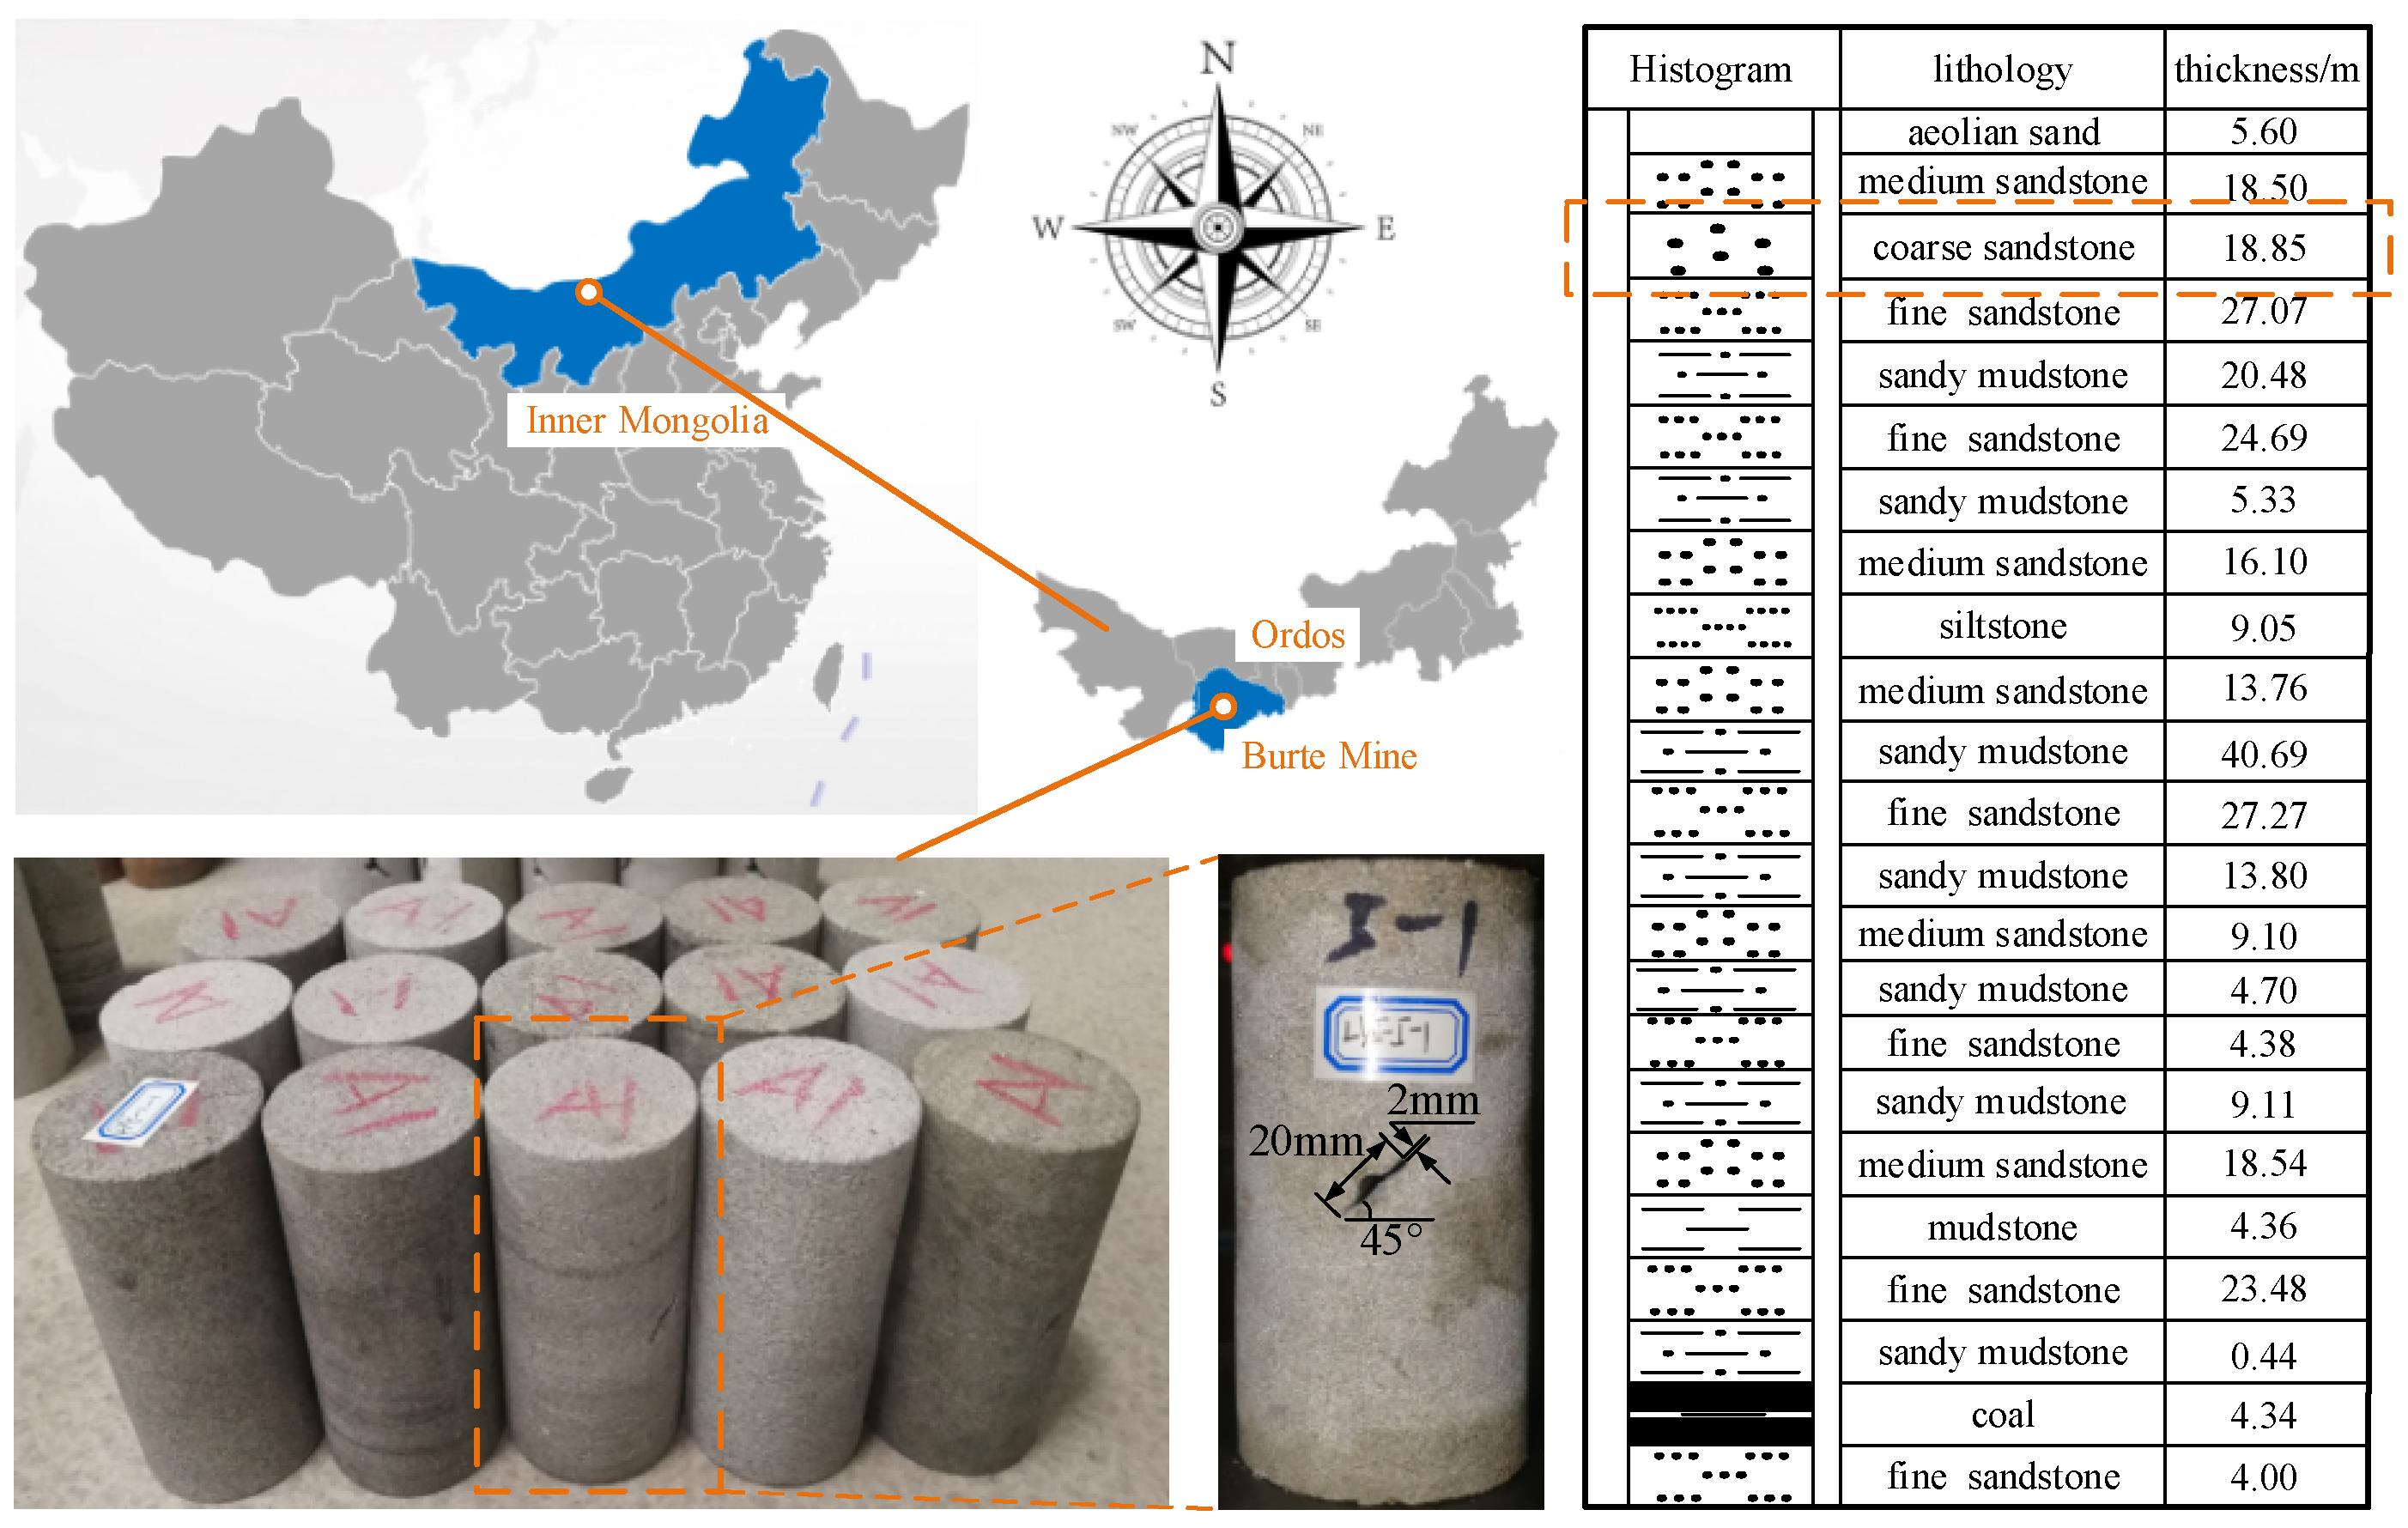
2.1. Preparation of Prefabricated Crack Specimens

Figure 1 presents prefabricated crack specimens. To fabricate specimens, a stone specimen was procured from the kern stone roof of the Buertai coal mine in the Shendong mining area. The specimen was carved into a standard cylindrical specimen with dimensions of ϕ50 × 100 mm in accordance with international rock mechanics standards. Thereafter, the linear cutting technology was used to grind prefabricated cracks with the same size and angle, with lengths and widths of 10 and 1 mm, respectively. A previous study [30] indicated that compared with preformed cracks aligned at other angles, the peak strength was the lowest when the angle of the prefabricated crack was 45°. Thus, to clarify the damage effect of loading–unloading on rocks with prefabricated cracks, we set the prefabricated crack angle to 45°. Table 1 lists the basic mechanical parameters of kern stone.

2.2. Preparation of Damaged Specimens and Test System

The rock failure process is often accompanied by energy dissipation. Thus, analyzing the energy conversion and transmission characteristics during rock deformation and failure from the perspective of energy dissipation can completely reveal the rock failure mechanisms, which have been commonly investigated by scholars. Notably, a rock mass element deforms under external forces. According to the first law of thermodynamics, assuming that no heat exchange occurs between the specimen and external environment during the physical process, the total input energy generated by the external work force is equal to U.
U = U d + U e
where Ud denotes the dissipated energy of specimens, which influences the internal damage incurred and plastic deformation of the rock element, and Ue denotes the elastic energy released of specimens.
As depicted in Figure 2, the elastic energy and dissipated energy can be determined from stress-strain curves during the loading-unloading test. The total area under the loading curve corresponds to the total input energy ui stored of specimens in the ith cycle, and the total area under the unloading curve represents the elastic energy uie in the ith cycle. The difference between the two denotes the dissipated energy uid, which can be calculated as follows:
u i = ε 0 ε i σ d ε
u i e = ε i e ε i σ d ε  
u i d = u i u i e  
To quantitatively describe the damage evolution related to rock deformation and failure, specimen strength degradation based on the damage variable must be defined. Notably, internal rock damage can be attributed to energy dissipation; accordingly, damage accumulation can be classified as an irreversible energy dissipation process. Therefore, the damage variable can be defined according to the dissipated energy as stated in Equation (5) [31].
D = i = 1 N i u i d / i = 1 N u i d
where uid denotes the dissipated energy in the ith cycle, Ni denotes the ith cycle, and N denotes the total number of cycles.
Figure 3 shows the testing system. The loading system used an RLJW-2000 servo rock testing machine to load the specimens, and using displacement control, and it applied the following load pattern 0 → 3 → 0.3 → 6 → 0.3 → 9 → 0.3 kN... step by step with loading–unloading rates of 0.25 mm/min. A displacement sensor was used to monitor axial deformations of the specimen. The P-wave velocity was obtained using an HKN-B ultrasonic automatic test system. The AMSY-6 AE system was used to monitor crack development, and an AE probe (VS45-H) was pasted on both sides of specimens using a resin-coupling agent. The preamplifier gain value was set to 38 dB, signal excitation threshold value was set to 40 dB, and instrument monitoring frequency was set to 10 MHz. The test process was divided into 3 steps. Firstly, the initial P-wave velocity of specimens was measured using an ultrasonic automatic vertical and horizontal wave tester. Subsequently, specimens with different damage degrees were fabricated via cyclic loading-unloading tests, and the P-wave velocities of damaged specimens were measured again. Finally, the damaged specimens were loaded until failure to test their basic mechanical properties.
Based on the above, the input energy, elastic energy, and dissipated energy during the loading-unloading test of prefabricated crack specimens were determined. The cumulative dissipated energy proportion during cyclic loading-unloading was estimated according to Equation (5); accordingly, the damage degree of specimens was estimated. The corresponding results are presented in Table 2.
Figure 4 depicts the evolution law of damage degree and cumulative dissipated energy of prefabricated crack specimens. As illustrated, the damage degree and cumulative dissipated energy of specimens demonstrate a nonlinear growth trend with the increase in the number of cycles. This trend can be fitted using the following exponential function: y = 0.26 × exp( x/ 10.51) 0.29. The corresponding correlation coefficient is 0.999, indicating that the more cycles the specimens are subjected to, the greater the damage degree. After obtaining the relationship between the damage degree and number of cycles of specimens, certain damaged specimens were fabricated via cyclic loading-unloading tests at different times. The specimen numbers and damage degrees are listed in Table 3.

3. Analysis of the Test Results

3.1. Strength and Deformation Characteristics

Figure 5 presents the stress–strain curves of prefabricated crack specimens during the cyclic loading–unloading process. The damage degree was divided into nine grades. Figure 5a illustrates that specimen R-3 underwent four cycles, and its damage degree was 7.70%. Figure 5b indicates that specimen R-5 underwent eight cycles, and its damage degree was 25.18%.
Figure 6 depicts the stress–strain curves of damaged specimens. Compared with the undamaged specimens (D = 0%), the stress–strain curves of damaged specimens did not change significantly and exhibited similar morphological characteristics; these curves could be divided into four stages, namely microcrack compaction, elasticity deformation, plasticity deformation, and post-peak stages. After approaching the peak stress, the curves quickly dropped to 0, exhibiting evident brittle failure characteristics. In addition, the mechanical properties of damaged specimens were different, and their peak strength, elastic modulus, and peak strain exhibited certain changes.
Figure 7 presents the peak strength evolution law of damaged specimens. The peak strength of the sandstone specimen without prefabricated cracks was 28.42 MPa. The peak strength decreased linearly with the increase in damage degree; accordingly, the correlation coefficient of the fitting curve was 0.92. When the damage degree was 0, the peak strength of specimen was 27.82 MPa. When the damage degree was 2.75%, the peak strength of specimen was 28.45 MPa. Notably, this is because when the number of cycles is low, the primary pores and cracks inside specimens undergo compression, which makes the overall structure more compact, causing a slight increase in peak strength. When the damage degree was 25.18%, the peak strength of was 25.72 MPa. In addition, when the damage degree of specimens increased from 0 to 91.47%, the peak strength decreased from 28.45 to 23.62 MPa, which was roughly distributed between the peak strength of R-1 and R-9.
Figure 8 presents the elastic modulus evolution law of damaged specimens. The elasticity modulus of the sandstone specimen without prefabricated cracks was 3.12 GPa. The elastic modulus of damaged specimens decreased linearly with the increase in damage degree, and the correlation coefficient of the fitting curve was 0.93. When the damage degree was 11.43%, the elastic modulus was 3.02 GPa, which is 0.03 GPa lower than that of R-1. When the damage degree increased to 7.07%, the elastic modulus decreased significantly. Finally, when the damage degree was 89.40%, the elastic modulus was 2.187 GPa, which was 42.66% lower than that of R-1. This also indicates that when the number of cycles was low, the specimen could be compressed and strengthened; however, when the number of cycles was high, the mechanical properties of the damaged specimen began to deteriorate significantly.
Figure 9 illustrates the peak strain evolution law of damaged specimens. The peak strain of the sandstone specimen without prefabricated cracks was 2.1%. The peak strain of damaged specimens exhibited a nonlinear increasing trend with the increase in damage degree, and the correlation coefficient of the fitted exponential function was 0.65. When the damage degree increased from 0 to 89.40%, the peak strain increased from 0.0172 to 0.021%, and the peak strain of damaged specimens was higher than that of R-1. Of course, this result may also be due to the experimental accuracy; theoretically, the higher the damage degree, the denser the microcracks formed in the rock, and the more attenuated the deformation resistance of specimens. Therefore, the increase in damage degree inevitably leads to the increase in specimen deformation.

3.2. Wave Velocity Evolution Law

Figure 10 illustrates the P-wave velocity evolution law of damaged specimens. Previous studies have proven that the P-wave velocity has a certain correlation with the specimen physical and mechanical properties; moreover, the P-wave velocity evolution process can reflect the changes occurring in the internal structures of rock specimens to a certain extent [32]. In the test, the initial P-wave velocity of specimens was 1298.64–1518.91 m/s, with an average of 1370.80 m/s. After the cyclic loading–unloading test, the P-wave velocity of the damaged specimen decreased linearly. The equation for the fitting curve is y = 1264.61 − 3.45x, with a correlation coefficient of 0.95. The results indicate that the damage degree of rock can be evaluated by comparing the P-wave velocity before and after damage initiation.

3.3. AE Evolution Law

The phenomenon of releasing strain energy in the form of elastic waves in the process of rock deformation is called acoustic emission (AE) [27]. As an associated phenomenon of rock failure, rock AE contains a large amount of information about the rock failure process [28]. Figure 11 shows the AE evolution law of the damaged specimens under secondary loading conditions. During the compaction stage of the stress-time curve, the AE count fluctuated slightly, and the cumulative count curve increased slightly; in the elastic deformation stage, the AE count hardly fluctuated, and the AE count curve developed gently; in the plastic yield stage, the AE count fluctuated obviously, and the cumulative count curve rose rapidly and increased abruptly; in the post-peak failure phase, the AE count returned to calm.
In addition, the damage has a certain effect on the AE evolution of damaged specimens. When the damage degree of specimens is small, in the elastic deformation stage of the stress-time curve, AE hardly appears. However, with the increase in damage degree, the AE count fluctuates frequently in the elastic deformation stage of the stress–time curve. This indicates that when the damage degree of the specimens is small, the crack compaction stage and elastic deformation stage is still experienced during the secondary loading process, resulting in a longer duration. With the increase in damage degree, a large number of cracks develop inside the specimens, leading to the continuous fluctuation of AE count during the loading process.
Figure 12 shows the AE energy evolution law of the damaged specimens. The AE energy of the damaged specimens increases first slowly and then rapidly with the increase in stress. However, AE energy evolution characteristics of specimens with different damage degrees are different. When the damage degree of the specimen is 0%, the AE energy increases slowly in the crack compaction and elastic deformation stage of the stress–time curve, presents a cascade increasing trend in the yield stage, and surges at the peak stress point. When the damage degree of the specimen is 51.29%, AE energy increases slowly at the crack compaction and elastic deformation stage of the stress-time curve, fluctuates slightly at the plastic yield, and surges at the peak stress point. When the damage degree of the specimen is 100%, the AE energy evolution law is similar. The AE energy of the damaged specimens decreases with the increase in the damage degree.

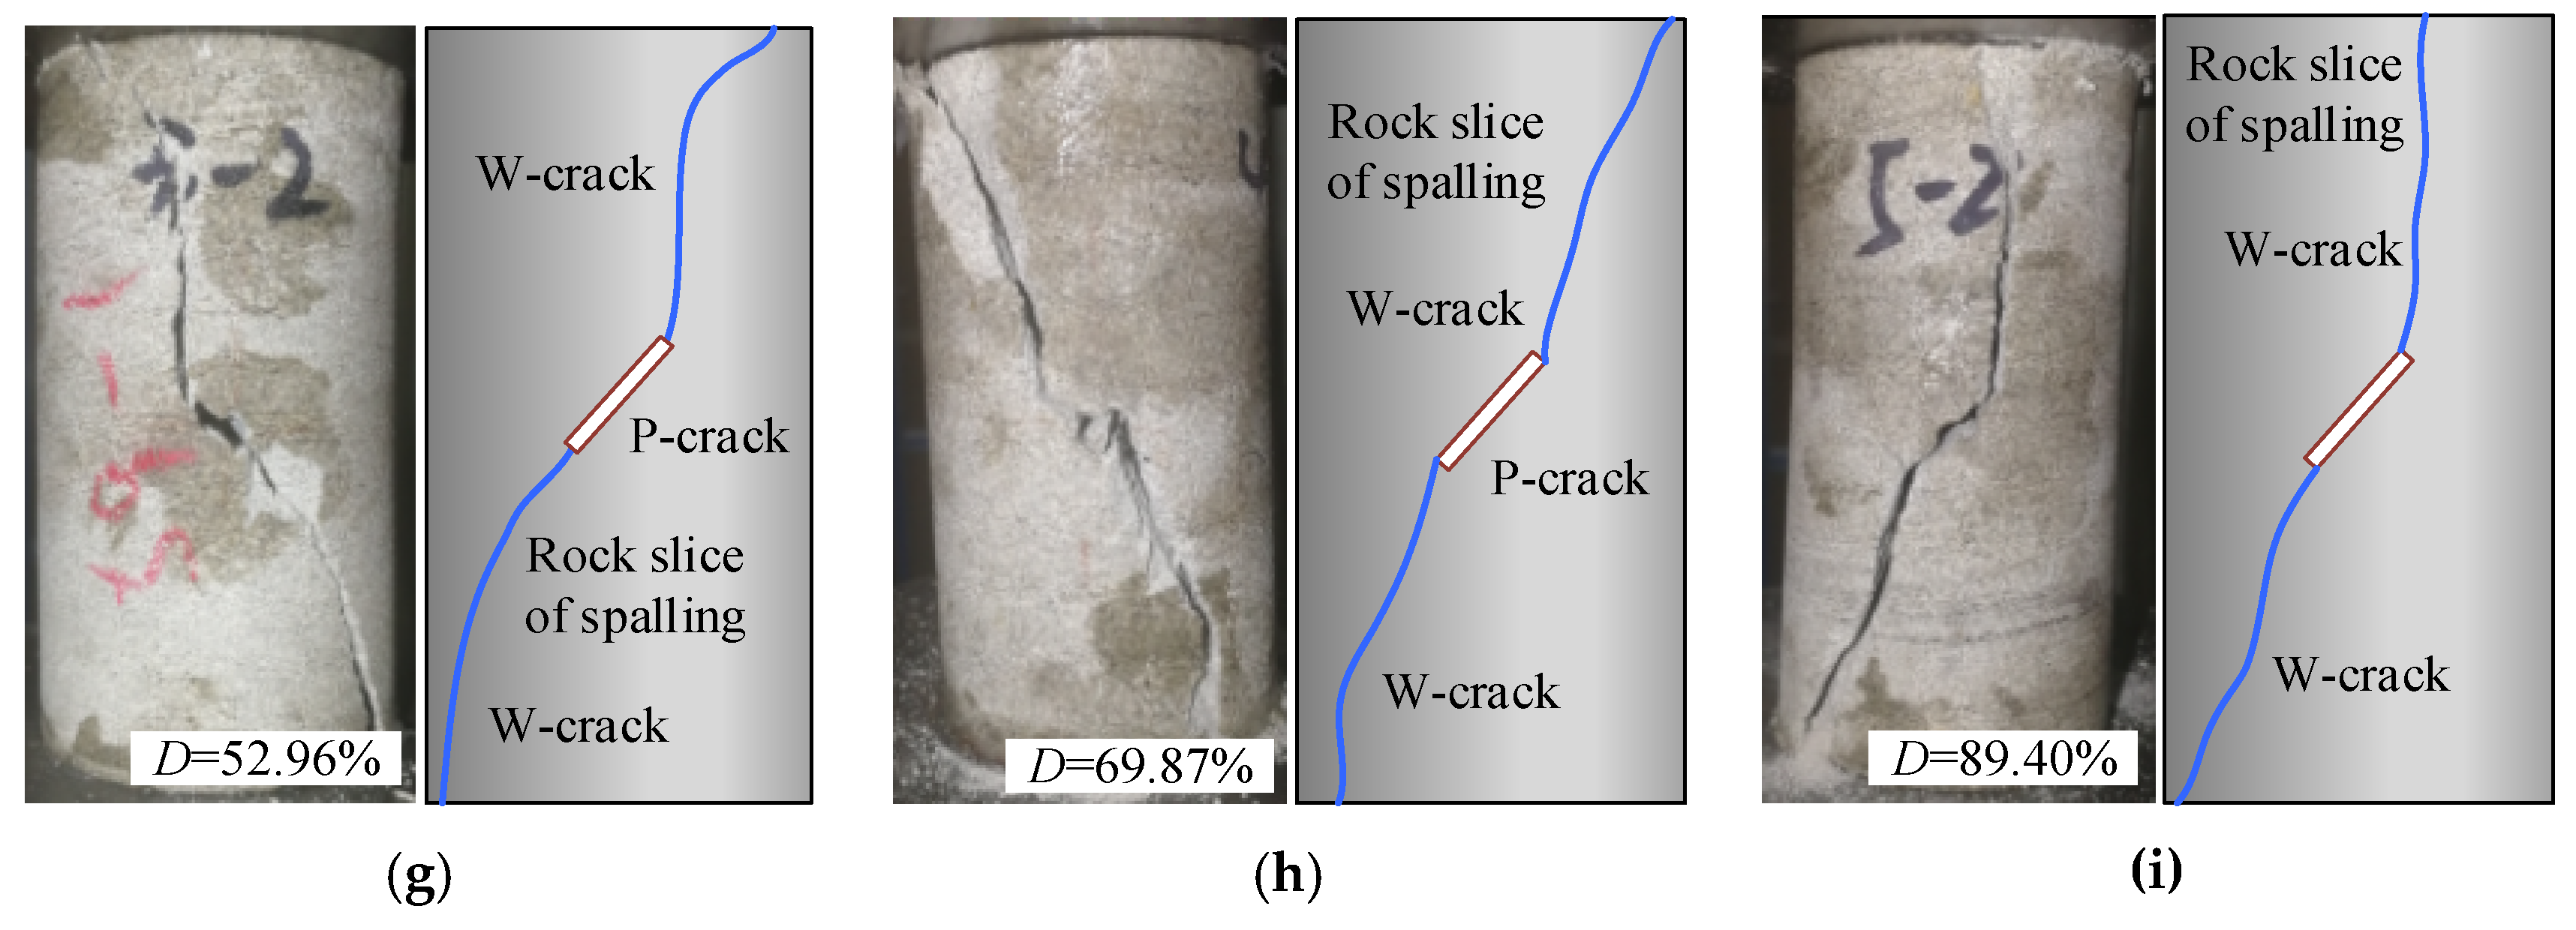
3.4. Failure Characteristics

Figure 13 presents different types of rock cracks. Notably, the failure patterns of rock specimens often depend on the type of generated cracks. Generally, under uniaxial loading conditions, rocks with prefabricated cracks exhibit four primary crack types: wing crack, anti-wing crack, coplanar secondary crack, and non-coplanar secondary crack [21].
Figure 14 depicts the failure pattern of damaged specimens. Under different loading conditions, the types of cracks developed around the prefabricated crack are different. In this test, almost all shear cracks developed around the prefabricated crack, and only individual specimens developed tensile cracks. The failure pattern changed gradually with the increase in damage degree. When the damage degree was small (0–15.37%), the A-crack propagated on both sides of the prefabricated crack and extended to top and bottom of specimens. The specimens R-1, R-2, R-3, and R-4 all exhibited the above failure characteristics, and with the increase in damage degree (15.37–52.96%), the W-crack propagated on both sides of prefabricated cracks. When the damage degree was 45.64% (R-5), the tensile crack on left side of the prefabricated crack almost ran through both the top and bottom sides of specimen, whereas the A-crack propagated on the other side. When the damage degree was 57.25% (R-6), a W-crack developed at the lower end of the prefabricated crack and extended to bottom of specimen, whereas an A-crack developed at the upper end and extended to the upper right corner of the specimen. When the damage degree was sufficiently large (52.96–89.40%), the A-crack propagated on both sides of the prefabricated crack and extended to top and bottom of specimens, which indicates that shear failure occurs in the specimens.
Figure 15 presents typical failure patterns for the prefabricated crack specimens. In paper [22], the authors discovered three main failure patterns: tensile (T), shear (S), and tensile-shear (T–S) failure. According to the mechanical mechanism underlying crack initiation and propagation, the failure patterns can be divided into eight patterns. Among them, T-failure can be attributed to tensile properties; in Figure 15a,b, the W-crack or A-crack initiated from the P-crack tip and passed through the upper and lower parts of specimens. This indicates that the specimens underwent T-failure; in contrast, S-failure can be attributed to shear properties. Generally, the specimens exhibited T-S failure, as illustrated in Figure 15g,h. In this test, the failure pattern of specimens changed continuously with the increase in damage degree. When the damage degree was small, the failure pattern was S-failure, which is consistent with the results depicted in Figure 15f. With an increase in damage degree, failure characteristics similar to those depicted in Figure 15h appeared, and the specimens exhibited T-S failure. When the damage degree was sufficiently large, the failure pattern was S-failure, as illustrated in Figure 15e. The cracks developed on both sides of the prefabricated crack and ran through specimens in an oblique direction.

4. Energy Evolution Law for Damaged Prefabricated Crack Sandstone

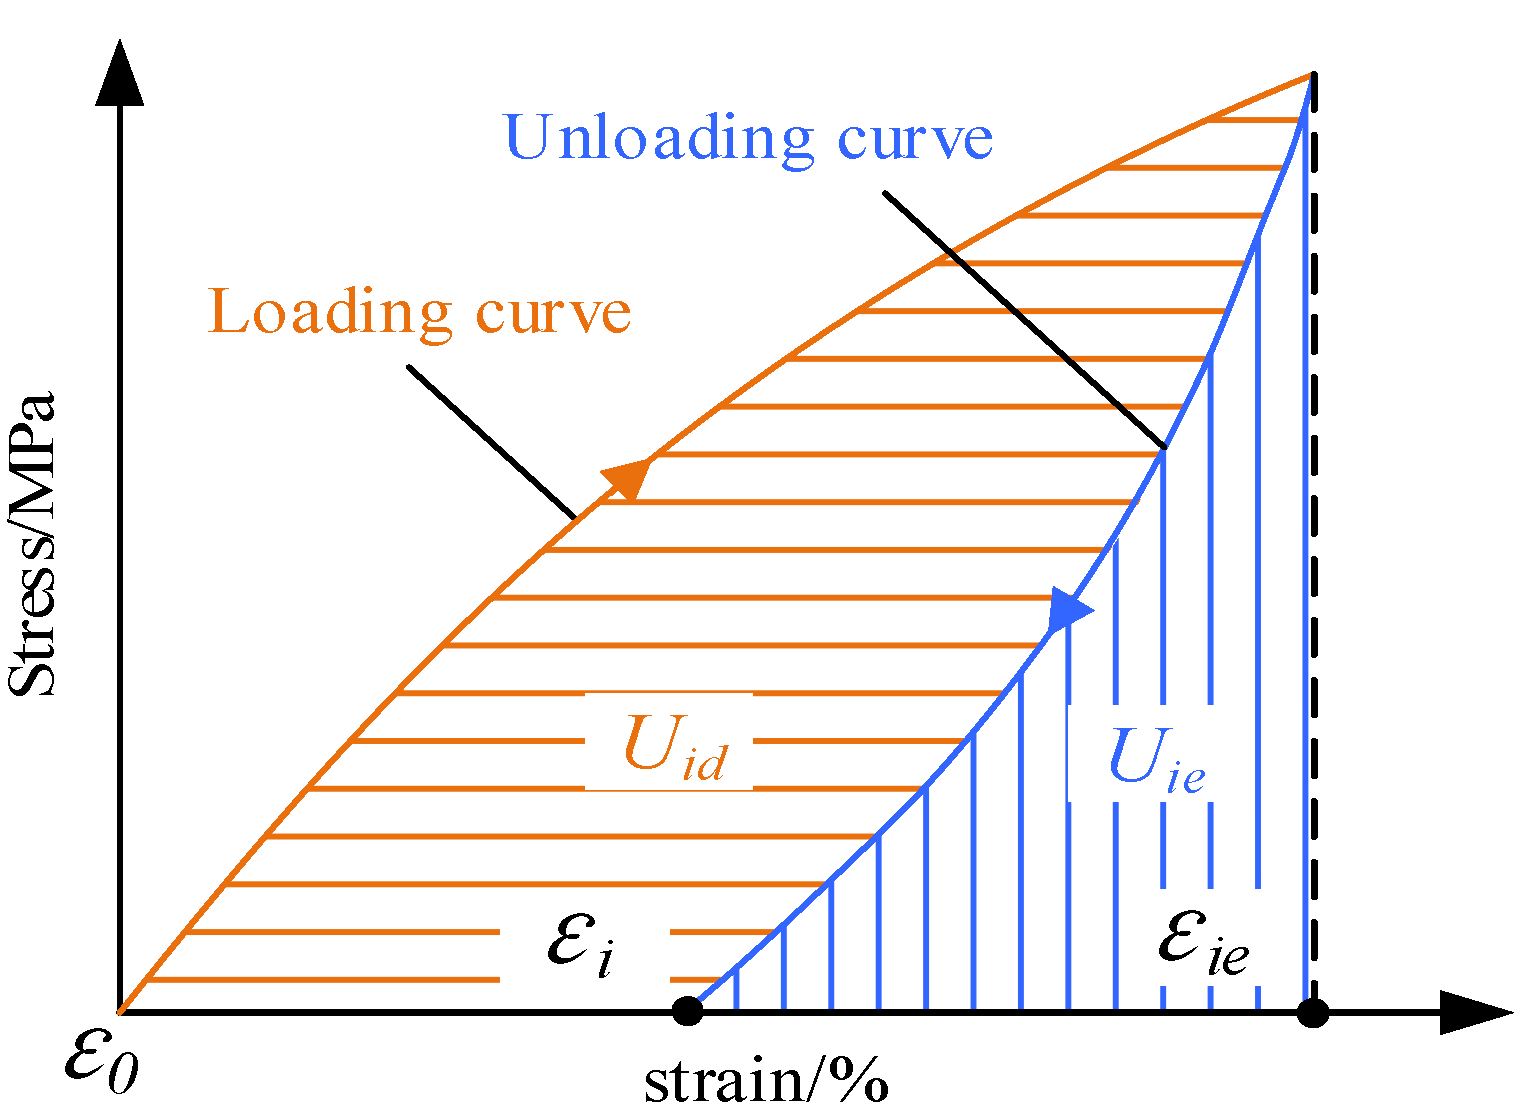
4.1. Energy Calculation Method

Notably, thermodynamic laws indicate that energy conversion is an essential feature of processes involving physical changes in materials, and material failure is a state instability phenomenon driven by energy [35]. During the loading process, the dissipated energy in the rock mass is primarily reflected in the form of internal micro-defect closing friction, microcrack propagation, and relative dislocations of the fracture plane, which finally lead to rock failure. In actual rock mass engineering applications, the rock mass stores a large amount of elastic energy owing to high stress conditions; accordingly, excavation unloading induces a large amount of elastic energy release. Before the peak stress is reached, dissipated energy and elastic energy accumulation are the primary processes. In addition, the dissipated energy at the peak strength promotes the formation of a macroscopic fracture surface and loss of strength. Figure 16 illustrates the calculation method for the specimen energy density under uniaxial compression, where E denotes the elastic modulus at the peak stress during unloading, Ud denotes the dissipated energy, and Ue denotes the elastic energy.
During uniaxial loading, only axial stress contributes to the work performed; therefore, the input energy density can be expressed as stated in Equation (6). The elastic energy density can be expressed as stated in Equation (7), based on which the input energy U, elastic energy Ue, and dissipated energy density Ud can be calculated.
U = U e + U d = σ 1 d ε 1
U e = 1 2 σ 1 ε 1 = 1 2 E u σ 1 2 1 2 E σ 1 2  

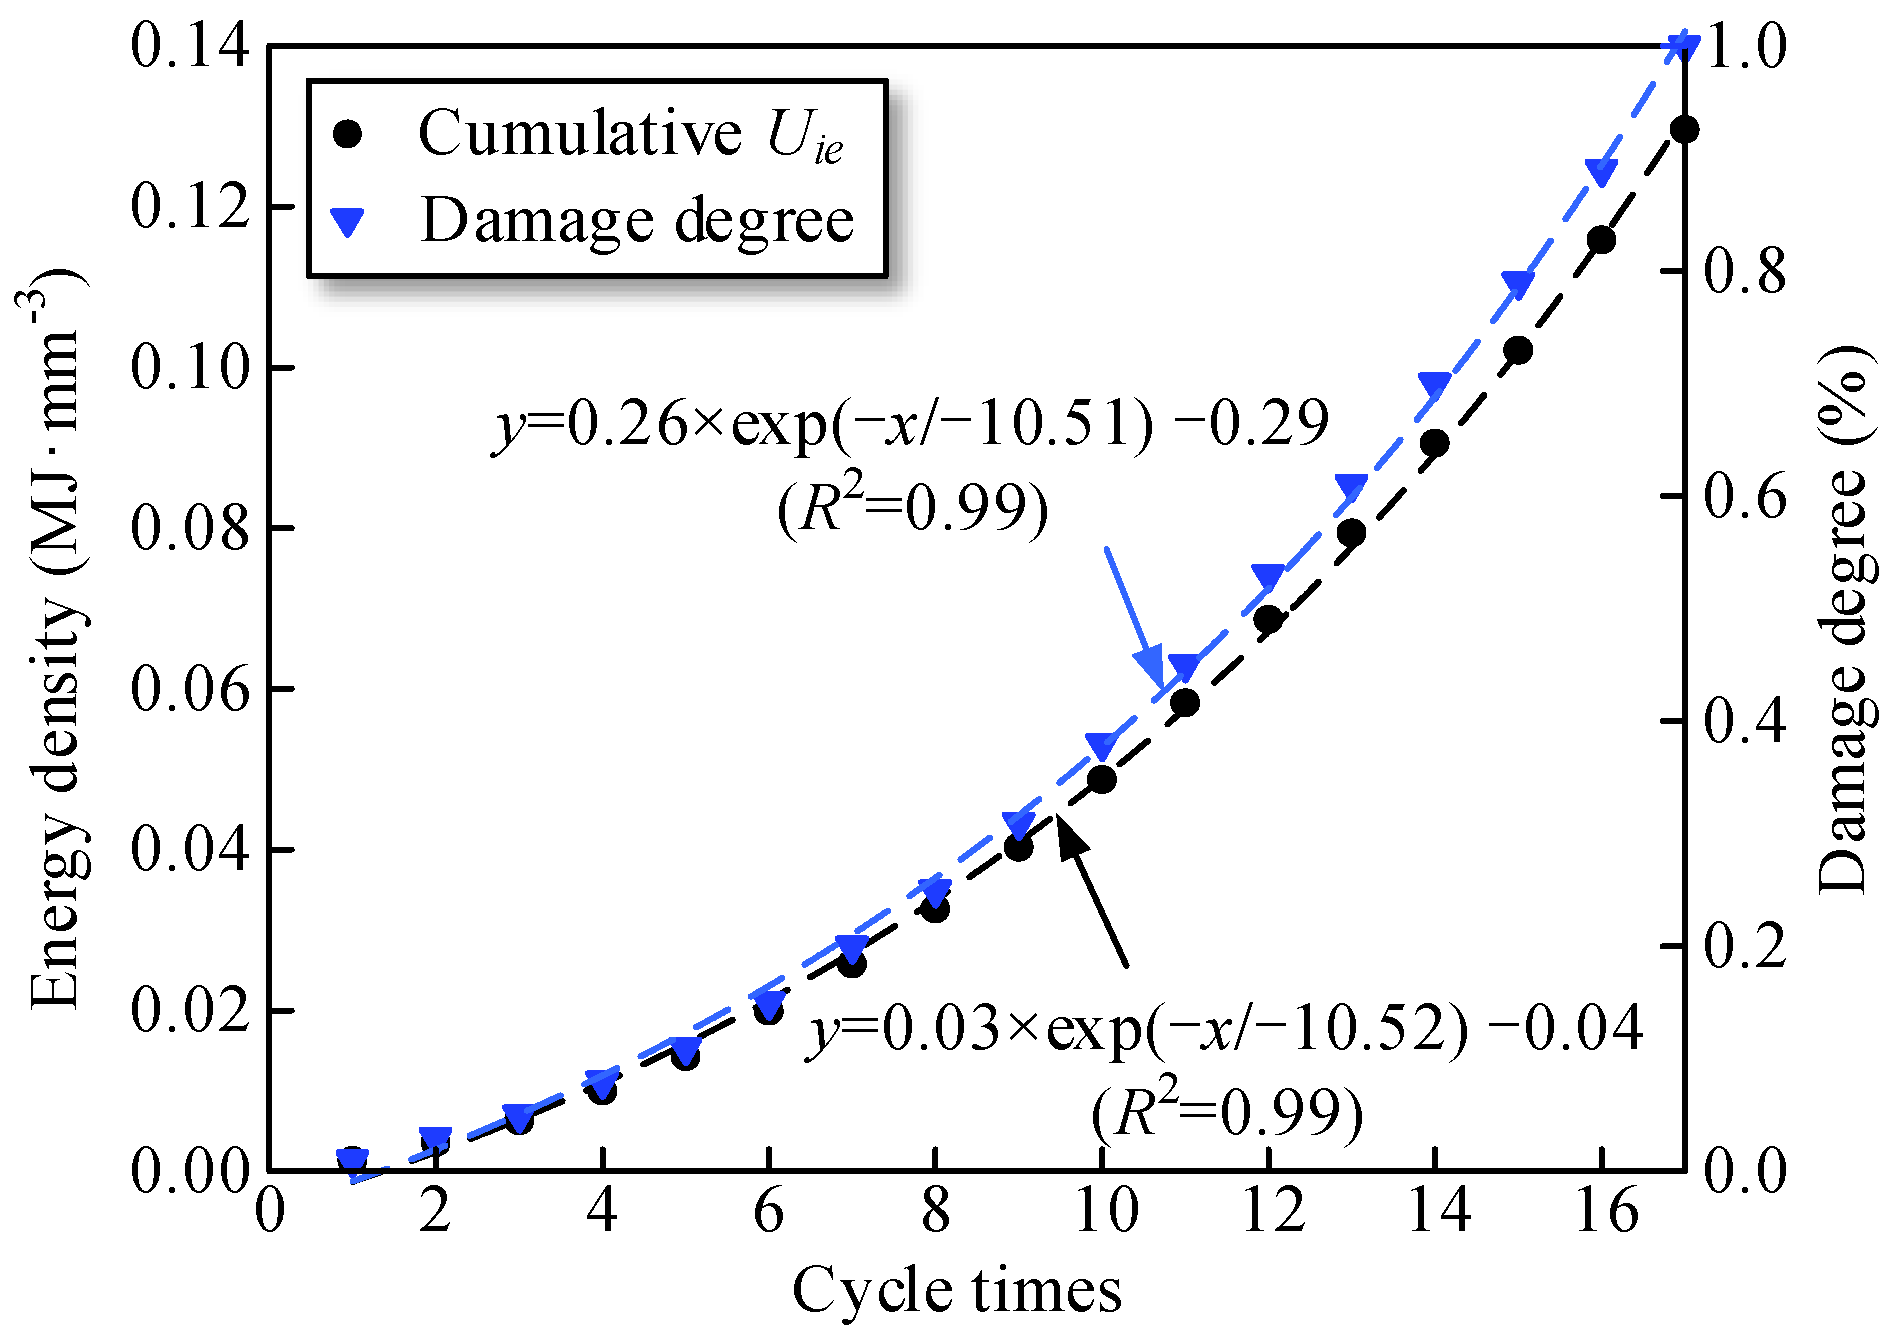
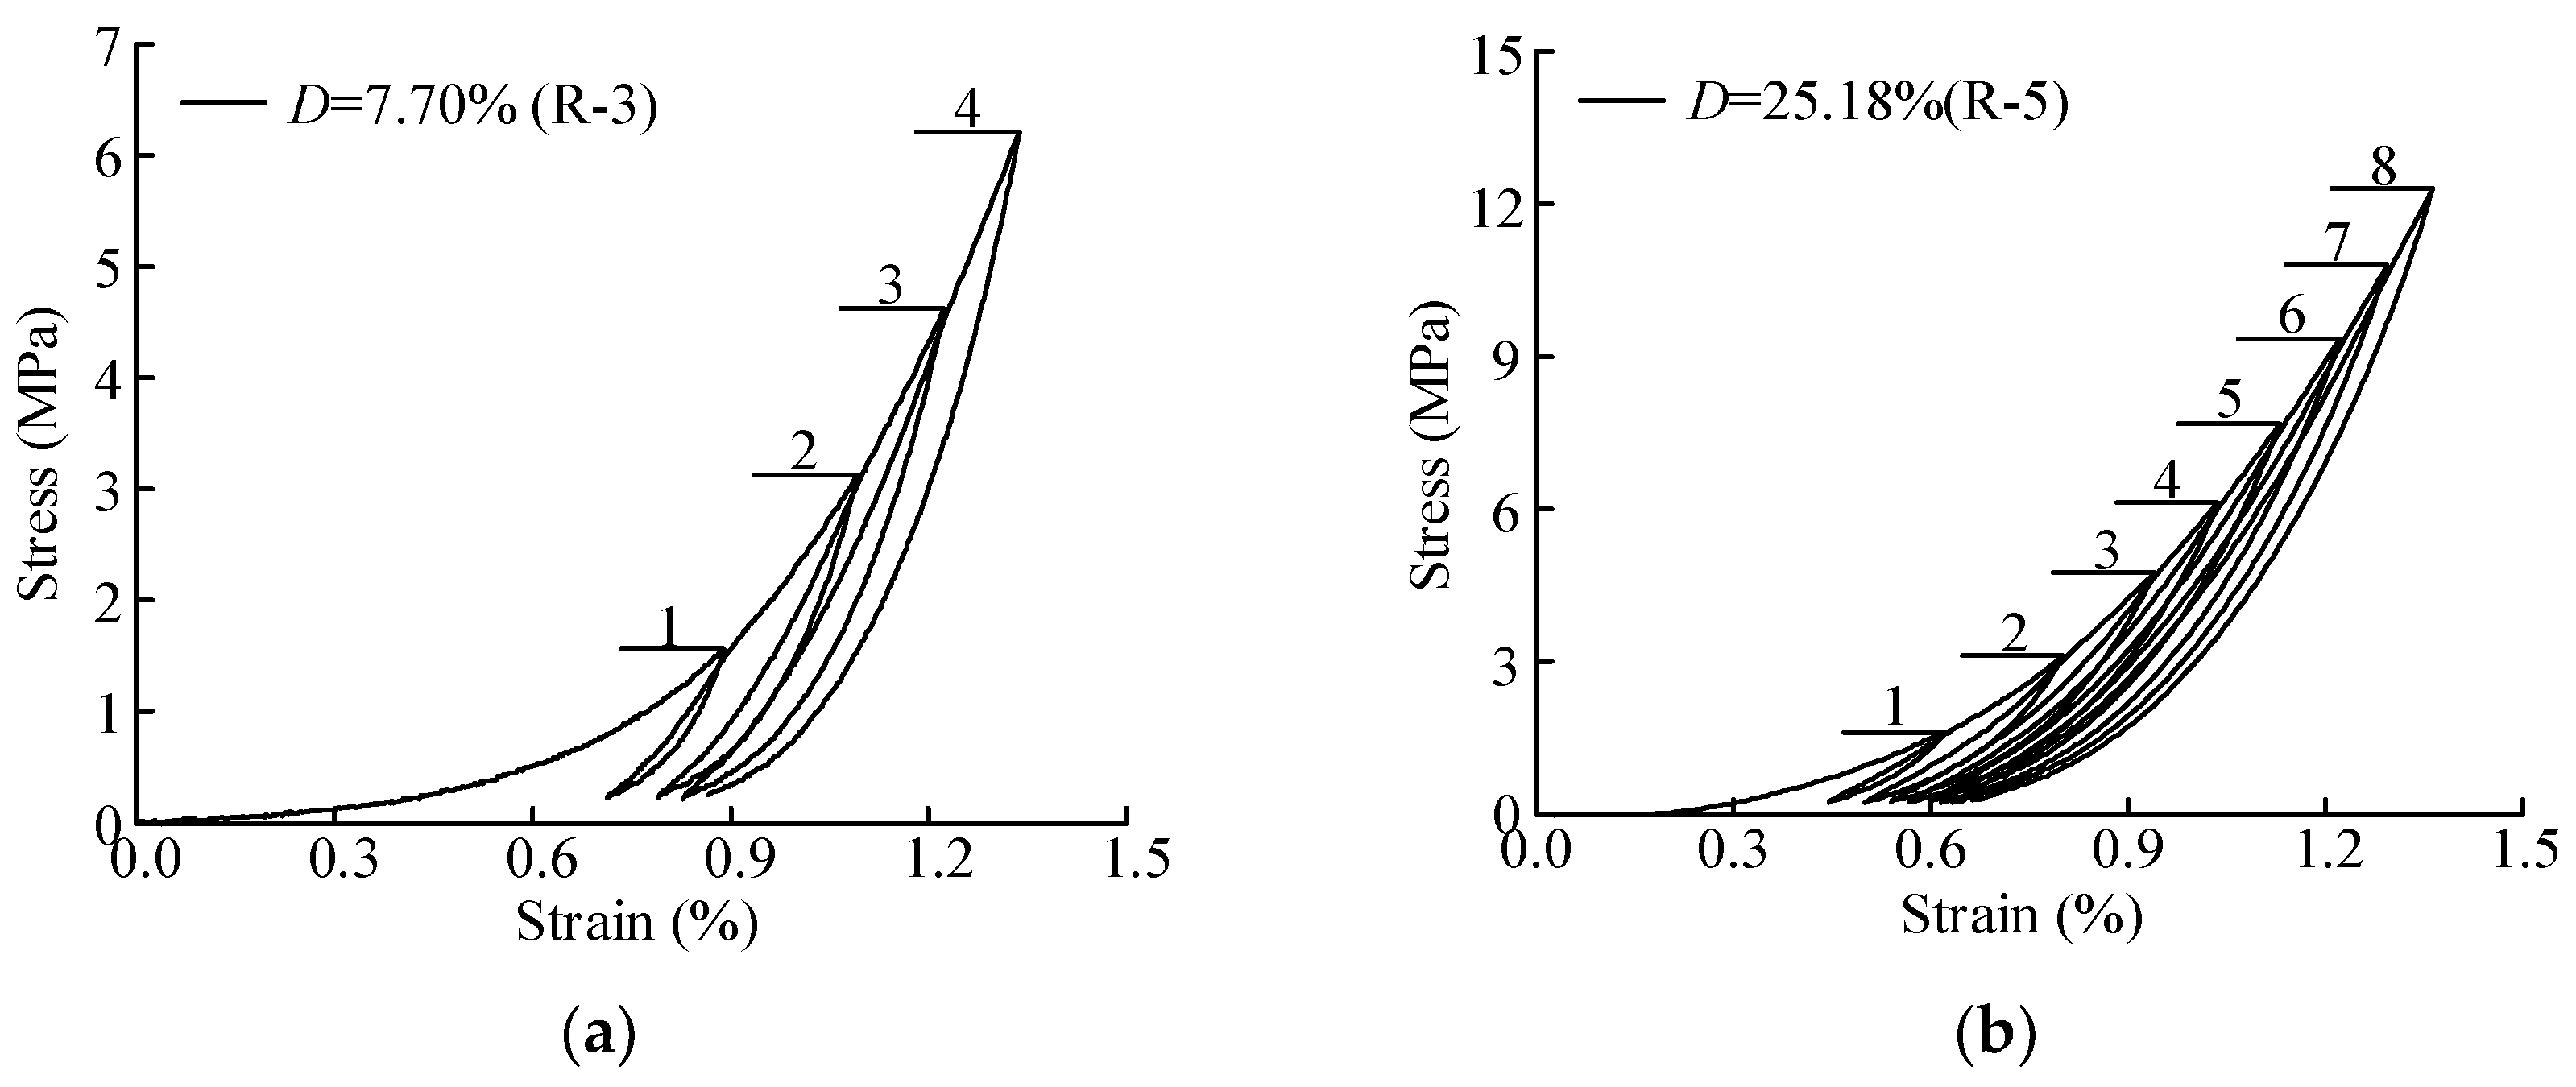
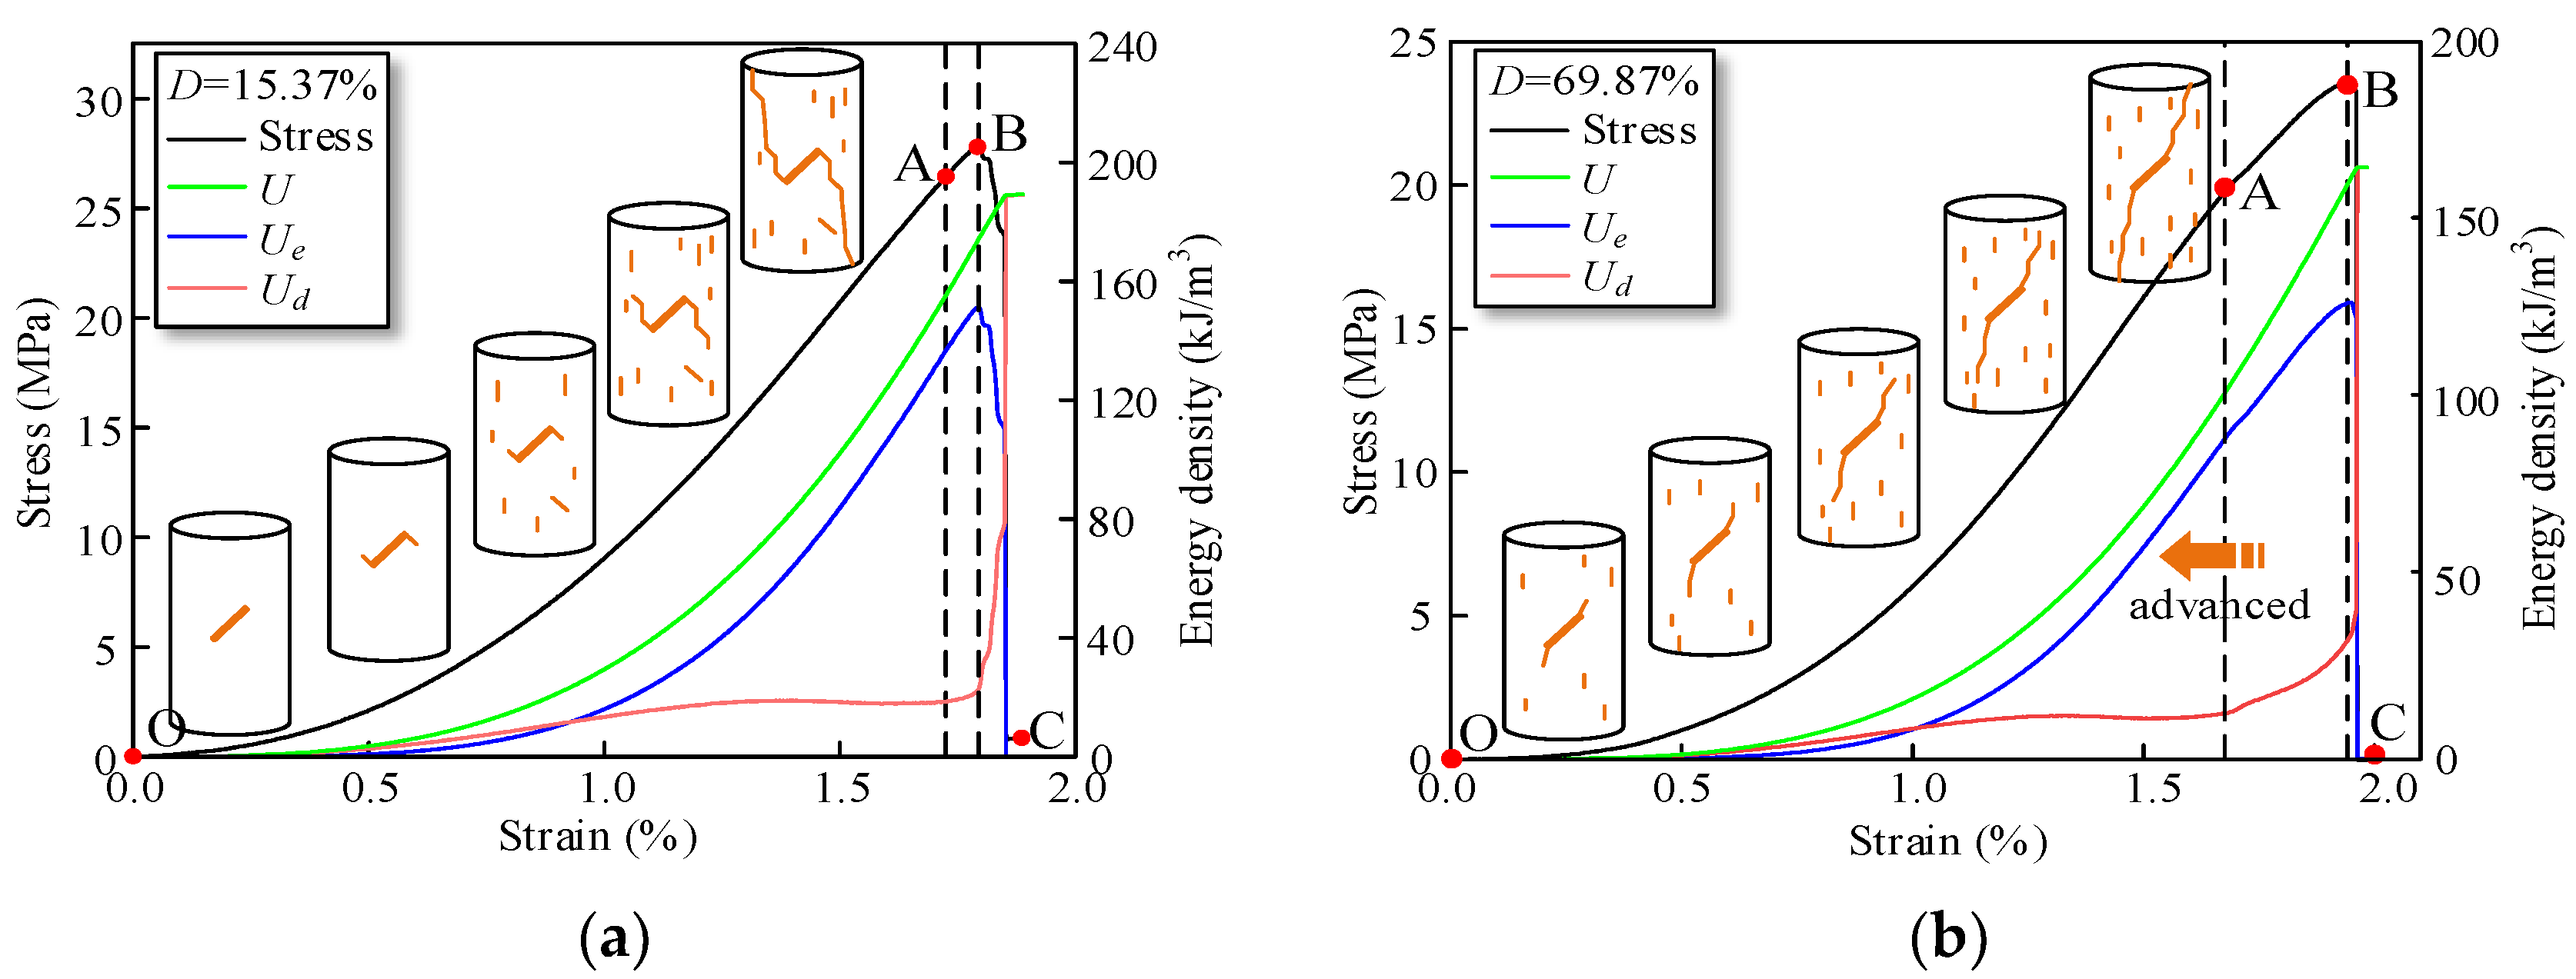
4.2. Energy Evolution Law

Figure 17 depicts the energy evolution process of prefabricated crack specimens. Herein, specimens with damage 15.37% and 69.87% were used as examples for analysis. According to the stress–strain curve, the energy evolution process can be divided into three stages: energy stored, energy dissipated, and energy released. In the microcrack compaction and elasticity deformation stage (OA), the input energy and elastic energy values increased gradually with the increase in stress; note that the input energy is mainly stored in the form of elastic strain energy, which is also the case in the energy storage stage. In the plasticity deformation stage (AB), under an axial stress, the input energy and elasticity energy continued to increase. The elastic energy stored within specimens increased, and subsequently, the dissipation growth rate began to increase significantly, demonstrating that the phase specimen’s mesoscopic rapid crack propagation near the peak point resulted in a macroscopic crack in the energy dissipation stage. In the post-peak stage (BC), the specimens lost their bearing capacity, which led to the input energy decreases. Consequently, elastic energy was released suddenly, and the dissipative energy increased rapidly. Hence, the crack propagated rapidly and led to specimen failure in the energy release stage.
Under uniaxial compression, the input energy before the peak point is mainly stored within the specimen as elastic energy, and some of it dissipates during microcrack development. With energy dissipation, the microcracks in the rock expand, leading to the gradual reduction in its bearing capacity, but the main crack surface is not formed. In the post-peak stage, a large amount of elastic energy is released and converted into energy consumed by crack propagation and transfixion. The higher the damage degree, the more obvious the pre-peak yield stage, indicating that cyclic loading–unloading may cause damage to the internal structure of specimens. When the damage degree for the specimens is small, the dissipated energy begins to rise rapidly near the peak stage; however, the dissipated energy of specimens with a sufficiently large damage degree enters the rapidly rising stage earlier.
The input energy (U), elastic energy (Ue), and dissipated energy (Ud) of specimens at the peak strength (Point B) were extracted for analysis. Figure 18 presents the energy evolution law of damaged specimens. With the increase in damage, U and Ue demonstrated a nonlinear decreasing trend, whereas Ud exhibited a nonlinear increasing trend. The change rates of U, Ue, and Ud increased continuously, and the correlation coefficient of the fitted exponential function increased above 0.8. In general, most of the input energy was transformed into elastic energy and stored inside specimens during loading process, while some of it was dissipated during crack development and propagation. Therefore, the damaged specimens can be divided into two categories: minor damage (0–52.96%) and heavy damage (52.96–100%).
Figure 19 depicts the ratio of Ud/U evolution law with damage degree. Notably, the proportion of Ud increases nonlinearly with an increase in damage degree. In the minor damage stage, the ratio of Ud/U develops in a flat trend, but in the heavy damage stage, the ratio of Ud/U increases rapidly.

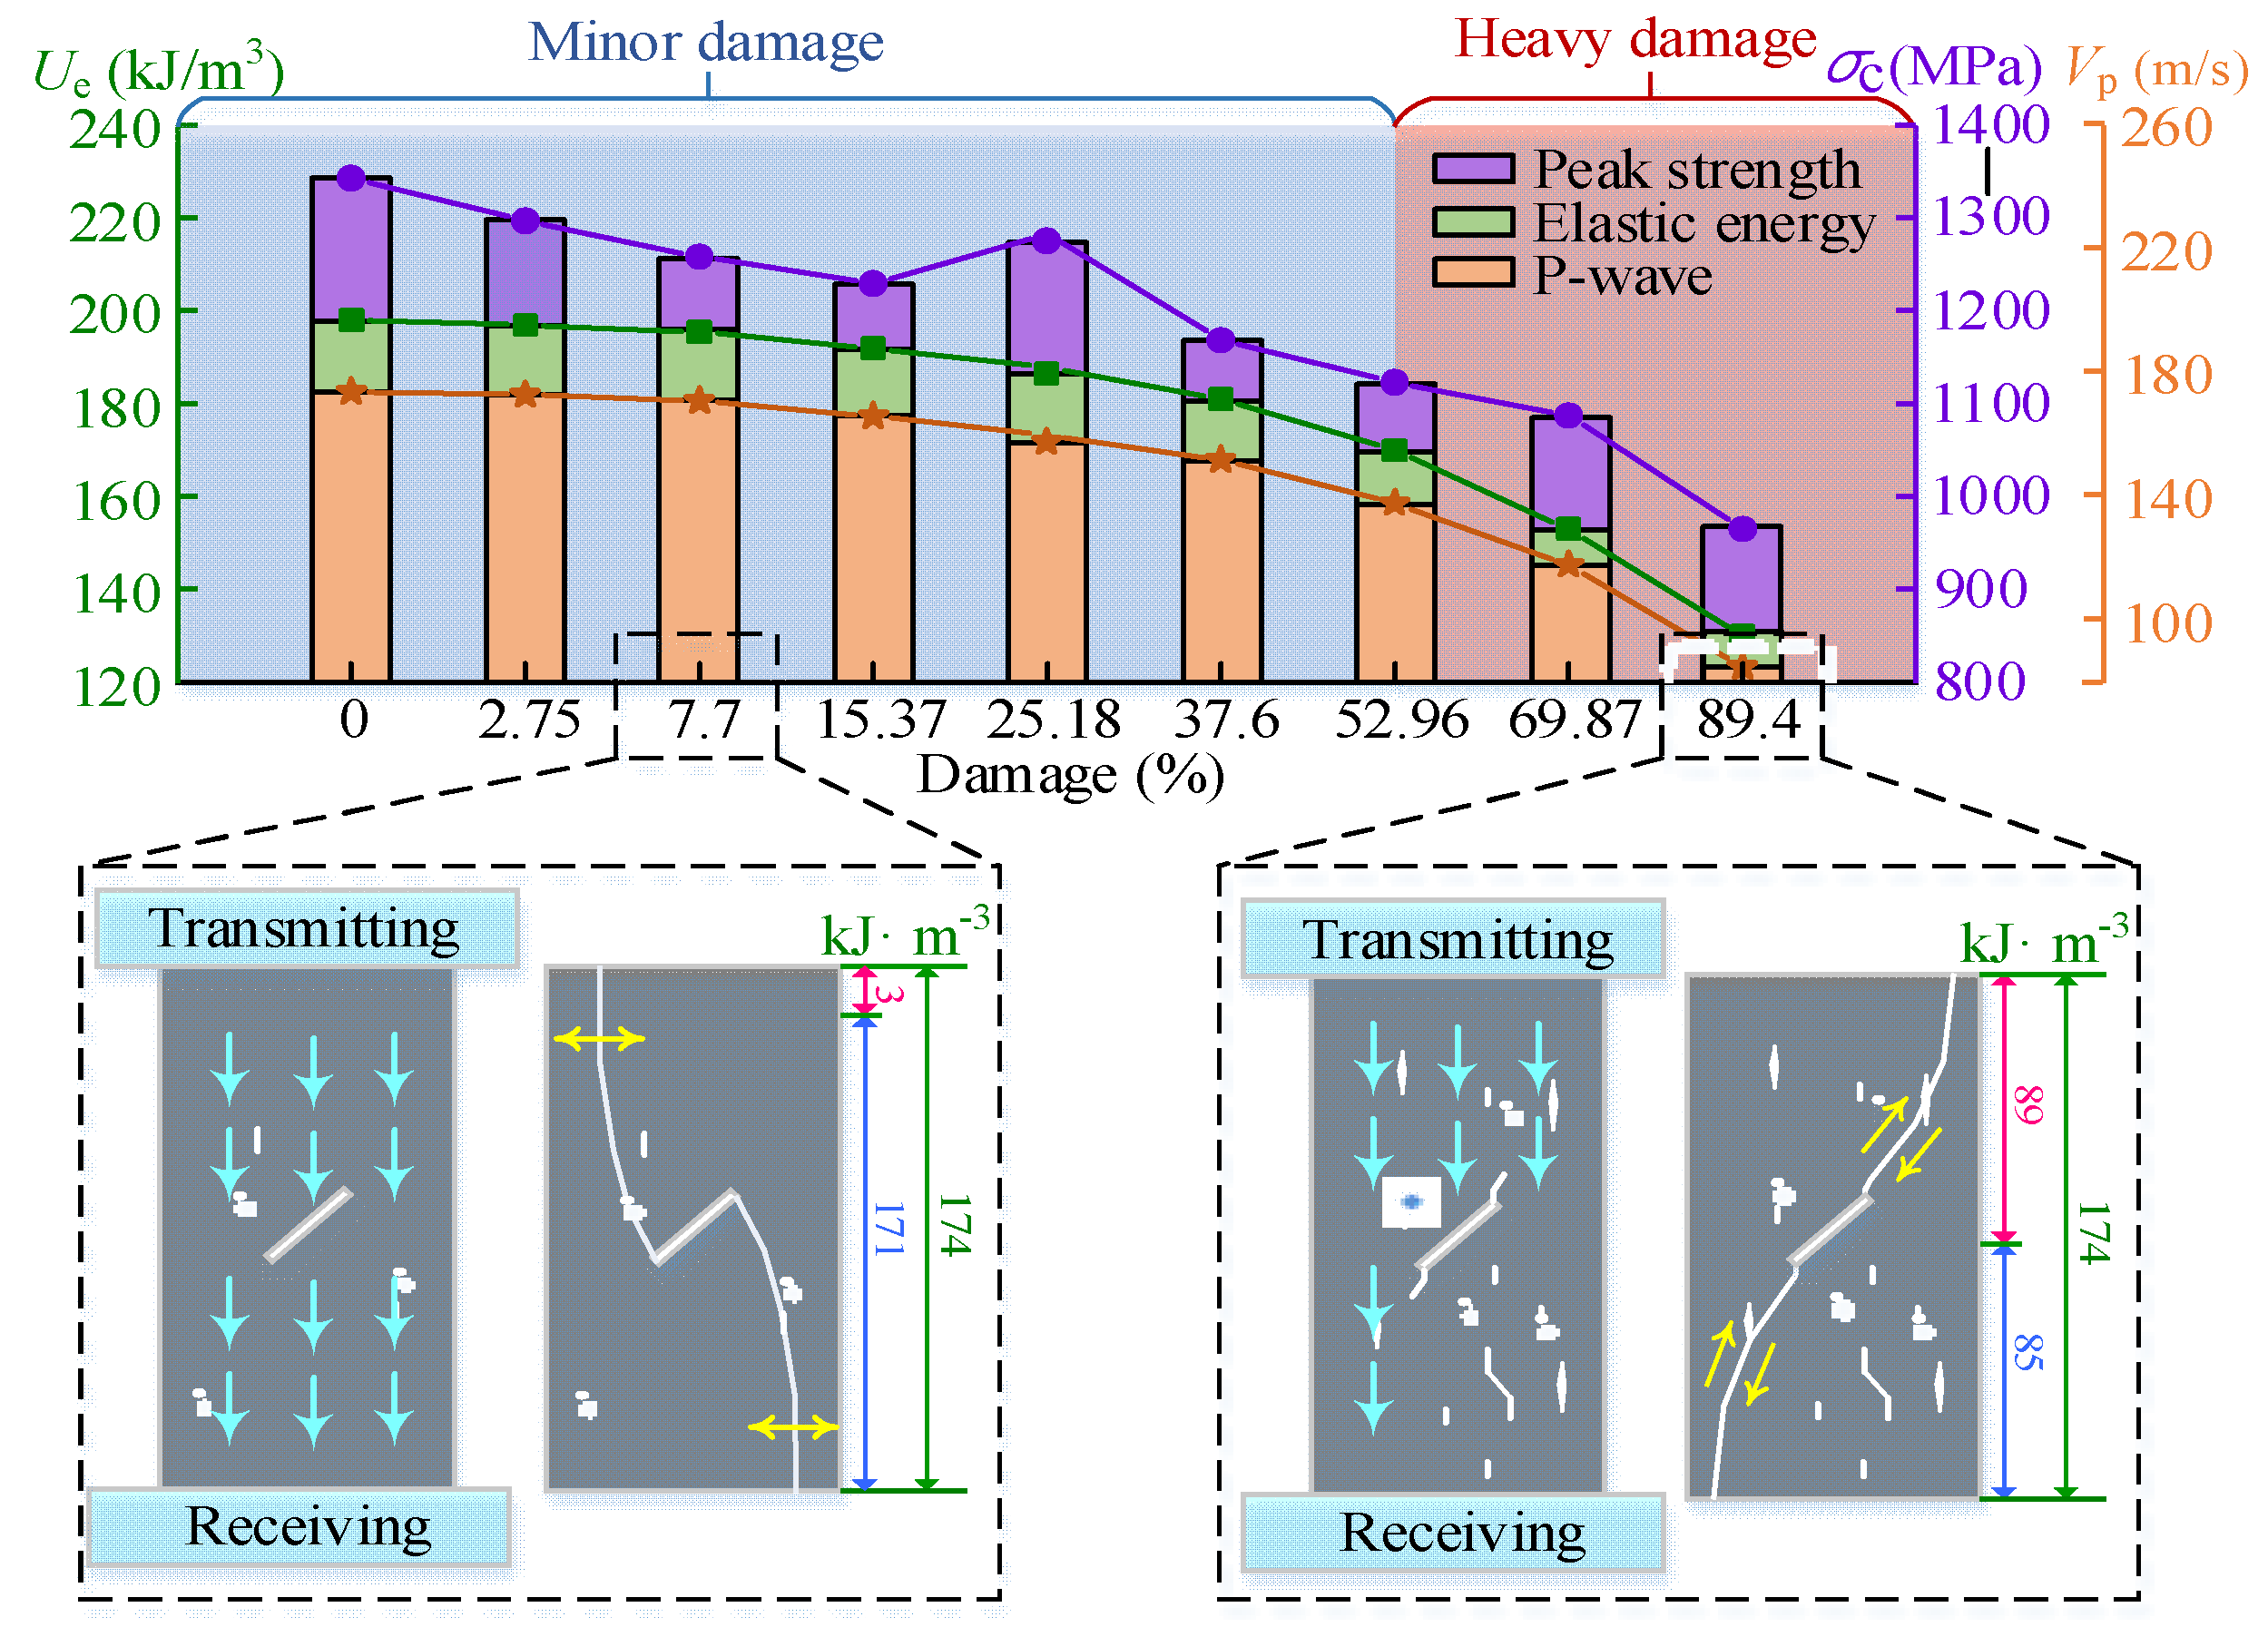
4.3. Failure Mechanisms of Damaged Rock

Figure 20 shows the failure mechanism of damaged rock. According to the energy change rate, the damaged rock can be divided into minor damage (0–52.96%) and heavy damage (52.96–100%). The essential difference between these two types of damaged rocks is the crack development inside rock mass.
Taking the minor damage of 7.7% as an example, the specimen experienced few cycles, and the stress level was low. Since the inner primary pores were compacted, the peak strength of the specimen did not decrease significantly or even increase, the energy storage limit increased correspondingly, and the P-wave velocity also did not decrease significantly. Taking the major damage of 89.4% as an example, The specimen experienced many cycles, a crack network appeared inside the specimen, and some of the cracks converged to form cracks. The mechanical properties of the specimen were obviously weakened, and the energy storage limit was greatly reduced. The propagation of the P-wave was blocked, and the P-wave velocity decreased obviously.
The bearing capacity of damaged rocks is obviously different. Coal seam mining with roof collapse leads to overburden damage and fracture field. Generally, the overburden of stope can be divided into the caving zone, fracture zone, and bending subsidence zone from the bottom up [4]. As shown in Figure 21, the damage degree of overburden varies in different zones, the overburden rock near the goaf has serious damage, and the cracks are developed intensively in the heavy damage zone. The overburden far away from the goaf has a small damage degree, and a few cracks are developed in the minor damage zone. Therefore, according to the damage degree, the overburden can be divided into minor damage zone and heavy damage zone from top to bottom. When the rock damage exceeds a certain threshold value, it changes from minor damage to heavy damage. At this time, the bearing capacity of overburden decreases greatly.
Borehole grouting is generally used to fill the cracks of overburden. This also puts forward different technical requirements for the repair of overburden damaged zones: The slurry material with good fluidity and low bonding degree should be used in the minor damage zone of overburden, as it can penetrate into small cracks, such as polymer grouting materials. The grout material with high strength which can be quickly solidified should be used in the heavy damage zone of overburden, as it can eliminate the hidden danger of water inrush in the underground working face caused by grouting construction, such as single-liquid cement slurry. Therefore, if the overburden damage zones can be accurately identified, for example, the damage degree of overlying rock can be judged by micro-seismic monitoring and positioning, ultrasonic inversion, and other methods, then the targeted material can be used to grout the overburden fracture field. Thus, the self-repair process of the overburden fracture field is artificially promoted.

5. Conclusions

(1)
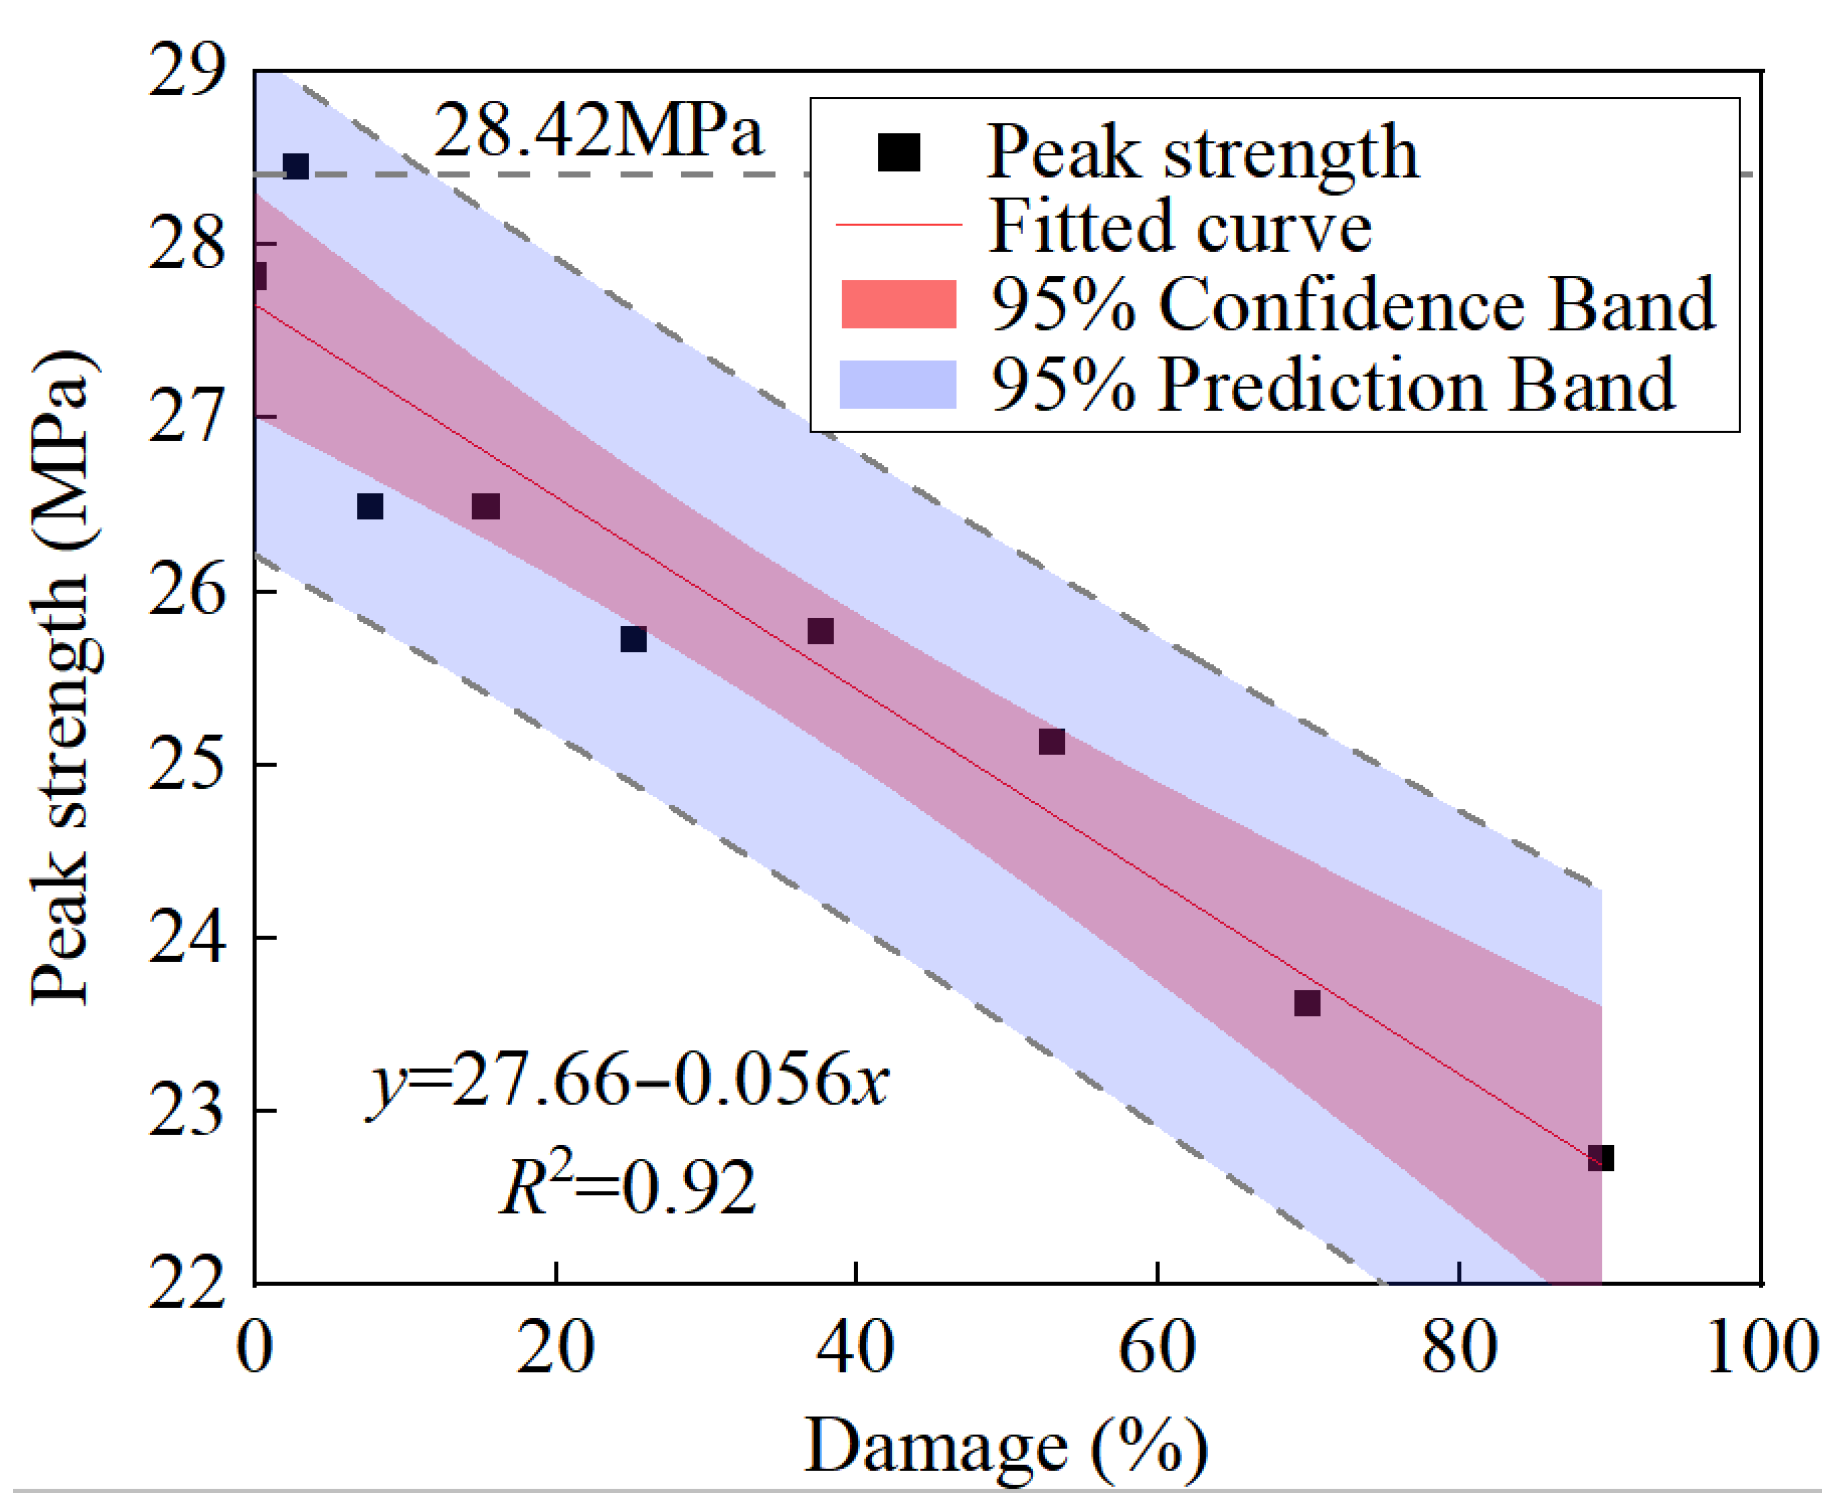
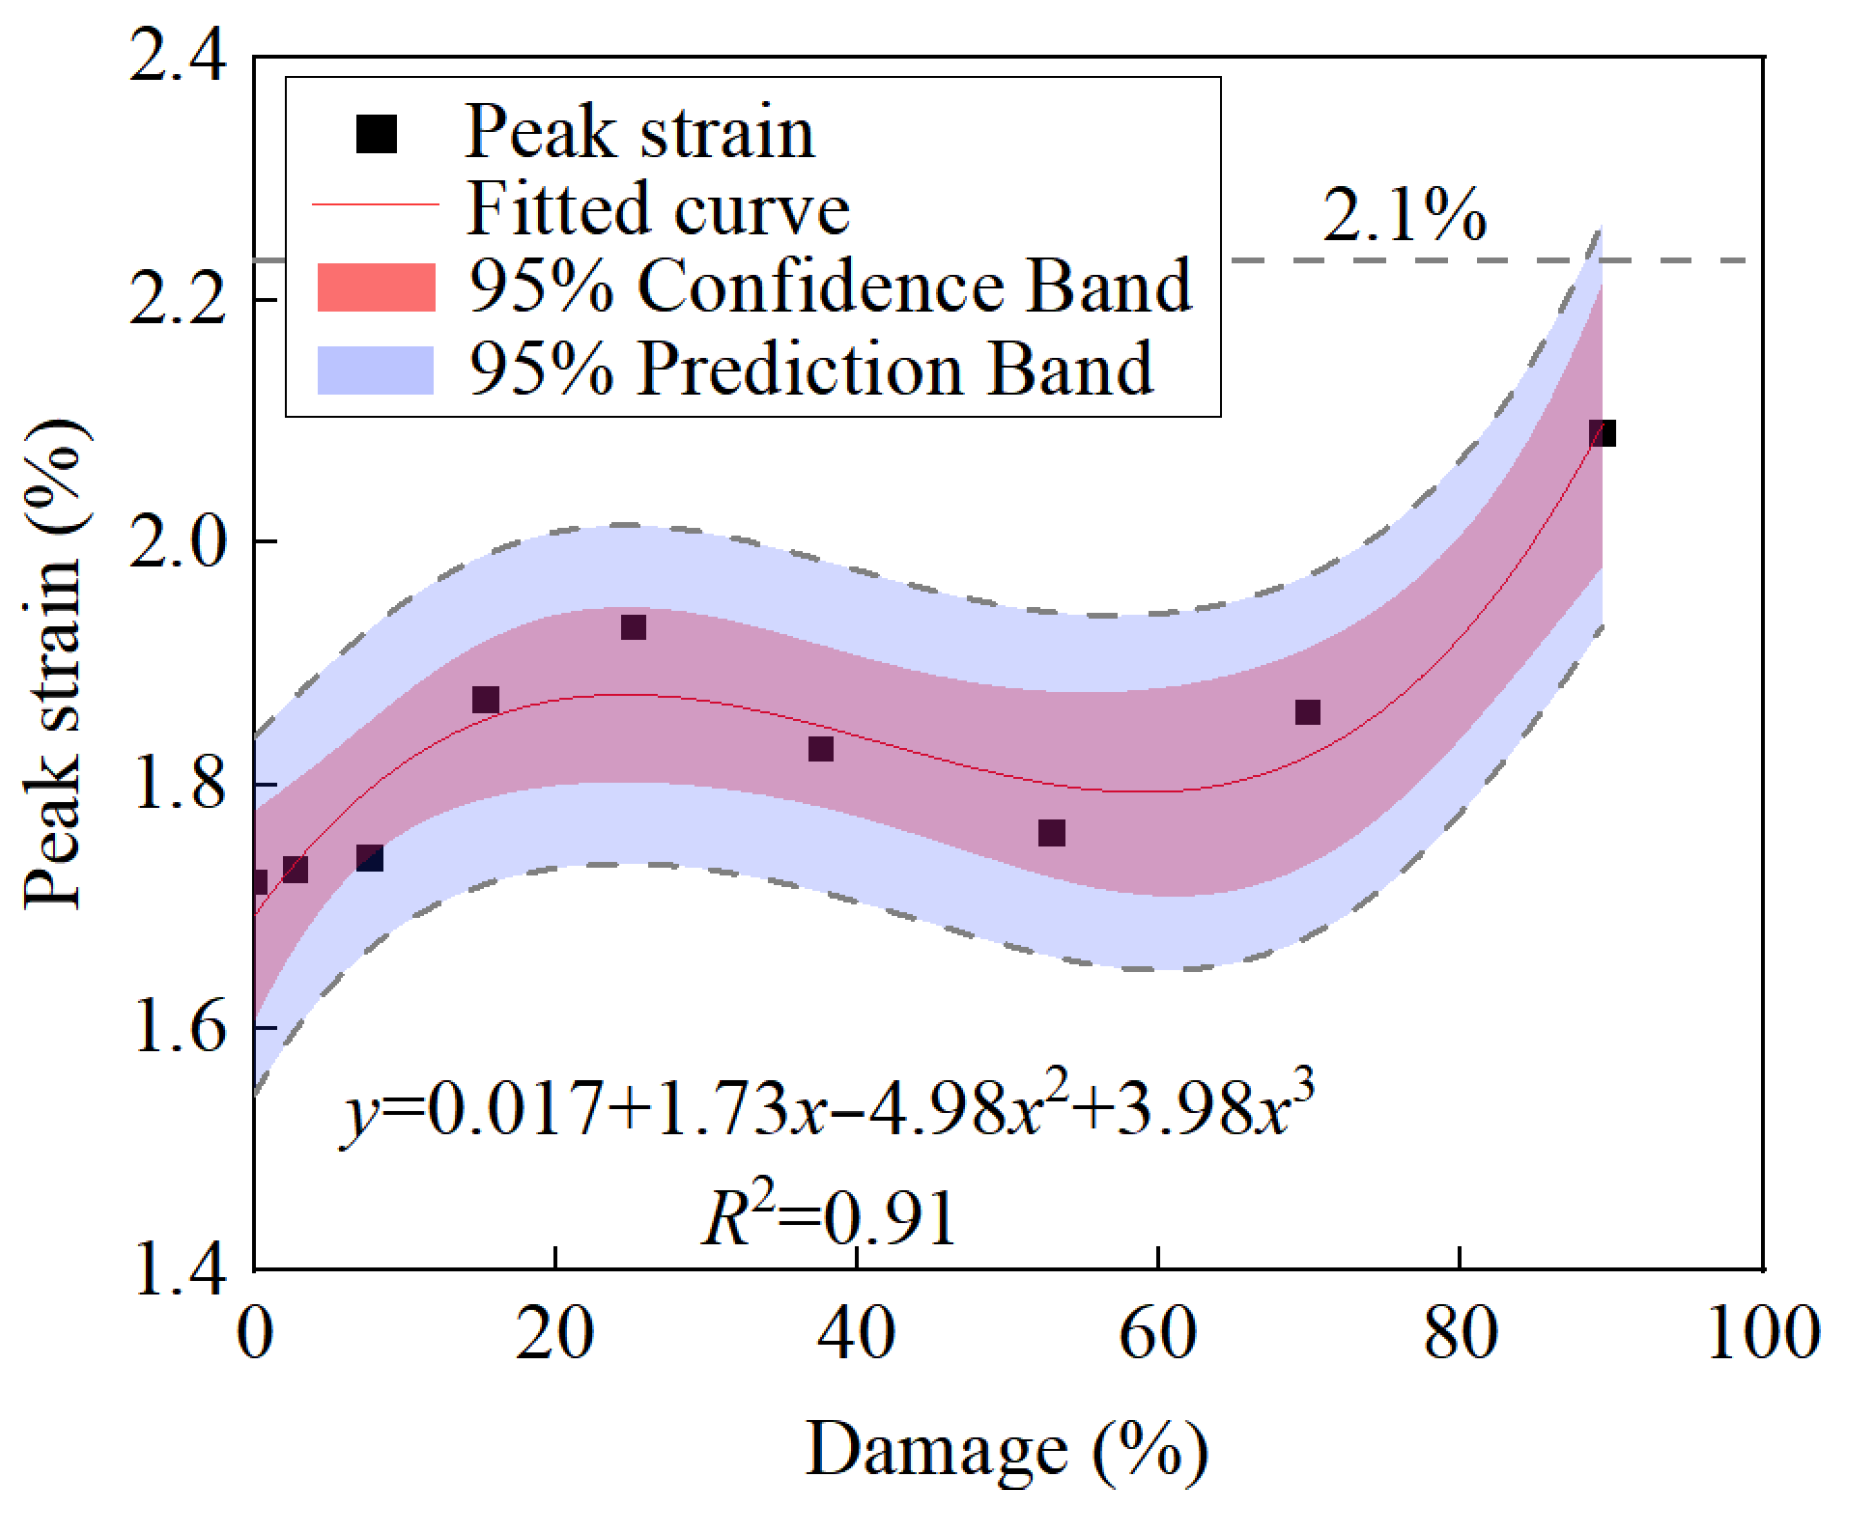
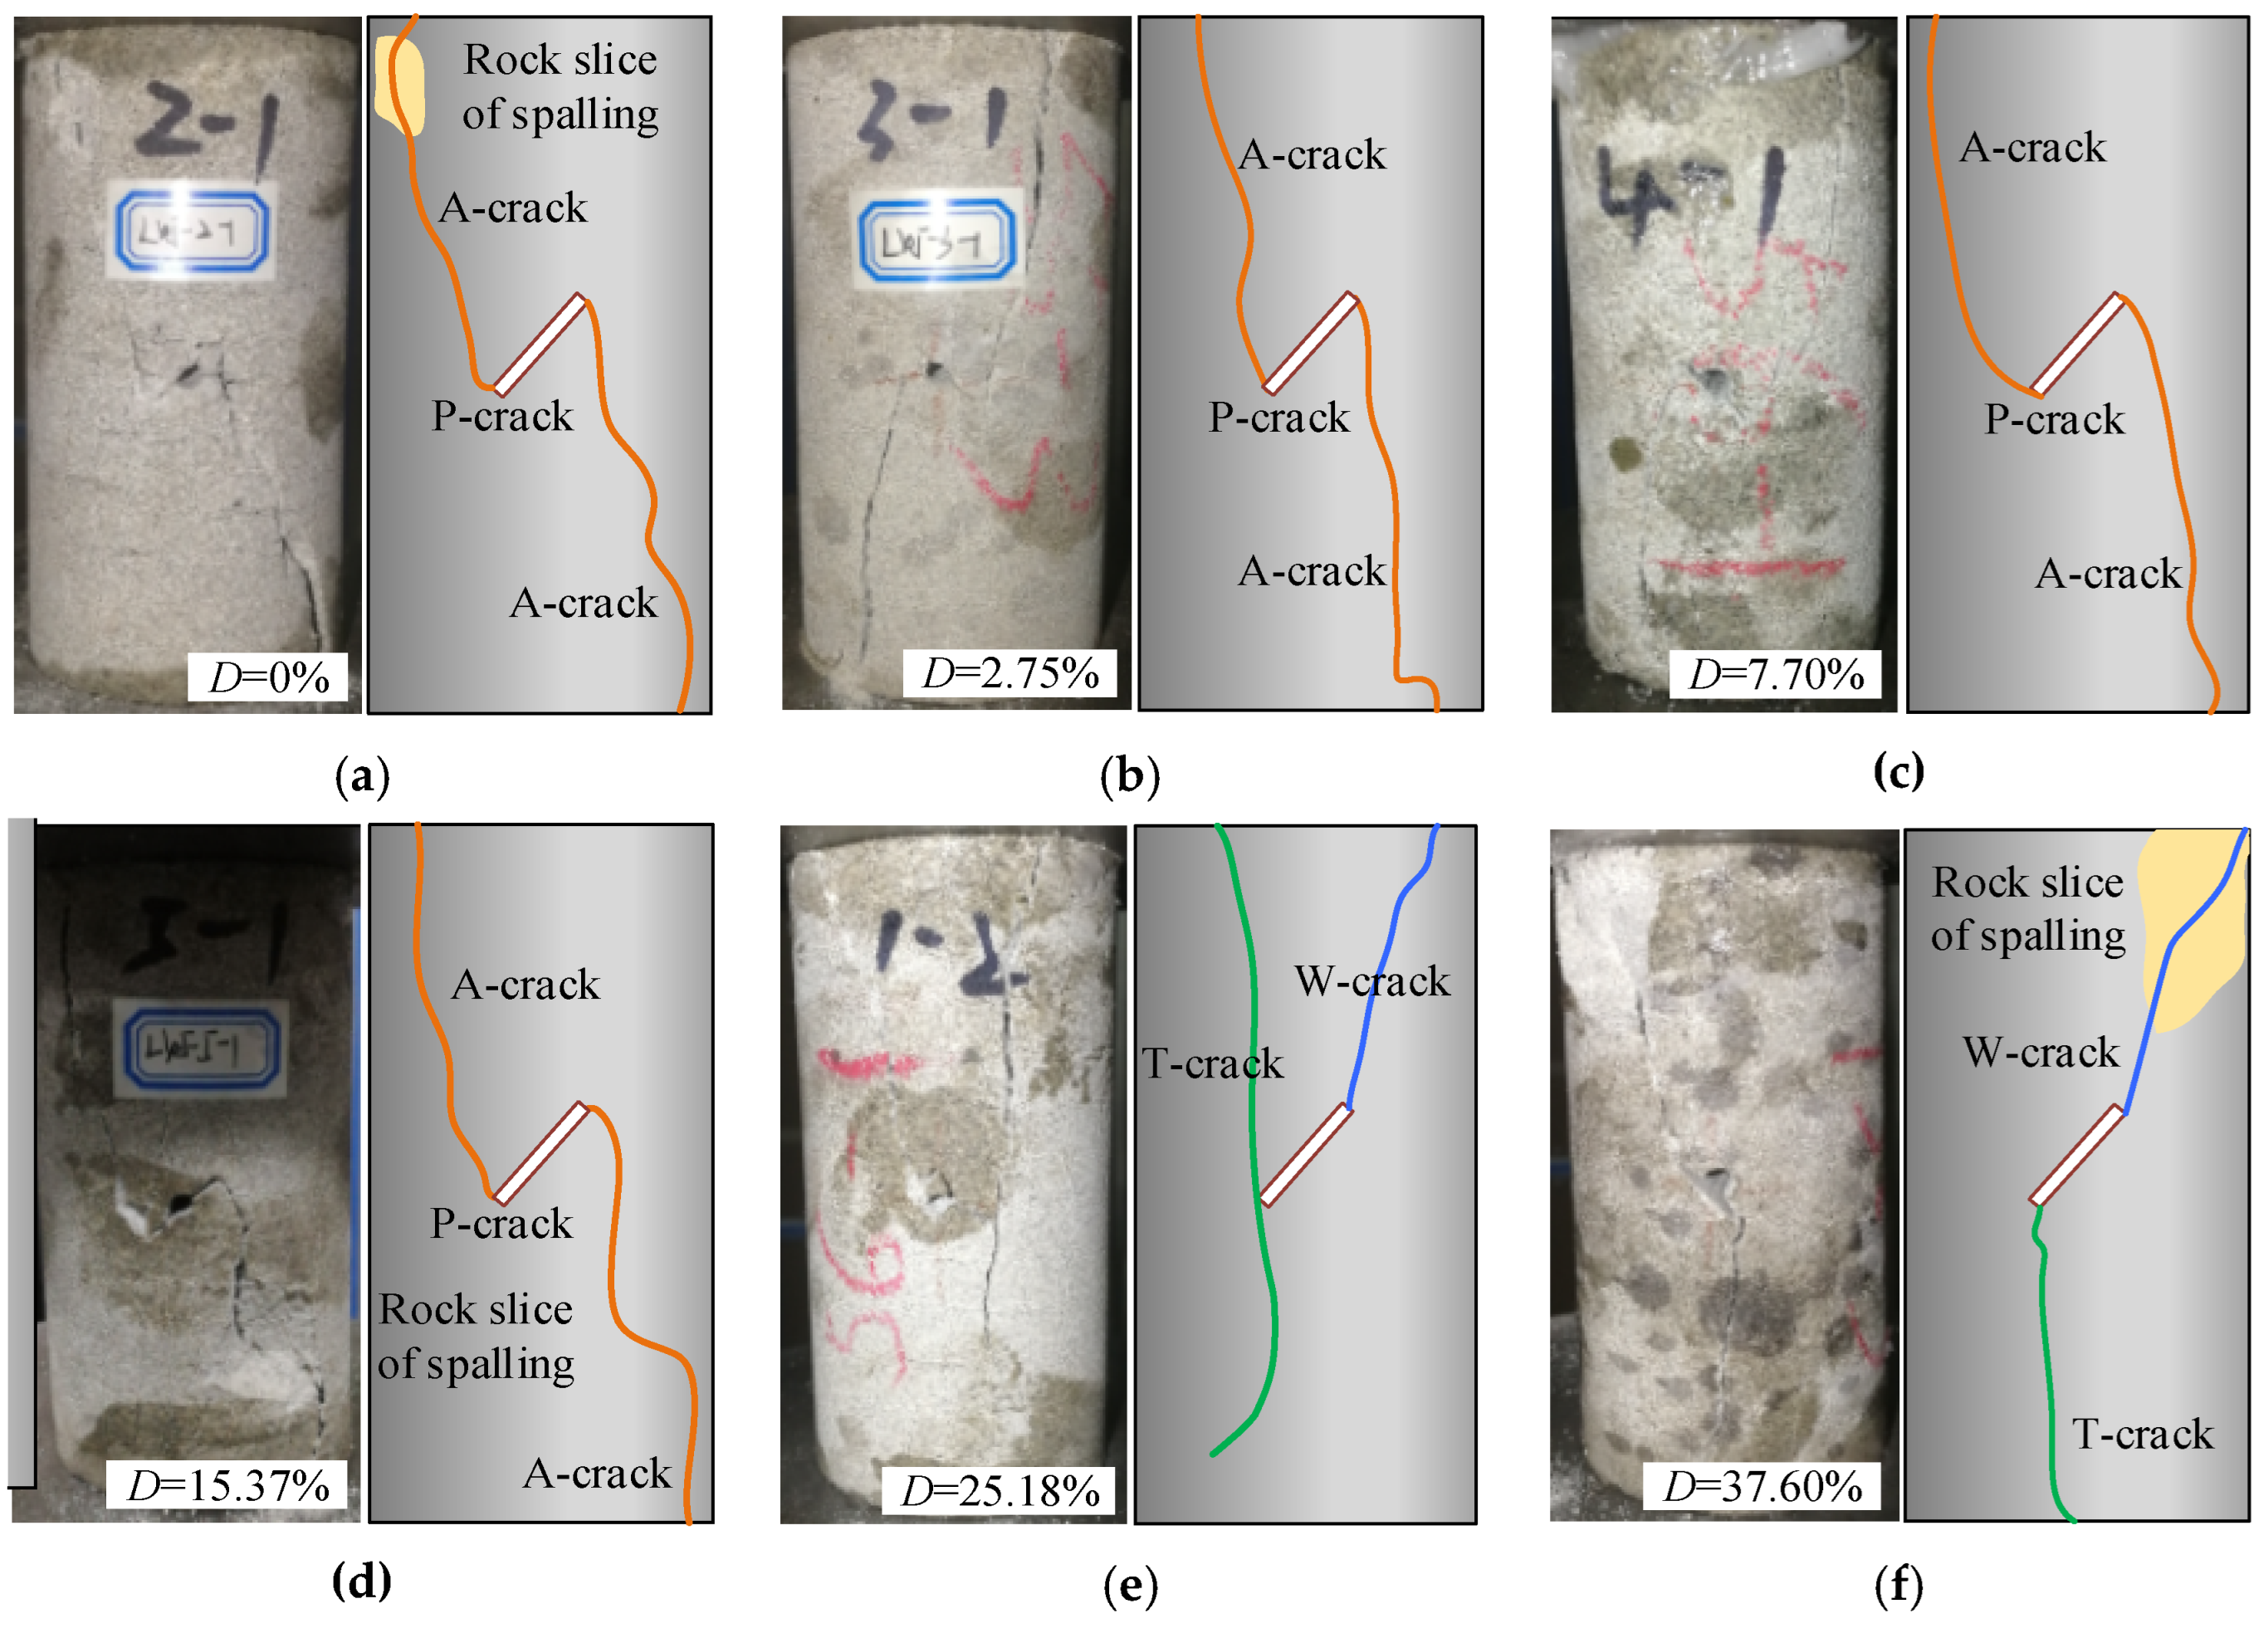
With an increase in damage degree, the peak strength and elastic modulus of damaged specimens decreased linearly, whereas the peak strain increased nonlinearly. Subsequently, the failure pattern changed from anti-wing cracks on both sides of the prefabricated crack to wing cracks.
(2)
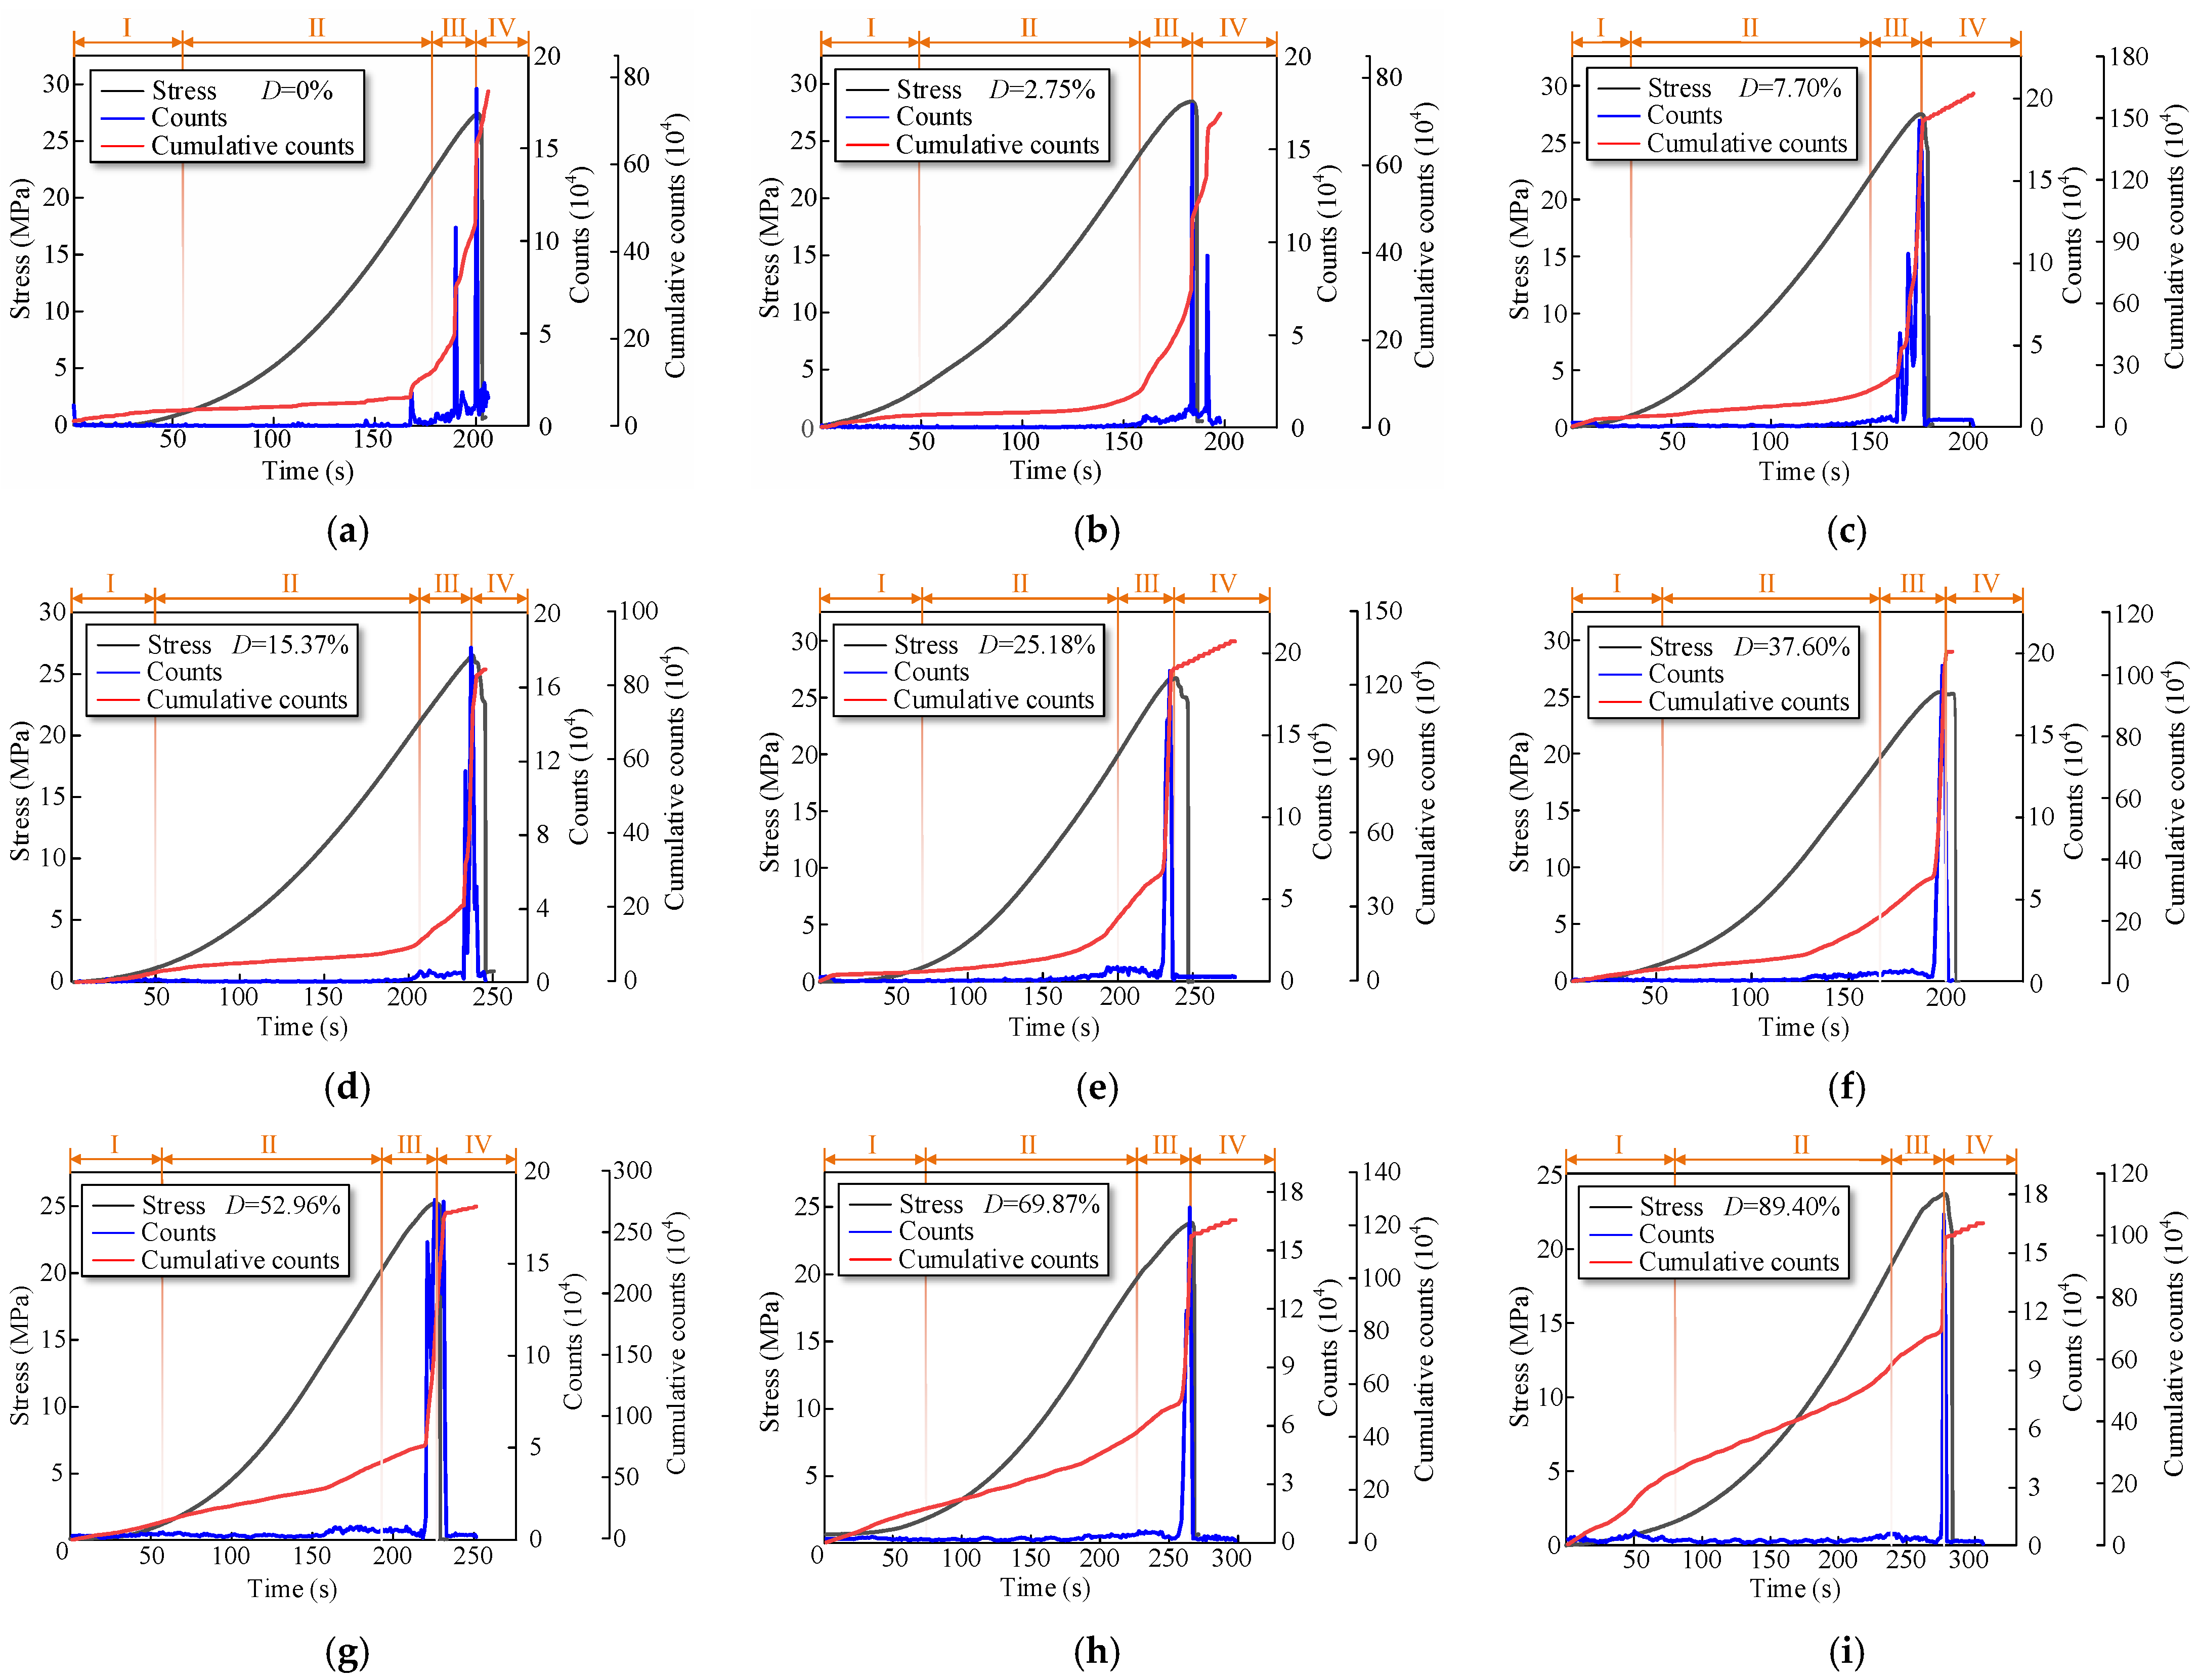
With the increase in damage degree, the P-wave velocity of damaged sandstone decreased linearly (fitting curve: y = 1348.2 − 3.876x, R2 = 0.91). AE signals appeared more frequently in the elastic deformation stage of the stress–time curves, and the cumulative AE count increased rapidly. This indicates that the damage degree of rock can be evaluated by comparing the variation of P-wave velocity and AE parameters.
(3)
The energy storage limits of specimens decreased gradually with an increase in damage degree. The stored elastic energy could be easily converted into dissipated energy during cracks propagation, leading to the failure of rocks. When the ratio of dissipated energy to input energy exceeded 52.96%, sandstone entered the heavy damage zone.

Author Contributions

Methodology, Y.Z.; validation, Q.L.; formal analysis, X.D.; investigation, Y.Y.; resources, Y.Z.; data curation, W.Z.; writing—original draft, D.Z.; writing—review and editing, K.Z.; funding acquisition, Y.Z.; Y.Y. All authors have read and agreed to the published version of the manuscript.

Funding

This research was funded by the State Key Laboratory of Water Resource Protection and Utilization in Coal Mining, GJNY-21-41-17; National Natural Science Foundation of China, 52004012; State Key Laboratory of Water Resource Protection and Utilization in Coal Mining, SHGF–16–25.

Institutional Review Board Statement

Not applicable.

Informed Consent Statement

Not applicable.

Data Availability Statement

The date that support the findings of this study are available from the corresponding author upon reasonable request.

Acknowledgments

Dongxiao Zhang was supported by the State Key Laboratory of Water Resource Protection and Utilization in Coal Mining, GJNY-21-41-17. Yingming Yang was supported by the National Natural Science Foundation of China, 52004012. Yongqiang Zhao was supported by the State Key Laboratory of Water Resource Protection and Utilization in Coal Mining, SHGF–16–25.

Conflicts of Interest

The authors declare no conflict of interest.

References

  1. Li, Q.; Ju, J.; Cao, Z.; Xu, J.; Zhao, F. Detection of the self-healing characteristics of mining fractured rock mass after 10 years of underground coal mining: A case study of Wanli Coal Mine Shendong mining area. J. China Coal Soc. 2021, 46, 1428–1438. [Google Scholar]
  2. Guo, W.; Zhao, T.; Tan, Y.; Yu, F.; Hu, S.; Yang, F. Progressive mitigation method of rock bursts under complicated geological conditions. Int. J. Rock Mech. Min. Sci. 2017, 96, 11–22. [Google Scholar] [CrossRef]
  3. Shah, K.S.; Hashim, M.H.B.M.; Rehman, H.; Ariffin, K.S.B. Evaluating microscale failure response of various weathering grade sandstones based on micro-scale observation and micro-structural modelling subjected to wet and dry cycles. J. Min. Environ. 2022, 13, 341–355. [Google Scholar] [CrossRef]
  4. Claudia, B.; Caterina, C.; Giovanni, P.; Vimalathithan, P.K. Application of different acoustic emission descriptors in damage assessment of fiber reinforced plastics: A comprehensive review. Eng. Fract. Mech. 2020, 235, 107083. [Google Scholar]
  5. Tan, Y.; Guo, W.; Zhao, T.; Meng, X. Coal rib burst mechanism in deep roadway and “stress relief-support reinforcement” synergetic control and prevention. J. China Coal Soc. 2020, 45, 66–81. [Google Scholar]
  6. Li, H.; Wang, W.; Qi, Q.; Zhang, L. Study on crack development rule of overlying strata influenced by mining based on fractal theory. J. China Coal Soc. 2014, 39, 1070–1076. [Google Scholar]
  7. Qiu, S.; Feng, X.; Zhang, C.; Yang, J. Experimental research on mechanical properties of deep marble under different initial damage levels and unloading paths. Chin. J. Mech. Eng. 2012, 31, 1686–1697. [Google Scholar]
  8. Whittles, D.; Reddish, D.; Lowndes, I. The development of a coal measure classification (CMC) and its use for prediction of geomechanical parameters. Int. J. Rock Mech. Min. Sci. 2007, 44, 496–513. [Google Scholar] [CrossRef]
  9. Hudson, J.A.; Harrison, J.P. Engineering Rock Mechanics: An Introduction to the Principles; Pergamon Press: New York, NY, USA, 1997; pp. 101–123. [Google Scholar]
  10. Harrison, J.P.; Hudson, J.A. Engineering Rock Mechanics Part II: Illustrative Worked Examples; Pergamon Press: New York, NY, USA, 2000; pp. 28–45. [Google Scholar]
  11. Barbato, J.; Hebblewhite, B.; Mitra, R.; Mills, K. Prediction of horizontal movement and strain at the surface due to longwall coal mining. Int. J. Rock Mech. Min. Sci. 2016, 84, 105–118. [Google Scholar] [CrossRef]
  12. Cao, W.; Zhang, S.; Zhao, M. Study on statistical damage constitutive model of rock based on new definition of damage. Rock Soil Mech. 2006, 27, 41–46. [Google Scholar]
  13. Vivanco, F.; Melo, F. The effect of rock decompaction on the interaction of movement zones in underground mining. Int. J. Rock Mech. Min. Sci. 2013, 60, 381–388. [Google Scholar] [CrossRef]
  14. Xie, H.; Ju, Y.; Dong, Y. Research on plastic modulus method for classical damage mechanical definition. Mech. Prac. 1997, 19, 2–6. [Google Scholar]
  15. Sun, Y.; Zuo, J.; Karakus, M.; Wang, J. Investigation of movement and damage of integral overburden during shallow coal seam mining. Int. J. Rock Mech. Min. Sci. 2019, 117, 63–75. [Google Scholar] [CrossRef]
  16. Thongprapha, T.; Fuenkajorn, K.; Daemen, J.J.K. Study of surface subsidence above an underground opening using a trap door apparatus. Tunn. Undergr. Space Technol. 2015, 46, 94–103. [Google Scholar] [CrossRef]
  17. Jin, F.; Jiang, M.; Gao, X. Defining damage variable based on energy dissipation. Chin. J. Mech Eng. 2004, 23, 1976–1980. [Google Scholar]
  18. Deng, J.; Gu, D. On a statistical damage constitutive model for rock materials. Comput. Geosci. 2011, 37, 122–128. [Google Scholar] [CrossRef]
  19. Ju, Y.; Xie, H.P. Applicability of damage variable definition based on hypothesis of strain equivalence. J. Coal Sci. Eng. 2000, 6, 9–14. [Google Scholar]
  20. Liu, X.; Ning, J.; Tan, Y.; Gu, Q. Damage constitutive model based on energy dissipation for intact rock subjected to cyclic loading. Int. J. Rock Mech. Min. Sci. 2016, 85, 27–32. [Google Scholar] [CrossRef]
  21. Liu, Q.; Xu, J.; Liu, X.; Jiang, J.; Liu, B. The role of flaws on crack growth in rock-like material assessed by AE technique. Int. J. Fract. 2015, 193, 99–115. [Google Scholar] [CrossRef]
  22. Bombolakis, E.G. Photoelastic study of initial stages of brittle fracture in compression. Tectonophysics 1968, 6, 461–473. [Google Scholar] [CrossRef]
  23. Yang, S. Crack coalescence behavior of brittle sandstone samples containing two coplanar cracks in the process of deformation failure. Eng. Fract. Mech. 2011, 78, 3059–3081. [Google Scholar] [CrossRef]
  24. Yang, S. Study of strength failure and crack coalescence behavior of sandstone containing three pre-existing cracks. Rock Soil Mech. 2013, 34, 31–39. [Google Scholar]
  25. Richard, B.; Ragueneau, F. Continuum damage mechanics based model for quasi brittle materials subjected to cyclic loadings: Formulation, numerical implementation, and applications. Eng. Fract. Mech. 2013, 98, 383–406. [Google Scholar] [CrossRef]
  26. Bobet, A.; Einstein, H.H. Fracture coalescence in rock-type materials under uniaxial and biaxial compression. Int. J. Rock Mech. Min. Sci. 1998, 35, 863–888. [Google Scholar] [CrossRef]
  27. Yang, Y.; Wang, D.; Guo, M.; Li, B. Study of rock damage characteristics based on acoustic emission tests under triaxial compression. Chin. J. Mech. Eng. 2014, 33, 98–104. [Google Scholar]
  28. Chai, M.; Hou, X.; Duan, Q. Identification and prediction of fatigue crack growth under different stress ratios using acoustic emission data. Int. J. Fatigue 2022, 160, 106860. [Google Scholar] [CrossRef]
  29. Shi, S.; Han, Z.; Liu, Z.; Vallely, P.; Soua, S.; Kaewunruen, S.; Papaelias, M. Quantitative monitoring of brittle fatigue crack growth in railway steel using acoustic emission. Proc. Inst. Mech. Eng. Part F J. Rail Rapid Transit 2018, 232, 1211–1224. [Google Scholar] [CrossRef]
  30. Ma, L.; Khan, N.M.; Cao, K.; Rehman, H.; Salman, S.; Rehman, F.U. Prediction of sandstone dilatancy point in different water contents using infrared radiation characteristic: Experimental and machine learning approaches. Lithosphere 2021, 2021, 3243070. [Google Scholar] [CrossRef]
  31. Chen, L.; Guo, W.; Zhang, D.; Zhao, T. Experimental study on the influence of prefabricated fissure size on the directional propagation law of rock type-I crack. Int. J. Rock Mech. Min. Sci. 2022, 160, 105274. [Google Scholar] [CrossRef]
  32. Xu, Y.; Li, C.; Zheng, Q.; Ni, X.; Wang, Q. Analysis of energy evolution and damage characteristics of mudstone under cyclic loading and unloading. Chin. J. Mech. Eng. 2019, 38, 1172–1183. [Google Scholar]
  33. Wang, C.; Zhan, S.; Xie, M.; Wang, C.; Cheng, L.; Xiong, Z. Damage characteristics and constitutive model of deep rock under frequent impact disturbances in the process of unloading high static stress. Complexity 2020, 2020, 2706091. [Google Scholar] [CrossRef]
  34. Khan, N.M.; Ahmad, M.; Cao, K.; Ali, I.; Liu, W.; Rehman, H.; Hussain, S.; Rehman, F.U.; Ahmed, T. Developing a new bursting liability index based on energy evolution for coal under different loading eates. Sustainability 2022, 14, 1572. [Google Scholar] [CrossRef]
  35. Zhang, H.; Meng, X.; Liu, X. Establishment of constitutive model and analysis of damage characteristics of frozen-thawed rock under load. Arab. J. Geosci. 2021, 14, 1277. [Google Scholar] [CrossRef]
Figure 1. Project location map and prefabricated crack specimens.
Sustainability 15 00555 g001
Figure 2. Schematic diagram of energy calculation under cyclic loading-unloading conditions.
Sustainability 15 00555 g002
Figure 3. Test system and scheme.
Sustainability 15 00555 g003
Figure 4. Evolution law of cumulative dissipated energy and damage degree.
Sustainability 15 00555 g004
Figure 5. Stress-strain curves of prefabricated crack specimens during loading–unloading process; (a) D = 7.70%; (b) D = 25.18%.
Sustainability 15 00555 g005
Figure 6. Stress-strain curves of damaged specimens.
Sustainability 15 00555 g006
Figure 7. Peak strength evolution law of damaged specimens.
Sustainability 15 00555 g007
Figure 8. Elastic modulus evolution law of damaged specimens.
Sustainability 15 00555 g008
Figure 9. Peak strain evolution law of damaged specimens.
Sustainability 15 00555 g009
Figure 10. P-wave velocity evolution law of damaged specimens.
Sustainability 15 00555 g010
Figure 11. AE count evolution law of damaged specimens; (a) D = 0%; (b) D = 2.75%; (c) D = 7.70%; (d) D = 15.37%; (e) D = 25.18%; (f) D = 37.60%; (g) D = 52.96%; (h) D = 69.87%; (i) D = 89.40%.
Sustainability 15 00555 g011
Figure 12. AE energy evolution law of damaged specimens; (a) D = 0%; (b) D = 2.75%; (c) D = 7.70%; (d) D = 15.37%; (e) D = 25.18%; (f) D = 37.60%; (g) D = 52.96%; (h) D = 69.87%; (i) D = 89.40%.
Sustainability 15 00555 g012
Figure 13. Crack types.
Sustainability 15 00555 g013
Figure 14. Failure pattern of damaged sandstone specimens; (a) D = 0%; (b) D = 2.75%; (c) D = 7.70%; (d) D = 15.37%; (e) D = 25.18%; (f) D = 37.60%; (g) D = 52.96%; (h) D = 69.87%; (i) D = 89.40%.
Sustainability 15 00555 g014aSustainability 15 00555 g014b
Figure 15. Failure pattern of prefabricated crack specimens; (a) T-1; (b) T-2; (c) T-3; (d) T-4; (e) S-1; (f) S-2; (g) T-S-1; (h) T-S-2.
Sustainability 15 00555 g015
Figure 16. Schematic diagram of energy calculation under uniaxial compression.
Sustainability 15 00555 g016
Figure 17. Energy evolution process of damaged specimens under uniaxial compression; (a) D = 15.37%; (b) D = 69.87%.
Sustainability 15 00555 g017
Figure 18. Energy density evolution law of damaged specimens.
Sustainability 15 00555 g018
Figure 19. Evolution law of dissipated energy proportion.
Sustainability 15 00555 g019
Figure 20. Schematic diagram of failure mechanism of damaged rock.
Sustainability 15 00555 g020
Figure 21. Schematic diagram of fracture grouting in different damage zones of overburden.
Sustainability 15 00555 g021
Table 1. Basic mechanical parameters of kern stone.
LithologyDensity
(g·cm–3)
Uniaxial Compressive Strength
(MPa)
Elastic
Modulus
(GPa)
Tensile Strength
(MPa)
Wave
(m∙s−1)
Wave
(m∙s−1)
Sandstone2.3628.423.125.052047.451283.60
Table 2. Energy evolution during cyclic loading-unloading process.
Number of Cyclesui (MJ∙mm−3)uie (MJ∙mm−3)uid (MJ∙mm−3)Cumulative uid (MJ∙mm−3)Damage Degree (%)
10.002240.000900.001340.001341.03%
20.005410.003190.002220.003562.75%
30.008890.006190.002700.006264.83%
40.013980.010260.003720.009987.70%
50.018640.014360.004280.0142611.00%
60.026140.020300.005660.0199215.37%
70.029610.023950.005840.0257619.88%
80.036350.029480.006870.0326325.18%
90.042800.035140.007660.0402931.09%
100.049800.041370.008430.0487237.60%
110.057830.048300.009530.0582544.95%
120.065390.055010.010380.0686352.96%
130.069180.058420.010760.0793961.26%
140.078790.067230.011160.0905569.87%
150.081370.070210.011560.1021178.79%
160.093710.079970.013740.1158589.40%
170.105510.091770.013740.12959100.00%
Table 3. Specimen numbers and damage degree.
Specimen
Number
Density (g·cm–3)P-Wave (m∙s−1)Number of CyclesDamage Degree (%)
R-12.341326.7900.00
R-22.441358.6422.75
R-32.401318.9147.70
R-42.221391.38615.37
R-52.481518.64825.18
R-62.341418.911037.60
R-72.431321.381252.96
R-82.481298.641469.87
R-92.371339.941689.40
Disclaimer/Publisher’s Note: The statements, opinions and data contained in all publications are solely those of the individual author(s) and contributor(s) and not of MDPI and/or the editor(s). MDPI and/or the editor(s) disclaim responsibility for any injury to people or property resulting from any ideas, methods, instructions or products referred to in the content.

