Article

Rational Allocation of Water Resources in the Arid Area of Northwestern China Based on Numerical Simulations

1
Institute of Hydrogeology and Environmental Geology, Chinese Academy of Geological Sciences, Shijiazhuang 050061, China
2
Key Laboratory of Groundwater Sciences and Engineering, Ministry of Natural Resources, Shijiazhuang 050061, China
3
Chongqing Jiangshan Hydropower Construction Engineering Survey and Design Consulting Co., Ltd., Chongqing 400000, China
*
Author to whom correspondence should be addressed.
Sustainability 2023, 15(1), 55; https://doi.org/10.3390/su15010055
Submission received: 21 November 2022 / Revised: 15 December 2022 / Accepted: 16 December 2022 / Published: 21 December 2022

Abstract

:
Adding a series of surface-water transfer projects still cannot solve the current water shortages in the arid area of northwestern China. Selecting a rational allocation plan for the water resources is the key to coordinating water use for the national economy and ecological environment. In this study, taking the Wuwei Basin as the study area, long-term data of source-sink terms from 2007 to 2018 were analyzed. Following the calibration and validation of the numerical simulation model of the groundwater system, the data was highly fitted. Based on this model, the groundwater system balance, water level variations, and suitable ecological water level area in 2050 under four water resource allocation plans were compared. Under plan 4, the groundwater resources change from an average decrease of 7656.4 × 104 m3·yr−1 from 2007 to 2018, to an increase of 4624.6 × 104 m3·yr−1 in 2050, which means the groundwater systems are almost in a positive balance state. Compared with 2018, the water level with small groundwater depth drops by 2.2–5.7 m, while that with large groundwater depths steadily rises by 2.7–8.6 m. In addition, it can maintain the 9 km2 natural oasis wetland area and the 116 km2 well-growing natural vegetation area, which can effectively promote the benign evolution and efficient, balanced sustainable development of the regional water resources, economy, and ecological environment.

1. Introduction

Groundwater is a critical resource for people, economies, and the environment [1]. Groundwater has been estimated to provide almost half of all drinking water worldwide with 2.5 billion people depending solely on this resource to satisfy their daily needs for water [2,3] and to supply 40% of global irrigation [4]. Groundwater pumping has facilitated significant social sustainable development critical to poverty alleviation and economic growth, enhanced food security, and alleviated risks from drought in many farming regions [5,6].
Northwestern China generally has a dry climate with low precipitation. The per capita water resources and per square kilometer water resources are 731 m3·person−1 and 42 × 104 m3·km−2, which are 35% and 20% of the national average, respectively [7]. The scarcity of water resources is much higher than that in other regions of China [8]. The annual average precipitation in the Wuwei Basin of the Shiyang River Basin is 165.4 mm and the average evaporation is 2100 mm. The Shiyang River Basin has a typical inland arid climate [9]. As a reliable, local, reserved water resource, groundwater resources are essential for irrigated agriculture in northwestern China [10]. Affected by changes in the natural environment and by human activities, the groundwater level in the Shiyang River Basin has dropped significantly in recent decades [11,12,13]. This lower groundwater level has resulted in a series of ecological and environmental problems such as water quality deterioration, vegetation decline, land desertification, and a decrease in the area of the spring water overflow zone [14]. A series of water transfer projects, including the water transfer from the Yellow River to the Jingdian phase II project and the water transfer from the upstream Xiying River, have been carried out in this basin since 2001. In addition, the water transfer from the Datong River to the Qinwangchuan Basin project is in the planning stage [9]. The changes in the water supply and the water use pattern have inevitably led to changes in the groundwater recharge and discharge processes, the hydrological dynamics, and the evolution trend of the water cycle.
The rational allocation of water resources in the Wuwei Basin’s irrigated areas in the Shiyang River Basin is a key aspect of the rational allocation of water resources in the basin [15]. The circulation and transformation of the water resources directly affects the entire basin, especially the ecological restoration of the downstream Minqin Basin [16]. Coordinating the relationship between the national economic water use and eco-environmental water use in the process of sustainable development and achieving the optimal allocation and efficient utilization of water resources in irrigated areas are of great significance to promoting local socio-economic sustainable development and eco-environmental protection and for realizing the effective regulation of sustainable development and utilization of water resources [7,17,18]. Under the severe water resource shortage in irrigated areas, determining how to achieve the optimal allocation of water resources in irrigated areas to maximize their benefits and ensure food security is of particular importance [17,19]. At present, research on the optimal allocation of water resources in arid inland areas has mainly focused on the water-related ecological issues in the sustainable development and utilization of water resources [20]. Water resource allocation has gradually developed from water volume allocation to comprehensive regulation and control of the river basin’s water volume, while considering the needs of the economy, environment, and ecology [21,22]. Moreover, study of water resource allocation has been diversified [23,24,25,26]. When water resource allocation research was conducted on different units (such as irrigated areas) in the past, it was usually adjusted according to the possible water demand of each unit [27,28,29]. However, the groundwater flow system is controlled by the aquifer system’s structure and is in a dynamic balance [30]. The irrigated area with canals and wells is a complex hydrological system. The water resource allocation is constrained by the amount of groundwater resources. In addition, the spatiotemporal pattern of the sustainable development and utilization of the water resource affects the spatiotemporal recharge and discharge relationship of the groundwater, which changes the spatial distribution of the groundwater resources [31,32]. Therefore, only considering the water demand of irrigated areas in water resource allocation research cannot truly achieve the objective of efficient, balanced, and reasonable utilization of water resources.
As a conjunctive water resource management and sustainable development tool, numerical models of groundwater flow can be used to manage water resources in irrigated areas with complex hydraulic connections to achieve optimal water resource allocation [33,34,35,36,37]. Taking the plain area of the Wuwei Basin in the Shiyang River Basin as the study area, and based on the modular three-dimensional finite-difference groundwater flow (MODFLOW) module in the groundwater modeling system (GMS) software and combined with long term data of precipitation, evaporation, spring water overflow, artificial exploitation, irrigation leakage, and lateral exchange amount from 2007 to 2018, a groundwater flow numerical model of the phreatic aquifer in the Wuwei Basin was established in this study. A variety of water resource allocation plans were formulated in combination with the water demand of the irrigated areas and surface-water transfer planning. The differences in the groundwater balance state, groundwater level dynamics, and ecologically suitable growth range of each irrigated area under the different plans were comprehensively compared. Moreover, the best water resource allocation plan was identified to provide strong data support and technical support for local water-use planning.

2. Materials and Methods

2.1. Study Area

As an agricultural irrigation basin with a long history, the Wuwei Basin in the Shiyang River Basin is located in the northern foothills of the Qilian Mountains, in the eastern section of the Hexi Corridor, and surrounded by the Tengger Desert and Badain Jaran Desert to the east, west, and north (Figure 1). The Wuwei Basin contains extremely thick Pliocene and Quaternary strata, with a thickness greater than 1 km. In the southern piedmont, the lithology consists of a set of extremely thick and single gravel layers that gradually change to a multi-layer interbedded structure of sand, gravel sand, gravel, sandy soil, and loam toward the northern part of the basin. The rocks are poorly sorted and locally distributed with muddy calcareous semi-colluvium. There is a single diving system with a large thickness in the south that transitions to a diving-confined water system toward the north. The groundwater generally flows from south to north [38]. The Wuwei Basin is located in the middle reaches of the Shiyang River. The groundwater recharge sources include atmospheric precipitation, river channels and canal leakage, surface-water irrigation infiltration, groundwater irrigation return flow, and the lateral inflow from the gullies in the Qilian Mountains. Overall, river channels and canal leakage, surface-water irrigation infiltration, and groundwater irrigation return flow account for 61% of the total recharge. The piedmont runoff recharge accounts for 34% of the total recharge. The discharge terms are composed of artificial exploitation, phreatic evaporation, spring water overflow, and lateral outflow. Artificial exploitation, which is the main discharge term, accounts for 88% of the total discharge. In 2018, the groundwater exploitation of the Wuwei Basin was 55,680.3 × 104 m3 yr−1, and a total of 83,010.0 × 104 m3 yr−1 of surface water was transported to the Wuwei Basin through the water transfer project. This included 5822.4 × 104 m3·yr−1 of water for domestic use, 12,489.1 × 104 m3·yr−1 for industrial use (which accounted for 13.2% of the total water supply), and 120,378.7 × 104 m3 of water for agricultural and ecological irrigation, accounting for 86.8% of the total water supply. Agricultural and ecological irrigation water is the main body of the local water use, and the core of rational water resource allocation [17,39]. Thus, water use in these two domains is the focus of this paper. There were 11 irrigated areas in the entire region. Six irrigated areas in the piedmont of the southern Qilian Mountains (Donghe, Xiying, Jinta, Zamu, Huangyang, and Gulang) have been added through surface-water transfer projects such as river channels and canal systems, which have greatly alleviated the local groundwater shortages (Figure 1).
The Wuwei Basin is bounded by the Qilian Mountain piedmont fault to the south, the Tengger Desert groundwater ridge to the east, the southern Hongya Mountain piedmont fault to the north, and the buried water blocking fault between the Wuwei Basin and Yongchang Basin to the west, forming a relatively independent and complete groundwater flow system with an area of about 3630 km2. Based on the structural and hydrodynamic characteristics of the groundwater system, it can be generalized as a unified phreatic aquifer system. The southern and western areas of the study area generate subsurface flow recharge through the piedmont fault and buried fault, which can be defined as a Class II boundaries (recharge boundaries). Defined as zero flow boundaries, the eastern and northern boundaries are nearly perpendicular to the water table contour with almost no water exchange. The groundwater flow in this area can be generalized as a planar heterogeneous, isotropic, unstable groundwater flow system.

2.2. Model and Data

The mathematical model of the groundwater flow system in the Wuwei Basin can be expressed as follows:
x K h B h x + y K h B h y + W b W p = μ h t h x , y , t | t = 0 = h 0 x , y , t 0   x , y D K   h B h n | Γ 2 = q x , y , t     x , y D , t > 0
where x, y represent the two-dimensional spatial coordinates (m); K is the permeability coefficient of the phreatic aquifer (m·d−1); h is the elevation of the groundwater level (m); B is the elevation of the phreatic aquifer’s floor (m); t is the time corresponding to the elevation of the groundwater level (d); h0 is the elevation of the initial groundwater level (m); μ is the aquifer’s water yield (dimensionless); Wb is the strength sum of the vertical recharge terms (m3·m−2·d−1); Wp is the strength sum of the vertical discharge terms (m3·m−2·d−1); q is the Class II boundary unit width flow (m3·m−1·d−1); Г2 is the Class II boundary code; and n is the normal direction within the boundary.

2.2.1. Model Introduction

The GMS software is a visual groundwater numerical simulation software composed of a variety of modules. The version and function are constantly updated and improved. Moreover, GMS has a stronger data processing function and a wider application range, which makes it superior to other similar groundwater simulation software packages [40].

2.2.2. Model Data Processing

The meteorological data collected in Wuwei were downloaded from the data management platform of the National Meteorological Administration [41]. The monthly precipitation and evaporation data from 2007 to 2018 were used.
The groundwater exploitation, surface-water transfer, and exploitation well distribution in the study area were divided into irrigated areas. The statistics of the water consumption for domestic, industrial, agricultural, and ecological irrigation were computed from 2007 to 2018. The amount of surface water transported was approximately 49,216.0 × 104 m3·yr−1. The amount of surface water transported to Xiying was the largest (approximately 12,087.2 × 104 m3·yr−1). The amount of surface water transported to Gulang was the smallest (approximately 3106.1 × 104 m3·yr−1). The groundwater exploitation in the study area was approximately 44,438.3 × 104 m3·yr−1. Qinghe and Qingyuan had the largest exploitation, at approximately 11,892.6 × 104 m3·yr−1 and 11,014.3 × 104 m3·yr−1, respectively. There were more than 7200 exploitation wells in the study area. Yongchang and Qinghe contained the most exploitation wells, with more than 1200 wells.
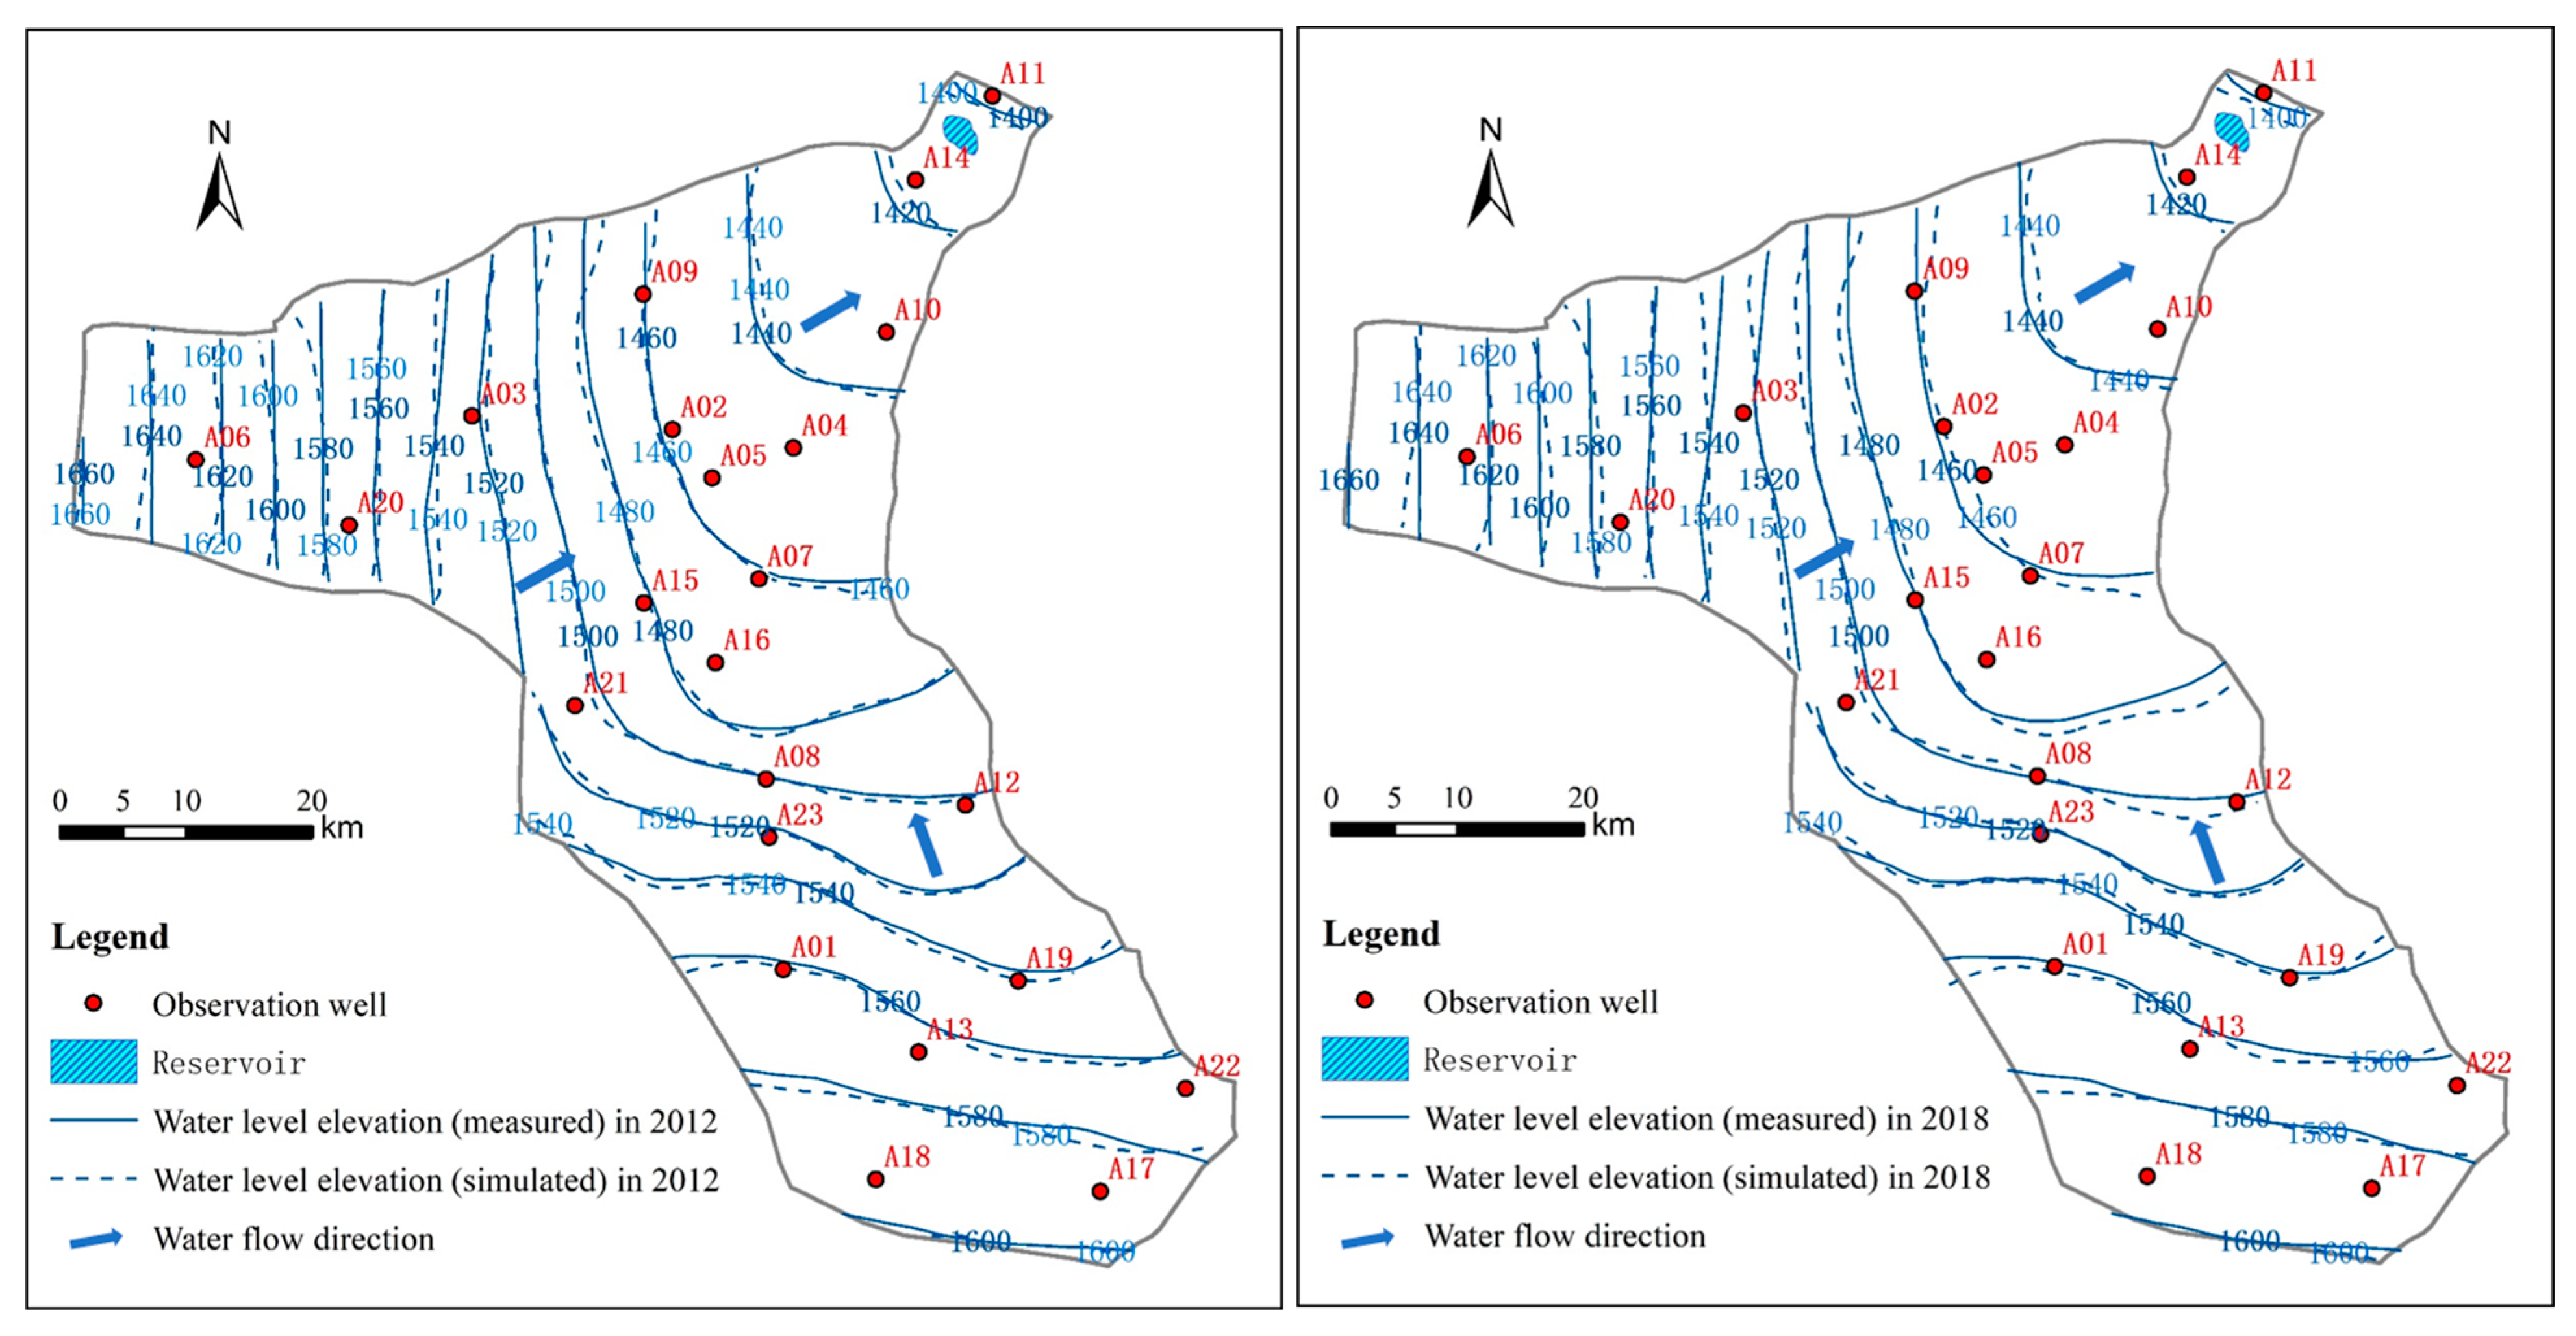
The study area was divided into a rectangular grid, with 1000 m × 1000 m cells. There were 97 rows and 98 columns in total, with 3771 effective cells. The recharge (RCH), evaporation (EVT), well (WEL), general head boundary (GHB), and drain (DRN) modules in the GMS software were used to deal with the source-sink terms. The MODFLOW numerical groundwater flow model was established. The groundwater flow field in January 2007 was used as the initial flow field. The calibration stage of the model was from January 2007 to December 2012. The validation stage of the model was from January 2013 to December 2018. There were 23 long-term observation wells in the study area (well numbers: A01–A23, Figure 2), and they all belong to the same unified phreatic aquifer. The observation frequency was once a month. The data were used to draw the groundwater flow field maps for the Wuwei Basin in 2007, 2012, and 2018, which were defined as the flow fields in the initial, late calibration, and late validation stages in this study, respectively. The fitting of the groundwater flow field can be grasped and controlled based on the entire area. The measured water levels in the observation wells from 2007 to 2018 were compared with those simulated using the model to test the simulation’s fitting accuracy.
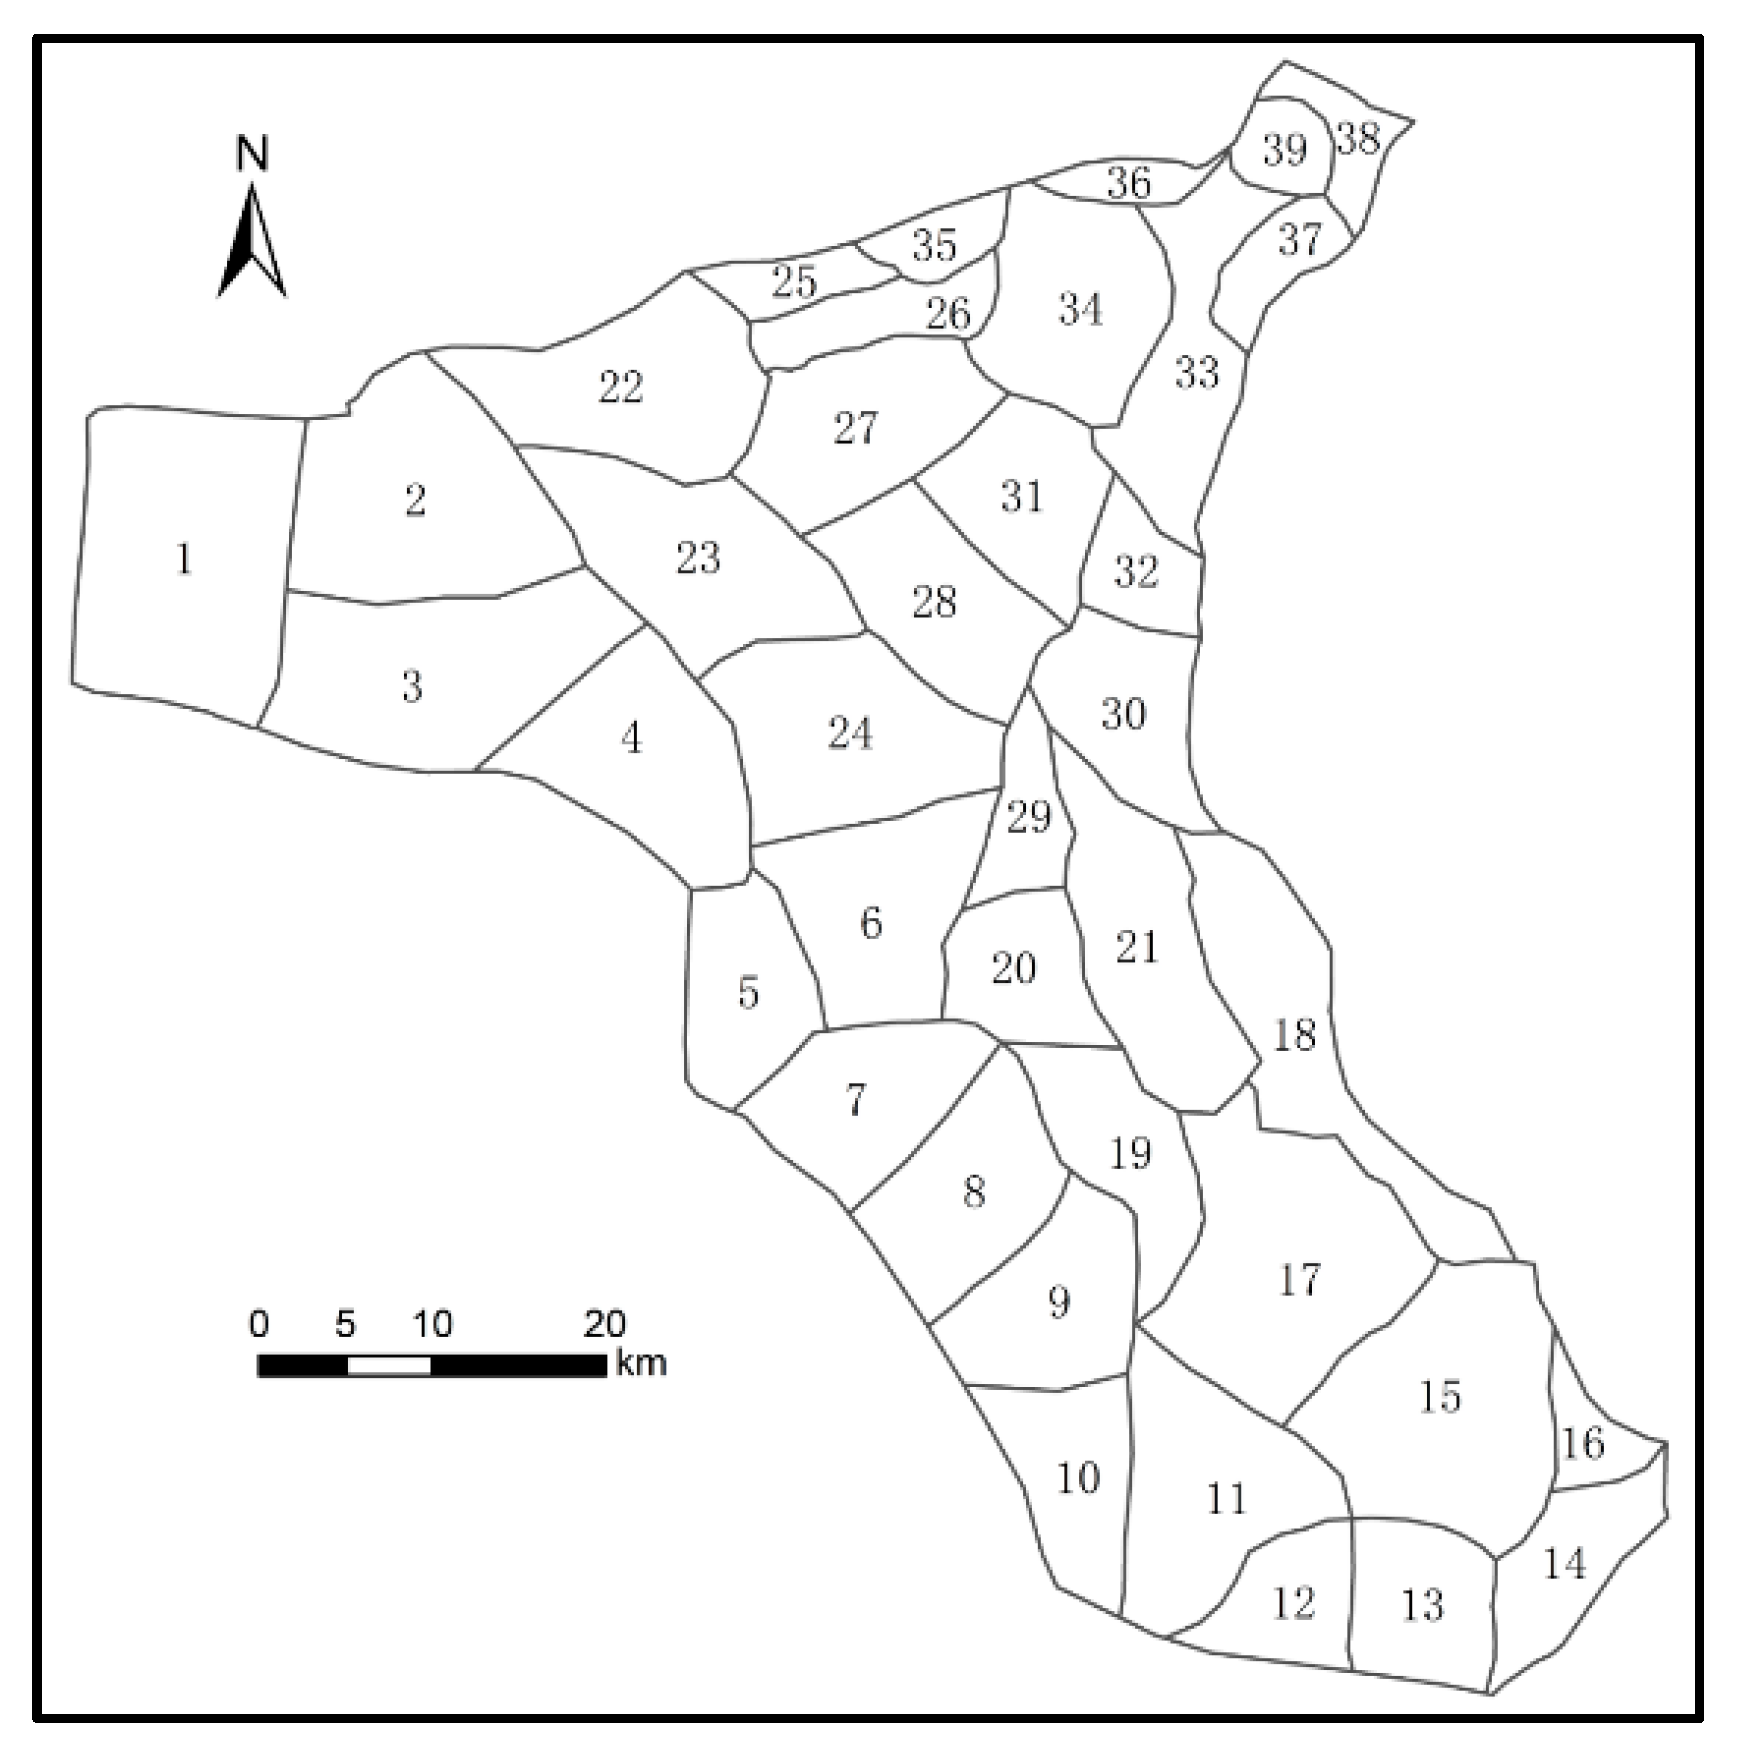
Based on a large number of hydrogeological drilling and pumping tests carried out in previous studies, as well as the stratigraphic boundaries, aquifer lithology, particle size, and cementation degree, the study area was preliminarily divided into 39 hydrogeological parameter zones [42]. In addition, the initial values were given (k, μ). By adjusting the hydrogeological parameters and Class II boundary flow, the difference between the water levels simulated using the model and the measured water levels was minimized to obtain the best fitting effect.

3. Results and Discussion

3.1. Model Calibration and Validation

In the model calibration stage, the difference between the measured water levels in typical observation wells A05, A06, A11, and A13 and the dynamic curve of the simulated water level was small. The change trend was basically the same. In addition, there was no significant trend of error accumulation and expansion in the validation stage (Figure 3). According to the statistics of the measured water levels and simulated water levels for 23 observation wells, the mean value of the residual error of the water level was 0.73 m, and the correlation coefficient was 0.997. Certain measured values deviated from the simulated values within the 95% confidence interval. The measured groundwater flow field was highly fitted with the simulated flow field (Figure 2). Therefore, the established numerical groundwater flow model has a high simulation ability and calculation accuracy, and it can truly reflect the dynamic characteristics of the aquifer system in the study area. The hydrogeological parameters determined through inversion are reliable. The results can be used for dynamic prediction of the groundwater system. The results of the adjusted reasonable hydrogeological parameters are shown in Figure 4 and Table 1.

3.2. Water System Balance Analysis

3.2.1. Recharge and Discharge Items Analysis

Using the budget module in GMS, the water balances of the study area and various irrigated areas were calculated. From 2007 to 2018, the amount of annual average recharge in the study area was as follows: the lateral inflow, precipitation and reservoir infiltration, river channels and canal leakage, surface-water irrigation infiltration, and groundwater irrigation return flow were 18,526.1 × 104 m3·yr−1, 2879.8 × 104 m3·yr−1, 15,219.6 × 104 m3·yr−1, 3694.5 × 104 m3·yr−1, and 14,298.6 × 104 m3·yr−1, accounting for 33.9%, 5.3%, 27.9%, 6.8%, and 26.2% of the total recharge, respectively. The amount of annual average discharge was as follows: the lateral outflow groundwater exploitation, spring water overflow, and evaporation were 603.0 × 10⁴ m3·yr−1, 55,044.3 × 104 m3·yr−1, 5596.7 × 104 m3·yr−1, and 1030.9 × 104 m3·yr−1, accounting for 1.0%, 88.4%, 9.0%, and 1.7% of the total discharge, respectively. The lateral inflow and outflow in the study area generally little changed under the control of the large formation fault and the regional aquifer system. The precipitation and reservoir infiltration, evaporation, and spring water overflow were small and had little impact on the water balance of the groundwater flow system. The surface-water irrigation, groundwater exploitation, and the resulting infiltration and leakage were the key factors controlling the spatial distribution of the groundwater resources.
Ding also used numerical simulation of groundwater flow to calculate the groundwater balance of the Wuwei Basin [38]. Rich and detailed data were adopted in the report; therefore, the results of the report were representative and authoritative. In the report, the amount of groundwater recharge in 1999 was as follows: piedmont runoff recharge from the Qilian Mountains, precipitation infiltration, total of river channels and canal leakage, surface-water irrigation infiltration, and groundwater irrigation return flow were 20,711.4 × 104 m3, 1913.4 × 104 m3 (the precipitation in 1999 was 178 mm), and 31,734.8 × 104 m3, accounting for 38.1%, 3.5%, and 58.4% of the total recharge, respectively. The amount of groundwater discharge was as follows: groundwater exploitation, spring overflow, and evaporation were 68,946.9 × 104 m3, 7869.2 × 104 m3, 3362.7 × 104 m3, accounting for 80.0%, 9.1%, and 10.9% of the total discharge, respectively.
The groundwater recharge in 1999 was compared with the multi-year average recharge from 2007 to 2018 (later referred to as “recent years”). The piedmont runoff recharge from the Qilian Mountains decreased by 2185.3 × 104 m3 in recent years. This was a result of the uncontrolled water use in the upper reaches of the Shiyang River Basin, which caused the groundwater level to drop and the lateral runoff recharge capacity to weaken. Precipitation infiltration was influenced by the precipitation of the current year. The average precipitation in recent years was 195.7 mm, and the infiltration of precipitation increased slightly. The total amount of river channels and canal leakage, surface-water irrigation infiltration, and groundwater irrigation return flow was 34,002.0 × 104 m3, an increase of 2267.2 × 104 m3 compared with the amount in 1999. This was due to the continued delivery of large amounts of surface water in recent years, resulting in increased river channels and canal leakage, and surface-water irrigation infiltration.
Comparing the average discharge in recent years with the amount in 1999, groundwater exploitation decreased by 13,902.5 × 104 m3, about accounting for 20.2%. This was due to the transported surface water, moderating the local water demand, as well as the groundwater exploitation restriction plane in the local area. Evaporation and spring overflow decreased by 2331.7 × 104 m3 and 2272.5 × 104 m3, respectively. This was because with the massive exploitation of groundwater, the water level dropped significantly, resulting in a gradual reduction in the area where the groundwater depth was less than the ultimate evaporation depth of groundwater (5 m), and the spring overflow also shrank.

3.2.2. Irrigated Area Water Balance Analysis

The average annual reduction in groundwater resources in the study area was 7656.4 × 104 m3·yr−1 from 2007 to 2018. The groundwater system was in an overexploited state. The overexploitation of groundwater was the most severe in the Qinghe irrigated area. The loss of groundwater resources was 4714.6 × 104 m3·yr−1. The second-most severe overexploitation occurred in the Qingyuan irrigated area, with a loss of 2130.6 × 104 m3·yr−1. The groundwater in the Yongchang, Jinyang, Gulang, and Donghe irrigated areas also exhibited a negative balance, with a loss of 206.3 × 10⁴–1198.9 × 104 m3·yr−1. In contrast, the groundwater in the Zamu, Xiying, Jinta, Huangyang, and Huanhe irrigated areas exhibited a positive balance with the groundwater resource reserves increasing by 83.5 × 10⁴–766.5 × 10⁴ m3·yr−1 in these areas.
The groundwater systems of the four irrigated areas in front of the Qilian Mountains (Zamu, Xiying, Jinta, and Huanyang) were in positive balance. The water resources for these irrigated areas included groundwater and transported surface water. The amount of river channels and canal leakage, surface-water irrigation infiltration, and groundwater irrigation return flow was 2030.4 × 104~6370.4 × 104 m3·yr−1. In the case of subtracting artificial exploitation, groundwater systems increased 573.0 × 10⁴~2948.0 × 104 m3·yr−1. These irrigated areas also received the piedmont runoff recharge from the Qilian Mountains, with a multi-year average recharge of 1219.0 × 104~2713.4 × 104 m3·yr−1. The groundwater depth of Huanhe was small, and groundwater exploitation was 1914.0 × 104 m3·yr−1. With the combination of precipitation infiltration, reservoir seepage, and lateral runoff recharge from adjacent irrigated areas, the groundwater system of Huanhe was also in positive balance.
Gulang and Donghe also received piedmont runoff recharge from the Qilian Mountains and transported surface water. However, due to the influence of a large topographic slope, Gulang and Donghe produced larger surface runoff to the north and east. According to the calculation, the total amounts of piedmont runoff recharges from the Qilian Mountains, river channels and canal leakage, and surface-water irrigation infiltration were 2676.2 × 104 m3·yr−1 and 10,228.3 × 104 m3·yr−1, respectively, and the discharges to adjacent irrigated areas were 2698.9 × 104 m3·yr−1 and 9881.7 × 104 m3·yr−1, respectively. Together with the effect of groundwater exploitation, Gulang and Donghe were in negative balance.
The rest four irrigated areas (Qinghe, Qingyuan, Yongchang, and Jinyang) were in negative balance, mainly because these irrigated areas did not receive transported surface water and all relied on local groundwater extraction. According to the calculation, groundwater exploitation accounted for 47.5% to 78.8% of the total discharge. Among them, Qinghe and Qingyuan got the largest amount of exploitation, which were 11,892.6 × 104 m3·yr−1 and 11,014.3 × 104 m3·yr−1 respectively. Therefore, the losses of Qinghe and Qingyuan were also the biggest, which were 4714.6 × 104 m3·yr−1 and 2130.6 × 104 m3·yr−1 respectively.

3.3. Water Resource Allocation plans

To reasonably plan the water resource allocation in the study area, the spatial distribution of the groundwater resources was adjusted in each irrigated area and the impact of the water allocation on the ecological environment was analyzed. Taking the flow field measured in December 2018 as the initial flow field, and the identified and validated numerical groundwater flow model as the platform, four water resource allocation plans were formulated. It was assumed that the current cultivated land area of each irrigated area remained unchanged. The characteristics of the groundwater flow system in the study area in 2050 were predicted.
  • The surface-water transfer volume has been stable in recent years. The average transfer volume was 49,216.0 × 104 m3·yr−1 in the past five years. When formulating the plans, the volume of surface water transferred was assumed to be stable from 2020 to 2050. Plan 1: maintain the current groundwater exploitation in each irrigated area. Plan 2: the groundwater exploitation should be 80% of the current situation in each irrigated area. Plan 3: the groundwater exploitation should be 60% of the current situation in each irrigated area (Table 2).
  • Plan 4: the amount of water saved was 1.5 × 10⁴ m3·km−2·yr−1 to ensure food security and economic stability, according to the average level of farmland water saving in the basin in the last five years. The average irrigation water per square kilometer was reduced from the current 69 × 104 m3·km−2 to around 60 × 104 m3·km−2 by 2025. Saving water during farmland irrigation means reducing groundwater exploitation. The current average irrigation water applied per square kilometer is 55.2 × 10⁴ m3·km−2 in China. Considering the arid climate conditions in northwestern China, the irrigation quota was maintained at 60 × 104 m3·km−2·yr−1 from 2025 to 2035 to stabilize the grain output. From 2030 to 2035, according to the planned project to transfer water from the Datong River to the Qinwangchuan Basin, the surface-water allocation of the Wuwei Basin was 8300 × 104 m3·yr−1 (including 3400 × 104 m3·yr−1 in the Liangzhou District and 4900 × 104 m3·yr−1 in Gulang County). After the surface water completely displaced the groundwater in the Gulang irrigated area, the remaining water could be transported to the Qingyuan irrigated area where serious overexploitation exists downstream. The groundwater exploitation was reduced by 3400 × 104 m3·yr−1. The groundwater exploitation in other irrigated areas was maintained at the level in 2030 to prevent the groundwater exploitation in the irrigated areas from falling below the recoverable amount and to prevent the groundwater level in the northern urban area of Wuwei from being too high. After 2035, the water allocation in the Wuwei Basin, based on the planned project to transfer water from the Datong River to the Qinwangchuan Basin, was increased to 2.07 × 10⁸ m3·yr−1. The remaining surface water could be used for industry or ecology or transferred to the Minqin Basin downstream (Table 3).

3.4. Plan Comparison

The groundwater balance in the various irrigated areas in 2050 under the different plans were compared (Figure 5).
Under the different plans, the lateral inflow (including lateral inflow from outside of the study area and lateral exchange between the irrigated areas), surface-water infiltration, and groundwater irrigation return flow were still the main recharge sources. The lateral outflow (mainly the lateral exchange between the irrigated areas) and groundwater exploitation were the main discharge composition.
Plan 1: in 2050, the groundwater resources decrease by 5378.5 × 104 m3·yr−1 in the study area. All of the irrigated areas are in a negative balance. Qinghe has the largest resource loss (1186.4 × 104 m3·yr−1), followed by Qingyuan (1029.5 × 104 m3·yr−1). The smallest resource loss occurs in Jinta (49.1 × 10⁴ m3·yr−1).
Plan 2: in 2050, the groundwater resources decrease by 335.8 × 10⁴ m3·yr−1 in the study area. Qinghe, Jinyang, and Qingyuan are in a negative balance, with losses of 521.1 × 10⁴–764.7 × 10⁴ m3·yr−1. Zamu, Jinta, and Xiying are in a positive balance, with increases in groundwater resources of 251.0 × 10⁴–769.5 × 10⁴ m3·yr−1. The remaining irrigated areas remain unchanged.
Plan 3: in 2050, the groundwater resources increase by 2576.1 × 104 m3·yr−1 in the study area. All of the irrigated areas are in a positive balance. Qinghe has the largest increase in groundwater resources (601.9 × 10⁴ m3·yr−1), followed by Xiying (500.2 × 10⁴ m3·yr−1). The Jinyang, Yongchang, Donghe, and Jinta irrigated areas are basically in balance.
Plan 4: in 2050, the groundwater resources increase by 4624.6 × 104 m3·yr−1 in the study area. Yongchang and Donghe are in a weak negative balance with losses of (120.9 × 10⁴–126.8 × 10⁴ m3·yr−1). The groundwater is in a positive balance in the Huangyang, Jinta, Zamu, Gulang, and Qingyuan irrigated areas, with groundwater resource increases of 462.9 × 10⁴–1705.4 × 104 m3·yr−1.
Figure 5. Comparison of the groundwater balance in the irrigated areas under the different plans in 2050.
Sustainability 15 00055 g005
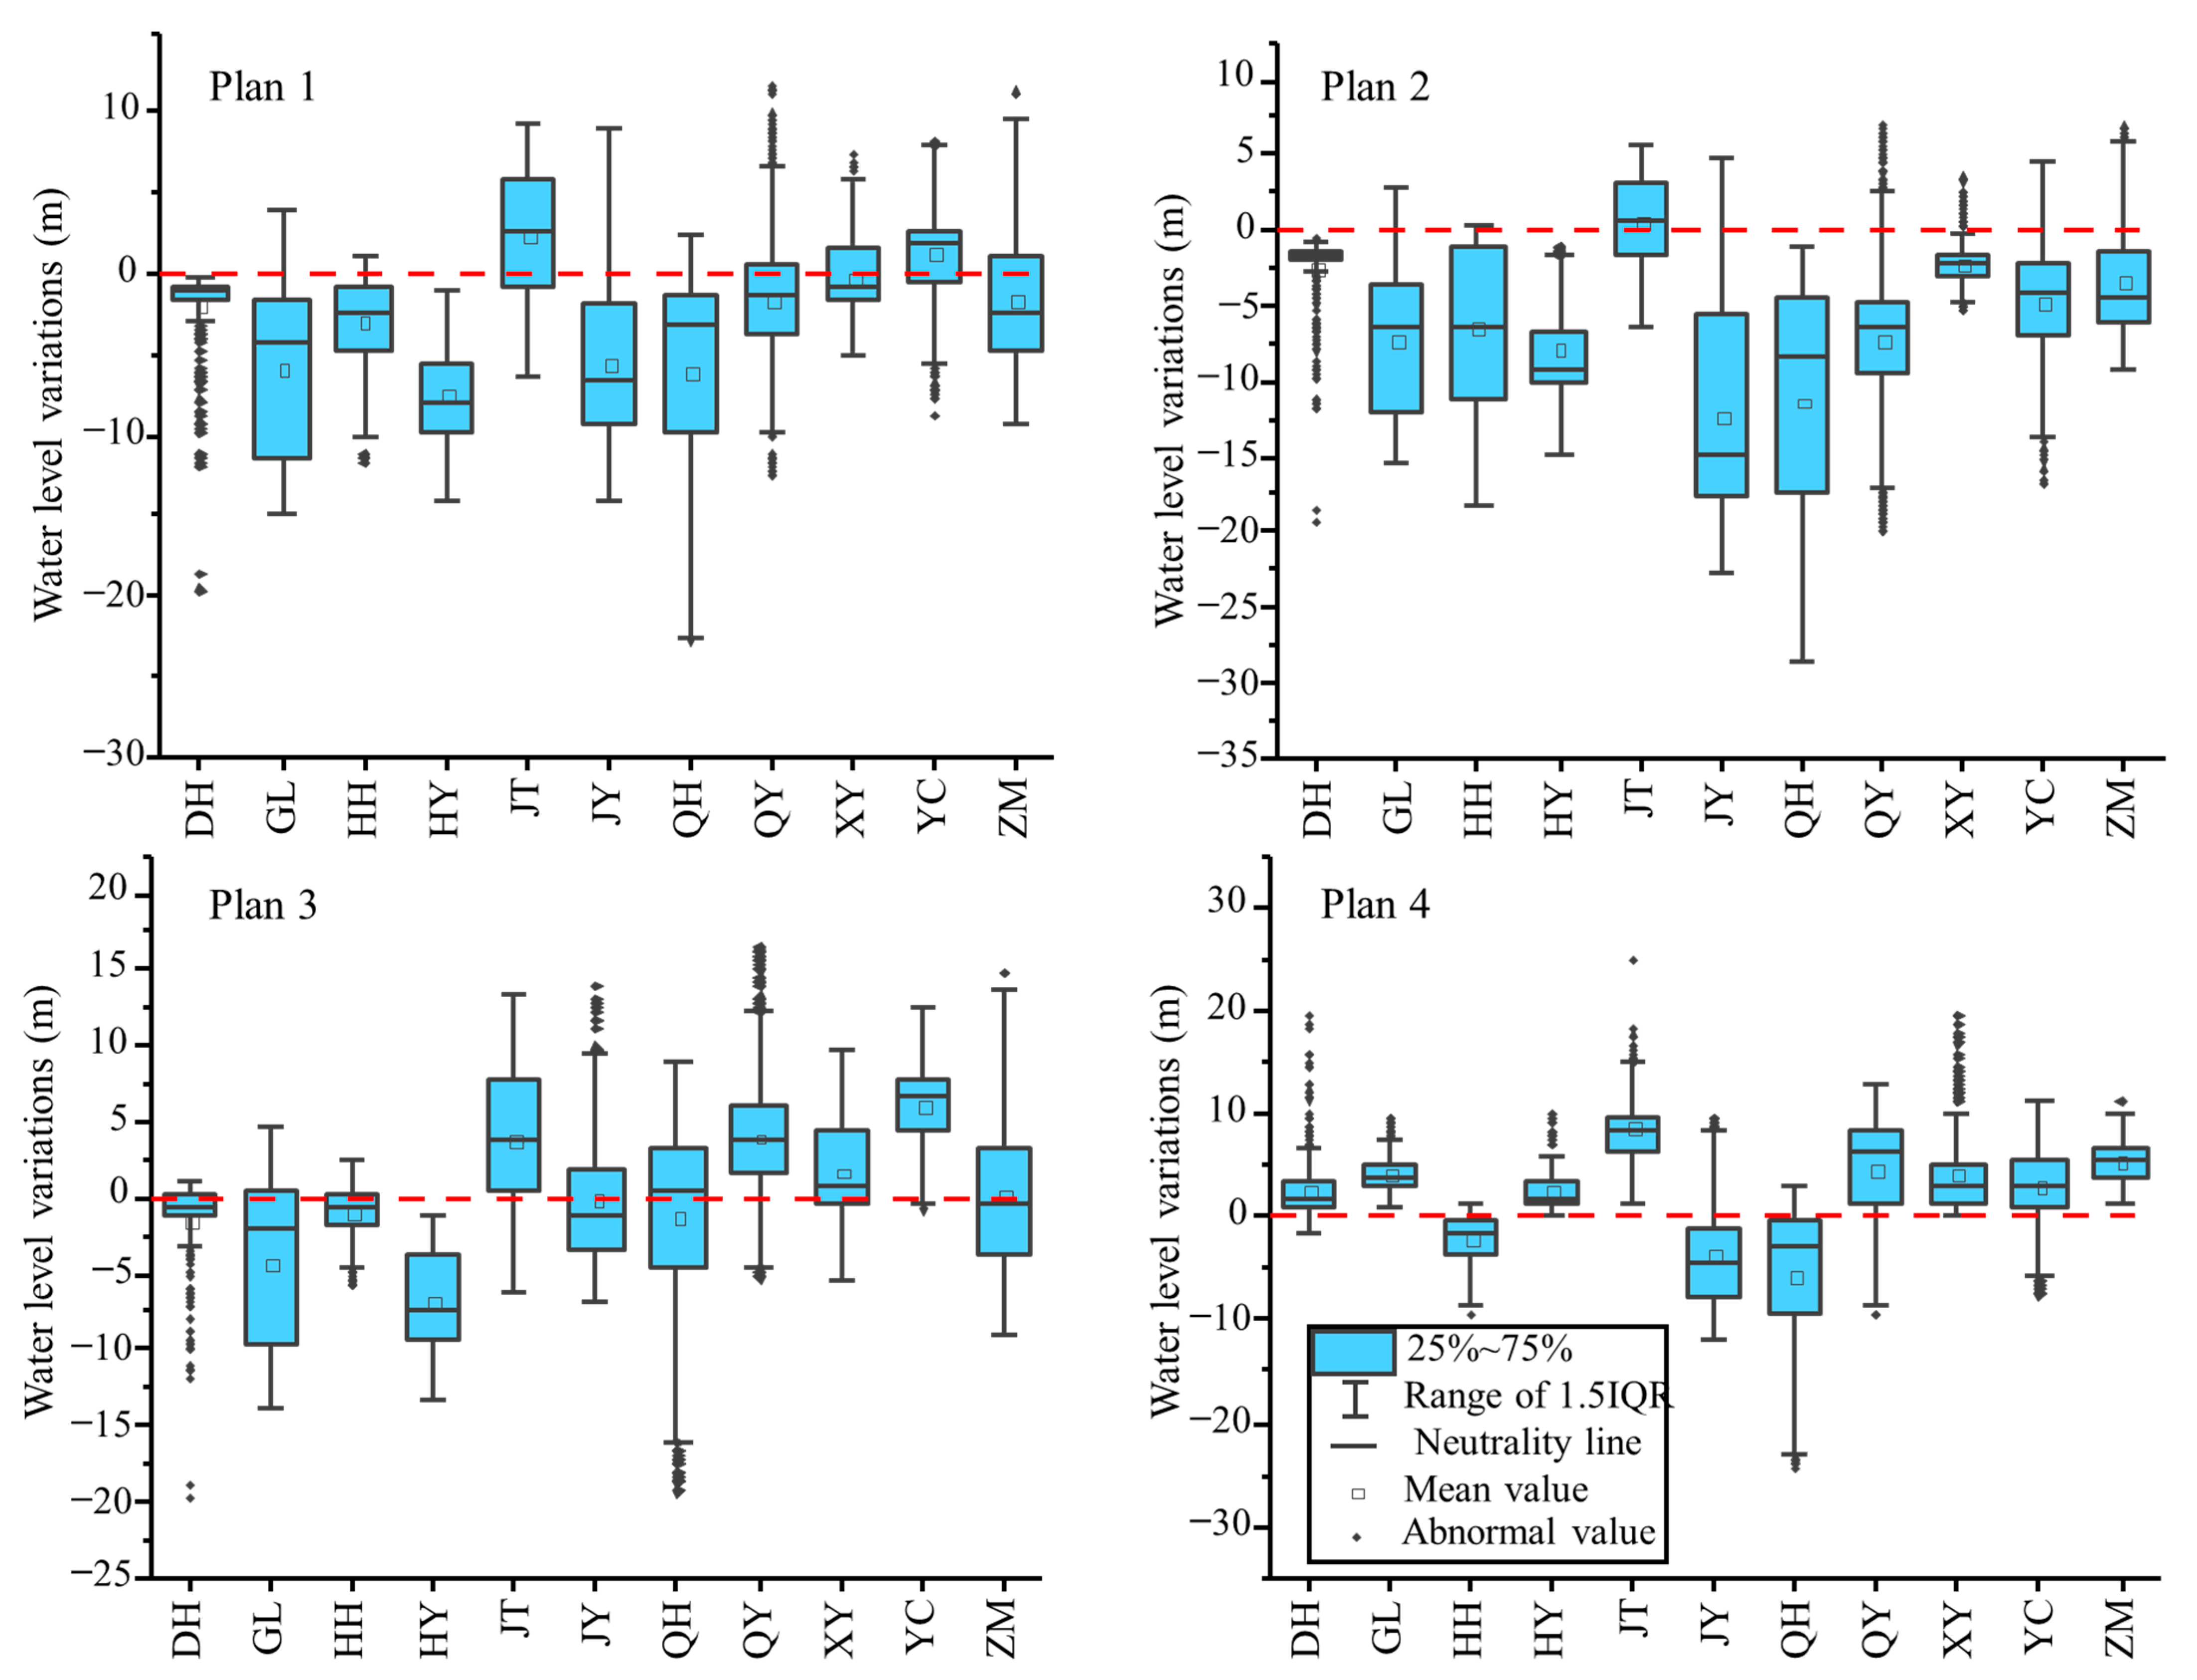
The groundwater level changes in the irrigated areas in 2050 compared with 2018 under different plans are as follows (Figure 6).
Plan 1: with the exception of slight groundwater level increases (by 0.6 m) in Jinta, the groundwater level decreases in the other irrigated areas. The largest decreases occur in Jinyang (12.3 m) and Qinghe (11.3 m).
Plan 2: the groundwater level increases by 2.5 m and 1.3 m in Jinta and Yongchang, respectively, while it decreases in the other irrigated areas. The irrigated areas with large reductions are Huangyang, Qinghe, and Jinyang, with reductions of 7.4 m, 6.0 m, and 5.7 m, respectively.
Plan 3: the groundwater level increases by 6.0 m, 3.7 m, and 4.0 m in Yongchang, Qingyuan, and Jinta, respectively. The groundwater level decreases in the other irrigated areas. The largest reductions are 6.7 m and 4.3 m in Huangyang and Gulang, respectively.
Plan 4: the groundwater level rises by 2.7–8.6 m in most of the irrigated areas. The groundwater level only decreases in Huanhe, Jinyang, and Qinghe by 2.2 m, 3.8 m, and 5.7 m, respectively.
Figure 6. Comparison of the groundwater level variations in the irrigated areas under the different plans in 2050 (positive values represent increases in the water level).
Sustainability 15 00055 g006
Based on the groundwater level elevation measured in 2018, and the predicted values in 2050 under plans 1–4, combined with the DEM data, the average groundwater depth for each irrigated area was calculated. In 2018, the average groundwater depth was different in the various irrigated areas, with a range from 7.9 m to 234.2 m. The groundwater depth was less than 10 m in the Huanhe irrigated area, while it ranged from 10 to 20 m in Yongchang and Jinyang. Moreover, the groundwater depth was greater than 150 m in the Donghe and Huangyang irrigated areas. Under the different water-resource allocation plans, the predicted groundwater level variations in the study area in 2050 were also different. The change trend of the future groundwater depth is one of the key indicators for determining the rational water-resource allocation plan [43,44,45]. Irrigated areas with small groundwater depths can exhibit small increases and decreases. In areas with deep groundwater levels, the groundwater recharge should be increased by appropriately increasing the surface-water transfer and controlling groundwater exploitation to promote the steady and slow rise of the groundwater level. The four water-resource allocation plans were compared (Table 4). If Plan 4 is implemented, the water depth will decrease slightly in the three irrigated areas (Huanhe, Yongchang, and Jinyang) with small water depths in 2050. The water depth in the other irrigated areas will increase. In addition, the groundwater level in the entire area will exhibit a positive trend. The other three plans produce fewer positive results.
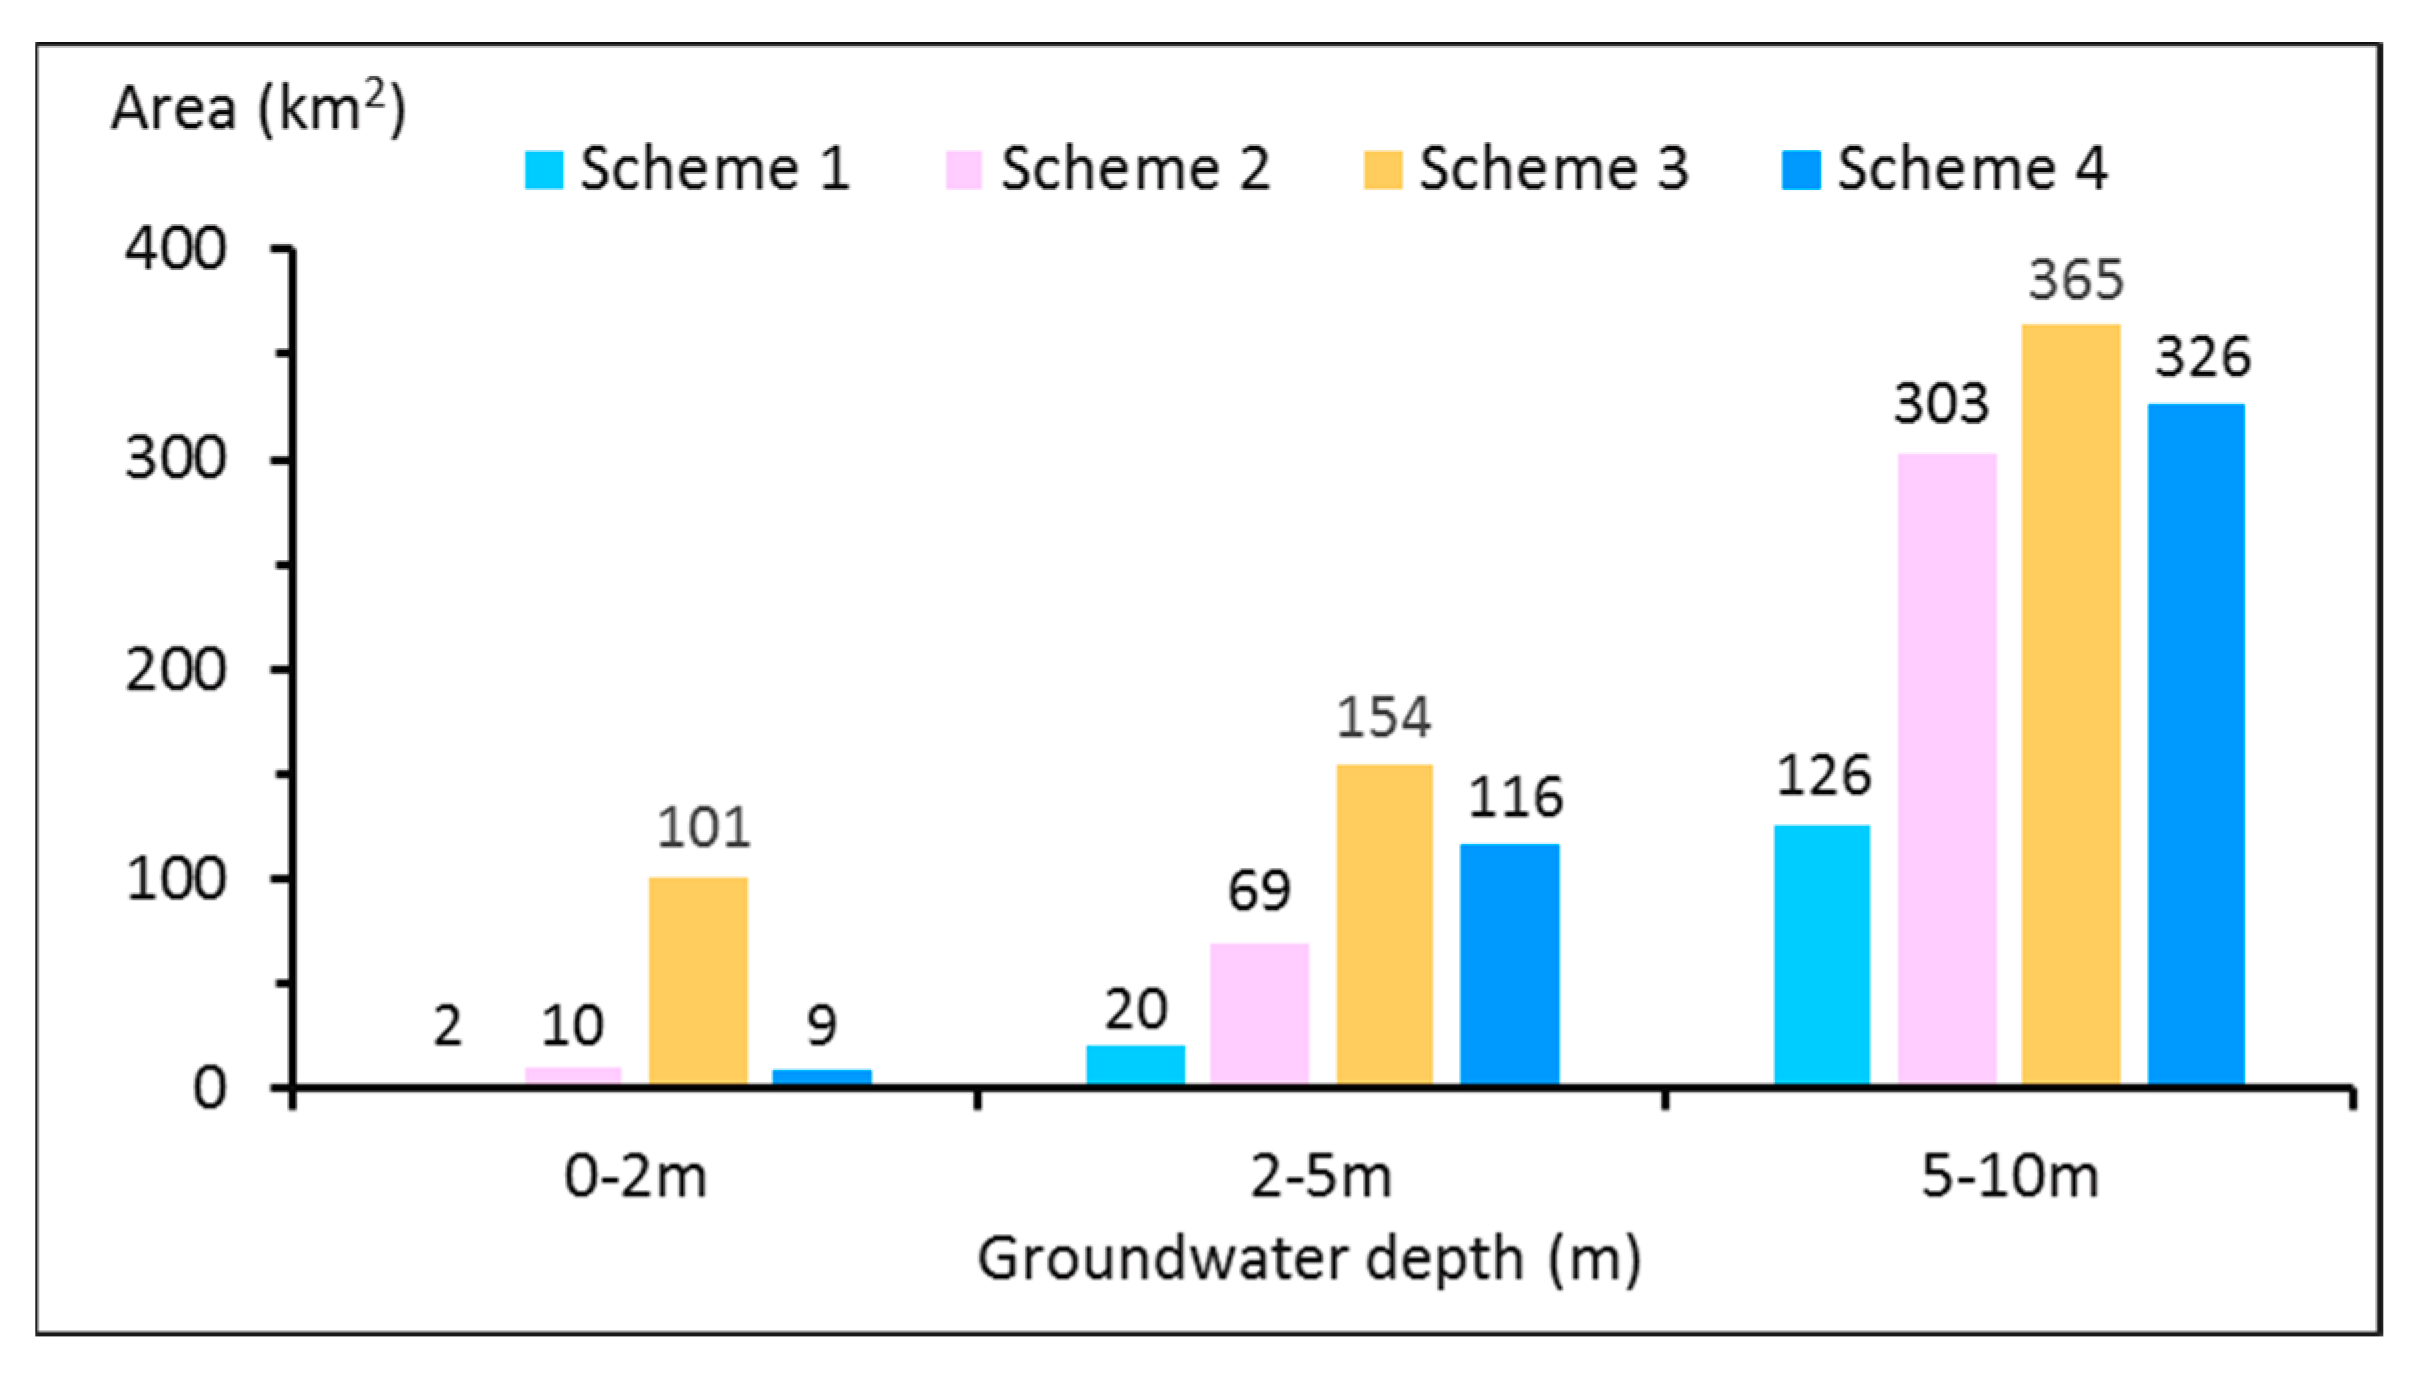
Groundwater provides the physiological water for the surface vegetation in the arid area of northwestern China, performing an important ecological function [46,47,48]. Several researchers have reported [49,50,51] that the natural landscape of the local natural oasis wetland can be maintained when the groundwater depth is less than 2 m in the Shiyang River Basin. When the groundwater depth is greater than 5 m, most of the herbs, shrubs, and trees begin to deteriorate or even wither and the ecological function of the groundwater will degenerate. When the groundwater depth is greater than 10 m, most of the desert vegetation such as herbs, shrubs, and trees tend to die. Thus, the ecological function of groundwater loss will be catastrophic. The Shiyang River Basin has scarce precipitation and strong evaporation. If the wetland area is too large, following the salt dissolution and filtration of the soil layer and the evaporation of water in the soil layer, the salt will accumulate, concentrate, and increase in mineralization, forming salinization. Therefore, the area of natural oasis wetland in the Wuwei Basin should be appropriate, which is also in line with the local ecological environment. The groundwater depth ranges from 0 to 2 m, from 2 m to 5 m, and from 5 m to 10 m in 2050 were compared under the different plans (Figure 7). Plan 1 is unable to maintain the natural oasis wetland. The maintainable area in Plan 2 is 10 km2, which makes it easy to create a natural landscape in line with the regional sustainable development plan. The area with sustained growth of natural vegetation, such as herbs, shrubs, and trees, is 69 km2. The maintainable area of Plan 3 is 101 km2. A large area of wetland can easily cause soil salinization and affect vegetation growth. The maintainable area of Plan 4 is 9 km2. The area with good growth of natural vegetation, such as herbs, shrubs, and trees, is 116 km2. The maintainable natural oasis wetland in Plan 4 is only slightly different from that in Plan 2. However, the natural vegetation area is 168.1% of that in Plan 2, so it has significant advantages in terms of maintaining and restoring the local ecological environment.
The objective conditions, such as the shortage of water resources and the excessive depth of most of the groundwater in the Shiyang River Basin, exist all year round. Consequently, water level restoration and good growth of natural vegetation in the entire area cannot be realized in a short time. The situation cannot be reversed in the short term. The limitations of the water-resource conditions determine that research on water-resource allocation in this basin will be a long-term and lasting process. With population growth, cultivated land adjustments, increase in plantations, improvement of irrigation water-saving efficiency, and repair of trunk and branch canals in irrigated areas, the rational allocation of water resources also needs to be updated, adjusted, and optimized in real time to promote steady transformation to a better state. In the case of great changes in the water-supply and water-use pattern, a variety of water allocation plans should be reformulated. After the plan has been implemented, the state of the groundwater balance, the degree of recovery of the groundwater level, and the good growth area of the ecological vegetation should be comprehensively compared. Then, the rational plan should be selected to promote better local gradual transformation and improvement.
There are certain limitations in this study. For instance, the western boundary of the study area is the Qilian Mountains piedmont fault. The water level drop is up to several hundreds of meters on both sides of the fault. The lateral runoff recharge in the western piedmont can only be calculated through the groundwater flow field in the study area over the years. Consequently, the lateral inflow accuracy in the study area needs to be improved. In addition, the terrain of the study area is high in the west and low in the east, with elevations of 1000–1800 m. The groundwater depth in the southwest is large and is up to 350 m in some areas. A certain amount of surface runoff will be produced during atmospheric precipitation infiltration, river channels and canal leakage, surface-water irrigation infiltration, and groundwater irrigation return flow. This amount of water can only be treated as vertical recharge because of the limitations of the GMS simulation. The above issues need to be discussed and studied further in the future.

4. Conclusions and Prospects

In the Shiyang River Basin, the average annual reduction in the groundwater resources in the Wuwei Basin from 2007 to 2018 was 7656.4 × 104 m3·yr−1. The groundwater system was severely overexploited. River channels and canal leakage, surface-water irrigation infiltration, and groundwater irrigation return flow account for 61% of the total recharge. Artificial exploitation accounts for 88% of the total discharge. Therefore, the water-resource allocation plan, which consists of surface-water transfer and groundwater exploitation, has a great impact on the spatial distribution of the groundwater resources. The advantages and disadvantages of the water-resource allocation plan can be determined based on the groundwater dynamic characteristics and their related effects. This study was based on the large changes in the water-supply and water-use pattern since 2007. Four water-resource allocation plans were compared and analyzed. The state of the groundwater balance, the variations in the groundwater level, and the suitable ecological water level area in each irrigated area were comprehensively considered under the different plans. Based on a farmland irrigation water-saving plan and surface-water transfer plan, the state of the groundwater balance in each irrigated area will be well-adjusted in 2050 under Plan 4. The groundwater level in the entire region will change to a positive trend. The area with good natural vegetation growth will be 116 km2. Thus, Plan 4 is the rational allocation plan. This strategy is conducive to gradually realizing the benign evolution and efficient, balanced sustainable development of regional water resources, economic society, and the ecological environment, which is in line with the objective of local sustainable development.
It should be emphasized that the land-use types should be adjusted in the open spaces with large groundwater depths. Irrigation and recharge should be carried out by means of farmland and plantations to avoid land desertification and deterioration of the ecological environment.

Author Contributions

Conceptualization, L.W. and Z.N.; methodology, L.W. and Z.N.; formal analysis, L.W.; investigation, M.L., L.C. and Q.Y.; data curation, L.W., P.Z. and M.L.; writing—original draft preparation, L.W.; writing—review and editing, P.Z. and Q.Y.; supervision, M.L. and L.C.; funding acquisition, Z.N., M.L. and L.C. All authors have read and agreed to the published version of the manuscript.

Funding

This research was funded by the National Key Research and Development Program of China (grant No. 2017YFC0406103), the National Natural Science Foundation of China (grant Nos. 41902262 and 41807214), the Fundamental Research Funds for Central Public Welfare Research Institutes, CAGS (grant No. SK202011), and the China Geological Survey Project (grant Nos. DD20221752 and DD20190349). The authors declare that they have no financial conflicts of interest related to this work.

Institutional Review Board Statement

Not applicable.

Informed Consent Statement

Not applicable.

Data Availability Statement

The data presented in this study are available on request from the corresponding author.

Acknowledgments

The authors would like to sincerely thank Zhang Tongze, who has provided abundant data for this study. We also thank the editors and anonymous reviewers who provided valuable comments.

Conflicts of Interest

The authors declare no conflict of interest.

References

  1. Gleeson, T.; Cuthbert, M.; Ferguson, G.; Perrone, D. Global Groundwater Sustainability, Resources, and Systems in the Anthropocene. Annu. Rev. Earth Planet. Sci. 2020, 48, 431–463. [Google Scholar] [CrossRef] [Green Version]
  2. Grönwall, J.; Danert, K. Regarding Groundwater and Drinking Water Access through A Human Rights Lens: Self-Supply as a Norm. Water 2020, 12, 419. [Google Scholar] [CrossRef] [Green Version]
  3. UNESCO. World’s Groundwater Resources Are Suffering from Poor Governance; UNESCO Publishing: Paris, France, 2012. [Google Scholar]
  4. Siebert, S.; Burke, J.; Faures, J.M.; Frenken, K.; Hoogeveen, J.; Döll, P.; Portmann, F.T. Groundwater use for irrigation—A global inventory. Hydrol. Earth Syst. Sci. 2010, 14, 1863–1880. [Google Scholar] [CrossRef] [Green Version]
  5. Giordano, M. Global groundwater? Issues and solutions. Annu. Rev. Environ. Resour. 2009, 34, 153–178. [Google Scholar] [CrossRef]
  6. Giordano, M.; Villholth, K.G. The Agricultural Groundwater Revolution: Opportunities and Threats to Development; CABI: Wallingford, UK, 2007; Volume 3. [Google Scholar]
  7. Wang, H.; Chen, M.; Qin, D. Study on Rational Allocation and Carrying Capacity of Water Resources in Northwest China; The Yellow River Water Conservancy Press: Zhengzhou, China, 2003. [Google Scholar]
  8. Wang, P.; Zhang, F.E.; Chen, Z. Characterization of recharge processes and groundwater flow paths using isotopes in the arid Santanghu basin, Northwest China. Hydrogeol. J. 2020, 28, 1037–1051. [Google Scholar] [CrossRef]
  9. Shiyang River Basin Management Bureau. Research and Practice of Water Resources Development and Utilization in Shiyang River Basin; Shiyang River Basin Management Bureau: Wuwei, China, 2015. [Google Scholar]
  10. Li, F.; Chen, H.; Wang, K.; Chen, X. Comprehensive review of groundwater-dependent ecosystems. Adv. Earth Sci. 2018, 29, 750–758. (In Chinese) [Google Scholar] [CrossRef]
  11. Hu, H.; Ding, H.; He, B. Dynamic variation of groundwater level in the middle lower reaches of Shiyanghe River Basin for nearly 40 years. Northwestern Geol. 2016, 49, 164–174. (In Chinese) [Google Scholar]
  12. Feng, Q.; Li, Z.; Gao, Q.; Si, J. Ecosystem water needs and ecosystem rehalibitation of Minqin oasis in Shiyang River Basin. Adv. Earth Sci. 2012, 27, 806–814. (In Chinese) [Google Scholar]
  13. Ji, X.; Kang, E.; Chen, R.; Zhao, W.; Zhang, Z.; Jin, B. The impact of the development of water resources on environment in arid inland river basins of Hexi region, Northwestern China. Environ. Geol. 2006, 50, 793–801. [Google Scholar] [CrossRef]
  14. Cui, H.; Zhang, G.; Wang, Q.; Wang, J.; Liu, M.; Yan, M. Study on Index of Groundwater Ecological Function Crisis Classification and Early Warning in Northwest China. Water 2022, 14, 1911. [Google Scholar] [CrossRef]
  15. Zhu, G.F.; Su, Y.H.; Feng, Q. The hydrochemical characteristics and evolution of groundwater and surface water in the Heihe River Basin, northwest China. Hydrogeol. J. 2008, 16, 167–182. [Google Scholar] [CrossRef]
  16. Feng, S.; Huo, Z.; Kang, S.; Tang, Z.; Wang, F. Groundwater simulation using a numerical model under different water resources management scenarios in an arid region of China. Environ. Earth Sci. 2011, 62, 961–971. [Google Scholar] [CrossRef]
  17. Qi, X.; Huang, Z.; Qiao, D.; Zhang, X.; Li, P.; Mathias, N.A. Research advances on the reasonable water resources allocation in irrigation district. Adv. Earth Sci. 2015, 26, 287–295. (In Chinese) [Google Scholar]
  18. Gu, J.; Li, M.; Guo, P.; Huang, G. Risk Assessment for Ecological Planning of Arid Inland River Basins Under Hydrological and Management Uncertainties. Water Resour. Manag. 2016, 30, 1415–1431. [Google Scholar] [CrossRef]
  19. Zhang, J.; Zhang, Y.; Pu, R.; Chen, R.; Cheng, Z.; Wang, M. Safety analysis of water resources and eco-environment in Shiyang River Basin. Chin. Geogr. Sci. 2005, 15, 238–244. [Google Scholar] [CrossRef]
  20. Zhu, X.; Wu, J.; Nie, H.; Guo, F.; Wu, J.; Chen, K.; Liao, P.; Xu, H.; Zeng, X. Quantitative assessment of the impact of an inter-basin surface-water transfer project on the groundwater flow and groundwater-dependent eco-environment in an oasis in arid northwestern China. Hydrogeol. J. 2018, 26, 1475–1485. [Google Scholar] [CrossRef]
  21. Wang, Z.; Yang, J.; Deng, X.; Lan, X. Optimal Water Resources Allocation under the Constraint of Land Use in the Heihe River Basin of China. Sustainability 2015, 7, 1558–1575. [Google Scholar] [CrossRef] [Green Version]
  22. Nel, J.B.; Mativenga, P.T.; Marnewick, A.L. A Framework to Support the Selection of an Appropriate Water Allocation Planning and Decision Support Scheme. Water 2022, 14, 1854. [Google Scholar] [CrossRef]
  23. Yan, D.; Wang, H.; Yang, S.; Liu, M.; Huo, Z. Some opinions on the eco-hydrological processes simulation and regulation in arid basin. Adv. Earth Sci. 2008, 23, 773–778. (In Chinese) [Google Scholar]
  24. Su, X.; Kang, S.; Shi, P. Reasonable water resources deployment model considering the demand of ecosystem in arid area. J. Hydraul. Eng. 2008, 39, 1111–1117. (In Chinese) [Google Scholar]
  25. Wang, H.; Qin, D.; Guo, M.; Wang, J. Mode and calculation method for rational water resources allocation in arid zone. Adv. Earth Sci. 2004, 15, 689–694. (In Chinese) [Google Scholar]
  26. Xie, X.; Zhao, W.; Pei, Y. Study on Optimal Allocation and Sustainable Utilization Strategy of Water Resources in Ningxia; The Yellow River Water Conservancy Press: Zhengzhou, China, 2002. [Google Scholar]
  27. Chen, H.; Wang, Q.; Li, X.; Wang, Z.; Li, C. Optimal water resources planning based on interval-parameter two-stage robust stochastic programming model. Trans. Chin. Soc. Agric. Mach. 2019, 50, 10. (In Chinese) [Google Scholar]
  28. Liu, H.; Zhao, Y.; Li, H.; Wang, L.; Chang, H.; Peng, P. Optimal water resources allocation based on interval two-stage stochastic programming in Beijing. South North Water Transf. Water Sci. Technol. 2020, 18, 34–41. (In Chinese) [Google Scholar] [CrossRef]
  29. Zhao, D.; Shao, D.; Liu, B. Method of disposition on water resources of irrigation district and its applications. Trans. Chin. Soc. Agric. Eng. 2004, 20, 5. (In Chinese) [Google Scholar]
  30. Zhao, Z.; Hou, G.; Wang, D.; Tao, Z.; Li, Y. Characters of groundwater flow system-taking cretaceous groundwater basin as example. Ground Water 2007, 29, 14–16. (In Chinese) [Google Scholar]
  31. Su, X.; Song, Y.; Liu, J.; Dang, Y.; Tian, Z. Spatiotemporal optimize allocation of water resources coupling groundwater simulation model in canal-well irrigation district. Trans. Chin. Soc. Agric. Eng. 2016, 32, 9. (In Chinese) [Google Scholar]
  32. Cheng, X.; Jin, X.; Liu, W. Study on functions and rational allocation of Shule River basin groundwater resources. J. Groundw. Sci. Eng. 2017, 5, 140–151. [Google Scholar]
  33. César, E.; Wildemeersch, S.; Orban, P.; Carrière, S.; Brouyère, S.; Dassargues, A. Simulation of spatial and temporal trends in nitrate concentrations at the regional scale in the Upper Dyle basin, Belgium. Hydrogeol. J. 2014, 22, 1087–1100. [Google Scholar] [CrossRef] [Green Version]
  34. Dai, F.; Cai, H.; Liu, X. Analysis of suitable irrigation water ratio of well to channel based on groundwater model. Trans. Chin. Soc. Agric. Eng. 2012, 15, 45–51. (In Chinese) [Google Scholar]
  35. Safavi, H.R.; Darzi, F.; Mariño, M.A. Simulation-optimization modeling of conjunctive use of surface water and groundwater. Water Resour. Manag. 2010, 10, 1965–1988. [Google Scholar] [CrossRef]
  36. Lu, H.; Xie, X.; Guo, K.; Wang, J. Study on exploitable quantity of groundwater based on water resources optimal allocation. J. Hydraul. Eng. 2013, 44, 1182–1188. (In Chinese) [Google Scholar]
  37. Bejranonda, W.; Koch, M.; Koontanakulvong, S. Surface water and groundwater dynamic interaction models as guiding tools for optimal conjunctive water use policies in the central plain of Thailand. Environ. Earth Sci. 2013, 70, 2079–2086. [Google Scholar] [CrossRef]
  38. Ding, H.; Zhang, H.; Wei, Y. Report of Groundwater Exploration in Hexi Corridor; Gansu Geological Survey of China: Lanzhou, China, 2003. [Google Scholar]
  39. Chen, C. Water resource in Qilian Mountainous region and its influence on eco-environment of Hexi Corridor. Chin. Geogr. Sci. 1996, 6, 247–258. [Google Scholar] [CrossRef]
  40. Yi, L.; Xu, H. Groundwater Numerical Simulation: GMS Application Foundation and Example; Chemical Industry Press: Beijing, China, 2009. [Google Scholar]
  41. Meteorological Data, China Meteorological Administration. Available online: https://www.cma.gov.cn/ (accessed on 1 December 2019).
  42. Li, W. The underground run-off mould of the plain area in the Shiyanghe River valley. J. Hebei Coll. Geol. 1990, 013, 121–126. [Google Scholar] [CrossRef]
  43. Wang, J.; Zhang, G.; Cui, H.; Wang, Q.; Dong, H.; Hao, J. System index attribute and application of groundwater function zoning in northwest inland area of China. J. Hydraul. Eng. 2020, 51, 796–804. (In Chinese) [Google Scholar] [CrossRef]
  44. Cappucci, S.; de Cassan, M.; Grillini, M.; Proposito, M.; Screpanti, A. Multi-source water characterisation for water supply and management strategies on a small Mediterranean island. Hydrogeol. J. 2020, 28, 1155–1171. [Google Scholar] [CrossRef]
  45. Li, F.; Wang, Y.; Zhao, Y.; Qiao, J. Modelling the response of vegetation restoration to changes in groundwater level, based on ecologically suitable groundwater depth. Hydrogeol. J. 2018, 26, 2189–2204. [Google Scholar] [CrossRef]
  46. Wang, W.; Yang, Z.; Cheng, D.; Wang, W.; Yang, H. Methods of ecology-oriented groundwater resource assessment in arid and semi-arid area. J. Jilin Univ. Earth Sci. Ed. 2011, 41, 159–167. (In Chinese) [Google Scholar]
  47. Harvey, J.W.; McCormick, P.V. Groundwater’s significance to changing hydrology, water chemistry, and biological communities of a floodplain ecosystem, Everglades, South Florida, USA. Hydrogeol. J. 2009, 17, 185–201. [Google Scholar] [CrossRef] [Green Version]
  48. Yang, Z.Y.; Wang, W.K.; Wang, Z.; Jiang, G.H.; Li, W.L. Ecology-oriented groundwater resource assessment in the Tuwei River watershed, Shaanxi Province, China. Hydrogeol. J. 2016, 24, 1939–1952. [Google Scholar] [CrossRef]
  49. Liu, M.; Nie, Z.; Cao, L. Comprehensive evaluation on the ecological function of groundwater in the Shiyang River watershed. J. Groundw. Sci. Eng. 2021, 4, 326–340. [Google Scholar]
  50. Cao, L.; Nie, Z.; Liu, M.; Lu, H.; Wang, L. Changes in natural vegetation growth and groundwater depth and their relationship in the Minqin oasis in the Shiyang River Basin. Hydrogeol. Eng. Geol. 2020, 47, 25–33. (In Chinese) [Google Scholar] [CrossRef]
  51. Cao, L.; Nie, Z.; Liu, M.; Wang, L.; Wang, J.; Wang, Q. The ecological relationship of groundwater–soil–vegetation in the Oasis–Desert transition zone of the Shiyang River Basin. Water 2021, 13, 1642. [Google Scholar] [CrossRef]
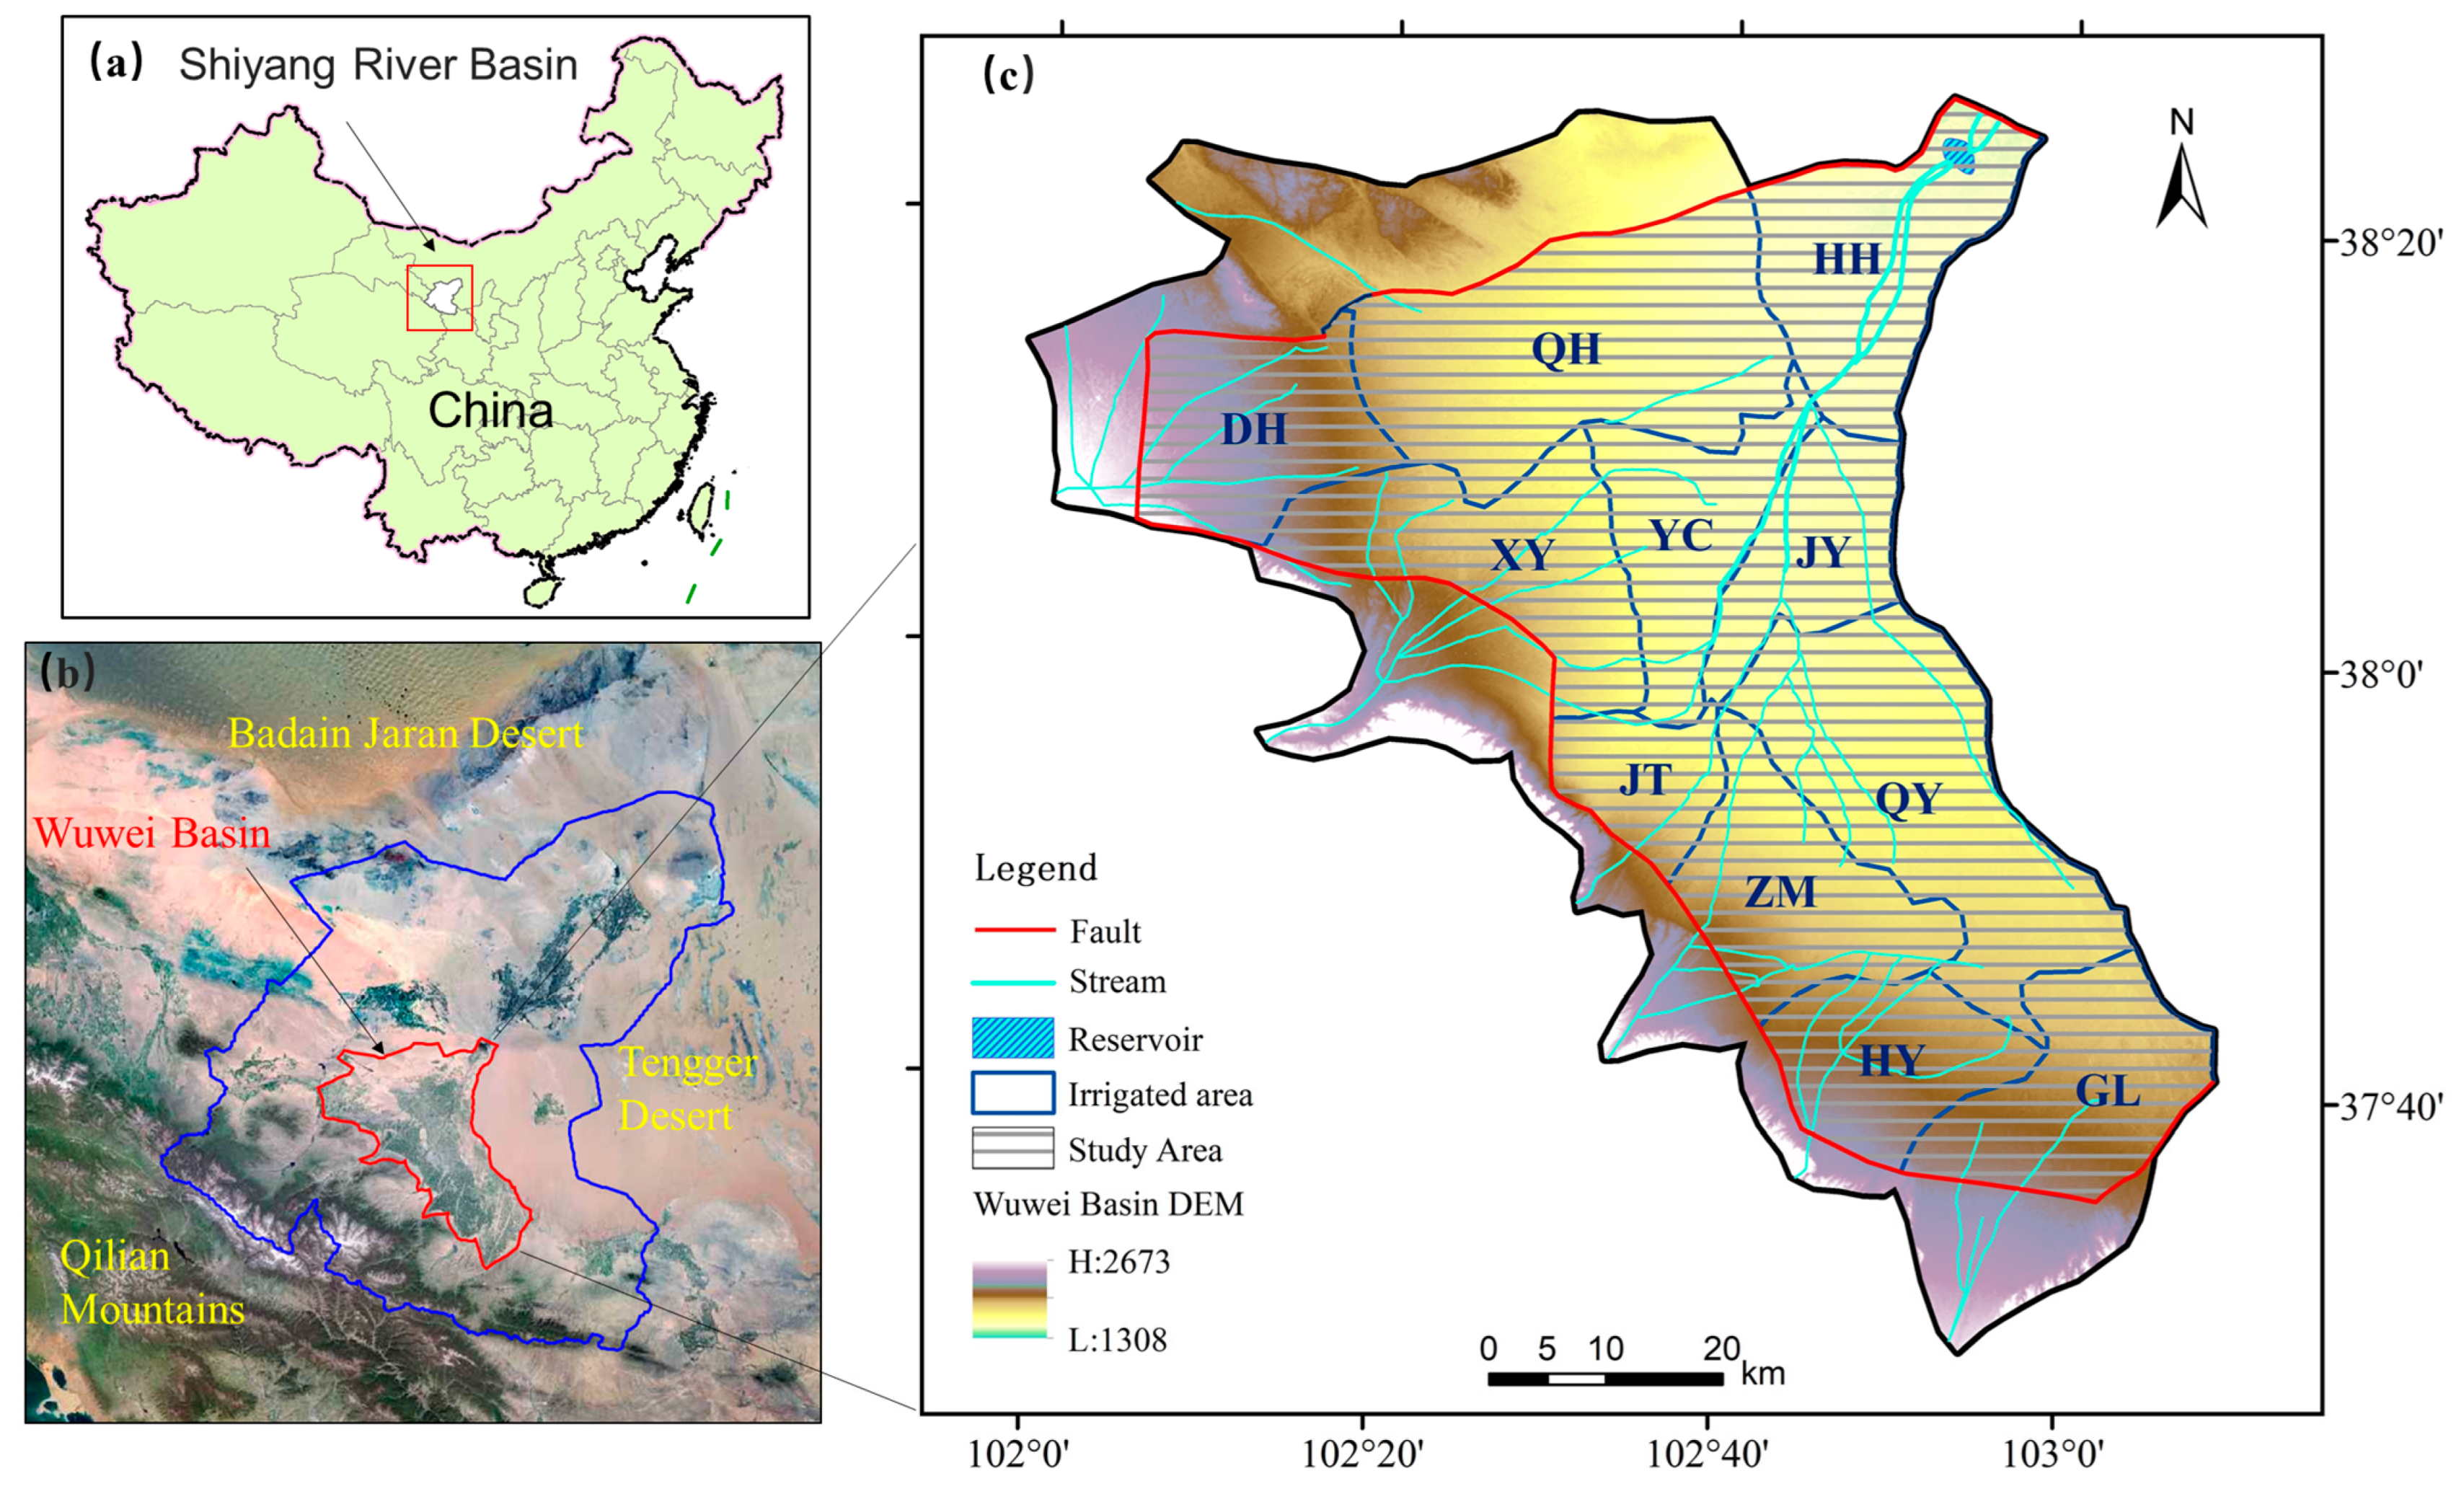
Figure 1. Distribution of the irrigated areas in the Wuwei Basin of the Shiyang River Basin: (a) the Shiyang River Basin, (b) the Wuwei Basin against the Shiyang River Basin, (c) irrigated areas of the Wuwei Basin, such as Donghe (DH), Gulang (GL), Huanhe (HH), Huangyang (HY), Jinta (JT), Jinyang (JY), Qinghe (QH), Qingyuan (QY), Xiying (XY), Yongchang (YC), Zamu (ZM).
Sustainability 15 00055 g001
Figure 2. Water table contour fitting diagrams for the late calibration and late validation stages.
Sustainability 15 00055 g002
Figure 3. Fitting curve of the dynamic changes in the water level in typical observation wells.
Sustainability 15 00055 g003
Figure 4. Hydrogeological parameter zoning map (zone numbers described in Table 1).
Sustainability 15 00055 g004
Figure 7. Statistics of the suitable ecological water level area under different plans.
Sustainability 15 00055 g007
Table 1. Hydrogeological parameters of aquifer.
ZoneK (m·d−1)μZoneK (m·d−1)μZoneK (m·d−1)μ
1200.18146.50.2279.80.12
2140.18157.60.1228150.1
3120.18166.30.229180.12
4220.21710.50.13012.40.14
560.16186.50.12318.50.15
6140.08196.10.12326.50.14
7190.152040.12339.20.15
8100.152110.70.15343.20.12
9210.15227.80.15355.50.13
10150.152311.50.123640.15
11120.124200.13740.12
12130.142560.19387.20.1
138.50.14268.40.123930.15
K is the permeability coefficient of the phreatic aquifer; μ is the aquifer’s water yield (dimensionless).
Table 2. Water resource allocation plans 1–3 for the study area (104 m3).
Irrigated AreaSurface WaterPlan 1 (Datum Year)Plan 2 (80%)Plan 3 (60%)
GroundwaterTotalGroundwaterTotalGroundwaterTotal
Donghe7903.8 606.0 8509.8 484.8 8388.6 363.6 8267.4
Gulang3106.1 599.8 3705.9 479.8 3585.9 359.9 3466.0
Huanhe0.0 1848.1 1848.1 1478.5 1478.5 1108.8 1108.8
Huangyang8707.0 1343.3 10,050.3 1074.7 9781.7 806.0 9513.0
Jinta5710.2 624.5 6334.7 499.6 6209.8 374.7 6084.9
Jinyang0.0 7508.0 7508.0 6006.4 6006.4 4504.8 4504.8
Qinghe0.0 11,671.7 11,671.7 9337.3 9337.3 7003.0 7003.0
Qingyuan0.0 9298.1 9298.1 7438.4 7438.4 5578.8 5578.8
Xiying12,087.2 581.7 12,669.0 465.4 12,552.6 349.0 12,436.3
Yongchang0.0 8700.5 8700.5 6960.4 6960.4 5220.3 5220.3
Zamu11,701.7 16,56.7 13,358.4 13,25.3 13,027.0 994.0 12,695.7
Whole49,216.0 44,438.3 93,654.3 35,550.7 84,766.7 26,663.0 75,879.0
Table 3. Water resource allocation plan 4 for the study area (104 m3).
Irrigated Area2020 2021 2022 2023 2024 2025 2026–20302031–2050
DongheGroundwater216.0 0.0 0.0 0.0 0.0 0.0 0.0 0.0
Surface water8353.3 8295.8 8113.5 7931.1 7748.8 7566.5 7566.5 7566.5
GulangGroundwater911.2 807.1 737.6 668.2 598.8 529.4 529.4 0.0
Surface water2351.2 2351.2 2351.2 2351.2 2351.2 2351.2 2351.2 2880.6
HuanheGroundwater1810.7 1810.7 1810.7 1810.7 1810.7 1810.7 1810.7 1810.7
Surface water0.0 0.0 0.0 0.0 0.0 0.0 0.0 0.0
HuangyangGroundwater115.4 0.0 0.0 0.0 0.0 0.0 0.0 0.0
Surface water8631.1 8467.3 8281.2 8095.1 7909.0 7722.9 7722.9 7722.9
JintaGroundwater1435.7 1214.8 1067.6 920.3 773.1 625.8 625.8 625.8
Surface water5484.8 5484.8 5484.8 5484.8 5484.8 5484.8 5484.8 5484.8
JinyangGroundwater4746.4 4594.9 4493.9 4392.9 4291.9 4190.9 4190.9 4190.9
Surface water0.0 0.0 0.0 0.0 0.0 0.0 0.0 0.0
QingheGroundwater11,106.9 10,752.4 10,516.1 10,279.8 10,043.5 9807.2 9807.2 9807.2
Surface water0.0 0.0 0.0 0.0 0.0 0.0 0.0 0.0
QingyuanGroundwater10,050.2 9729.5 9515.6 9301.8 9088.0 8874.1 8874.1 5474.1
Surface water0.0 0.0 0.0 0.0 0.0 0.0 0.0 3400.0
XiyingGroundwater2319.5 1859.1 1552.1 1245.2 938.3 631.3 631.3 631.3
Surface water12,106.4 12,106.4 12,106.4 12,106.4 12,106.4 12,106.4 12,106.4 12,106.4
YongchangGroundwater7561.1 7319.8 7158.9 6998.1 6837.2 6676.3 6676.3 6676.3
Surface water0.0 0.0 0.0 0.0 0.0 0.0 0.0 0.0
ZamuGroundwater2514.8 2062.0 1760.1 1458.2 1156.3 854.4 854.4 854.4
Surface water11,673.5 11,673.5 11,673.5 11,673.5 11,673.5 11,673.5 11,673.5 11,673.5
Whole91,387.9 88,529.1 86,623.2 84,717.3 82,811.4 80,905.5 80,905.5 80,905.5
Table 4. Statistics of the average groundwater level in the irrigated areas (m) (positive values indicate increased water levels).
Irrigated AreaDHGLHHHYJTJYQHQYXYYCZM
Groundwater Depth in 2018234.2 139.5 7.9 174.1 75.0 15.0 39.2 37.5 96.4 14.9 75.7
Groundwater level variations to 2050Plan 1−2.5−7.2−6.4−7.90.6−12.3−11.3−7.2−2.2−4.7−3.4
Plan 2−1.9−5.9−3.0−7.42.5−5.7−6.0−1.6−0.21.3−1.6
Plan 3−1.4−4.3−1.0−6.73.7−0.1−1.24.01.76.00.3
Plan 42.74.1−2.22.48.6−3.8−5.74.74.12.95.3
Groundwater level variations: −13 m Sustainability 15 00055 i001 9 m.
Disclaimer/Publisher’s Note: The statements, opinions and data contained in all publications are solely those of the individual author(s) and contributor(s) and not of MDPI and/or the editor(s). MDPI and/or the editor(s) disclaim responsibility for any injury to people or property resulting from any ideas, methods, instructions or products referred to in the content.