Article

Multi-Objective Optimization of Integrated Solar-Driven CO2 Capture System for an Industrial Building

Renewable Energy Research Group (RERG), Research Institute for Smart Energy (RISE), Department of Building Environment and Energy Engineering, The Hong Kong Polytechnic University, Hong Kong, China
*
Author to whom correspondence should be addressed.
Sustainability 2023, 15(1), 526; https://doi.org/10.3390/su15010526
Submission received: 15 November 2022 / Revised: 13 December 2022 / Accepted: 21 December 2022 / Published: 28 December 2022

Abstract

:
Industrial CO2 emission, accounting for nearly a quarter of the total CO2 emission, is a “hard-to-abate” emission sector, owing to the longstanding challenge in reducing CO2 emission while not sacrificing industry economics. Herein, this research proposes an integrated solar-driven CO2 capture system for application in industrial buildings to decarbonize factories’ CO2-rich exhaust gas generated from workers or manufacturing processes, and further conducts multi-objective optimization based on the NSGA-II algorithm. By setting the integrated system’s performances, including captured CO2 mass, net levelized CO2 cost-profit, generated electricity, and exergy efficiency, as the constrained multi-objectives, the effects of system working parameters on them are disentangled and articulated concerning the energy-mass balance principles. Research demonstrates that the captured CO2 mass mainly depends on solar radiation and sorbent mass, net levelized CO2 cost on sorbent mass, and exergy efficiency on the total solar input. For capturing the CO2 from a light-CO2-intensity factory with CO2 partial pressure of 1000 Pa by using 6.0 tons of Zeolite 13X, a CO2 capacity of 0.79 mol/kg, levelized CO2 cost of 128.4 USD/ton, and exergy efficiency of 5–10% can be achieved. Furthermore, sensitivity and scenario analysis are conducted to demonstrate the system’s stability and feasibility. Overall, this work provides comprehensive and objective-oriented guidance for policymakers and industry owners and paves the way for greening the ever-increasing industry needs.

1. Introduction

Accumulated CO2 emissions adversely impact climate change, causing increasingly frequent and severe natural disasters [1]. In 2021, the natural disaster events amounted to about 343 billion U.S. dollars in loss and 45,000 deaths [2], including floods, hurricanes, earthquakes, and tsunamis. Among 36.3 billion tons of CO2 emitted in 2021 globally [3], industrial emissions accounted for 22.91% [4], equivalent to 3.5 years of CO2 absorbed by the global forests [5]. Thus, reducing industrial CO2 emissions is imperative to reduce global emissions. While policies such as “carbon tax” cannot initially reduce CO2 generation and might cause global economic volatility [6,7,8], people try to cleanse carbon-embed manufacturing/production processes or replace carbon-intensive energy sources. However, industrial emission is “hard-to-abate” without harming productivity, owing to irreplaceable high-temperature heat, unavoidable process emission [9] and inescapable “lock-in” emissions of long-lived industrial facilities [10]. Therefore, there is an urgent necessity to explore a new strategy that can effectively reduce industrial CO2 emissions while not undermining industry economics.
Recent years have witnessed carbon capture, utilization, and storage (CCUS) becoming a critical part of the industrial technology portfolio [9], acting for industrial waste gas treatment. Current research used different energy-driven industrial CO2 capture. For example, Rao et al. [11] designed pressure-swing adsorption (PSA) of a CO2 device to remove the CO2 from the anode outflow of a solid oxide fuel cell-gas turbine (SOFC-GT), which is fueled by the coke oven gas from the power production process of a steel industry as fuel to generate electricity. Tian et al. [12] proposed an inherent CO2 emission reduction strategy by forming limestone feedstock by calcium-lopping-based CO2 capture that takes the CO2 from CO2-rich flue gas, which indicated high cost-effectiveness. Despite the vast potential, current industrial CO2 capture research that relies on using fossil-intensive energy to support the capture process suffers from potential CO2-energy-economic penalty and deep uncertainties of the actual technical and economical performances. It might lead to overestimating issues regarding net CO2 removal potential and cost-effectiveness. Therefore, fossil fuels should be indispensably replaced by renewable energy at a significant percentage [13,14]. Toward this, exploring a novel renewable energy-driven industrial CO2 capture system and evaluating its technic-economic feasibility are imperative, yet challenging. The challenge mainly lies in the extra complex energy management problem within the system induced by the temporally and spatially uneven-intermittent nature of solar energy, the degrading, dynamic, and cyclic nature of CO2 capture process, as well as the variation CO2 concentration of industrial waste gas. Tackling these research gaps requires all-round understanding of how the system’s performances, such as captured CO2 mass, net levelized CO2 cost, energy and exergy efficiencies are affected by a wide spectrum of decision parameters. A rigorous and robust evaluation is therefore indispensably needed to unveil the dynamical and intertwined effects of system configurations on the system’s techno-economic performances, so as to effectively optimize the energy management strategy for varied scenarios, including different geological sites and different industry types.
Non-dominated sorting genetic algorithm-II (NSGA-II) is a mature, evolutionary, and effective multi-objective optimization (MOO) algorithm [15,16], which utilizes a selection operator that selects the best of a mating pool consisting of the parent and offspring population [17], thus achieving ideal convergence to the true Pareto optimum solutions [18,19]. It has been effectively and popularly used in solving large-scale engineering problems [17,20], such as achieving high CO2 purity, enhanced recovery rate for pressure-vacuum swing (PVS) CO2 adsorption process [21,22,23,24], thermo-economic optimization for a CO2 capture integrated system [25] and the balance between emission reduction and profit for a carbon capture and utilization (CCU) system [13]. Overall, the above studies have fully demonstrated the capability of the NSGA-II-MOO algorithm to deal with the aforementioned multi-objective optimization involving multiple parameters.
Sorption-based CO2 capture is an emerging and commercially available technology of carbon capture, utilization, and storage (CCUS) [26,27,28,29]. It is mainly achieved by high-temperature (HT) absorption or low-temperature adsorption [30], both of which include two processes, adsorption/absorption and desorption. During the adsorption/absorption, CO2 is separated from diluted or concentrated sources and captured by sorbents at a descending speed. Once the sorbents are saturated, the desorption process occurs, during which the sorbent is heated to release the bound CO2 and thus regenerate the sorbent for the next cycle of sorption. The captured CO2 can be further converted into high-value products [31] or sequestered within mineral carbonates [32,33]. Because the CO2 concentration in light industries’ exhaust gas varies from 400–2000 Pa [34], sorption-based CO2 capture is suitable for dealing with industrial waste gas.
Herein, this research proposed an industrial building-integrated solar-driven CO2 capture system consisting of a two-chamber adsorption-based carbon capture device (CCA) and rooftop vacuum solar photovoltaic/thermal collectors (PV/T). Here, CCA removes CO2 from the exhaust CO2-rich gas from the factory, generated by either workers’ expiratory or the manufacturing process. PV/Ts supply thermal energy to support CCA’s desorption process and electricity for factory production, while the collected high-purity CO2 can be sold to factories as raw material. First, this study presents the time-dependent analysis on both CO2 uptakes and energy flows to demonstrate the energy-mass transfer pattern and to ensure that the integration is unobstructed and effective. Then, the integrated system’s performances, characterized by captured CO2 mass, exergy efficiency, generated electricity, and net costs, are closely related to the involved subsystems’ working parameters, such as capture air flow rate, adsorbent mass, PV/T area, solar irradiance, and CO2 concentration in the feed gas. To disentangle and articulate the effects of multiple working parameters on the integrated system’s dynamic techno-economic performances, the NSGA-II-based multi-objective optimization method (NSGA-II-MOO) is adopted to find the optimal parameter configurations that can satisfy the constraints on these performances. The remaining sections are structured as follows. Section 2 describes the modeling details of the techno-economic performances of the building-integrated solar photovoltaic/thermal collector system. Section 3 illustrates the dynamic simulation process and optimization framework for the entire system. Section 4 presents the multi-objective optimization of maximizing the CO2 reduction, energy utilization efficiency minimizing cost concerning the dual effects of crucial system parameters. Section 5 presents the conclusion and outlook.

2. Materials and Methods

This section contains a brief description of the integrated industrial capture scheme and a detailed explanation of the mathematical formulations of each sub-system. The weather data in Hong Kong, including solar irradiance, ambient temperature, and relative humidity, are taken from realistic weather conditions from Energy Plus [35].

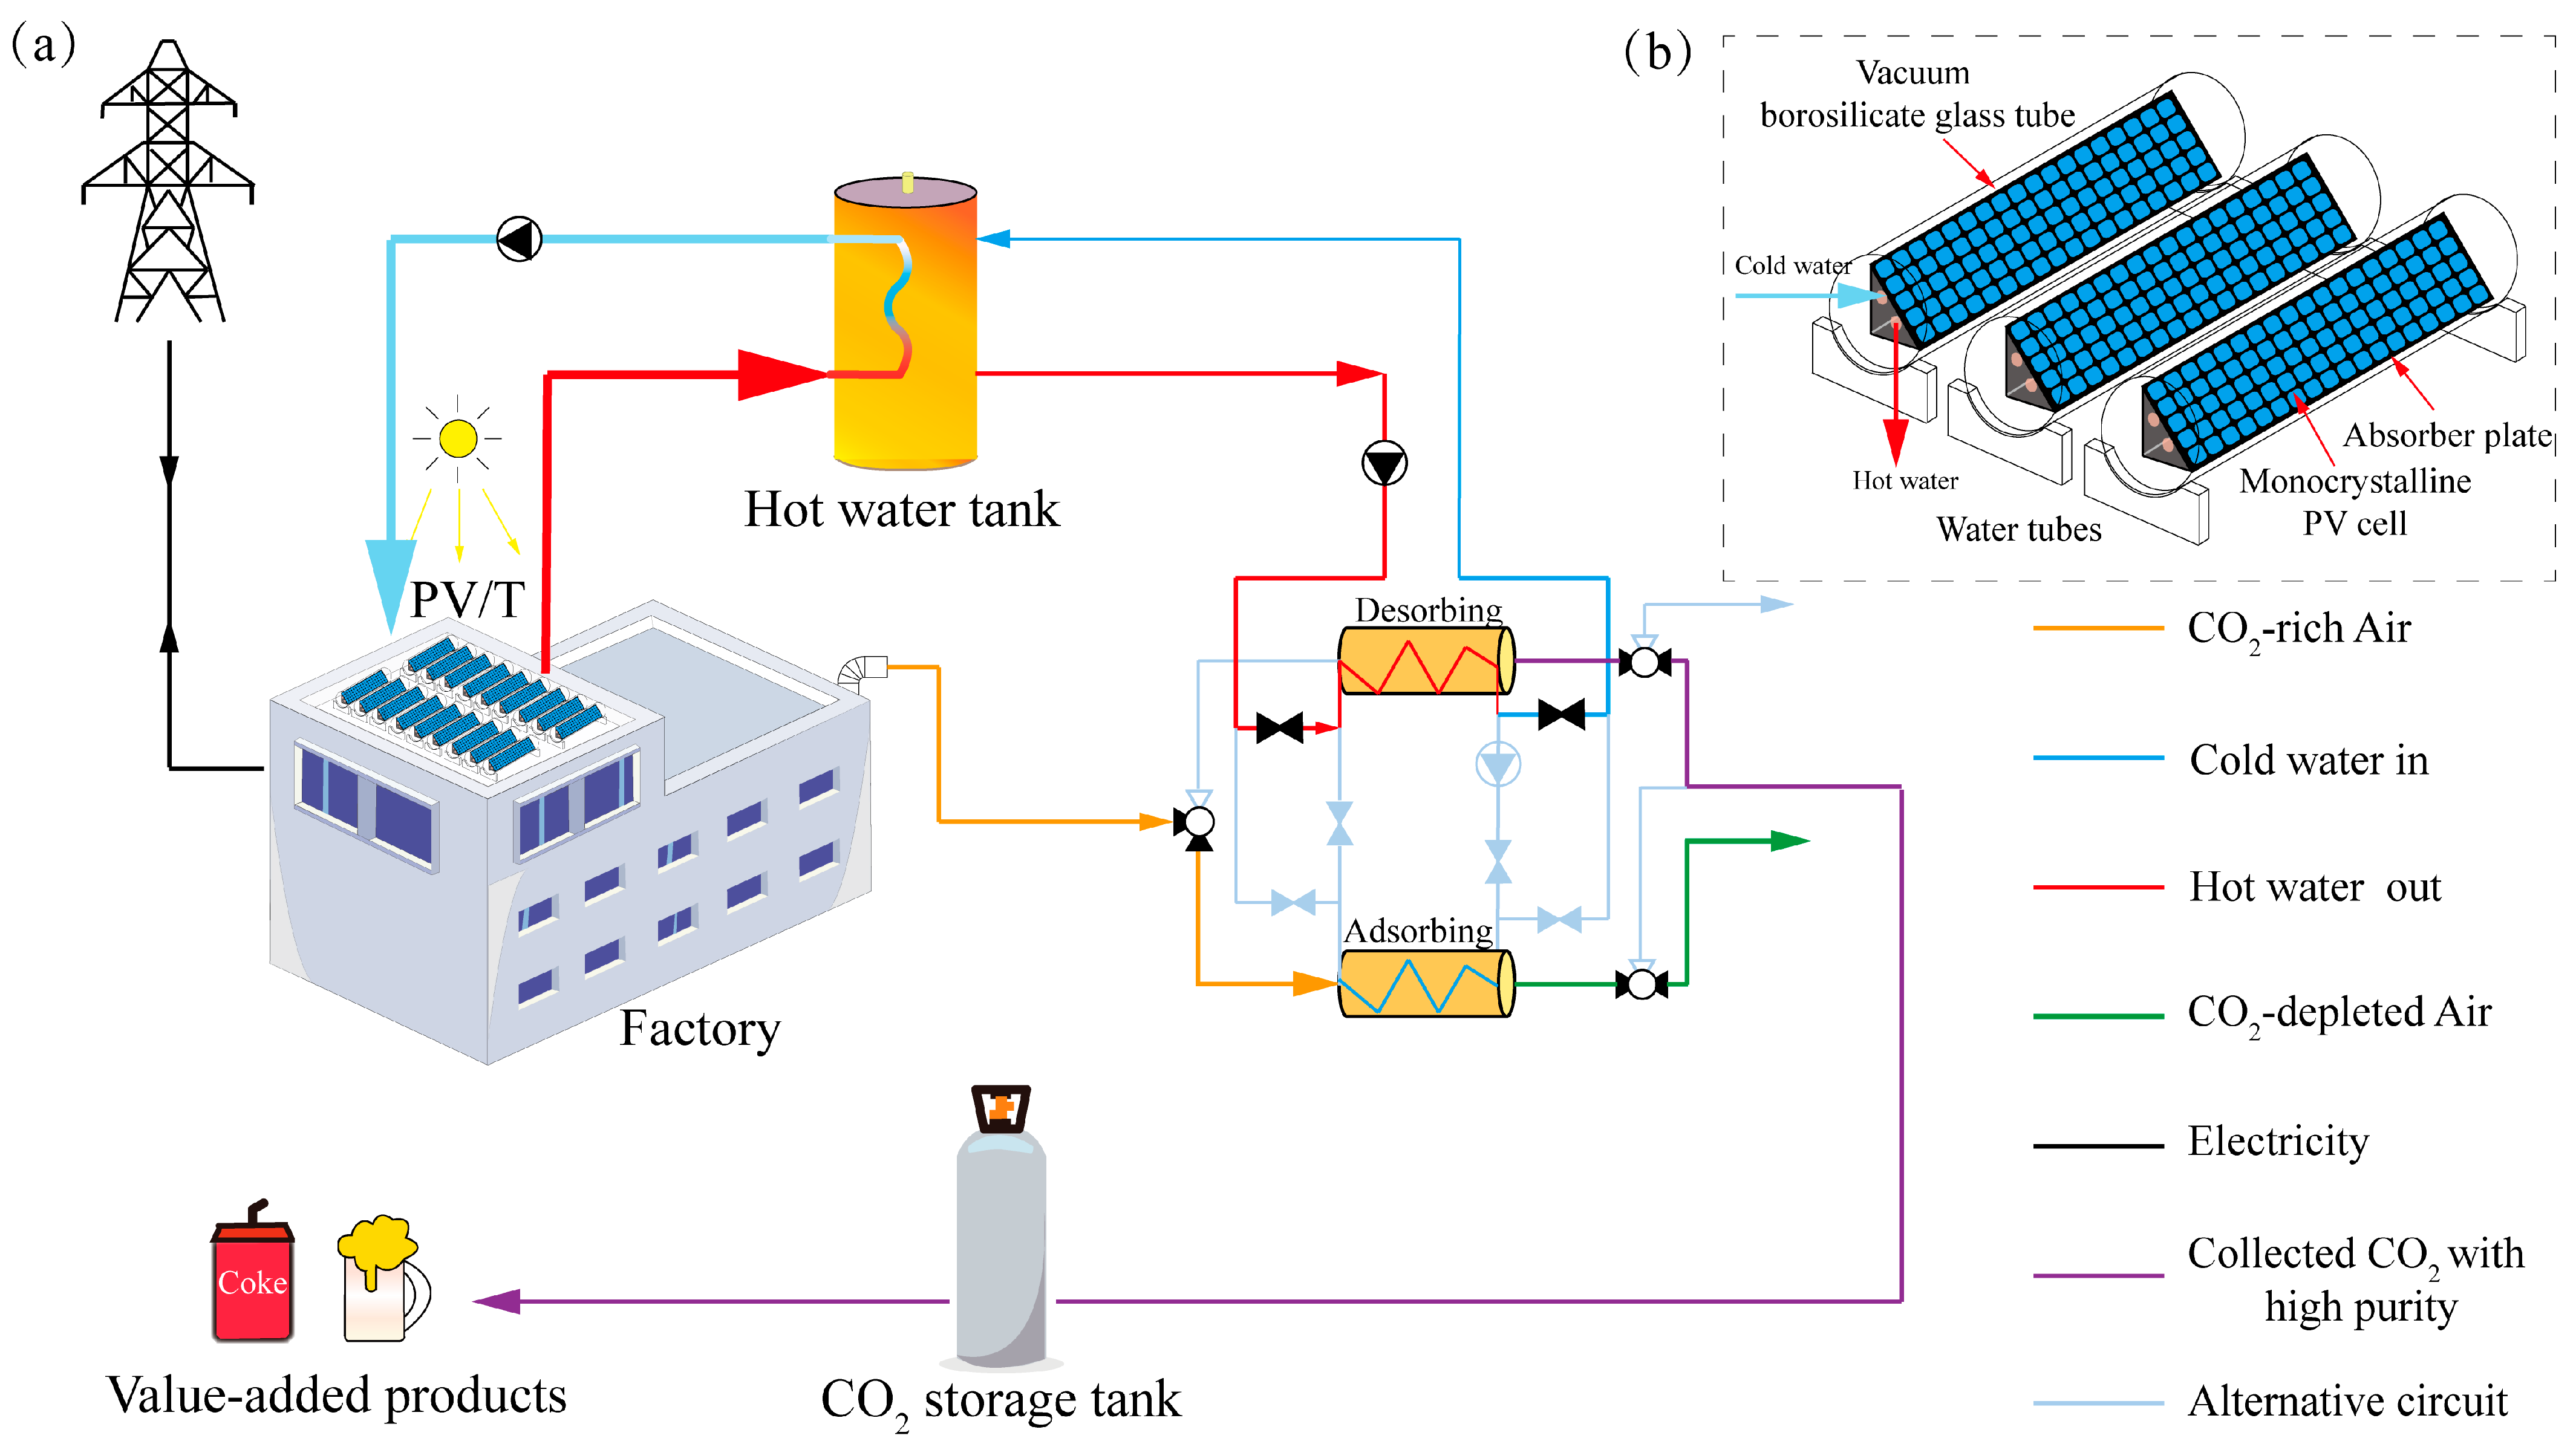
2.1. The Overall System

Figure 1 presents a sketch of the solar-driven CO2 capture system integrated into a factory building for combined CO2 capture and power production. The proposed system comprises a light/medium industrial building, a mini rooftop solar farm, and an adsorption-based TSA capture unit. The light/medium industrial building exhausts gases with CO2 partial pressure between 400 Pa to 2000 Pa [36], generated by workers’ expiratory or manufacturing process, whereas the atmospheric CO2 concentration is only around 40 Pa. Multiple vacuum PV/T devices (shown in Figure 1b), referenced from SunPower X21–470 series [37] and a company from [38], form the solar field on the roof. They generate electricity and hot water at temperatures between 50 and 100 °C. Hot water with such a temperature is suitable for heating the CO2 desorption process. The generated electricity can be output to the power grid. Buffer devices, such as hot water tanks, are included for stable energy output. A classic dual-chamber temperature-swing adsorption (TSA) cycle is adopted for CO2 capture from the factory flue gas [39]. The cycle usually includes three steps: adsorption, desorption, and internal heat exchange between the two chambers. For adsorption, CO2 from flue gas is selected and bound onto the adsorbent (Zeolite 13X, characteristics obtained from [40]) while other gases flow through the chamber and are discharged into the atmosphere. When the adsorbent approaches a given saturation limit, hot working fluid from thermal collectors flows through the chamber to heat the adsorbent. Once the adsorbent temperature approaches a given desorption temperature slot, the desorption process kicks in. This is when the CO2 desorbs and gets collected for further factory use. Once the CO2 concentration at the outlet approaches a given lowest limit, it indicates that the desorption process is completed, so as the other chamber’s adsorption process. These two chambers exchange residual heat/cool for precooling/heating at this stage, indicating the end of one cycle.

2.2. Technical Objectives

Equation (1) is the thermal balance equation of the vacuum PV/T subsystem, based on the Frist thermodynamic law for energy conservation.
Q s = Q w + P P V + Q r + Q c
Q s is the total solar irradiance incident to the PV panel (W); Q w denotes the collected thermal energy by flowing working fluid along the base of the solar panel; P P V is the generated electricity by PV panel; Q r is the radiative heat loss into the sky and outer space;   Q C is the convective heat loss into the ambient environment;
{ Q s = G × A P V × α Q w = m ˙ f l u i d C f l u i d ( T o u t T i n ) P P V = Q s × η r e f × [ 1 β r ( T P V T r e f ) ] Q r = ε r σ A P V ( T P V 4 T s k y 4 ) Q C = h a i r × A P V × ( T P V T a m b ) }
Here, G is the total radiation summed by direct normal irradiance (DNI) and diffuse horizontal irradiance (W/m2); A P V defines the PV panel’s surface area (m2), which is assumed to be equal to the absorber plate’s area. α is the absorptivity of the PV cell ( α = 0.9 ). m ˙ f l u i d is the mass flow rate of working fluid, kg / s ; C f l u i d is the constant pressure specific heat capacity,   ( J / ( kg   K ) ; T o u t and T i n are the temperatures at the outlet and inlet of the heat exchanger inside the tank, respectively. η r e f is the reference efficiency of solar cells at Standard Testing Conditions (21.7%, [37]); β r is the power temperature coefficient of PV efficiency;   T P V and T r e f are the panel surface area and reference temperature that achieves η r e f ( T r e f = 298.15   K ), separately. ε r is the emissivity factor subject to the entire spectrum; σ is the Stephan–Boltzman constant; T s k y is the sky temperature, obtained from [41]; h a i r is the convective heat transfer coefficient of air ( h a i r = 0 for vacuum solar thermal collectors;   T a m b is the ambient air temperature. The total electricity output Z e l e is the integral of P P V :
Z e l e = t m i n t m a x P P V ( t ) d t
From which, the electrical efficiency can be obtained:
η e l e = Z e l e / t m i n t m a x Q s ( t ) d t
Similarly, the thermal efficiency of PV/T can also be evaluated:
η t h e r m a l = t m i n t m a x Q w ( t ) d t t m i n t m a x Q s ( t ) d t
To calculate the exact values of the above energy sectors, the temperature of PV/T’s inlet and outlet should be calculated first as below:
{ T i n ( t ) = T d e s ( t 1 ) T o u t = 1 2 × ( T P V + T i n ) }
T i n equals to the desorption temperature from the last time step. T o u t is equal to the average value between T i n and the surface temperature of the PV panel T P V ( K ), which is solved by Quasi–Newtonian solver. Before introducing the thermal equilibrium relationship of the CO2 capture process, the mass transfer kinetics based on the linear driven force (LDF) model for micropores is first introduced. Each adsorption chamber for the CCA subsystem is filled with Zeolite 13X (whose properties can be referred to the authors’ previous work [39,42] and Ben–Mansour et al. [43]), a common adsorbent material with high stability, low adsorption heat, and low cost.
Z C O 2 = t m i n t m a x m ˙ C O 2 ( t ) d t
Z C O 2 is the total mass of collected CO2 in kg; m ˙ C O 2 ( t ) is the real-time amount of CO2 that binds onto the sorbent.
m ˙ C O 2 ( t ) = k C O 2 × ( m C O 2 * m C O 2 ( t )
k C O 2 is the adsorption time constant of CO2 ( s 1 ), decided by the particle size of the sorbent; m C O 2 * caps the equilibrium adsorption amount of CO2 (mol/kg) obtained by the Langmuir adsorption isotherm model:
m C O 2 * = m 0 × K × P C O 2 1 + K × P C O 2
m 0 is the CO2 uptake amount that is dependent on the adsorbent’s temperature; K is the Toth fitting constant obtained from empirical formulas [43,44]. P C O 2 is the partial pressure of CO2 in the feed air (Pa);
m 0 = 0.0145 × T C C + 7.351
K = K 0 × e H R T C C
K 0 is a constant decided sorbent temperature (Pa−1) [45], while H is the adsorption heat (J/mol) of CO2 of 43,000 J/mol from [43]; T C C is the real-time sorbent temperature during adsorption or desorption process. Here, the simulation of mass transfer kinetics of adsorption/desorption is finished. Other than mass equilibriums, the thermal energy transfer is also simulated and introduced.
( m s o r ( 1 / 2 ) C p ( s o r ) + i = 1 3 m ˙ C O 2 ( t ) C p ( C O 2 ) ) d T C C d t = Q A + Q h + Q d e s
Here, m s o r ( 1 / 2 ) is the adsorbent material mass of each chamber (kg), equal to half of the total sorbent material m s o r ; C p ( s o r ) and C p ( C O 2 ) are the specific heat capacity of the sorbent material and CO2 (J/(kg K)). Water tubes are distributed evenly inside the material for heating when desorption occurs. The two-chamber design and heat exchange concept are adopted to avoid heat waste. During adsorption and desorption, the material undergoes heat transfer due to the isosteric heat Q h from the adsorption/desorption reaction and convective heat transfer Q A from the flue gas (during absorption) or flowing hot water Q d e s (during desorption). Thus, the thermodynamic balance can be expressed as Equation (11) shows. The calculation of the aforementioned thermal sectors is introduced below:
{ Q A = { h a i r A a ( T a d T C C ) , 0   adsorption otherwise Q h = i = 1 3 m ˙ CO 2 ( t ) × H Q d e s ( t ) = { k H 2 O A p ( T C C ( 2 ) ( t ) T C C ( 1 ) ( t ) ) k H 2 O A p ( T d e s ( t ) T C C ( t ) ) 0   Internal    Heat   exchange   Desorption     adsorption }
Here, h a i r is the coefficient of convective heat transfer of the flowing air, which is decided by the airflow speed (in other words, the mass flow rate of the feed air m ˙ f e . A a is the contact area between the air and adsorbent material (m2);   T a d is the adsorption temperature, which in this case, since the feed air is directly the exhaust gas from industries, the adsorption temperature equals the ambient temperature.   k H 2 O is the heat transfer between heating fluid and sorbent material (J/(kg K)); A p is the contact area between the hot fluid pipe and sorbent material (m2). The subscripts of 1 and 2 of T C C are the real-time temperature of chamber 1 and chamber 2, respectively. At this stage, the heat variation of each chamber during the internal heat exchange step can be calculated. During desorption, Q d e s is the heat exchange between hot fluid pipes and sorbent materials based on the difference between the targeted desorption temperature T r e g and sorbent temperature T C C . T r e g is also the temperature of the buffer tank and is calculated as below:
T d e s ( t ) = T d e s ( t 1 ) + ( Q w ( t ) Q d e s ( t 1 ) ) m t a n k × C H 2 O × d t
where m t a n k is the water mass inside the heat storage buffer tank (kg);   C H 2 O is the specific heat capacity of water (J/(kg K)); As a result, the total thermal energy consumption for supporting the desorption process is integrated by:
E C O 2 = t m i n t m a x Q d e s ( t ) d t
The thermal efficiency η C O 2 during the desorption heating process is evaluated as:
η C O 2 = E C O 2 E w
The separation performance of the CO2 capture process is estimated in the definition of the CO2 recovery rate γ r e c o v e r , which is the ratio between the collected CO2 mole number at the outlet n o u t , and the total CO2 mole number at the inlet that is being treated n i n .
γ r e c o v e r = n o u t n i n
To evaluate the practical energy utilization efficiency of the entire system, an exergy efficiency is defined on the entire exergy flow process, covering from the solar input to the actual exergy of the captured CO2. The exergy efficiency Z e x e is defined as the ratio of minimum separation work to actual exergy inputs:
Z e x e = W M i n X
W M i n is the minimum power requirement for CO2 capture as depicted by the Gibbs free minimum energy separation law [46]. Specifically, for any generalized separation process, W M i n is calculated as follows:
W M i n = T a [ n o u t i = 1 3 y o u t ( j ) ( t ) log e y o u t ( j ) ( t ) + n w a s t e i = 1 3 y w a s t e ( j ) ( t ) log e y w a s t e ( j ) ( t ) n i n i = 1 3 y I n ( j ) ( t ) log e y I n ( j ) ( t ) ]
where T a is the reference temperature condition (K); n is the molar flow rate; y is the molar mass fraction. In this formula, in, out, and waste subscripts refer to the inflow flue gas, captured gas sample, and uncaptured gas streams. X is the time-average solar exergy of the total solar exergy input X Q s , while X Q w is the total collected exergy by flowing working fluid.
X Q s = Q s × ( 1 + 1 3 × ( T d e s o r b T s u n ) 4 4 3 × T d e s o r b T s u n
X = t m i n t m a x X Q s ( t ) d t / ( t m a x t m i n )
X Q w = t m i n t m a x Q w ( t ) × ( 1 T i n ( t ) T o u t ( t ) ) d t
For a better demonstration, the exergy flow chart of the integrated system is shown in Figure 2. Figure 2 shows the exergy flow pattern throughout the entire system. Before the total exergy successfully reaches the PV/T panel, exergy loss happens due to convective loss, radiative loss, or conductive loss. Then, the useful exergy collected by the PV/T sectors X is converted into electricity and thermal energy, respectively. The thermal heat collected is converted into exergy X Q w , while during the heating process, another exergy loss happens. The exergy heat loss is the most significant sector of the entire process due to the large sorbent mass to be heated and achieving the desired regeneration temperature. To fairly report an exergy efficiency that elucidates the actual exergy utilization efficiency, this research thus defines the exergy efficiency as the ratio of the minimum separation work of the collected CO2 exergy W M i n over the total solar input X .

2.3. Economic Objective

Capital cost, maintenance cost, operation cost, CO2 product profit, and power production profit form the net present value (NPV, negative for cost, positive for profits).
N P V = N c o s t + N p r o f i t
The levelized NPV, Z L C C of the entire system ($/ton) is calculated as below:
Z L C C = N P V / ( Z C O 2 × 360 × 25 )
Here, the dominator is the total collected CO2 mass in a 25-year lifespan. Notably, a total 6-day maintenance period is assumed for the system’s operation. Therefore, the actual working time of the system per year is 360 days.
{ N c o s t = c c a p + i = 0 24 ( c m a i n + c o p e r ) × ( 1 + R i n f l a t i o n ) i N p r o f i t = i = 0 24 ( p C O 2 + p e l e ) × ( 1 + R i n f l a t i o n ) i }
When calculating the total cost of the proposed system, three main costs are considered, including the capital cost spent at the very start to purchase all the equipment and material, such as water tanks, fans, pipes, valves, pumps, vacuums, etc., the maintenance cost and the operation cost that mainly includes the cost of electricity consumed. An inflation rate based on the data in the Chinese market is considered, considering most prices of the products are referenced by Chinese markets. For profits, the captured CO2 can be sold for making value-added chemicals, food, hydrocarbon fuels, etc., while the electricity can be exported and sold to the local grids. p C O 2 and p e l e are the profits made by selling CO2 and electricity, respectively.
Common CCUS costs 8–205 USD/ton CO2 [47], while pilot DAC costs 94–232 USD/ton CO2 [48]. The subsidy for installing solar power is ignored in this cost analysis due to a lack of publicly confirmed and accessible data resources. Table 1 lists the components involved and their detailed costs/profits. During the capture process, the auxiliary systems, such as vacuum pumps, fans, etc., whose electricity consumption from either power grid is treated as a cost sector, though which can be compensated by the power generated by PV/T in practical scenarios. A power consumption factor of 78 kWh/ton CO2 is assumed here, combinedly considering the power consumption by blowers and vacuum pumps [49]. It is assumed that there are twice maintenances in each year. During each maintenance, the whole system shuts down for three days and costs 2500 USD. The rooftop PV/T costs 500 USD/m2, referenced from [50], plus by installation fee. Another installation fee of 35,000 USD is included for any costs spent during the installation process of the CO2 capture system. The sorbent, specifically Zeolite 13X, costs 6200 USD/ton [51] and is replaced on a 200-day basis, evaluated based on [52]. For the case with 5.5 tons of sorbent material for each use, it consumes 9.9 tons of sorbents in total per year. All the major auxiliary system costs are also listed in the table, among which most prices are taken from Alibaba.com. It is assumed that they can all survive to the final year without further replacement. If any, it would be digested by the maintenance fee.
The system’s profits come from two sectors, PV/Ts’ generated electricity and collected high-purity CO2 (>90%). They can be all either internally used by the factory itself (depending on the exact industry type) or sold to the market directly. The levelized electricity cost is assumed to be 0.16 USD/kWh for Hong Kong or the USA, according to [53]. However, here we also add another 0.44 USD/kWh of the cost that is related to power consumption, imposed by auxiliary uses. On the other hand, the levelized profit for selling electricity is 0.38 USD/kWh, referenced from the second tier of the feed-in tariff scheme in Hong Kong [54]. The levelized profit for selling CO2 is 1000 USD/ton [55], for which we note that this levelized profit for pure CO2 varies vastly in different markets, in which 1000 USD/ton is somewhere between the highest of 10,000 USD/ton and the lowest of 600 USD/ton. Taking the case with 5.5 tons of sorbents and 50 m2 PV/T area as an example, Table 1 highlights that the most significant sector of the cost is sorbent material, which especially requires regular replacement due to its incompatible adsorption capacity after repeated cycles. This case finally captured 1867.6 tons of CO2 in 25 years, achieving a levelized CO2 profit of 100.8 USD/ton. We note the other prices for such as pipes, batteries, valves, etc. are from local Chinese markets.
Figure 3 presents a holistic cost analysis of the system. Specifically, Figure 3a is the net cost-profit value based on 25 years of operation, subject to different sorbent mass being used. It is evident that higher sorbent mass decreases the benefits though it can increase the yield of CO2 mass. m s o r = 6 tons is a turning point, indicating that a sorbent mass higher than 6 tons makes it far more challenging for the system to maintain a profit. Figure 3b compares the share percentage of each cost sector among the total cost. Here, the cost of replacing sorbents from time-to-time accounts for 83.5%, followed by a maintenance fee of 6.8%, operation costs of 4.8%, solar PV/T costs of 2.7%, and other auxiliary costs of 2.3%. The pie chart again highlights the importance of developing durable and robust sorbent material that can avoid frequent replacement to decrease the net CO2 costs effectively. Figure 3c compares the yearly net cost-profits of two cases with different sorbent mass, m s o r , 5.5 tons and 6.0 tons. Both cases start from negative values, indicating costs. As time goes by, both cases costs more and make profits. However, case m s o r = 5.5 t makes more profit than cost after year 2029, while case m s o r = 6.0 t fails to achieve a net profit within a 25-year lifespan. They obtain a levelized CO2 profit of 100.8 USD/ton and a levelized CO2 costs of −128.4 USD/ton, respectively.

3. Optimization Framework

The methodology adopted in this study to simultaneously obtain high captured CO2 mass, energy utilization efficiency, and low costs is described in the following flow chart (see Figure 4), whose details are described in the following steps.
Step 1: The process starts with the time-dependent simulation of the PV/T-CCA model via a quasi–Newtonian solver, which can solve complex mathematical problems. Weather conditions, including ambient temperature T a m b , solar radiation G , and relative humidity (RH) are considered because they affect solar PV/T’s energy conversion performance. Other parameters, such as PV/T area and sorbent mass determining the integrated system’s scale, are also considered. Working environmental parameters such as CO2 concentration and feed speed are also considered. More specifically, the PV/T area and solar radiation directly affect the solar system’s electricity/thermal yield, thus deciding the CO2 capture device’s desorption temperature. The above key system parameters are treated as user-defined inputs ( x 1 ~ x 5 ): solar irradiance I r r . , PV/T area A P V / T , sorbent mass m s o r , feed CO2 concentration P c o 2 , and mass flow rate of feed air m ˙ f e . Notably, x 1 ~ x 5 are not exhaustive system configurations, and other factors, such as hot water flow rates, wind speed, chamber size ratio, etc., which have trivial effects on the systems, are treated as constants. After a 12-day simulation, the corresponding objects are obtained, including total CO2 mass, levelized CO2 cost-profit, generated electricity, and exergy efficiency. Then the daily averaged performance of the above objectives is processed through a 25-year lifespan (a normal lifespan for the solar system [56]). The final results are then treated as the inputs of step 2.
Step 2: The mathematical relationships between each objective and the system parameters in step 1 are obtained through MATLAB’s Quadratic-based fitting tool. Thus, the objective functions Z i (i = 1~4) based on different paired parameters that have direct and closely mutual impacts can be obtained. The summary specifications of each decision parameter from x 1 x 5 and objectives are shown in Table 2. Here, it is noted that “cheapest” and “optimal” are not synonymous because the NSGA-II constraints are defined for all four objectives. It would not automatically prefer the configuration that achieves the lowest costs or highest profits. These objective functions are then utilized in Step 3.
Step 3: NSGA-II MOO emulates the natural selection principles in nature and only survives the fittest species for being the next generation. First, the population size, P, is given. NSGA-II takes the fitted functions from the surface fitting process as the objective function Z. The “parents“ are being evaluated and ranked, selecting parents to enter the next generation by applying crossover and mutation based on arbitrarily defined constraints. Here, the constraints mainly include: | Z L C C | < 300 USD/ton, γ r e > 50 % , Z e x e > 4 % . Then the “offspring” generated by these parents will be put into a mixing pool with the “parents“, and the top populations will then be ranked and selected for the next iteration. Once the population satisfies the given population number, P, the algorithm enters the next iteration until it approaches the given iteration number limit. The algorithm repeats iteration until there are enough populations.
By applying the above steps, it is feasible to explore and unfold the interaction relationship between each parameter and their combined effects on the multi-objective functions of the proposed system. Their co-effects are detailly depicted in the following three subsections. Before entering the results section, a dynamic demonstration of the system’s solar energy gains, chamber temperature, and CO2 uptakes are shown in Figure 5 to uncover the time-dependent working principles behind the entire objective-oriented optimization process. Specifically, the weather data for each month is hourly averaged to form an “average day”, meaning that 12 days now represent a whole year variation. As the proposed system’s primary energy source, time-varying solar energy input in Figure 5a decides the variation of the proposed system’s real-time chamber temperature in Figure 5b and CO2 uptake amounts in Figure 5c, all of which share similar trends. For example, solar radiation is weaker from February to April in Hong Kong, leading to less heat collected. As a result, the chamber temperature struggles to exceed 40 °C in Figure 5b, the bottom limit of desired regeneration temperature. Yet, according to the linear driven force model, the desorption temperature highly decides the final collected CO2 amount. Unideal regeneration temperature thus fails to desorb a decent CO2 amount in Figure 5c, depicted by the narrower shaded area. On the contrary, the solar radiation peaks from June to August, when the collected heat in Figure 5a is abundant to achieve regeneration well above 60°C, indicating effective desorption, as depicted in the larger shaded area in Figure 5c. Taking the average performance of the above 12 days, an average day of the entire year is obtained, which is further used in the following long-term simulations.

4. Results and Discussion

The rooftop PV/T subsystem [42] and CO2 capture subsystem’s breakthrough curve [57] have been validated in the authors’ previous work. Furthermore, another validation of the CO2′s adsorption isotherm is compared to the experimental data obtained from J. Lee et al. [58] at an adsorption temperature of 293 K. The simulation and experimental data of CO2 uptake amount against different CO2 partial pressure P / P 0 are shown in Figure 6a. It can be seen that the CO2 uptakes results are in good agreement with the experimental data. Notably, a plateau, meaning the equilibrium adsorption capacity, puts a cap for both simulation case and experiment case. Apart from validating the CO2 capture model, this section also provides the average non-domination convergence plot of the NSGA-II iteration process. Specifically, the average fitness value projected to the iteration number is shown in Figure 6b. During non-domination converge process, there is a population of 100 solutions that have met all the constraints being generated. The genetic algorithm converges where the Pareto front is located (average fitness value = 1), which means that all the solutions are in Rank 1. Here, all the obtained solutions cannot further improve any objective’s value without making another objective worse than any other solutions [59]. According to Figure 6b, the average fitness value converges towards 1 after 12 iterations, which means that all the solutions obtained after the star-marked final iteration are the desired Pareto front solutions.
As an integrated system consisting of multiple complex and dynamic models, it is vital to ensure the energy–mass balance relationship between different subsystems to ensure essential performance and avoid energy-mass loss as much as possible. In the results section, the multi-objective optimization results subject to four main objectives are presented in a way that prioritizes the energy-balance principle, which is reflected by the relative relationship between sorbent mass m s o r and the amount of input solar energy, characterized by A P V / T and I r r . (solar irradiance). Another way that prioritizes the mass-balance principle, which can be reflected by the relative relationship between the mass flow rate of feed air ( m ˙ f e ) and CO2 partial pressure ( P C O 2 ) in the feed gas.

4.1. Optimization Based on the Energy-Balance Principle

PV/T area ( A P V / T ) and sorbent mass ( m s o r ) act as the energy supplier and consumer, like two ends of the energy seesaw that combinedly decide the supply–demand balance. Therefore, they are good players in deciding the integrated system’s energy-balance situation, which is vital for this study’s other objectives. If supply/demand vastly exceeds the other one, the balance is broken, resulting in more energy loss (supply >> demand) or high net levelized cost (supply << demand). Through the ranking and selection process of NSGA-II, the optimal four objectives ( Z C O 2 , Z L C C , Z e l e , Z e x e ), subject to dual-variables of A P V / T and m s o r are obtained and shown in Figure 7 in sequence. Despite that all have satisfied the given constraints, the obtained objectives still vary from each other due to the complex intertwined relationship between A P V / T and m s o r . Specifically, Z C O 2 is mainly dependent on m s o r and the larger m s o r , the more Z C O 2 can be achieved. A P V / T , however, has ignorable relations to Z C O 2 if m s o r remains constant. One reason is that that the chosen A P V / T range here is already screened to satisfy an essential thermal energy input by a beforehand trial-and-error process and the constraints set in the NSGA-II process. Another reason is that a constant m s o r already puts a cap on the CO2 capacity, while A P V / T decides how close the actual CO2 capacity is to the given cap limit. In Figure 7a, when m s o r = 7.0   t , the captured Z C O 2 increases from 210 kg/day to 230 kg/day (equivalent to a capacity of 0.79~0.87 mol/kg, close to that reviewed in [60]—0.75 mol/kg) when the A P V / T increases from 50 m2 to 100 m2.
As shown in Figure 7b, Z L C C is also majorly decided by m s o r rather than A P V / T , a finding that can be mirrored in [61,62]. The increase in m s o r would lead to decrease in Z L C C . For example, when m a increases from 4.5 tons to 8.0 tons, Z L C C becomes profitable (170 USD/ton) from costly (−280 USD/ton), resulting in a variation of 160%. This can be explained by the vast cost of regular replacement of the sorbent owing to the inevitable degradation nature, as detailed in [42], especially for long-term use. Usually, it gets harder and harder to make profits out of this integrated system if m s o r increases. Specifically, when m s o r is higher than 6.0 ton (indicated by the “break-even curve” in Figure 7b), all the Z L C C are negative values, indicating the costs exceeds profits. In contrast to the relatively negligible contribution to Z C O 2 and Z L C C , A P V / T does play a vital role in Z e l e and Z e x e (Figure 7c,d). It is straightforward that a higher A P V / T yields more solar thermal/electricity supply ( Z e l e ). This means that the corresponding supplied exergy gets higher and thus lowering the Z e x e given a constant energy consumer m s o r . For example, for m s o r = 7.0 t, as A P V / T increases from 50 m2 to 100 m2, Z e l e increases from 38 kWh to 70 kWh while Z e x e decreases from 6.9% to 4.0%, showing significant impacts of A P V / T on Z e l e and Z e x e (Figure 7c,d). Another finding is that larger A P V / T cases can allow bigger range of m s o r to still achieve the break-even line (Figure 7b). This is because of the plain fact that larger A P V / T provides more thermal energy for the consumer m s o r to capture sufficient CO2, which may increase the profits to compensate for the cost. Based on the above dual effects, the Pareto optimization results achieved the final front to balance the above trade-off.
Figure 8 shows the interaction between solar irradiance ( I r r . ) and sorbent mass m s o r , considering they, respectively, directly determine the amount of energy supply and consumption, mirroring an energy-balance issue. Unlike A P V / T deciding the thermal energy amount, I r r . defines the quality of thermal energy, i.e., the regeneration temperature it can achieve. Theoretically, a perfect energy balance between solar irradiance and sorbent mass should minimize energy loss. Any imbalance would cause either low desorption, thus less CO2 collected, or more heat loss and, thus, lower exergy efficiency. Usually, that would present a corresponding higher solar irradiance, and a higher sorbent mass is required (throughout Figure 8a–d). Usually, intense solar irradiance represents a more substantial desorption process, which stimulates the sorbent mass to increase to maintain pleasant CO2 mass Z C O 2 (Figure 8a) and reasonable exergy efficiency (Figure 8d). However, doing so would inevitably increase the cost (Figure 8b). Notably, according to Figure 8c, for cases with the same I r r . , varying m s o r does not contribute to the generated electricity Z e l e , which appears to be exclusively decided by I r r . This also means that the allowed m s o r decreases as solar irradiance increases, constrained by Z L C C which does not allow a net levelized cost lower than −300 $/ton.

4.2. Optimization Based on the Mass-Balance Principle

The mass balance of the integrated system emphasizes the gas components at the sorption chamber’s inlet and outlet to track the flow of CO2. Figure 9 presents the dual effects of mass flow rate ( m ˙ f e ) and CO2 partial pressure ( P C O 2 ) of the feed gas on the four objectives. A common trend between m ˙ f e and P C O 2 for all subfigures, which is an inverse relationship. This means that if one increases, the other has to decrease. The reason is that the multiplication of these two variables is the mass flow rate of CO2, indicating the instant CO2 amount at the inlet to be treated. This value is, however, controlled by the NSGA-II process, so to ensure the other objectives, such as recovery rate (>50%) and exergy efficiency (>4%). However, still, in Figure 9a, for the same mass flow rate of the feed gas m ˙ f e , more CO2 can be yielded and thus enables the cases jumping over the “break-even curve” in Figure 9b. Intuitively, m ˙ f e is not directly related to the amount of generated electricity by PV/T, but in Figure 9c, it has a mild impact on Z e l e . One possible reason is that m ˙ f e affects the adsorption-desorption cycle numbers in a day and thus the PV/T cell temperatures, which has a significant impact on PV/Ts’ electrical efficiency. The exergy efficiency of the entire system would depend on the useful yield work ( W m i n ), i.e., the collected CO2 amount. This explains why the Z e x e in Figure 9d, shares the same distribution pattern as Z C O 2 in Figure 9a, given the same solar thermal energy inputs.

4.3. Sensitivity Analysis

A sensitivity evaluation is conducted on 100 optimal cases to elucidate their distribution behavior concerning each goal and thus articulate their impacts on different objectives. To reflect the distribution range, a set of base values of working parameters (shown in Table 3) is chosen here as the benchmark (marked as “1”) based on the trial-and-error principle, which forms a five-parameter configuration that yields desirably good performance. Figure 10 describes the respective effects of each operating parameter on the four objectives based on the obtained 100 optimal cases. It can be found that some parameters have sporadic (dispersed distribution) contributions to the final objectives, while others have striking contributions (Vertically compact distribution) to the objectives.
As shown in Figure 10a, the objective of Z C O 2 , collected CO2 mass per day, is mainly dependent on the sorbent mass m s o r and hourly average solar irradiance I r r . with other parameters having relatively minor influences on it. Either increasing m s o r or I r r . leads to a higher   Z C O 2 . This is because the former directly determines the CO2 uptake capacity per cycle, while the latter plays a key role in the desorption temperature (see Equations (2) and (14)) and thus the amount of desorbed CO2 (see Equation (11)) per cycle. It also suggests that pursuing a higher Z C O 2 should prioritize regulating m s o r and I r r . Moreover, compared to other parameters, m s o r greatly influences the levelized CO2 cost-profit of Z L C C (as shown in Figure 10b): higher m s o r results in smaller Z L C C and even negative Z L C C . It originates from the combination of the almost linear increase in the cost and the gradually plateaued profits under a given range of solar irradiance (limited thermal resource for supporting the desorption process).
Z e l e in Figure 10c is greatly decided by I r r . and A P V / T , following a one-way ascending relationship, meaning that higher solar irradiance or larger PV/T area can yield more electricity. Interestingly, unlike m s o r and m ˙ f e which barely contributes to Z e l e , m s o r has a sporadic impact on Z e l e , because it affects the heat removed from the PV/T panel by working fluid, thus affecting the PV/T panels’ surface temperature, which thus affects the electrical performance. For the exergy efficiency of the integrated system, from a bottom-up perspective, I r r . predominantly affects the exergy efficiency because it is the total exergy input, which is the dominator in Equation (18). Therefore, higher I r r . denotes lower Z e x e , as shown in Figure 10d. On the contrary, P C O 2 and m ˙ f e defines the nominator of Equation (18), the minimum separation work (Gibbs free energy) for removing CO2 from the feed air [46], which, however, has been balanced by the NSGA-II algorithm to ensure a reasonable amount of CO2 input.

4.4. Scenarios Analysis

The sensitivity analysis shows that the variations of P C O 2 and I r r . influence three objectives, namely Z C O 2 , Z e l e and Z e x e , excluding Z L C C , which is almost independent of the two parameters. As the two parameters are closely related to the working environments, scenario analysis is further conducted to elucidate the performance of the three objectives under varying CO2 concentrations and solar irradiance. To better clarify the variations of these objectives, a dimensionless parameter is introduced to describe relative changes in objectives, defined as the ratio of Z to the average value of Z . On the one hand, focusing on industrial CO2 emission, the magnitude of CO2 concentration of the emission gas reflects certainly sized or typed factories.
For example, CO2 partial pressure from 400 Pa to 500 Pa usually represents poultry farms or busy factory workshops [34,63], while 500~1200 Pa usually refers to craft factories or light industries, such as the electronic industry, and above that represents the mid- CO2-intensity industrial process [36], such as automotive industries, pulp and paper mills [64]. As P C O 2 increases from 400 Pa to 1800 Pa, both Z C O 2 and Z e x e increases correspondingly whereas Z e l e keeps almost constant around the average value (Figure 11a). Moreover, craft and small factories can achieve Z C O 2 higher than the average Z C O 2 , as indicated by the ratio for Z C O 2 getting higher than 1 for CO2 partial pressure larger than 800 Pa. For Z e x e , the exergy efficiency exceeds its average value from CO2 partial pressure of around 500 Pa.
On the other hand, the hourly average solar irradiance I r r . throughout the sunshine hours, usually decreases concerning the region’s latitudes. For example, hourly average solar irradiance is from 0.1 kW/m2 to 0.2 kW/m2 for the high-latitude region, from 0.2 kW/m2 to 0.3 kW/m2 for the middle-latitude region, from 0.3 kW/m2 to 0.5 kW/m2 for the low-latitude region, and 0.5 kW/m2 to 0.8 kW/m2 for the equator region. As the region becomes closer to the equator, the hourly average solar irradiance increases, leading to higher Z C O 2 and Z e l e but smaller Z e x e (Figure 11b). For example, at hourly average solar irradiance = 0.8 kW/m2, the Z / Z a v e r a g e of Z C O 2 , Z e l e and Z e x e are 1.05, 2.0 and 0.45, which are 40%, 400% higher, and 75% lower, respectively, than those at I r r .   = 0.1 kW/m2. This is because a higher I r r . enables PV/T to produce more thermal energy input that facilitates the desorption process for enhanced CO2 collection and generates more electricity. Notably, the negative relationship between I r r . and Z e x e stems from the faster growth rate of thermal exergy input ( X ) than the useful separation work ( W m i n ) reflected by the amount of collected CO2, owing to higher exergy loss during heating adsorbent to a higher regeneration temperature.
From the above analysis, the dominant factors of sorbent mass m s o r , PV/T area A P V / T have major effects on the system’s CO2 abatement performance Z C O 2 and generated electricity Z e l e . Hence, this section provides a straightforward performance comparison between two P C O 2 cases and that between two I r r . cases, against different m s o r and A P V / T values. For instance, Figure 12a shows the optimized Z C O 2 for case P C O 2 = 500 Pa and P C O 2 = 1000 Pa. These two cases share similar trend that higher A P V / T provides more power/thermal supply and thus obtains more CO2. Specifically, cases P C O 2 = 1000 Pa has averagely twice of the Z C O 2 than case P C O 2 = 500 Pa. Similarly, when P C O 2 is the same, stronger solar intensity yields more solar energy on the same value of A P V / T , thus obtains more electricity Z e l e , as shown in Figure 12b.

5. Conclusions

To lay the groundwork for decarbonizing the industry sector, this research develops and optimizes an industrial building-integrated solar-driven CO2 capture system based on an NSGA-II multi-objective optimization algorithm. As current methods still adopt carbon-intense energy to support CO2 capture and merely focus on the optimization of the CO2 capture subsystem rather than the whole integrated system, this study fills the gap by considering a wide spectrum of decision parameters and unveil their effects on the new whole integrated system’s techno-economic performances.
Results show that using 6.0 tons of Zeolite 13X to capture the CO2 from a light-CO2-intensity factory with CO2 partial pressure of 1000 Pa, a CO2 capacity of 0.79 mol/kg, a levelized CO2 cost of 128.4 USD/ton (the cost of sorbent material accounts for 83.5% in 25-year lifespan) and exergy efficiency concerning the total solar exergy input of 5–10% can be achieved. This study also disentangles and articulates the impacts of critical parameters on the multi-objectives, including captured CO2 mass, levelized CO2 cost-profit, generated electricity, and exergy efficiency. Detailed guidelines of suitable configurations associated with optimal objective-oriented performances are provided for policymakers and industry owners. Specifically, maximizing the captured CO2 mass requires coordinating solar radiation and sorbent mass to balance the energy supply and demand. Minimizing net levelized CO2 cost should prioritize reducing sorbent mass yet still meeting the required CO2 capacity. Achieving maximal exergy efficiency necessitates regulating the total solar input in response to the CO2 concentration in the feed gas.
Future efforts include conducting a comparative multi-objective analysis that determines the most suitable type of sorbent material that displays high stability, high capacity, and low energy cost.

Author Contributions

Conceptualization, methodology, software, writing—original draft, formal analysis, investigation, editing and revising, visualization, writing, and data curation, Y.S.; conceptualization, writing—reviewing, funding acquisition, and supervision, H.Y. All authors have read and agreed to the published version of the manuscript.

Funding

Studentship is provided by The Hong Kong Polytechnic University and the research project with Ref. No. H-ZJMR.

Institutional Review Board Statement

Not applicable.

Informed Consent Statement

Not applicable.

Data Availability Statement

Not applicable.

Acknowledgments

The authors wish to acknowledge the financial support of the studentship provided by The Hong Kong Polytechnic University and the research project with Ref. No. H-ZJMR.

Conflicts of Interest

The authors declare no conflict of interest.

Nomenclature

Abbreviations
DACDirect air capture of CO2
CCACarbon capture by adsorption
LDFLinear driving force
RHRelative humidity
N P V Net present value
Variables
A P V / T The area of the rooftop evacuated thermal collector (m2)
A p The contact area of water pipes and the adsorbent (m2)
A a The contact area between feed air and the adsorbent (m2)
C H 2 O Specific heat capacity of water at constant pressure (J/(kg K))
c m a i n The maintenance cost ($/year)
c o p e r The operation cost ($/year)
C p ( A ) Specific heat capacity of solid adsorbent (J/(kg K))
C p ( C O 2 ) The specific heat capacity of different gas species (J/(kg K))
E C O 2 The total heat demand for CO2 regeneration (J)
G The magnitude of the incident radiation (Wh/m2)
  h a i r The convective heat transfer coefficient of air
k H 2 O The convective heat transfer coefficient of water
m sor The sorbent mass (kg or ton)
m ˙ f e The mass flow rate of the feed air (kg/s)
n i n / o u t The molar number of inlet/outlet gas species (mol)
p C O 2 The profits from selling collected CO2 ($/year)
p ele The profits from selling generated electricity ($/year)
P C O 2 The partial pressure of CO2 in the feed air (Pa)
Q d e s Consumed regeneration heat (W)
Q s Solar input (W)
Q w Heat collected by flowing water (W)
Q r Radiative heat loss (W)
Q A Convective heat transfer from the flue gas during adsorption (W)
Q h Isosteric heat from adsorption/desorption reaction (W)
T C C Instantaneous chamber temperature (°C)
T d e s Desorption temperature (°C)
T a d The given adsorption temperature (°C)
T a m b Ambient temperature (°C)
T i n / o u t The inlet/outlet water temperature of the solar thermal collector (°C)
T P V / T The surface temperature of PV/T (°C)
T H 2 O The water temperature inside the buffer tank (°C)
W M i n Minimum work requirement for CO2 capture(W)
XAverage solar input exergy
Z C O 2 Objective 1: Collected CO2 mass (kg/day)
Z L C C Objective 2: Levelized CO2 cost-profit ($/ton)
Z e l e Objective 3: Generated electricity (kWh/day)
Z e x e Objective 4: Exergy efficiency of the entire system

References

  1. Capstick, S.; Thierry, A.; Cox, E.; Berglund, O.; Westlake, S.; Steinberger, J.K. Preparing for a post-net-zero world. Nat. Clim. Chang. 2022, 12, 773–774. [Google Scholar] [CrossRef]
  2. Hannah Ritchie, M.R. Natural Disasters Kill Tens of Thousands Each Year. Available online: https://ourworldindata.org/natural-disasters#natural-disasters-kill-tens-of-thousands-each-year (accessed on 19 September 2022).
  3. IEA. Global Energy Review: CO2 Emissions in 2021; International Energy Agency: Paris, France, 2022. [Google Scholar]
  4. Project, G.C. Annual CO2 Emissions Worldwide from 1940 to 2020 (in Billion Metric Tons). Available online: https://www.statista.com/statistics/276629/global-co2-emissions/ (accessed on 19 September 2022).
  5. Kintisch, E. Amazon rainforest ability to soak up carbon dioxide is falling. Science 2015. [Google Scholar] [CrossRef]
  6. Chen, S. The inequality impacts of the carbon tax in China. Humanit. Soc. Sci. Commun. 2022, 9, 277. [Google Scholar] [CrossRef]
  7. Inman, M. Natural gas stands to get a boost from carbon tax. Nature 2015. [Google Scholar] [CrossRef]
  8. News, T.W. Wanted a fair carbon tax. Nature 2018, 564, 161. [Google Scholar]
  9. IEA. Transforming Industry Through CCUS; International Energy Agency: Paris, France, 2019. [Google Scholar]
  10. Roussanaly, S.; Berghout, N.; Fout, T.; Garcia, M.; Gardarsdottir, S.; Nazir, S.M.; Ramirez, A.; Rubin, E.S. Towards improved cost evaluation of Carbon Capture and Storage from industry. Int. J. Greenh. Gas Control. 2021, 106, 103263. [Google Scholar] [CrossRef]
  11. Rao, M.; Fernandes, A.; Pronk, P.; Aravind, P.V. Design, modelling and techno-economic analysis of a solid oxide fuel cell-gas turbine system with CO2 capture fueled by gases from steel industry. Appl. Therm. Eng. 2019, 148, 1258–1270. [Google Scholar] [CrossRef]
  12. Tian, S.; Jiang, J.; Zhang, Z.; Manovic, V. Inherent potential of steelmaking to contribute to decarbonisation targets via industrial carbon capture and storage. Nat. Commun. 2018, 9, 4422. [Google Scholar] [CrossRef] [Green Version]
  13. Hao, Z.; Barecka, M.H.; Lapkin, A.A. Accelerating net zero from the perspective of optimizing a carbon capture and utilization system. Energy Environ. Sci. 2022, 15, 2139–2153. [Google Scholar] [CrossRef]
  14. International Energy Agency. Net Zero by 2050 a Roadmap for the Global Energy Sector; International Energy Agency: Paris, France, 2021. [Google Scholar]
  15. Hesami, M.; Naderi, R.; Tohidfar, M. Modeling and Optimizing Medium Composition for Shoot Regeneration of Chrysanthemum via Radial Basis Function-Non-dominated Sorting Genetic Algorithm-II (RBF-NSGAII). Sci. Rep. 2019, 9, 18237. [Google Scholar] [CrossRef] [Green Version]
  16. Wang, Y.; Shen, Y.; Zhang, X.; Cui, G.; Sun, J. An Improved Non-dominated Sorting Genetic Algorithm-II (INSGA-II) applied to the design of DNA codewords. Math. Comput. Simul. 2018, 151, 131–139. [Google Scholar] [CrossRef]
  17. Deb, K.; Pratap, A.; Agarwal, S.; Meyarivan, T.A.M.T. A fast and elitist multiobjective genetic algorithm NSGA-II. IEEE Trans. Evol. Comput. 2002, 6, 182–197. [Google Scholar] [CrossRef] [Green Version]
  18. Pal, P.; Sharma, R.P.; Tripathi, S.; Kumar, C.; Ramesh, D. Genetic algorithm optimized node deployment in IEEE 802.15.4 potato and wheat crop monitoring infrastructure. Sci. Rep. 2021, 11, 8231. [Google Scholar] [CrossRef] [PubMed]
  19. Cavalcante, M.A.; Pereira, H.A.; Chaves, D.A.R.; Almeida, R.C. Evolutionary Multiobjective Strategy for Regenerator Placement in Elastic Optical Networks. IEEE Trans. Commun. 2018, 66, 3583–3596. [Google Scholar] [CrossRef]
  20. Sharifi, M.R.; Akbarifard, S.; Qaderi, K.; Madadi, M.R. A new optimization algorithm to solve multi-objective problems. Sci. Rep. 2021, 11, 20326. [Google Scholar] [CrossRef] [PubMed]
  21. Ward, A.; Pini, R. Efficient Bayesian Optimization of Industrial-Scale Pressure-Vacuum Swing Adsorption Processes for CO2 Capture. Ind. Eng. Chem. Res. 2022, 61, 13650–13668. [Google Scholar] [CrossRef]
  22. Wang, Z.; Shen, Y.; Zhang, D.; Tang, Z.; Li, W. A comparative study of multi-objective optimization with ANN-based VPSA model for CO2 capture from dry flue gas. J. Environ. Chem. Eng. 2022, 10, 108031. [Google Scholar] [CrossRef]
  23. Pai, K.N.; Prasad, V.; Rajendran, A. Practically Achievable Process Performance Limits for Pressure-Vacuum Swing Adsorption-Based Postcombustion CO2 Capture. ACS Sustain. Chem. Eng. 2021, 9, 3838–3849. [Google Scholar] [CrossRef]
  24. Hao, Z.; Caspari, A.; Schweidtmann, A.M.; Vaupel, Y.; Lapkin, A.A.; Mhamdi, A. Efficient hybrid multiobjective optimization of pressure swing adsorption. Chem. Eng. J. 2021, 423, 130248. [Google Scholar] [CrossRef]
  25. Zhang, F.-Y.; Feng, Y.-Q.; He, Z.-X.; Xu, J.-W.; Zhang, Q.; Xu, K.-J. Thermo-economic optimization of biomass-fired organic Rankine cycles combined heat and power system coupled CO2 capture with a rated power of 30 kW. Energy 2022, 254, 124433. [Google Scholar] [CrossRef]
  26. Breyer, C.; Fasihi, M.; Bajamundi, C.; Creutzig, F. Direct Air Capture of CO2: A Key Technology for Ambitious Climate Change Mitigation. Joule 2019, 3, 2053–2057. [Google Scholar] [CrossRef]
  27. Climeworks. Climeworks Begins Operations of Orca, the World’s Largest Direct Air Capture and CO2 Storage Plant. Available online: https://climeworks.com/news/climeworks-launches-orca (accessed on 19 September 2022).
  28. Thermostat, G. The GT Solution. 2021. Available online: https://globalthermostat.com/ (accessed on 19 September 2022).
  29. Announcing Project Bison: A 5 Megaton DAC Carbon Removal Project in Wyoming. Available online: https://www.carboncapture.com/project-bison (accessed on 17 October 2022).
  30. Niaz, H.; Shams, M.H.; Liu, J.J.; You, F. Mining bitcoins with carbon capture and renewable energy for carbon neutrality across states in the USA. Energy Environ. Sci. 2022, 15, 3551–3570. [Google Scholar] [CrossRef]
  31. Prajapati, A.; Sartape, R.; Galante, M.T.; Xie, J.; Leung, S.L.; Bessa, I.; Andrade, M.H.S.; Somich, R.T.; Rebouças, M.V.; Hutras, G.T.; et al. Fully-integrated electrochemical system that captures CO2 from flue gas to produce value-added chemicals at ambient conditions. Energy Environ. Sci. 2022, 15, 5105–5117. [Google Scholar] [CrossRef]
  32. Bustillos, S.; Alturki, A.; Prentice, D.; La Plante, E.C.; Rogers, M.; Keller, M.; Ragipani, R.; Wang, B.; Sant, G.; Simonetti, D.A. Implementation of Ion Exchange Processes for Carbon Dioxide Mineralization Using Industrial Waste Streams. Front. Energy Res. 2020, 8, 610392. [Google Scholar] [CrossRef]
  33. Bustillos, S.; Prentice, D.; La Plante, E.C.; Wang, B.; Sant, G.; Simonetti, D. Process Simulations Reveal the Carbon Dioxide Removal Potential of a Process That Mineralizes Industrial Waste Streams via an Ion Exchange-Based Regenerable pH Swing. ACS Sustain. Chem. Eng. 2022, 10, 6255–6264. [Google Scholar] [CrossRef]
  34. CO2Meter.com. Why is Monitoring Ammonia and Carbon Dioxide in Poultry Farms Important? Available online: https://www.co2meter.com/blogs/news/ammonia-meter-poultry-farms (accessed on 1 October 2022).
  35. EnergyPlus. Weather Data. Available online: https://energyplus.net/weather (accessed on 14 September 2022).
  36. Lux, D. Does CO2 Harm Your Body? Available online: https://medium.com/swlh/does-co2-harm-your-body-d20b4a0d03c1 (accessed on 14 September 2022).
  37. SunPower, Corporation. SunPower® X-Series Comercial Solar Panel X21-470-COM. Available online: https://us.sunpower.com/sites/default/files/sunpower-x-series-commercial-solar-panels-x21-470-com-datasheet-524935-revb_1.pdf (accessed on 14 September 2022).
  38. Energy, N. Virtu PVT Product. Available online: https://www.nakedenergy.co.uk/products (accessed on 14 September 2022).
  39. Shen, Y.; Kwan, T.H.; Yao, Q. Combined microgrid power production and carbon dioxide capture by waste heat cascade utilization of the solar driven Organic Rankine cycle. Energy Convers. Manag. 2021, 236, 114034. [Google Scholar] [CrossRef]
  40. Tech, W.L.B. Zeolite 13X Product. Available online: https://www.casmart.com.cn/product-details/page/300028576/501822071 (accessed on 14 September 2022).
  41. Alados-Arboledas, L.; Vida, J.; Olmo, F.J. The estimation of thermal atmospheric radiation under cloudy conditions. Int. J. Climatol. 1995, 15, 107–116. [Google Scholar] [CrossRef]
  42. Shen, Y.; Yang, H. Achieving reduced emission and enhanced air quality by designing a solar-driven indoor CO2 capture system. J. Clean. Prod. 2022, 379, 134869. [Google Scholar] [CrossRef]
  43. Qasem, N.A.A.; Ben-Mansour, R.; Habib, M.A. Enhancement of adsorption carbon capture capacity of 13X with optimal incorporation of carbon nanotubes. Int. J. Energy Environ. Eng. 2017, 8, 219–230. [Google Scholar] [CrossRef]
  44. Lei, M.; Vallieres, C.; Grevillot, G.; Latifi, M.A. Thermal Swing Adsorption Process for Carbon Dioxide Capture and Recovery: Modeling, Simulation, Parameters Estimability, and Identification. Ind. Eng. Chem. Res. 2013, 52, 7526–7533. [Google Scholar] [CrossRef]
  45. Ben-Mansour, R.; Qasem, N.A.A. An efficient temperature swing adsorption (TSA) process for separating CO2 from CO2/N2 mixture using Mg-MOF-74. Energy Convers. Manag. 2018, 156, 10–24. [Google Scholar] [CrossRef]
  46. Zhao, R.; Deng, S.; Liu, Y.; Zhao, Q.; He, J.; Zhao, L. Carbon pump: Fundamental theory and applications. Energy 2017, 119, 1131–1143. [Google Scholar] [CrossRef]
  47. Holdren, J.M.M.W.X.J.P. Carbon Capture, Utilization and Storage: Technologies and Costs in the U.S. Context. Available online: https://www.belfercenter.org/publication/carbon-capture-utilization-and-storage-technologies-and-costs-us-context (accessed on 9 November 2022).
  48. Keith, D.W.; Holmes, G.; Angelo, D.S.; Heidel, K. A Process for Capturing CO2 from the atmosphere. Joule 2018, 2, 1573–1594. [Google Scholar] [CrossRef] [Green Version]
  49. van der Giesen, C.; Meinrenken, C.J.; Kleijn, R.; Sprecher, B.; Lackner, K.S.; Kramer, G.J. A Life Cycle Assessment Case Study of Coal-Fired Electricity Generation with Humidity Swing Direct Air Capture of CO2 versus MEA-Based Postcombustion Capture. Environ. Sci. Technol. 2017, 51, 1024–1034. [Google Scholar] [CrossRef] [PubMed]
  50. Alibaba. Price for Solar Photovoltaic/Thermal Collectors. Available online: https://detail.tmall.com/item_o.htm?spm=a230r.1.14.16.1b4f357byYV6L4&id=685179266851&ns=1&abbucket=15 (accessed on 3 November 2022).
  51. Alibaba. Price for High Purity 13X HP Zeolite Molecular Sieve. Available online: https://www.alibaba.com/product-detail/13x-Zeolite-XINTAO-High-Purity-13X_1600200876872.html?spm=a2700.7735675.0.0.2deb5b21xmWA4U&s=p (accessed on 14 September 2022).
  52. Su, F.; Lu, C. CO2 capture from gas stream by zeolite 13X using a dual-column temperature/vacuum swing adsorption. Energy Environ. Sci. 2012, 5, 1573–1594. [Google Scholar] [CrossRef]
  53. Prices, G.P. Electricity Prices. Available online: https://www.globalpetrolprices.com/electricity_prices/ (accessed on 3 November 2022).
  54. HK Electric Investments Limited. Feed-in Tariff Scheme. Available online: https://www.hkelectric.com/en/smart-power-services/feed-in-tariff-scheme (accessed on 3 November 2022).
  55. Alibaba. Liquid Gas Carbon Dioxide Price. Available online: https://www.alibaba.com/product-detail/Best-Price-Purity-99-995-Liquid_1600465210806.html?spm=a2700.7724857.0.0.1d1b79721R06Hn (accessed on 14 November 2022).
  56. Richardson, L. How Long do Solar Panels Last? Solar Panel Lifespan Explained. Available online: https://news.energysage.com/how-long-do-solar-panels-last/#:~:text=The%20industry%20standard%20for%20a,below%20what%20the%20manufacturer%20projected. (accessed on 3 November 2022).
  57. Shen, Y.; Hocksun Kwan, T.; Yang, H. Parametric and global seasonal analysis of a hybrid PV/T-CCA system for combined CO2 capture and power generation. Appl. Energy 2022, 311, 118681. [Google Scholar] [CrossRef]
  58. Lee, J.S.; Kim, J.H.; Kim, J.T.; Suh, J.K.; Lee, J.M.; Lee, C.H. Adsorption Equilibria of CO2 on Zeolite 13X and Zeolite X Activated Carbon Composite. J. Chem. Eng. Data 2002, 47, 1237–1242. [Google Scholar] [CrossRef]
  59. Kwan, T.H.; Wu, X.; Yao, Q. Thermoelectric device multi-objective optimization using a simultaneous TEG and TEC characterization. Energy Convers. Manag. 2018, 168, 85–97. [Google Scholar] [CrossRef]
  60. Fu, D.; Davis, M.E. Carbon dioxide capture with zeotype materials. Chem. Soc. Rev. 2022, 51, 9340–9370. [Google Scholar] [CrossRef]
  61. Sutherland, B.R. Pricing CO2 Direct Air Capture. Joule 2019, 3, 1571–1573. [Google Scholar] [CrossRef]
  62. Azarabadi, H.; Lackner, K.S. A sorbent-focused techno-economic analysis of direct air capture. Appl. Energy 2019, 250, 959–975. [Google Scholar] [CrossRef]
  63. Kitamura, H.; Ishigaki, Y.; Kuriyama, T.; Moritake, T. CO2 concentration visualization for COVID-19 infection prevention in concert halls. Environ. Occup. Health Pract. 2021, 3. [Google Scholar] [CrossRef]
  64. Langefeld, B. Climate Protection in the Manufacturing Sector: Challenges and Solutions. Available online: https://www.rolandberger.com/en/Insights/Publications/Climate-protection-in-the-manufacturing-sector-Challenges-and-solutions.html (accessed on 1 October 2022).
Figure 1. Schematic diagram of the industrial building-integrated solar-driven CO2 capture system: (a) the energy-mass flow pattern; (b) a detailed portrait of the vacuum PV/T subsystem.
Sustainability 15 00526 g001
Figure 2. Sankey diagram of the Exergy flow in this integrated system.
Sustainability 15 00526 g002
Figure 3. Detailed cost-analysis results of the entire system: (a) 25-year cost–profit for different sorbent mass cases with different sectors; (b) breakdowns of the cost sectors in 25-year lifespan; (c) Compare the yearly net cost-profit values for two cases with different sorbent mass.
Sustainability 15 00526 g003
Figure 4. A flowchart on the overall procedures, from PV/T-CCA real-time simulation to multi-objective optimization outputs.
Sustainability 15 00526 g004
Figure 5. Real-time system performances based on the monthly average weather data in Hong Kong: (a) exergy sectors, including solar exergy input, thermal exergy and electrical exergy; (b) real-time CO2 uptake amount inside the sorbents for 1/2 chamber; (c) working temperature for ½ chamber.
Sustainability 15 00526 g005
Figure 6. Validations of the CO2 capture model and the NSGA-II multi-objective optimization model: (a) Validation of CO2’s adsorption isotherm curve (at 293 K); (b) the average non-domination convergence plot of the NSGA-II optimization process at different iteration numbers.
Sustainability 15 00526 g006
Figure 7. Effects of PV/T area ( A P V / T ) and sorbent mass on the four objective functions, based on 100 selected elements (populations) that fit the constraints: (a) effects on captured CO2 mass, Z C O 2 ; (b) effects on levelized CO2 cost-profit, Z L C C ; (c) effects on generated electricity, Z e l e and (d) effects on exergy efficiency, Z e x e .
Sustainability 15 00526 g007
Figure 8. Effects of interaction between hourly solar irradiance and sorbent mass on the 4 objective functions: (a) Effects on captured CO2 mass, Z C O 2 ; (b) Effects on levelized CO2 cost-profit, Z L C C ; (c) Effects on generated electricity, Z e l e and (d) Effects on exergy efficiency, Z e x e .
Sustainability 15 00526 g008
Figure 9. Effects of interaction between feed mass flow rate and CO2 partial pressure on the four objective functions: (a) effects on captured CO2 mass, Z C O 2 ; (b) effects on levelized CO2 cost–profit, Z L C C ; (c) effects on generated electricity, Z e l e and (d) effects on exergy efficiency, Z e x e .
Sustainability 15 00526 g009
Figure 10. Effects of deviation of each working parameter on different objective functions, with I r r . deviation results on the first column, A P V / T on the second column, m a on the third column, P C O 2 on the fourth column and m ˙ f e on the fifth column. D e v i a t i o n = x ( 1 ~ 4 ) / x ( b a s e ) .
Sustainability 15 00526 g010
Figure 11. Variation of objective functions (defined by the ratio of objective value and the average objective value) subject to scenarios with different CO2 partial pressure and solar irradiance: (a) different CO2 concentration cases; (b) different solar irradiance cases.
Sustainability 15 00526 g011
Figure 12. Case studies subject to two CO2 partial pressure ( P C O 2 ) values and 2 different hourly averaged solar irradiation ( I r r . ) values, against m s o r and A P V / T simultaneously: (a) obtained CO2 mass Z C O 2 for case P C O 2 = 500 Pa and 1000 Pa; (b) obtained Z e l e for case I r r . = 324 W/m2 and 500 W/m2.
Sustainability 15 00526 g012
Table 1. Cost-profit breakdowns of a case study that uses 5.5 tons of sorbent material and 50 m2 of installed vacuum PV/T area (All the “$” symbols used in this study are USD).
ItemCost $ per UnitAmount per YearTotal $
Running cost0.65833 kWh−105,220
Maintenance2500Two times−150,315
PV/T50050 m2−25,000
Zeolite 13X62009.9 ton−1,845,268
Installation−35,0001−35,000
Tank6001−600
Fan1,0010−1000
Pipe1,0010−1000
Valve4010−400
Others20,0001−20,000
Pump35002−7000
Heat Exchanger20,0001−20,000
Sell CO2100074.7 ton2,245,848
Sell electricity0.3813,413.6 kWh153,225.2
NPV 188,270.0 $
Total CO2 1867.617 ton
Specific NPV 100.8 $/ton
Table 2. The details of decision parameters and studied objectives (adsorption temperature = 298 K).
VariablesDescriptionLowest BoundHighest BoundUnits
x 1 Average   hourly   solar   irradiation ,   I r r 100800W/m2
x 2 PV / T   area ,   A P V / T 50100m2
x 3 Total   sorbent   mass ,   m s o r 48tons
x 4 CO 2   partial   pressure   of   the   feed   air ,   P C O 2 4001800 Pa
x 5 The   mass   flow   rate   of   feed   air ,   m ˙ f e 0.10.55kg/s
ObjectivesDescription
Z 1 Captured CO2 mass in one day
Z 2 Levelized cost of CO2 based on a 25-year lifespan
Z 3 Generated electricity amount in one day
Z 4 Average exergy efficiency in one day
Table 3. The base values of each parameter are decided by trial and error, which can be used to define the deviation range of the optimized solutions.
Parameter I r r . A P V / T m s o r P C O 2 m ˙ f e
Base value324 W/m265 m25.5 ton1000 Pa0.25 kg/s
Disclaimer/Publisher’s Note: The statements, opinions and data contained in all publications are solely those of the individual author(s) and contributor(s) and not of MDPI and/or the editor(s). MDPI and/or the editor(s) disclaim responsibility for any injury to people or property resulting from any ideas, methods, instructions or products referred to in the content.

