Abstract
It is significant to monitor the leakage at the joints of the diaphragm walls of subway station foundation pits to check the weak links in the waterproof quality of the diaphragm wall structure. It is essential to take effective waterproof measurements timely to improve the overall waterproof quality of the diaphragm wall in the foundation pit to prevent accidents and reduce the operation and maintenance costs. This paper used ground penetrating radar (GPR) to detect the Lishan North Road Station section of Jinan Rail Transit Line R2 during construction. The abnormal waveform image is obtained after processing radar detection data with Reflexw software. This abnormal waveform image is used to identify the abnormal area. In order to accurately predict the location of leakage at the joint of diaphragm wall, MATLAB is used to calculate the average wave velocity amplitude and single channel signal of the electromagnetic wave velocity of geological radar at different mileages and draw the trend chart of average wave velocity amplitude with mileage and the corresponding relationship curve of electromagnetic wave amplitude and depth of radar. It is proposed that sudden changes in the area of the average wave velocity amplitude cause a change in the trend chart. Furthermore, the radar electromagnetic wave velocity amplitude curve is taken as the area where seepage may occur at the joints of the diaphragm wall, so as to determine the corresponding mileage and depth of the leakage area. On this basis, the grey correlation analysis for the analysis of the source of the water leakage at the joints of the diaphragm wall of the subway foundation pit is proposed. The research results show that the leakage water at the joints of the diaphragm wall of the subway foundation pit is not connected to the rivers around the foundation pit, which confirms that the construction of the subway station has not affected the groundwater resources around the station. The proposed approach has successfully predicted the location of the foundation pit leakage disaster and has been verified on the project site. The research results provide a reference for the monitoring and early warning of leakage at the joints of diaphragm walls in foundation pits with similar geological conditions.
1. Introduction
With the rapid development of urbanization and the exponential growth of the urban resident population, traffic pressure increases continuously. Urban population density, traffic congestion, and other space shortages have seriously hindered urban development. The emergence of urban subways can not only ease traffic congestion but also benefit citizens in transit by shortening their travel time [1,2,3]. As an important infrastructure project in China, subway station construction projects are more complex than other infrastructure projects. Many factors may affect these projects, including significant structural problems of varying intensity, among which water leakage is one of the most common structural problems [4,5,6,7]. Water leakage problems will lead to reinforcement corrosion, affecting the structural strength and threatening the safety of subway tunnel operation. Therefore, monitoring the water leakage problem has always been highly important. Furthermore, it is relatively difficult to predict the leakage in advance during the foundation pit excavation. The water leakage not only affects the progress of subway construction but also brings some economic losses when the water leakage is serious [8,9,10,11,12]. Therefore, it is of great significance to monitor and warn about the leakage of diaphragm wall joints and adjacent walls during the excavation of the foundation pit. During the subway construction, the on-site construction personnel use various monitoring methods to predict when and where the underground diaphragm wall of the foundation pit leaks will occur, so as to identify the leakage at the joints of the underground diaphragm wall of the foundation pit in advance. Furthermore, based on this, the necessary preventive measures need to be carried out to ensure the progress and safety of the construction and avoid economic losses caused by the leakage.
As one of the main subway tunnel leakage monitoring technology methods, GPR is considered an intuitive, clear, fast, and accurate technology. In the literature, various scholars have conducted a lot of research using GPR to detect roads [13,14,15]. It is found that high-frequency antennae have better anti-interference ability, richer information content, and better resolution and detection accuracy than low-frequency antennae in shallow track detection. Moreover, the water leakage of the pipeline and the rich water layer in the subgrade were successfully found. It has been revealed from the literature that various model test pieces have been developed in the laboratory based on GPR for detection and analysis, which have verified as intuitive, clear, fast, and accurate characteristics of GPR and provided a convincing scientific basis for monitoring abnormal areas [16,17,18,19]. Yin et al. [20] studied the two-dimensional and three-dimensional models of the leakage water by using the forward and inverse theory through the leakage water test on the tunnel lining surface, determined the location of the leakage water, and enriched the characteristics and interpretation basis of the GPR spectrum. Dong et al. [21] verified the difference between the dielectric constant of the surrounding medium and the target through the study of the propagation and attenuation law of electromagnetic waves. This study is conducive to the display of the image characteristics of the target. For similar hidden problems in the same medium, its size can be determined according to the arc span in the image. Various researchers analyzed the characteristics of these typical radar images by making a variety of representative typical verification model specimens and also carried out fracture water injection tests [22,23,24,25]. The results show that the GPR can detect the specific location and distribution of typical problems such as cavities and non-compactness. The literature [26,27,28,29,30,31,32,33] introduces the current situation of using geological radar to monitor hidden soil problems on the project site. Its detection results are consistent with the actual situation. GPR technology can quickly and clearly determine the problem locations on the project construction site, which has a unique role in the distribution of structural layers, predicting potential geological disasters, and evaluating project construction quality. The literature [34,35,36,37,38,39,40,41] studied the damage characteristics and constitutive models of rock and soil mass fracture and geological disasters.
In the past, GPR was used to obtain a two-dimensional radar image of the engineering measurement area and visually analyze the defects or problems such as water-containing bodies in the project through the image. In fact, the two-dimensional radar image directly obtained by the GPR is easy and affected by various external conditions such as mechanical vibration, engineering construction, and excavation disturbance. In general, only the two-dimensional radar image can be used to judge whether there is a defect or not. For the construction site of a subway station, the excavation depth of the foundation pit usually reaches 30 m, and it is difficult to locate the engineering defects existing in the foundation pit. This may result in poor performance of monitoring technology for detecting leakage at the joints of the diaphragm walls of subway foundation pits. Therefore, this problem may be treated as the most important problem for better water leakage monitoring. In this research, GPR technology was used to conduct the on-site radar detection of the Lishan North Road Station section of Jinan Rail Transit Line R2 during the construction period, in order to explore structural leakage disasters during the construction of the subway station and focuses on the identification and prediction of the location where the leakage may occur at the joints of the diaphragm wall. This research may provide a new method for the use of geological radar technology to predict leakage in a better way.
2. Principle of GPR for Detecting Abnormal Bodies
The GPR detection method is a spectral electromagnetic technology used to determine the distribution of underground media. The working principle of GPR is based on the difference in the dielectric constant between the detected target and the surrounding medium. By sending electromagnetic waves in the form of pulses into the ground, some electromagnetic waves will be reflected when encountering the interface of media with different dielectric properties. The receiving antenna will receive the reflected waves and record the time, as shown in Figure 1. According to the received radar waveform, the underground target’s spatial position, dielectric conductivity, and geometric form can be inferred to detect the underground target [42,43,44]. The propagation of the electromagnetic wave in an underground medium follows the basic principle of the Maxwell equation, and its differential form is shown in Equation (1):
where ▽ is the Hamiltonian operator, E is electric field strength, H is magnetic field strength, B is magnetic induction strength, D is the potential shift, J is current density.
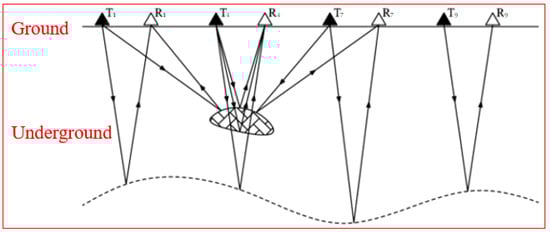
Figure 1.
Schematic Diagram of GPR Detection Principle.
Since the GPR often uses the profile method (transmitting and receiving antennas move equidistantly) for measurement and the distance between the receiving and transmitting antennas is small compared with the depth of the geological anomaly body of the detection target, it is assumed that the radar wave is vertically incident (the distance between the receiving and transmitting antennas is 0). The buried depth of the geological anomaly body of the detection target by the radar wave is:
where V is the wave speed of the electromagnetic wave and c is the speed of light in a vacuum. Generally, the value is 3 × 10⁸ m/s and r is the relative dielectric constant of the medium.
where t is the double travel time of electromagnetic wave in the medium and H is the burial depth.
The advanced detection of underground roadways is mostly along the coal seam. Generally, the coal seam is relatively dry and its dielectric constant is greatly different from the surrounding rock, which is an ideal location for the detection. When the electromagnetic wave propagates along the coal seam or rock stratum with the same electrical properties, there will be no abnormal echo. However, when there are faults, collapse columns, fracture zones, and other geological structures in front of the roadway, the electromagnetic wave will have reflected energy anomalies, diffraction, scattering, phase anomalies, and other phenomena. By analyzing the characteristics of reflected echo anomaly, the location of the geological structure in front of the roadway can be identified and the potential hazard predicted effectively.
It can be seen from Equation (2) that the greater the difference in dielectric constant, the stronger the received radar wave energy and the more obvious the image. In the process of foundation pit excavation, the difference in the dielectric constant of the seepage point at the joint between the dry soil and the diaphragm wall is large and the difference of the dielectric constant determines the feasibility of detecting the seepage of the diaphragm wall in the foundation pit with GPR.
The factors that affect the accuracy of the GPR include internal and external aspects. The internal factors mainly involve to the conductivity, dielectric constant and other factors regarding the detection object’s environment, that is, the difference between the defect to be detected and the dielectric constant of the surrounding objects. The greater the difference, the higher the accuracy of the GPR. The external factors are mainly related to the detection method, such as the frequency used for detection, sampling speed, etc. Generally, high sampling frequency and slow detection speed will appropriately improve the accuracy. In addition, the detection route can also be repeatedly detected to improve the measurement accuracy.
3. GPR Path Layout and Data Acquisition
3.1. Project Overview
The total length of Jinan Rail Transit Line R2 is about 36.4 km, including a 34.5 km underground line, 1.6 km of elevated line, a 0.3 km transition section, and 18 stations. The civil works of Section VI, with a total length of 1.03 km, including Lihuang Road Station, and Lishan North Road Station. Lishan North Road Station is an underground double-column three-span double deck island station. The total length of the station’s main body is 522.71 m, the width of the standard structural section is 21.3 m, the thickness of the station covering soil is about 3.6 m, and the foundation pit was constructed by the open excavation method. The terrain in this area is generally gentle. The groundwater is mainly supplied by atmospheric precipitation, lateral seepage of rivers, and external flow of the area. The groundwater is weakly corrosive to concrete structures. There are surface water bodies distributed in and around the foundation pit of the subway station, mainly including Xiaoqing River and its tributaries Dongluo River and Liuxingtou River. Xiaoqing River is located about 1.6 km to the north of the line and the Dongluo River, about 20 m from the site to the west of the foundation pit, has a small water volume. The Liuxingtou River, about 90 m away from the site on the east side of the foundation pit, has a small amount of water. The general flow direction of surface water and groundwater is from south to north. According to the field survey and relevant data collected, the elevation difference between the river surface and the groundwater level is not large. In the high-water season, the surface water rises and then infiltrates to recharge the groundwater. In the dry season, the groundwater level is higher than the river surface and the groundwater recharges the surface water. During the survey, groundwater was encountered in all boreholes. The stable groundwater level buried depth was 2.3–3.3 m and the elevation was between 21.94–23.35 m. It belongs to the type of phreatic water that occurs in the pores of the Quaternary loose layer and the underlying bedrock fissures. The survey period belongs to the annual high-level period.
3.2. Route Layout
In order to predict the position and depth of leakage at the joints of the diaphragm wall, ensure the foundation pit’s safe construction, and improve the structure’s waterproofing, this paper uses GPR technology to regularly detect the foundation pit. The GPR equipment used is the Seeker SPR ground penetrating radar system developed by the USRADAR SUBSURFACE IMAGING SYSTEM of the United States, which uses a P-0100 antenna to continuously observe along the survey line as shown in Figure 2. The data acquisition pulse of the GPR is 100 MHz, the time window is 400 ns, the scanning rate is 16 scan/s, the axial encoder is triggered, and the gain is 20 dB. Suppose that there is water leakage at the diaphragm wall joint during the foundation pit excavation. In that case, the water will leak from the outside of the foundation pit to the inside of the foundation pit through the diaphragm wall, especially the water in the lower soil outside the foundation pit near the diaphragm wall will percolate and migrate, which will cause the ground penetrating radar data outside the foundation pit to change before and after the excavation of the foundation pit. By comparing the ground penetrating radar indicators such as wave velocity amplitude before and after the foundation pit excavation, it can determine whether leakage occurs and the location of the leakage.
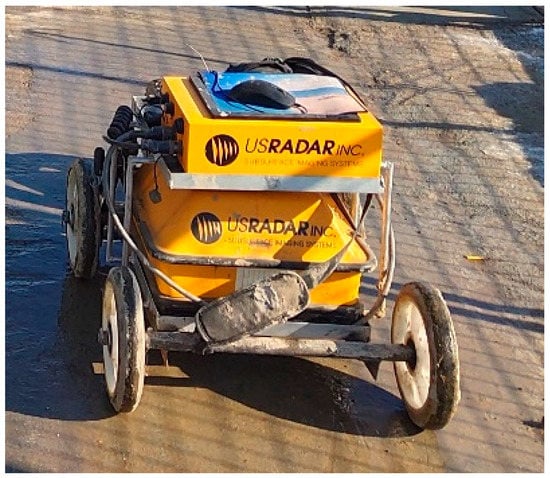
Figure 2.
Seeker SPR Ground Penetrating Radar System.
In order to adapt to the on-site coordination of the project progress, this paper selects 10 survey lines in a discontinuous manner, a total of five groups. The grouping is shown in Table 1, where ① and ② measuring lines are Group A, ③ and ④ are Group B, ⑤ and ⑥ are Group C, ⑦ and ⑧ are Group D, and ⑨ and ⑩ are Group E. We choose to arrange the detection route inside and outside the foundation pit near the diaphragm wall. The specific field survey line layout is shown in Figure 3.

Table 1.
Grouping of survey lines.
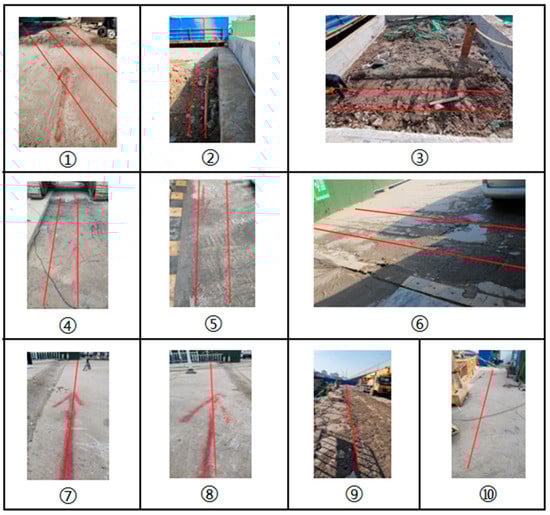
Figure 3.
Ground Penetrating Radar Detection Path Site.
4. Analysis of Radar Detection Data
In the process of geological radar data acquisition, high-frequency electromagnetic waves are usually used for the detection in order to obtain more reflected echo characteristics. At the same time, in addition to the original data, some interference signals during the detection process are also recorded while collecting the data. Therefore, before the interpretation of the radar data in the abnormal area, the collected data should be processed to eliminate interference, gain useful signals, and improve the signal-to-noise ratio, so as to provide high-quality radar images for the data and then predict the water leakage at the joints of the diaphragm wall of the foundation pit.
4.1. Determination of Abnormal Area
Due to the different lengths of the survey line in different areas, the mileage of the collected data is different, about 4 m–15 m, and the direction is from west to east. Reflexw software is used to remove DC drift, air layer, gain, horizontal signal, band-pass filter, and de-average the collected detection data [31,32,33], and five groups of B-scan GPR images of GPR are obtained.
Figure 4 shows the B-scan GPR images outside the Group A diaphragm wall during the foundation pit excavation. During the foundation pit excavation, the B-scan GPR images are stable within the effective detection range and no abnormal area is found, indicating that no water-conducting fissure is detected within the range of the survey line. Therefore, within the monitoring range of Group A, the stress disturbance during the foundation pit excavation has little impact on the diaphragm wall. There is no hydraulic connection inside and outside the diaphragm wall in this section, no water leakage, and the water separation effect is good.
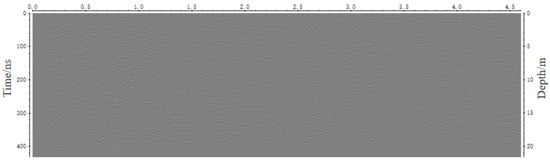
Figure 4.
B-scan GPR images of GPR of the External Survey Line of Group A Foundation Pit.
Figure 5 shows the B-scan GPR images outside the diaphragm wall of Group B during the excavation of the foundation pit. Before excavating the foundation pit, the B-scan GPR images are stable within the effective detection range (as shown in Figure 5a). However, after excavating the foundation pit to about 8 m deep, a triangle-shaped abnormal area (as shown in Figure 5b) appeared within the survey line mileage. The abnormal area extends downward from the upper part, indicating that there may be water-conducting cracks. The reason is that the dielectric constant of water is different from that of soil. When there are water-conducting cracks in the detection area, the existence of water will cause abnormal reflection waves at the water-soil interface, which will lead to the abnormality of the B-scan GPR images. Therefore, during the excavation of the foundation pit, it is recommended that the detection area of Group B be listed as the key seepage prevention area and an emergency plan for plugging should be prepared in the subsequent excavation process. When the foundation pit was excavated to 15 m, a large range of abnormal areas (as shown in Figure 5c) appeared in the B-scan GPR images. At this time, leakage holes were found in the site construction area, as shown in Figure 6.
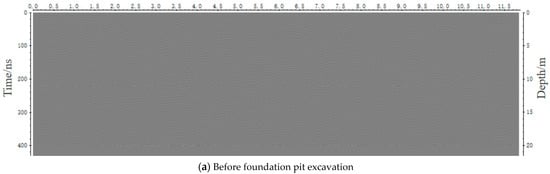
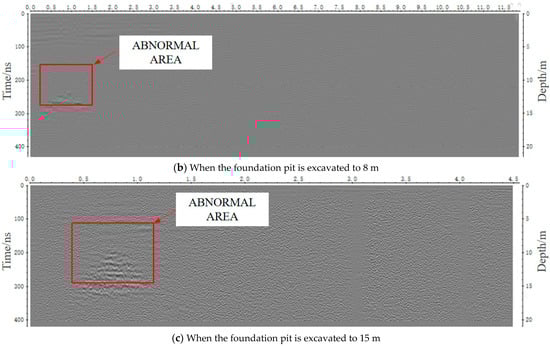
Figure 5.
B-scan GPR images of External Survey Line of Group B Foundation Pit.
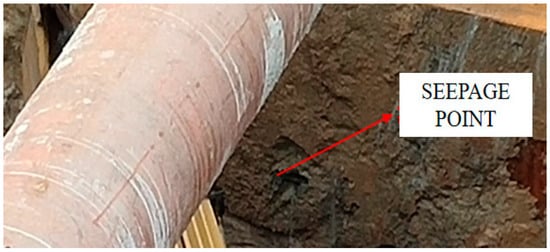
Figure 6.
Time Domain Seepage Points from 15 m Foundation Pit Excavation in Group B Detection Area.
Similarly, the detection data of Group C, D, and E are analyzed. The B-scan GPR images are stable within the effective detection range. No abnormality is found in Group C and Group D, that is, no water leakage occurs within the scope of the survey line. However, during the excavation of the foundation pit in Group E, there is an abnormal triangle-shaped area within the mileage of the survey line, as shown in Figure 7. Later, it was confirmed by the excavation site of the foundation pit that there were water leakage holes in the underground diaphragm wall of the foundation pit in this area.
Figure 7.
B-scan GPR images of Group E abnormal area.
4.2. Determine the Corresponding Mileage of the Abnormal Area
The waveform image of the geological radar obtained by Reflexw software can effectively analyze the existence of water-conducting cracks but it cannot accurately reflect the location of water leakage in the diaphragm wall. In order to effectively predict the leakage position of the underground diaphragm wall of the foundation pit, MATLAB is used to calculate the average wave velocity amplitude of the electromagnetic wave velocity of the geological radar at different mileages, draw the trend chart of the average wave velocity amplitude with mileage, and determine the corresponding mileage and depth of the leakage area. There are abnormal areas in the regional radar waveform of Group B, whereas no abnormal areas in the regional radar waveform of Group A were found. Take Group B as an example to analyze the change curve of electromagnetic wave velocity of geological radar and select the change curve of electromagnetic wave velocity of Group A as a comparison. The average wave velocity amplitude of electromagnetic wave velocity at different mileages for Group A data was calculated; the curve of average wave velocity amplitude versus mileage was obtained as shown in Figure 8. Before the excavation of the foundation pit, the average wave velocity amplitude tends to be horizontal as a whole, and only fluctuates in a small range of −0.10–0.05 m/ns. When the foundation pit is excavated to 15 m, the average wave velocity amplitude maintains a horizontal trend and the fluctuation range does not change significantly, which indicates that there is no water leakage within the range of the Group A measuring line during the excavation of the foundation pit.
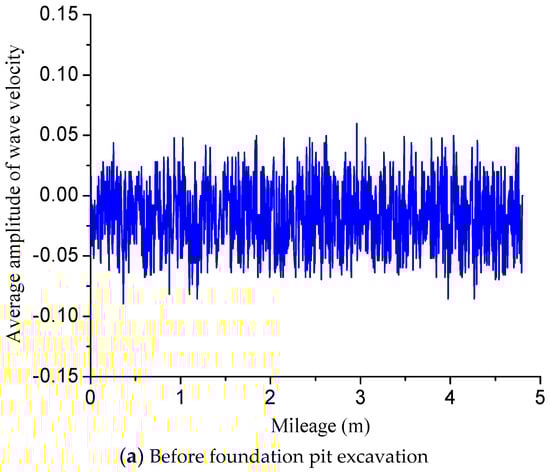
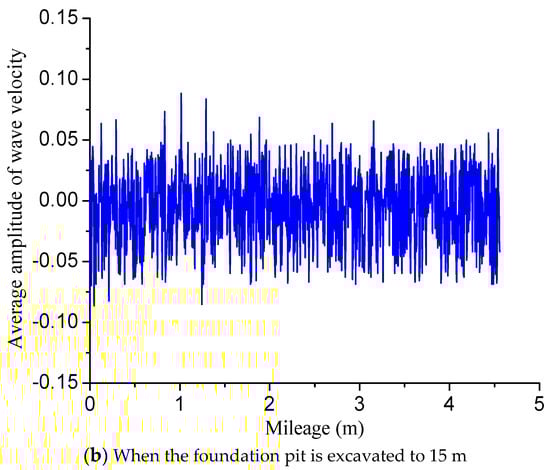
Figure 8.
The relationship between the average wave velocity amplitude and the mileage of the Group A foundation pit external survey line.
Figure 9 shows that the change curve of the average wave velocity amplitude of electromagnetic wave velocity at different mileage with mileage in the measured data of Group B. As shown in Figure 9a, before the foundation pit excavation, the average amplitude of electromagnetic wave velocity at different mileages tended to be horizontal as a whole and fluctuated only in a small range. As shown in Figure 9b, when the foundation pit is excavated to 8 m, the average wave velocity amplitude has an abnormal mutation within the range of 0.7 m–1.0 m of the measuring line mileage and the peak value is about 2.96 m/ns at the 0.84m mileage. Therefore, there may be a leakage area within the range of 0.7 m–1.0 m of the measuring line in this section, and the center point of the leakage area is located at the 0.84 m mileage of the measuring line. As shown in Figure 9c, when the foundation pit is excavated to 15 m, the average wave velocity amplitude has an abnormal mutation within 0.65 m–0.9 m of the measuring line mileage and the peak value is about −0.57 m/ns at the 0.84 m mileage. That is, when the foundation pit is excavated to 15 m depth, leakage occurs within 0.65 m–0.9 m of the measuring line mileage and the center point of the leakage is 0.84 m of the measuring line mileage.
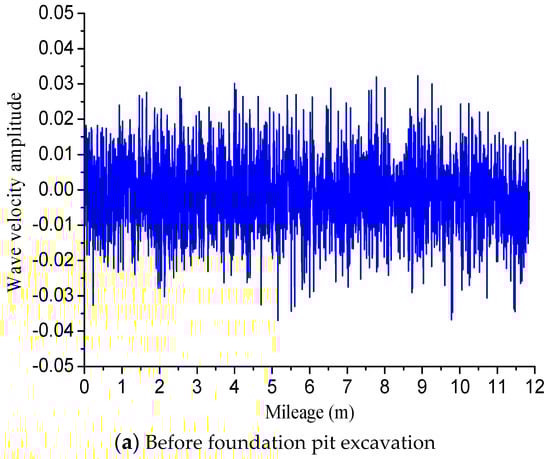
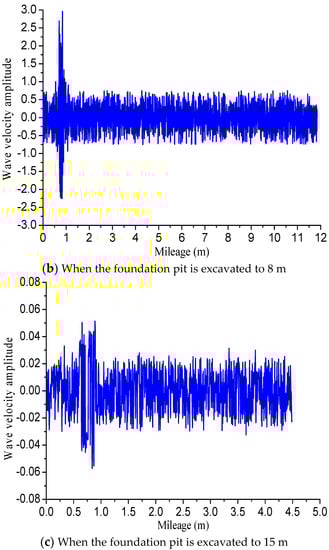
Figure 9.
The relationship between the average wave velocity amplitude and mileage of the external survey line of the Group B foundation pit.
4.3. Determination of Abnormal Point Depth
A single channel signal graph is the curve of amplitude and depth of a radar electromagnetic wave, which can determine the corresponding depth of the abnormal area. According to the above analysis, the mileage corresponding to the center point of the abnormal area is determined to be 0.84 m. A single-signal map of the mileage before, at 8 m, and at 15 m during the excavation of the foundation pit is drawn and the mileage of the normal area (4.0 m) is selected on the same survey line as a reference for comparative analysis, as shown in Figure 10, Figure 11 and Figure 12, respectively.
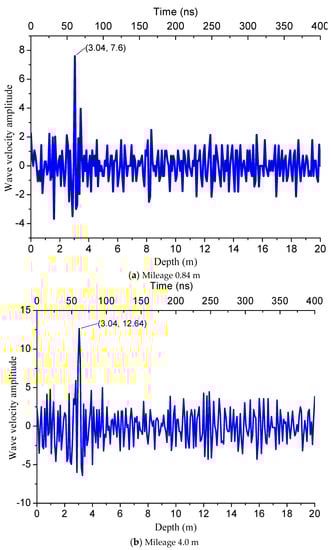
Figure 10.
Single-Signal Diagram of Group B Foundation Pit External Survey Line before Foundation Pit Excavation.
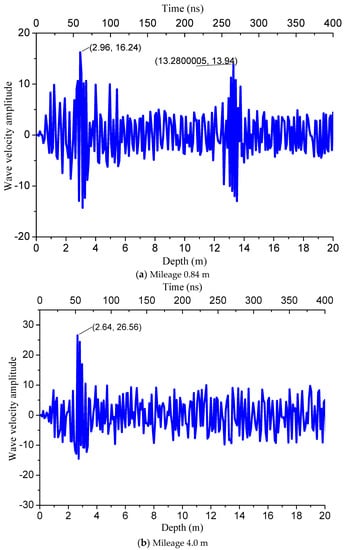
Figure 11.
Single-Signal Diagram of Group B Foundation Pit External Survey Line when the Foundation Pit is Excavated for 8 m.
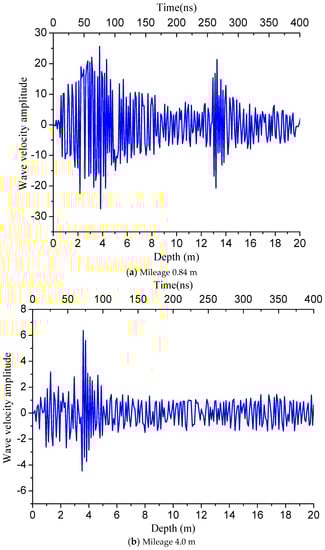
Figure 12.
Single-Signal Diagram of Group B Foundation Pit External Survey Line when the Foundation Pit is 15 m Excavated.
As shown in Figure 10, before the excavation of the foundation pit, the curves of electromagnetic wave amplitude changes with depth at 0.84 m and 4.0 m of the survey line mileage are roughly similar, both of which have sudden changes in the range of about 3.5 m–4.2 m and then fluctuate horizontally within a certain range. As shown in Figure 11, when the foundation pit is excavated to 8 m, the electromagnetic wave amplitude at 0.84 m of the measuring line mileage has a second mutation within the range of 13.5 m–14 m, whereas the electromagnetic wave amplitude at 4.0 m of the measuring line mileage is similar to that before excavation and unchanged. As shown in Figure 12, when the foundation pit was excavated to 15 m, the amplitude of the radar electromagnetic wave at 0.84 m of the survey line mileage had two abnormal changes when it propagated downward. The amplitude gradually increases with the increase in depth from 0.65 m to 3.84 m, reaching the extreme value of about −27.48 m/ns, then gradually attenuates with the increase of depth and continues to propagate downward as a horizontal wave until 12.8 m, then suddenly increases and reaches a peak again at 13.28 m, about 21.34 m/ns, and then gradually attenuates and propagates downward as a horizontal wave. Compared with the mileage of 0.84 m, the mileage of 4 m is still abrupt at 3.5 m–4.2 m and then fluctuates horizontally within a certain range.
The reason for the first abnormal mutation of amplitude in Figure 10, Figure 11 and Figure 12 is that the electromagnetic wave has a diffuse reflection when contacting the water line, which makes the electromagnetic waves interact with each other, leading to an abnormal amplitude change. The ending depth of this fluctuation is 3.84 m, which is the height of the groundwater level. The second abnormal change in Figure 11a and Figure 12a is caused by the transmission of the electromagnetic wave to the water-conducting fissure. The peak point of the abnormal change is 13.28 m, so it can be inferred that the depth of the leakage water center point is 13.28 m. We have carried out verification on the site, and the depth is consistent with the depth of the leakage hole observed on the site.
5. Analysis of Leakage Water Source
With the extension of the excavation depth of the foundation pit, the hydrogeological conditions become more and more complex and leakage from the joint of the diaphragm wall of the foundation pit occurs from time to time. It is one of the primary tasks to quickly and accurately identify the source of seepage water after the occurrence of seepage. The water-filling intensity of different water-filling sources is different; the treatment methods are also different. Therefore, only by determining the source of leakage water at the joints of the diaphragm wall of the foundation pit, can effective treatment measures be taken for the leakage water. Research on the identification of the source of seepage water from the diaphragm wall of the foundation pit is of great guiding significance for the treatment of seepage water, the reduction of property losses, and the construction of subway stations with similar engineering geological conditions and can also provide a scientific basis for taking reasonable and effective water prevention measures (plugging, drainage, etc.).
5.1. Grey System Correlation Analysis
Grey system correlation analysis is an important part of grey system theory. The basic principle of the grey system correlation analysis method is to measure the closeness of factors according to the similarity of their development trend. The greater the similarity, the closer the relationship between factors and the greater the correlation. The basic process is to take the data series (comparison series and reference series) of the research object and the difference under the same evaluation index as the basic basis, calculate the correlation coefficients that can reflect the closeness between the main research object and its various influencing factors, integrate the correlation coefficients into the correlation degree through calculation, and then judge the influence degree of each influencing factor on the main research object by comparing the magnitude of the correlation degree. The main steps of the grey system correlation analysis method to calculate the correlation degree are as follows [45]:
(1) The original data have different dimensions and represent different physical meanings. In order to compare and analyze different quantities, it is necessary to make all number sequences for correlation degree analysis and calculation the same or dimensionless. Therefore, it is necessary to average these series to make the new series comparable and equivalent. Average them according to Equation (4) to make their original data dimensionless:
(2) The absolute difference sequence of the sequence and the two-level differences and can be determined using Equation (5).
(3) Calculate the correlation coefficient between the reference sequence and the compared sequence using Equation (6).
where ρ is the resolution coefficient, generally 0.5.
(4) Correlation coefficient ξi(k) is the correlation degree value between the comparison sequence and the reference sequence under various indicators. There is a lot of data and information is too scattered to facilitate the overall comparison. Therefore, the average value is processed when each correlation coefficient series is concentrated into one value, which is called the correlation degree as the quantitative expression of the correlation degree between the comparison series and the reference series, that is, the grey correlation degree between the reference series and the comparison series is recorded as rij.
The size of the correlation degree rij can reflect the correlation degree between the parent sequence and sub-sequence. The greater the correlation degree is, the closer the relationship. Generally, when the correlation degree is greater than or equal to 0.8, it indicates that the correlation between the sub-sequence and the parent sequence is good; when the correlation degree is between 0.6 and 0.8, the correlation is good; when the correlation degree is less than 0.5, it indicates that the sub-sequence is not related to the parent sequence.
5.2. Data Processing and Analysis
Through the ion test on the water samples taken from the construction site, K+, Na+, Ca2+, Mg2+, HCO3−, Cl−, SO42−, and pH are selected as the water quality indicators of the seepage water source in the seepage water discrimination model. Water sample 1 refers to the pumping and drainage water sample before the excavation of the foundation pit, and water sample 2–9 refers to the water sample of nearby rivers. One water sample is taken every 100 m of mileage section. Figure 13 shows the sample drawing of water pumping and drainage collected at the construction site. Table 2 shows the main chemical composition data of the water sample.
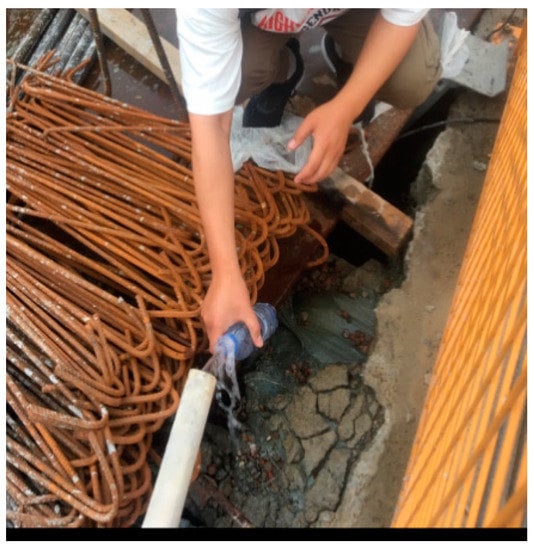
Figure 13.
Sample Drawing of Pumping and Drainage Water Collected on Site.
Table 2.
Main Chemical Composition Data of Water Samples.
(1) In order to compare and analyze different quantities, the original data in Table 2 is first unitized and processed using Equation (4). The results after processing are shown in Table 3. Among them, No. 1 represents the parent sequence and No. 2–9 represents the sub-sequence.
Table 3.
Result Data after Data Unitization.
(2) Use Equation (5) to calculate the average sequence’s absolute difference and get the result after the absolute difference, as shown in Table 4.
Table 4.
Data Results after Sub-sequence Absolute Difference.
From the table, 2.03.
(3) Calculate the correlation coefficient between each sequence element and the corresponding reference sequence element. Use Equation (6) to calculate the correlation coefficient, where ρ = 0.5, the calculation results are shown in Table 5 below.
Table 5.
Correlation coefficient of sub-sequence and parent sequence.
(4) Calculate the grey correlation degree. Use Equation (7) to calculate the correlation degree. See Table 6 for the calculation results of the grey correlation between the reference sequence (No. 1) and comparison sequence (No. 2–9).
Table 6.
Correlation between sub-sequence and parent sequence.
It can be seen based on the final calculation analysis of the results that the correlation degree between water sample is 2–9 and the foundation pit pumping and drainage is 0.66–0.76. This is small and indicates that the leakage water at the joint of the underground diaphragm wall of the subway foundation pit is not connected with the rivers around the foundation pit. Therefore, it is confirmed that the construction of the subway station has not been affected by the groundwater resources around the station.
6. Conclusions
The main conclusions of the research are as follows:
(1) During the excavation of the foundation pit, within the effective detection range it was found that when the foundation pit was excavated to 8 m, the geological radar map showed a triangle-shaped abnormal area within the measuring line mileage. When the foundation pit was excavated to 15 m, the abnormal area further expanded, resulting in water leakage within the measuring line range of Group B and the abnormal area was determined.
(2) The curve of the average wave velocity amplitude of electromagnetic wave velocity with mileage in different mileages in each group of data was analyzed. It was found that during the excavation of the foundation pit, within the mileage range of 0.65 m–0.9 m of the Group B survey line, the average value of electromagnetic wave amplitude has an abnormal fluctuation value greater than twice the average value and the corresponding mileage of the peak point of the abnormal fluctuation is 0.84 m. After excavation, it is confirmed that the underground diaphragm wall has water leakage and the lateral deviation of the position is less than 0.35 m, so the mileage of water leakage in the abnormal area is determined.
(3) By analyzing the single channel signal graph during the excavation of the foundation pit, it is found that the electromagnetic wave at the place where the average wave velocity amplitude fluctuates abnormally has two sudden changes when propagating downward and the sudden change is greater than twice the average value, which is located at depths of 3.0–4.0 m and 12.5–13.5 m. After excavation, it is confirmed that there is water leakage at the buried depth of the diaphragm wall at 13.0–13.3 m, which is basically consistent with the prediction results of radar detection technology.
(4) It is proposed to introduce the grey correlation analysis while analyzing the source of the leakage water at the joints of the diaphragm wall of the subway foundation pit. The research results show that the leakage water at the joints of the diaphragm wall of the subway foundation pit is not connected with the rivers around the foundation pit, which confirms that the construction of the subway station has not affected the groundwater resources around the station.
(5) In future research, we will study the characteristics of water resource migration during foundation pit excavation in combination with geotechnical seepage mechanics, CT scanning, and electrical water exploration technology and build a multi-physical field model of "stress-current-seepage" under the disturbance of foundation pit excavation based on the characterization of ground penetrating radar technology.
Author Contributions
Conceptualization, K.C. and N.M.K.; methodology and software, S.H.; validation, R.M.A.K., M.Z.E. and H.R.; data curation, R.C. and X.L.; writing—original draft preparation, Y.X., M.H.B.M.H. and S.S.A.; writing—review and editing. All authors have read and agreed to the published version of the manuscript.
Funding
This research was supported by Anhui Provincial Scientific Research Preparation Plan Project (2022AH050596) and researchers Supporting Project number (RSP2022R496), King Saud University, Riyadh, Saudi Arabia.
Data Availability Statement
The data of this study is available from the corresponding author upon reasonable request.
Acknowledgments
This research was supported by Anhui Provincial Scientific Research Preparation Plan Project (2022AH050596) and researchers Supporting Project number (RSP2022R496), King Saud University, Riyadh, Saudi Arabia.
Conflicts of Interest
The authors declare no conflict of interest.
References
- Liu, N.F.; Li, N.; Xu, C.B.; Li, G.F.; Song, Z.P.; Yang, M. Mechanism of secondary lining cracking and its simulation for the dugongling tunnel. Rock Mech. Rock Eng. 2020, 53, 4539–4558. [Google Scholar] [CrossRef]
- Feng, X.J.; Wang, P.; Liu, S.F.; Wei, H.; Miao, Y.L.; Bu, S.J. Mechanism and law analysis on ground settlement caused by shield excavation of small-radius curved tunnel. Rock Mech. Rock Eng. 2022, 55, 3473–3488. [Google Scholar] [CrossRef]
- Qiao, Y.K.; Peng, F.L.; Sabri, S.; Rajabifard, A. Socio-environmental costs of underground space use for urban sustainability. Sustain. Cities Soc. 2019, 51, 101757. [Google Scholar] [CrossRef]
- Liu, A.; Liu, S.; Liu, P.; Wang, K. Water sorption on coal: Effects of oxygen-containing function groups and pore structure. Int. J. Coal Sci. Technol. 2021, 8, 983–1002. [Google Scholar] [CrossRef]
- Guo, H.; Wang, H.; Chen, S.; Wu, Z.R. Water film area and dust removal efficiency of string grilles: A theoretical analysis. Int. J. Coal Sci. Technol. 2021, 8, 1015–1024. [Google Scholar] [CrossRef]
- Ma, D.; Duan, H.; Zhang, J.; Bai, H. A state-of-the-art review on rock seepage mechanism of water inrush disaster in coal mines. Int. J. Coal Sci. Technol. 2022, 9, 50. [Google Scholar] [CrossRef]
- Zhang, K.; Li, H.; Han, J.; Jiang, B.; Gao, J. Understanding of mineral change mechanisms in coal mine groundwater reservoir and their influences on effluent water quality: A experimental study. Int. J. Coal Sci. Technol. 2021, 8, 154–167. [Google Scholar] [CrossRef]
- Qi, T.; Zhang, F.; Pei, X.; Feng, G.; Wei, H. Simulation research and application on response characteristics of detecting water-filled goaf by transient electromagnetic method. Int. J. Coal Sci. Technol. 2022, 9, 17. [Google Scholar] [CrossRef]
- Liu, W.; Yang, K.; Zhang, S.; Zhang, Z.; Xu, R. Energy evolution and water immersion-induced weakening in sandstone roof of coal mines. Int. J. Coal Sci. Technol. 2022, 9, 53. [Google Scholar] [CrossRef]
- Liu, Z.; Wang, G.; Li, J.; Li, H.; Zhao, H.; Shi, H.; Lan, J. Water-immersion softening mechanism of coal rock mass based on split hopkinson pressure bar experiment. Int. J. Coal Sci. Technol. 2022, 9, 61. [Google Scholar] [CrossRef]
- Sun, K.; Fan, L.; Xia, Y.; Li, C.; Chen, J.; Gao, S.; Wu, B.; Peng, J.; Ji, Y. Impact of coal mining on groundwater of luohe formation in binchang mining area. Int. J. Coal Sci. Technol. 2021, 8, 88–102. [Google Scholar] [CrossRef]
- Duo, L.; Hu, Z.; Yang, K.; Li, Y. Sediment settlement rate and consolidation time of filling reclamation in coal mining subsidence land. Int. J. Coal Sci. Technol. 2022, 9, 39. [Google Scholar] [CrossRef]
- Al-Qadi, I.L.; Xie, W.; Roberts, R.; Leng, Z. Data analysis techniques for gpr used for assessing railroad ballast in high radio-frequency environment. J. Transp. Eng.-ASCE 2010, 136, 392–399. [Google Scholar] [CrossRef]
- Yang, Y.H.; Jing, W.; Xu, M. Discussion on Polymer Grouting Repair Technology of Urban Road Based on Nondestructive Testing. Build. Technol. Dev. 2019, 46, 125–126. [Google Scholar]
- Liu, L.H. Application of Ground Penetrating Radar in Thickness Detection of Road Structure Layer. Constr. Mater. Decor. 2019, 11, 268–269. [Google Scholar]
- Massarelli, C.; Campanale, C.; Uricchio, V.F. Ground penetrating radar as a functional tool to outline the presence of buried waste: A case study in south italy. Sustainability 2021, 13, 3805. [Google Scholar] [CrossRef]
- Guo, W.; Dong, C.M.; Lin, C.Y.; Zhang, T.; Zhao, Z.X.; Li, J. 3d sedimentary architecture of sandy braided river, based on outcrop, unmanned aerial vehicle and ground penetrating radar data. Minerals 2022, 12, 739. [Google Scholar] [CrossRef]
- Zhang, S.; Zhang, L.; He, W.C.; Ling, T.H.; Deng, Z.W.; Fu, G.H. Three-dimensional quantitative recognition of filler materials ahead of a tunnel face via time-energy density analysis of wavelet transforms. Minerals 2022, 12, 234. [Google Scholar] [CrossRef]
- Krause, V. Blind Source Separation for Feature Detection and Segmentation in Ground Penetrating Radar (Gpr) Imaging of Concrete Bridge Decks for Nondestructive Condition Assessment. Doctor’s Thesis, Western Michigan University, Kalamazoo, MI, USA, 2015. [Google Scholar]
- Yin, M.; Sun, T.; Luo, R. Research on 3D Imaging Technology of 2D Ground Penetrating Radar Based on MATLAB. Transp. Sci. Technol. 2019, 5, 5–9. [Google Scholar]
- Dong, M.H.; Mu, P.Y. Application of Ground Penetrating Radar and Transverse Wave Reflection Imaging Technology to Detection of Dense Reinforced Concrete Structures. Chin. J. Eng. Geophys. 2019, 16, 686–693. [Google Scholar]
- Lu, W.D.; Liu, J.L.; Lu, H.W.; Yang, F. Thickness Measurement of Concrete Structures by Radar Detector. Nondestruct. Test. 2009, 31, 364–366+399. [Google Scholar]
- Liu, J.; Zhao, X.H.; Zhao, C.Y. Nondestructive Testing of a Reinforced Concrete Platewith the GPR Technique. J. Shantou Univ. (Nat. Sci. Ed.) 2003, 18, 67–72. [Google Scholar]
- Zhang, Q.M.; Zhu, H.T.; Fan, R.Q. Experimental Study on Nondestructive Testing of Concrete Slabs with Radar Wave. Build. Sci. 2009, 25, 44–47. [Google Scholar]
- Hu, P. Applied Techniques of Ground Penetrating Radar (GPR) Numerical Modeling. Ph.D. Thesis, China University of Geosciences, Beijing, China, 2005. [Google Scholar]
- Qin, J.B.; Deng, S.Q.; Li, M. Application of GPR to the inspection of liner of highway tunnel and water culvert. Coal Geol. Explor. 2004, 32, 55–58. [Google Scholar]
- Ma, W.P.; Wang, X.D.; Liu, D. YOLO target detection algorithm research in GPR anomaly image recognition. Bull. Surv. Mapp. 2019, S1, 72–76. [Google Scholar]
- Ye, L.Y. Application of Ground-Penetrating Radar to Investigate Voids between Tunnel Liners and Water Leaking in Metro Tunnel. Doctor’s Thesis, Shantou University, Shantou, China, 2005. [Google Scholar]
- Wang, H.; Wang, Z.; Jiang, Y.; Song, J.; Jia, M. New approach for the digital reconstruction of complex mine faults and its application in mining. Int. J. Coal Sci. Technol. 2022, 9, 43. [Google Scholar] [CrossRef]
- Banerjee, B.P.; Raval, S. Mapping sensitive vegetation communities in mining eco-space using uav-lidar. Int. J. Coal Sci. Technol. 2022, 9, 40. [Google Scholar] [CrossRef]
- Wang, M.L.; Liang, Z.H.; Wang, H.H.; Gong, J.B.; Zhang, Z.; Xiong, B. Review of Reverse Time Migration in Ground Penetrating Radar. Prog. Geophys. 2019, 34, 2087–2096. [Google Scholar]
- Shu, Z.L. Study on GPR Forward Simulation and Inversion of Tunnel Lining Cavity. Ph.D. Thesis, Chongqing University, Chongqing, China, 2010. [Google Scholar]
- Li, J. Ground Penetrating Radar Detection and Parameter Inversion in Stochastic Effective Medium. Ph.D. Thesis, Jilin University, Changchun, China, 2014. [Google Scholar]
- Ma, J.J.; Chen, J.J.; Chen, W.X.; Huang, L.C. A coupled thermal-elastic-plastic-damage model for concrete subjected to dynamic loading. Int. J. Plast. 2022, 153, 103279. [Google Scholar] [CrossRef]
- Ma, J.J.; Chen, J.J.; Guan, J.W.; Lin, Y.X.; Chen, W.X.; Huang, L.C. Implementation of Johnson-Holmquist-Beissel model in four-dimensional lattice spring model and its application in projectile penetration. Int. J. Impact Eng. 2022, 170, 104340. [Google Scholar] [CrossRef]
- Ma, J.J.; Guan, J.W.; Gui, Y.L.; Huang, L.C. Anisotropic Bounding Surface Plasticity Model for Porous Media. Int. J. Geomech. 2021, 21, 04021033. [Google Scholar] [CrossRef]
- Ma, J.J.; Zhao, G.F.; Khalili, N. A fully coupled flow deformation model for elasto-plastic damage analysis in saturated fractured porous media. Int. J. Plast. 2016, 76, 29–50. [Google Scholar] [CrossRef]
- Ma, J.J. Wetting collapse analysis on partially saturated oil chalks by a modified cam clay model based on effective stress. J. Pet. Sci. Eng. 2018, 167, 44–53. [Google Scholar] [CrossRef]
- Du, F.; Ma, J.; Guo, X.; Wang, T.; Dong, X.; Li, J.; He, S.; Nuerjuma, D. Rockburst mechanism and the law of energy accumulation and release in mining roadway: A case study. Int. J. Coal Sci. Technol. 2022, 9, 67. [Google Scholar] [CrossRef]
- Liu, B.; Zhao, Y.; Zhang, C.; Zhou, J.; Li, Y.; Sun, Z. Characteristic strength and acoustic emission properties of weakly cemented sandstone at different depths under uniaxial compression. Int. J. Coal Sci. Technol. 2021, 8, 1288–1301. [Google Scholar] [CrossRef]
- Dou, L.; Yang, K.; Chi, X. Fracture behavior and acoustic emission characteristics of sandstone samples with inclined precracks. Int. J. Coal Sci. Technol. 2020, 8, 77–87. [Google Scholar] [CrossRef]
- Zhang, Z.; Sun, T.; Liu, J.D.; Zhou, Z.H.; Tang, X.J. Frequency Domain Analysis of Ground Penetrating Radar in Detecting the Karst Rock Cavity under Pile Tips. Soil Eng. Found. 2014, 28, 163–166+170. [Google Scholar]
- Tan, C.; Pan, Z.Z.; Yuan, M.D.; Shi, Y.S.; Liu, J.W.; Lin, Y.Q. Application of comprehensive geophysical prospecting technology in emergency detection of dike leakage. J. Water Resour. Water Eng. 2019, 30, 184–188. [Google Scholar]
- Hu, H.M.; Zhang, C. Method of Calibration on Ground Penetrating Radar Based on the Improved Method of Air-dielectric and Depth Detection Method of Reinforcement. Sci. Technol. Eng. 2019, 19, 238–243. [Google Scholar]
- Liu, S.F. Grey System Theory and Application, 9th ed.; Science Press: Beijing, China, 2021. [Google Scholar]
Disclaimer/Publisher’s Note: The statements, opinions and data contained in all publications are solely those of the individual author(s) and contributor(s) and not of MDPI and/or the editor(s). MDPI and/or the editor(s) disclaim responsibility for any injury to people or property resulting from any ideas, methods, instructions or products referred to in the content. |
© 2022 by the authors. Licensee MDPI, Basel, Switzerland. This article is an open access article distributed under the terms and conditions of the Creative Commons Attribution (CC BY) license (https://creativecommons.org/licenses/by/4.0/).