Article

Calculation Method for Uplift Capacity of Suction Caisson in Sand Considering Different Drainage Conditions

1
CGN Rudong Offshore Wind Power Co., Ltd., Rudong 226400, China
2
Key Laboratory of Offshore Geotechnics and Material of Zhejiang Province, College of Civil Engineering and Architecture, Zhejiang University, Hangzhou 310058, China
3
Norwegian Geotechnical Institute, 0484 Oslo, Norway
*
Author to whom correspondence should be addressed.
Sustainability 2023, 15(1), 454; https://doi.org/10.3390/su15010454
Submission received: 23 November 2022 / Revised: 19 December 2022 / Accepted: 20 December 2022 / Published: 27 December 2022

Abstract

:
Uplift capacity of suction caissons is one of the main concerns in the design of jackets with multi-caissons supported offshore wind turbine. The uplift movement of suction caissons leads to soil stress variation and increases the difficulty to predict the uplift capacity. In this paper, a calculation method considering soil stress release and differential pressure contribution is proposed to predict the uplift capacity of caisson. Firstly, a series of numerical simulations based on the SANISAND model are conducted to study the uplift responses of suction caisson in sand, and it is verified with centrifuge test results. Considering the soil drainage condition during caisson being pulled out, the fully drained, partially drained and undrained are divided, and an equation is provided to assess differential pressure beneath the caisson lid incorporating the effects of main factors. Based on the above simulation results, a calculation method is proposed to calculate the uplift capacity of caissons. The prediction results are compared with the centrifuge model tests and previous studies, which indicate that the prediction accuracy is much improved. This proposed method contributes to the more accurate assessment of uplift capacity of suction caisson in sand.

1. Introduction

In recent years, offshore wind energy has developed rapidly due to the characteristics of high wind speed, low turbulence and no occupation of farmland [1]. A variety of offshore wind turbine (OWT) foundations have emerged, e.g., gravity, monopile, suction caisson, jacket foundation, floating foundation, etc. For water depth of more than 30 m, the jacket foundation is always recommended [2,3,4]. The jacket with multi-caissons has great conveniences in transportation and installation, becoming a popular foundation form for OWTs [5].
During service, a large overturning moment generated by environment loads is applied to the jacket with multi-caissons supported OWT, and it is mainly transmitted to every caisson in the form of axial load [6,7]. The OWTs may be suddenly subjected to extreme environmental loads, such as a storm, resulting in transient tensile loading on upwind caisson, causing it at the risk of being pulled out.
The uplift capacity of suction caisson consist of differential pressure beneath the caisson lid and skirt wall friction [8,9,10]. The obvious permeability of sand results in a significant seepage field in soil domain [11], which has a prominent influence on the development of differential pressure. Pore pressure was a simulated transmission in numerical simulation by adding a thin layer of “water elements” between caisson lid and soil [12,13,14,15,16,17]. Vaitkunaite [18] conducted a series of large-scale model tests to study the development of differential pressure under axial loading. Hong [19] studied the influence of pullout velocity on drainage conditions through model experiments, which neglected the scale effect so that the impact of seepage cannot be amplified into the prototype.
The seepage field also has a significant impact on the soil stress state, causing the change in uplift capacity of suction caisson. Considering the soil stress reduction [20], Houlsby [21] proposed an analytical solution to calculate the tensile capacity of suction caisson under rapid loading, and the cavitation effect and soil liquefaction were considered. However, the calculation accuracy depends on the determination of stress reduction region, which brings difficulty to the engineering application. Senders [22] conducted a series of centrifuge tests to investigate the development of differential pressure and skirt wall friction during caisson being pulled out, and proposed a spring—damper model to predict the differential pressure beneath the lid and skirt wall friction. Vicent [23,24] performed model tests to investigate the impacts of loading rate and embedment depth on the pullout capacity of caisson foundations in sand.
The design code DNVGL [25] pointed out that the design of suction caisson will be conservative when the drainage mechanisms cannot be determined with good confidence. In the codes API [26] and OWA [27], the capacity of suction caisson is designed separately aiming at fully drained and undrained two conditions. The soil exhibits various failure mechanisms under different drainage conditions during caisson being pulled out [18,28]. However, these previous studies and design codes have not clearly classified the drainage conditions in sand and no suitable calculation scheme of differential pressure is provided.
In this paper, the SANISAND model is adopted to study the uplift responses of suction caisson considering the influence of stress state on soil mechanical responses. The effects of soil permeability, pullout velocity, aspect ratio, lateral earth pressure coefficient and soil-structure interface friction angle on the instantaneous pullout responses of caisson are studied. Then, the various drainage conditions are divided and an equation is proposed to evaluate the differential pressure during caisson pullout. Under different pullout velocity, the variation range of uplifted capacity and soil stress state are investigated. Then, the calculation method of uplift capacity is proposed combining the above simulation results. Compared with the centrifuge tests and preceding studies, the accuracy of the proposed method is validated.

2. Numerical Model and Its Verification

2.1. Finite Element Model

An axisymmetric model was built to research the pullout characteristics of suction caisson in sand using ABAQUS [29]. It is assumed that the caisson was “wish-in-place”, ignoring its installation process. As shown in Figure 1, the finite element model consists of caisson, homogeneous saturated sand and a thin layer of soft “water elements”. The tensile loading was applied by vertical displacement and its action point was caisson centre.

2.1.1. Mesh Element

The mesh element CAX4 was used to simulate the caisson, and the element CAX4P containing pore pressure calculation was used for homogeneous saturated sand. The mesh width near the skirt reaches 0.05 m, which is fine enough verified by the mesh sensitivity study.
A thin layer of soft “water elements” was adopted to simulate the trapped water between the caisson lid and internal soil plug [12,13,30]. As normal coupled pore fluid elements, the water elements were defined as isotropic liner elastic property with high permeability and elasticity. The permeability coefficient was set to a high value of 1 m/s, and the Young’s modulus and Poisson’s ratio were 10−5 kPa and 0, respectively. In this way, the water elements can transfer pore pressure without transmitting effective stress.

2.1.2. Interface Properties and Boundary Conditions

The water elements were tied to the caisson lid and soil plug to maintain displacement coordination. The interfaces between skirt wall and soil were simulated using the master-slave contacts. The ultimate shear stress is calculated by the Coulomb criterion and can be expressed by μ σ h , where μ is the friction coefficient of soil-structure and σ h is the horizontal soil stress on caisson. The elastic sliding distance of skirt-soil interface was set to 0.5 mm [15]. Ignoring the tangential behavior between caisson tip and soil, the separation was allowed.
In Figure 1, the left boundary is the symmetry axis of this model, and the right boundary is only constrained to lateral displacement and free for drainage. The bottom boundary is fixed, and the top boundary is free surface with zero excess pore pressure. The radius and the depth of soil domain are 2.5D and 5L, respectively, which can eliminate the boundary effects [14].

2.1.3. Soil Constitutive Model

The boundary surface soil model proposed by Dafalias [31,32], which is developed from the concept of critical state soil mechanics and belongs to one kind of SANISAND models [33], is chosen in this paper. The soil constitutive model has been certified to be able to simulate the sand stress-strain relationships under unidirectional and cyclic loads. This model is applicable for a range of relative density, from loose to medium dense, under different drainage conditions and consolidation stresses. Based on the framework of critical state soil mechanics, the bounding surface and phase transformation surface (determining the sand dilates or contracts) are imported.

2.2. Model Verification

Senders [22] performed a series of centrifuge tests to investigate the uplift characteristics of suction caisson at 100 g. For the model caisson, its outer diameter, skirt wall thickness and length are 60 mm, 0.4 mm and 60 mm, respectively. The interface friction angle of soil structure δ is 22°. The seabed is the silica sand with relative density Dr = 60%, mass median diameter D50 = 0.2 mm, initial void ratio e = 0.7357 and the internal friction angle φ = 43°. Silicon oil was used as the pore fluid and the permeability coefficient k is 2.3 × 10⁻⁴ m/s. The buoyant unit weight γ and specific weight of water γ w are both 10 kN/m3. According to the results of centrifuge tests, Senders [22] calculated the lateral earth pressure coefficient, which is equal to 0.8. For the silica sand used in centrifuge tests of Senders [22], Tran [34] conducted a series of laboratory tests to measure its basic parameters. Based on the laboratory tests of Tran [34], Shen [15] calibrated the SANISAND model parameters of silica sand.
The centrifuge tests are divided into drained uplift (the air hole of caisson lid is opened) with the pullout velocity of 0.1 mm/s and partially drained uplift (the air hole of caisson lid is closed) with the pullout velocity of 0.1 mm/s and 0.5 mm/s. Figure 2 shows the comparison of simulation results with centrifuge tests. For the differential pressure (in Figure 2a) of skirt wall friction (in Figure 2b) and total vertical force (in Figure 2c), their initial state cannot be predicted precisely, perhaps ignoring the soil disturbance during the suction installation process of the caisson. The comparison of normalized results (in Figure 2d) shows that differential pressure, skirt wall friction and total vertical force can be forecasted approximatively at the end state (w = 0.015D). Moreover, this paper focuses on the uplift responses of caisson at the end state, so the calculation error can be ignored at the initial state.

2.3. Simulation Parameters

According to the test results of [22,35,36,37], the uplift responses of suction caisson are relevant with the pullout velocity when the vertical displacement exceeds 0.02D, and the caisson cannot meet the functional requirements at the same time. Therefore, the tensile loading when the vertical displacement of caisson reaches w0 = 0.02D is regarded as its uplift capacity in this paper, and the responses of seepage, pore pressure, soil stress field, etc., are investigated later at this state.
The Dogger Bank sand in the North Sea is adopted in the next simulations with d10 = 0.087 mm, d60 = 0.174 mm, emax = 0.865 and emin = 0.597. The basic parameters of this paper’s simulations are listed in Table 1. Blaker and Andersen [38,39] conducted a series of laboratory tests on Dogger Bank sand [40]. Based on the laboratory test results, Shen [15] calibrated the SANISAND model parameters of Dogger Bank sand, which are listed in Table 2.

3. Prediction of Differential Pressure Beneath Caisson Lid

3.1. Seepage Responses of Uplift Caisson

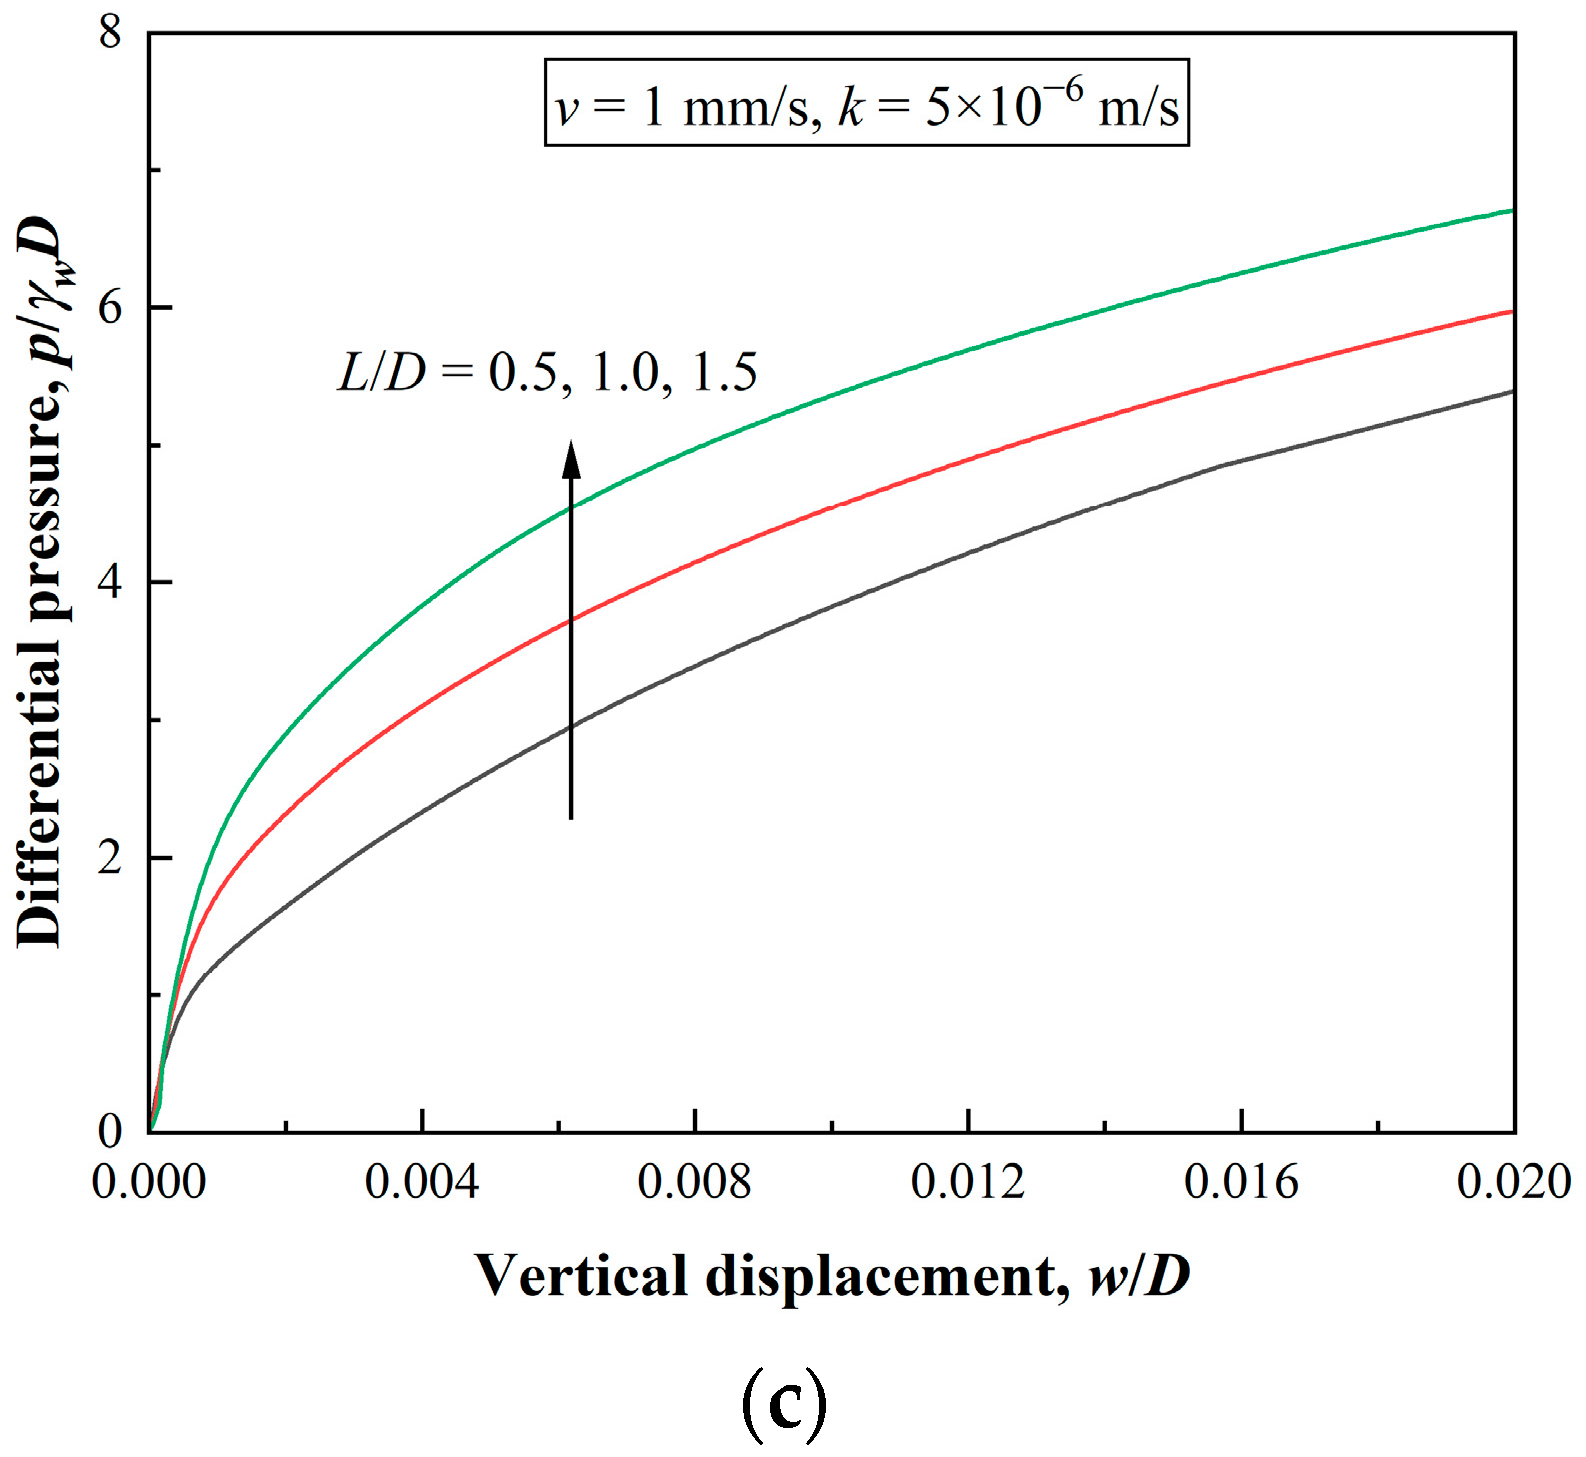
During the uplift progress of caisson, the pore pressure gradually accumulates, and a seepage field is formed in the soil domain. The enlargement of soil permeability results in the faster dissipation of pore pressure in the caisson and less accumulation of differential pressure beneath the caisson lid. Similarly, the decrease in pullout velocity generates longer pore pressure dissipation time and weakens its accumulation rate. The reduction of aspect ratio shortens the seepage length, causing a shorter dissipation time. Figure 3 shows that the differential pressure decreases with the soil permeability, and increases with the pullout velocity and aspect ratio, which are consistent with the previous descriptions.
The pore pressure fields for v = 0.001 mm/s, v = 1 mm/s and v = 100 mm/s are shown in Figure 4. For lower pullout velocity, the pore pressure inside the caisson gradually dissipates along the depth and its distribution is approximately stepped (see Figure 4a). However, the high pullout velocity generates larger cumulative pore pressure inside caisson, which is identical with Figure 3b, and the seepage field is developed to the deeper and farther seabed (see Figure 4b,c).
Figure 5 shows the soil relative displacement and flow direction for v = 0.001 mm/s, v = 1 mm/s and v = 100 mm/s. When the pullout velocity is 0.001 mm/s (in Figure 5a), the soil around skirt wall moves approximatively along the uplift direction. The soil flow is inapparent, presenting the characteristics of partial shear failure. As shown in Figure 5b, the high pullout velocity (v = 1 mm/s) results in the soil flow from the outside to the inside at the caisson tip and the direction of soil flow is accordant with the seepage, and the failure mechanism is closed to partial tensile failure. As the pullout velocity further increases (v = 100 mm/s, in Figure 5c), the scope of soil flow continuously expands, which presents the characteristics of overall reverse failure.

3.2. Differential Pressure Equation

3.2.1. Equation Deduction

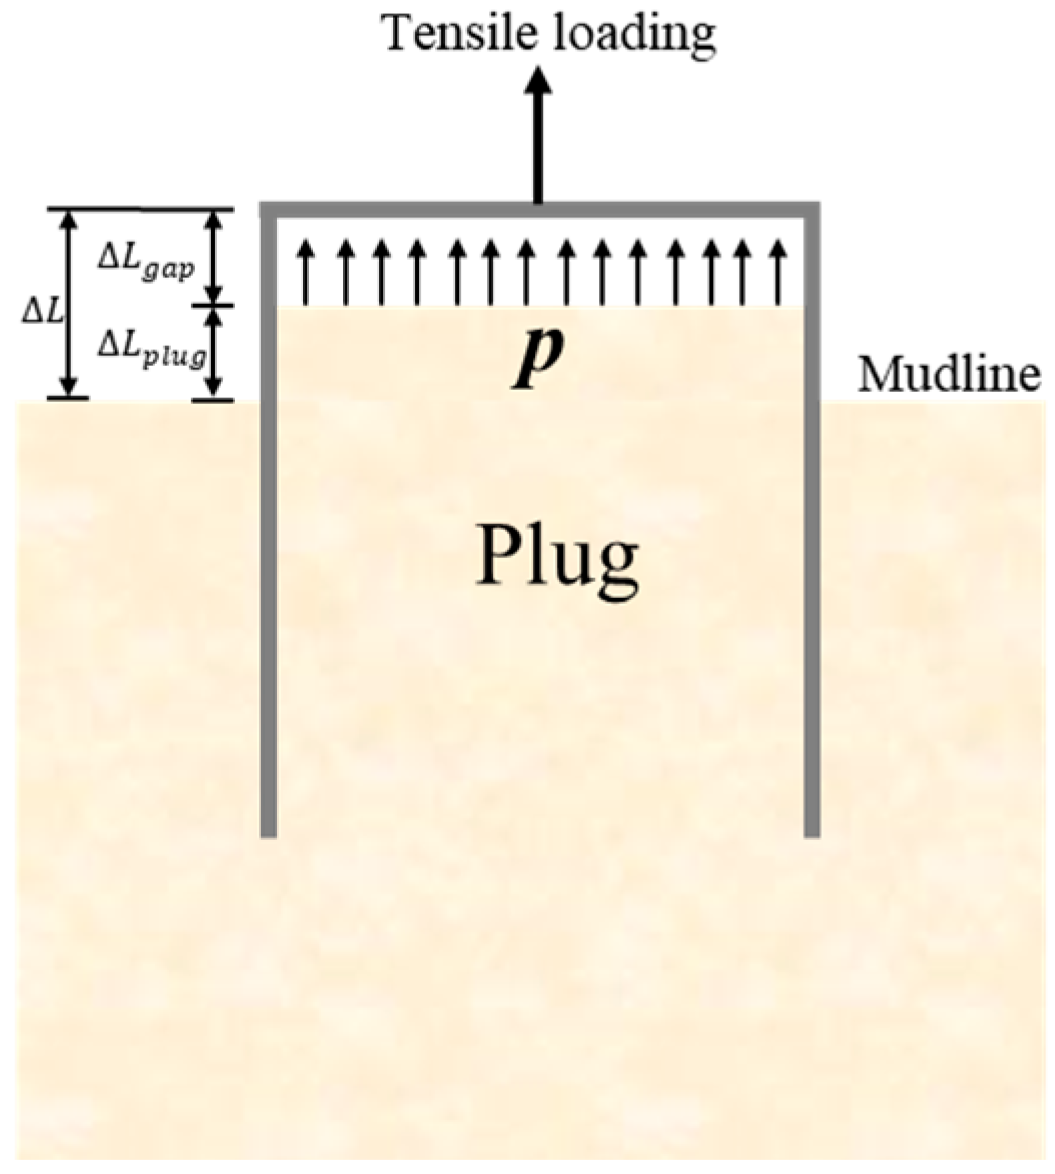
During a certain time step Δt, seepage will fill the void beneath the caisson lid with a certain amount of fluid [22], and the soil plug will be uplifted because of the differential pressure and internal skirt wall friction (see Figure 6). Therefore, the vertical pullout displacement ΔL is consisted of gap length ΔLgap and plug height ΔLplug. According to Senders [22], ΔLgap can be expressed as:
Δ L g a p = k i a v e Δ t = k p γ w s a v e Δ t
where iave is the average hydraulic gradient along the drainage path, p is the differential pressure beneath caisson lid. save is the equivalent average seepage length, and the normalized seepage length save/D is a function of L/D [12,13,14,15,16], which can be defined as:
S a v e D = h ( L / D )
The normalized differential pressure p γ w D can be expressed as:
p γ w D = Δ L g a p Δ t k s a v e D = Δ L g a p Δ L Δ L Δ t k s a v e D
Combining Equation (2) and Equation (3) can be expressed by:
p γ w D = Δ L g a p Δ L v k h ( L D )
Further, the gap length ΔLgap is equal to vertical pullout displacement ΔL minus plug height ΔLplug:
Δ L g a p Δ L = 1 Δ L p l u g Δ L
Considering the soil plug is constrained by internal skirt wall friction, plug height Δ L p l u g / Δ L is associated with the earth pressure coefficient K and interface friction angle of soil-structure δ. Furthermore, gap length Δ L g a p / Δ L is also correlated with K and δ.
Based on the above, the determination of normalized differential pressure p / γ w D should consider the comprehensive impacts of pullout velocity v, permeability coefficient k, aspect ratio L/D, earth pressure coefficient K and interface friction angle of soil-structure δ. The shear stress acting on skirt wall is calculated by σ v K t a n δ , so the influence of K and δ is inseparable [20,21] and their impacts are reflected by the combination of K t a n δ .

3.2.2. Effect of Normalized Pullout Velocity

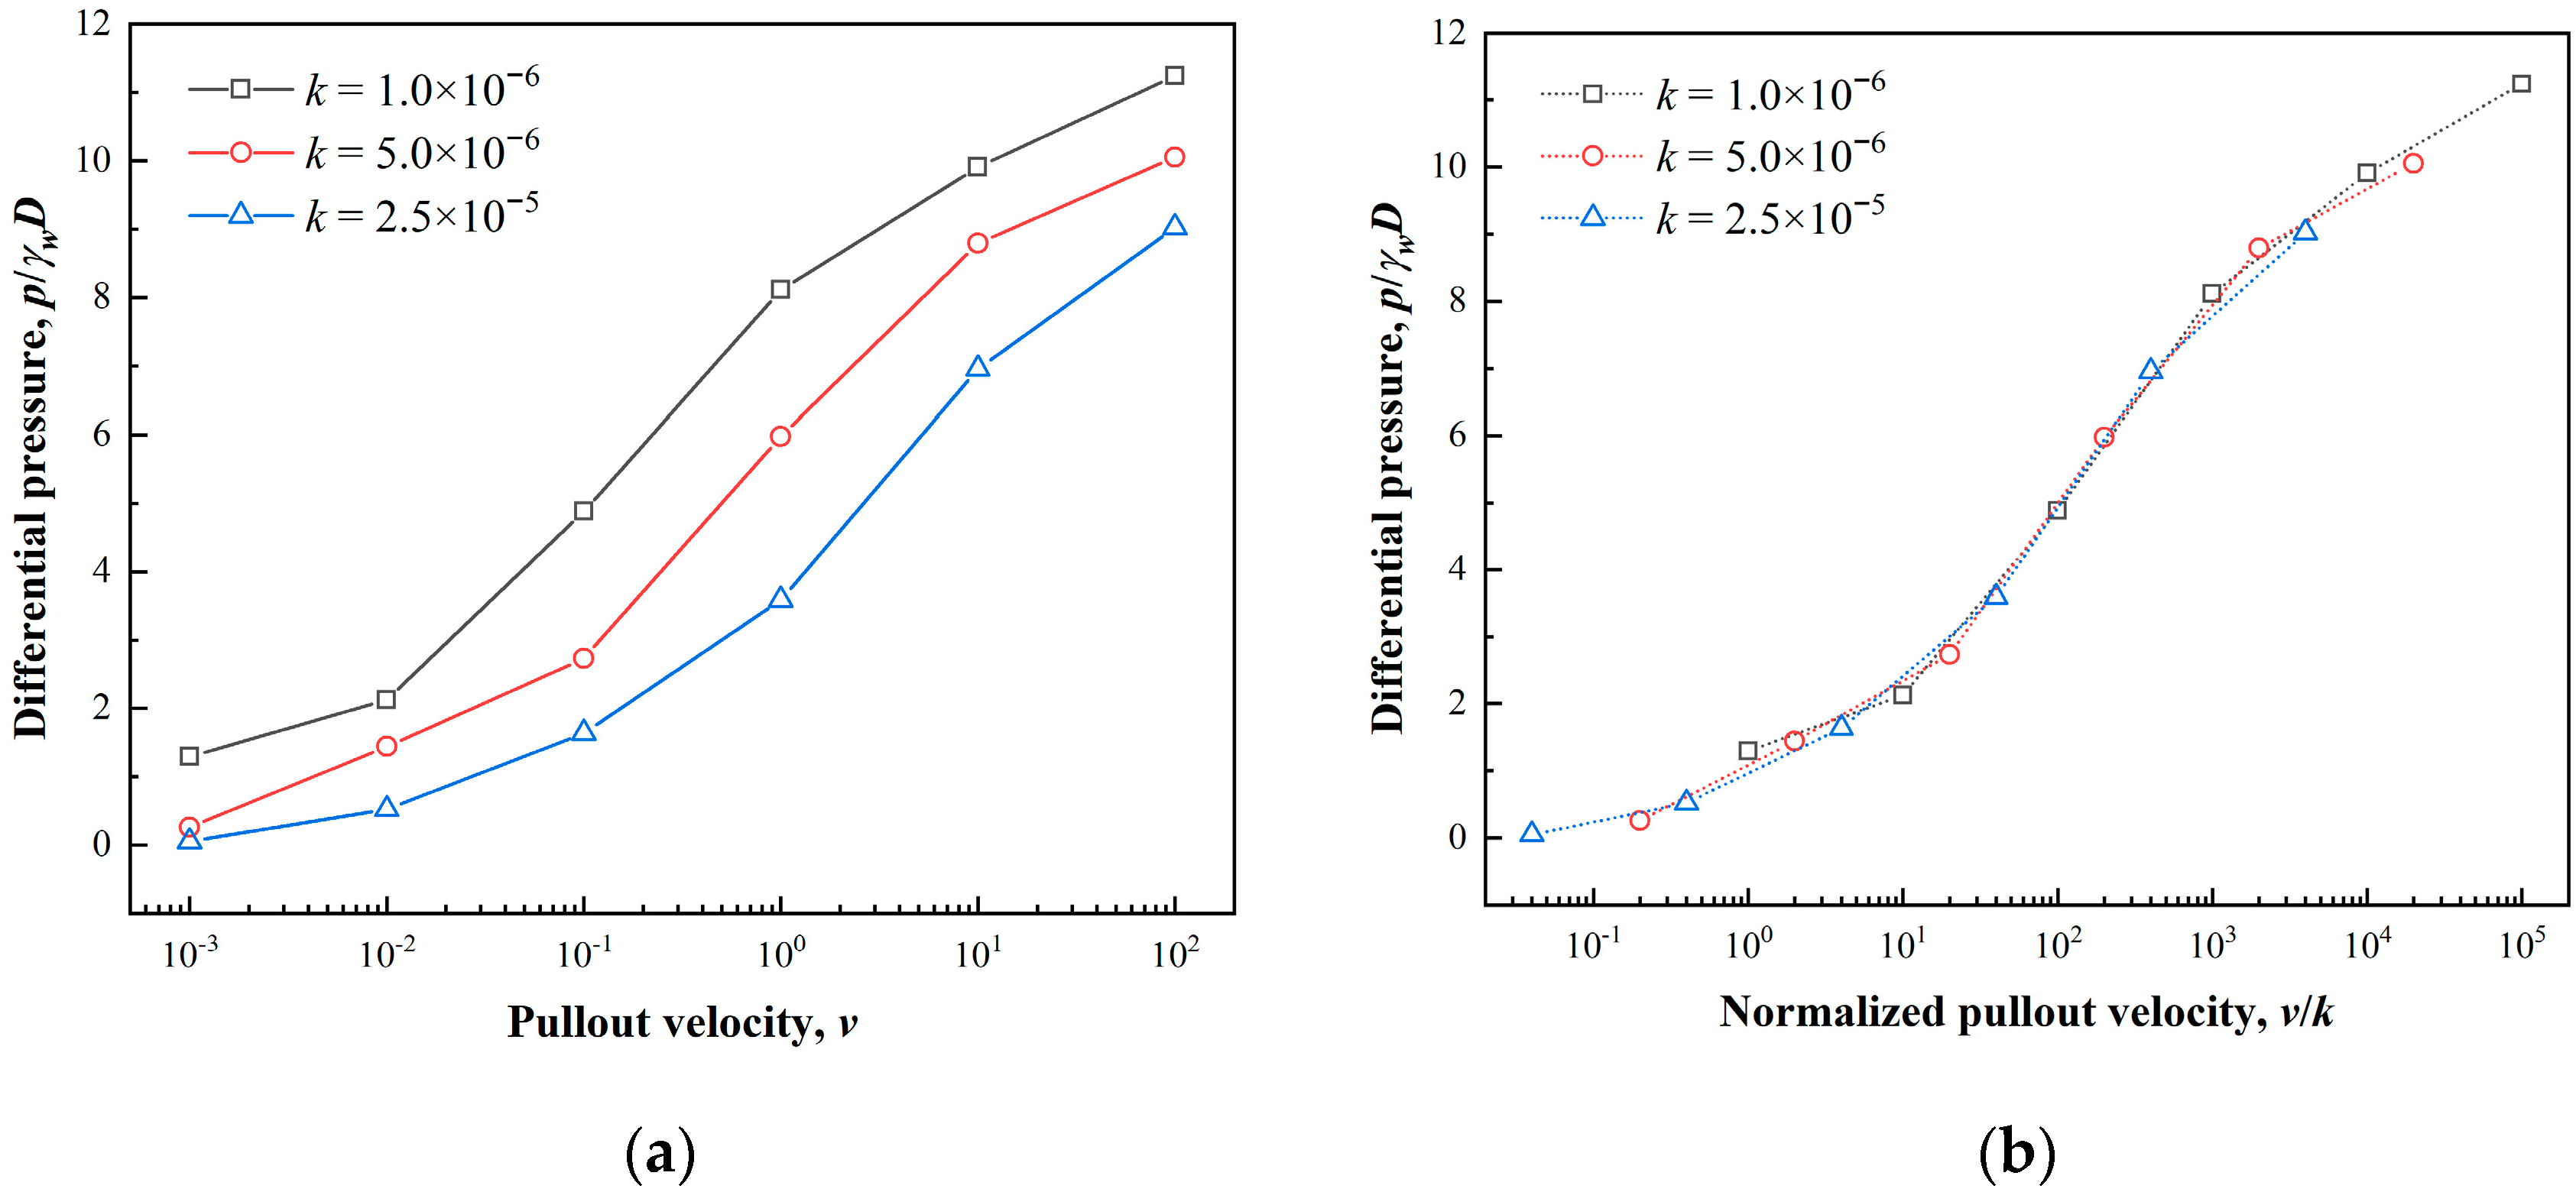
The differential pressure for different permeability coefficients (0.2k0, k0, 5k0) under various pullout velocity is shown in Figure 7a. The differential pressure is positively associated with pullout velocity and negatively relevant with permeability coefficient, which is consistent with the results of Section 3.1.
Based on Equation (1), the average hydraulic gradient along the drainage path can be defined as: iave = p/(γwsave). The caisson pullout velocity may be given roughly as: v = k·iave according to Darcy’s law [17]. Therefore, the differential pressure beneath the lid can be expressed by
p = v / k · γ w s a v e
Normalized the pullout velocity by permeability coefficient (see Figure 7b), the differential pressure shows a high correlation with v/k and increases with it. This is coincident with Equation (6), which uniformly used Darcy’s law to describe the seepage inside caisson. It is worth mentioning that Darcy’s law applies to fluid flow in the range of Reynolds number Re < 10 [41,42]. For the Dogger Bank sand used in this paper, its effective particle size d10 is 0.087 mm, and the dynamic viscosity coefficient of water h is 1.01 × 10⁻⁶ m2/s at a pressure of 101.325 kPa and a temperature of 20 °C [43]. The calculation of Reynolds number is defined as R e = v s d 10 η [44], where vs represents the fluid flow velocity. Therefore, the application range of Darcy’s law can be expressed as: v s d 10 η < 10, namely vs < 10η/d10 = 116 mm/s. On account of the formation of gap between caisson lid and soil during the caisson being uplifted, the fluid flow velocity is always less than the pullout velocity. Under the limit state, the soil plug is completely pulled out, that is, soil plug ΔLplug is equal to vertical pullout displacement ΔL and vs is approximately equal to v. Therefore, the pullout velocity v < 116 mm/s can be regarded as a conservative condition to define the application scope of Darcy’s law, and v/k is less than 2.32 × 10⁴ for the Dogger Bank sand used in this paper.
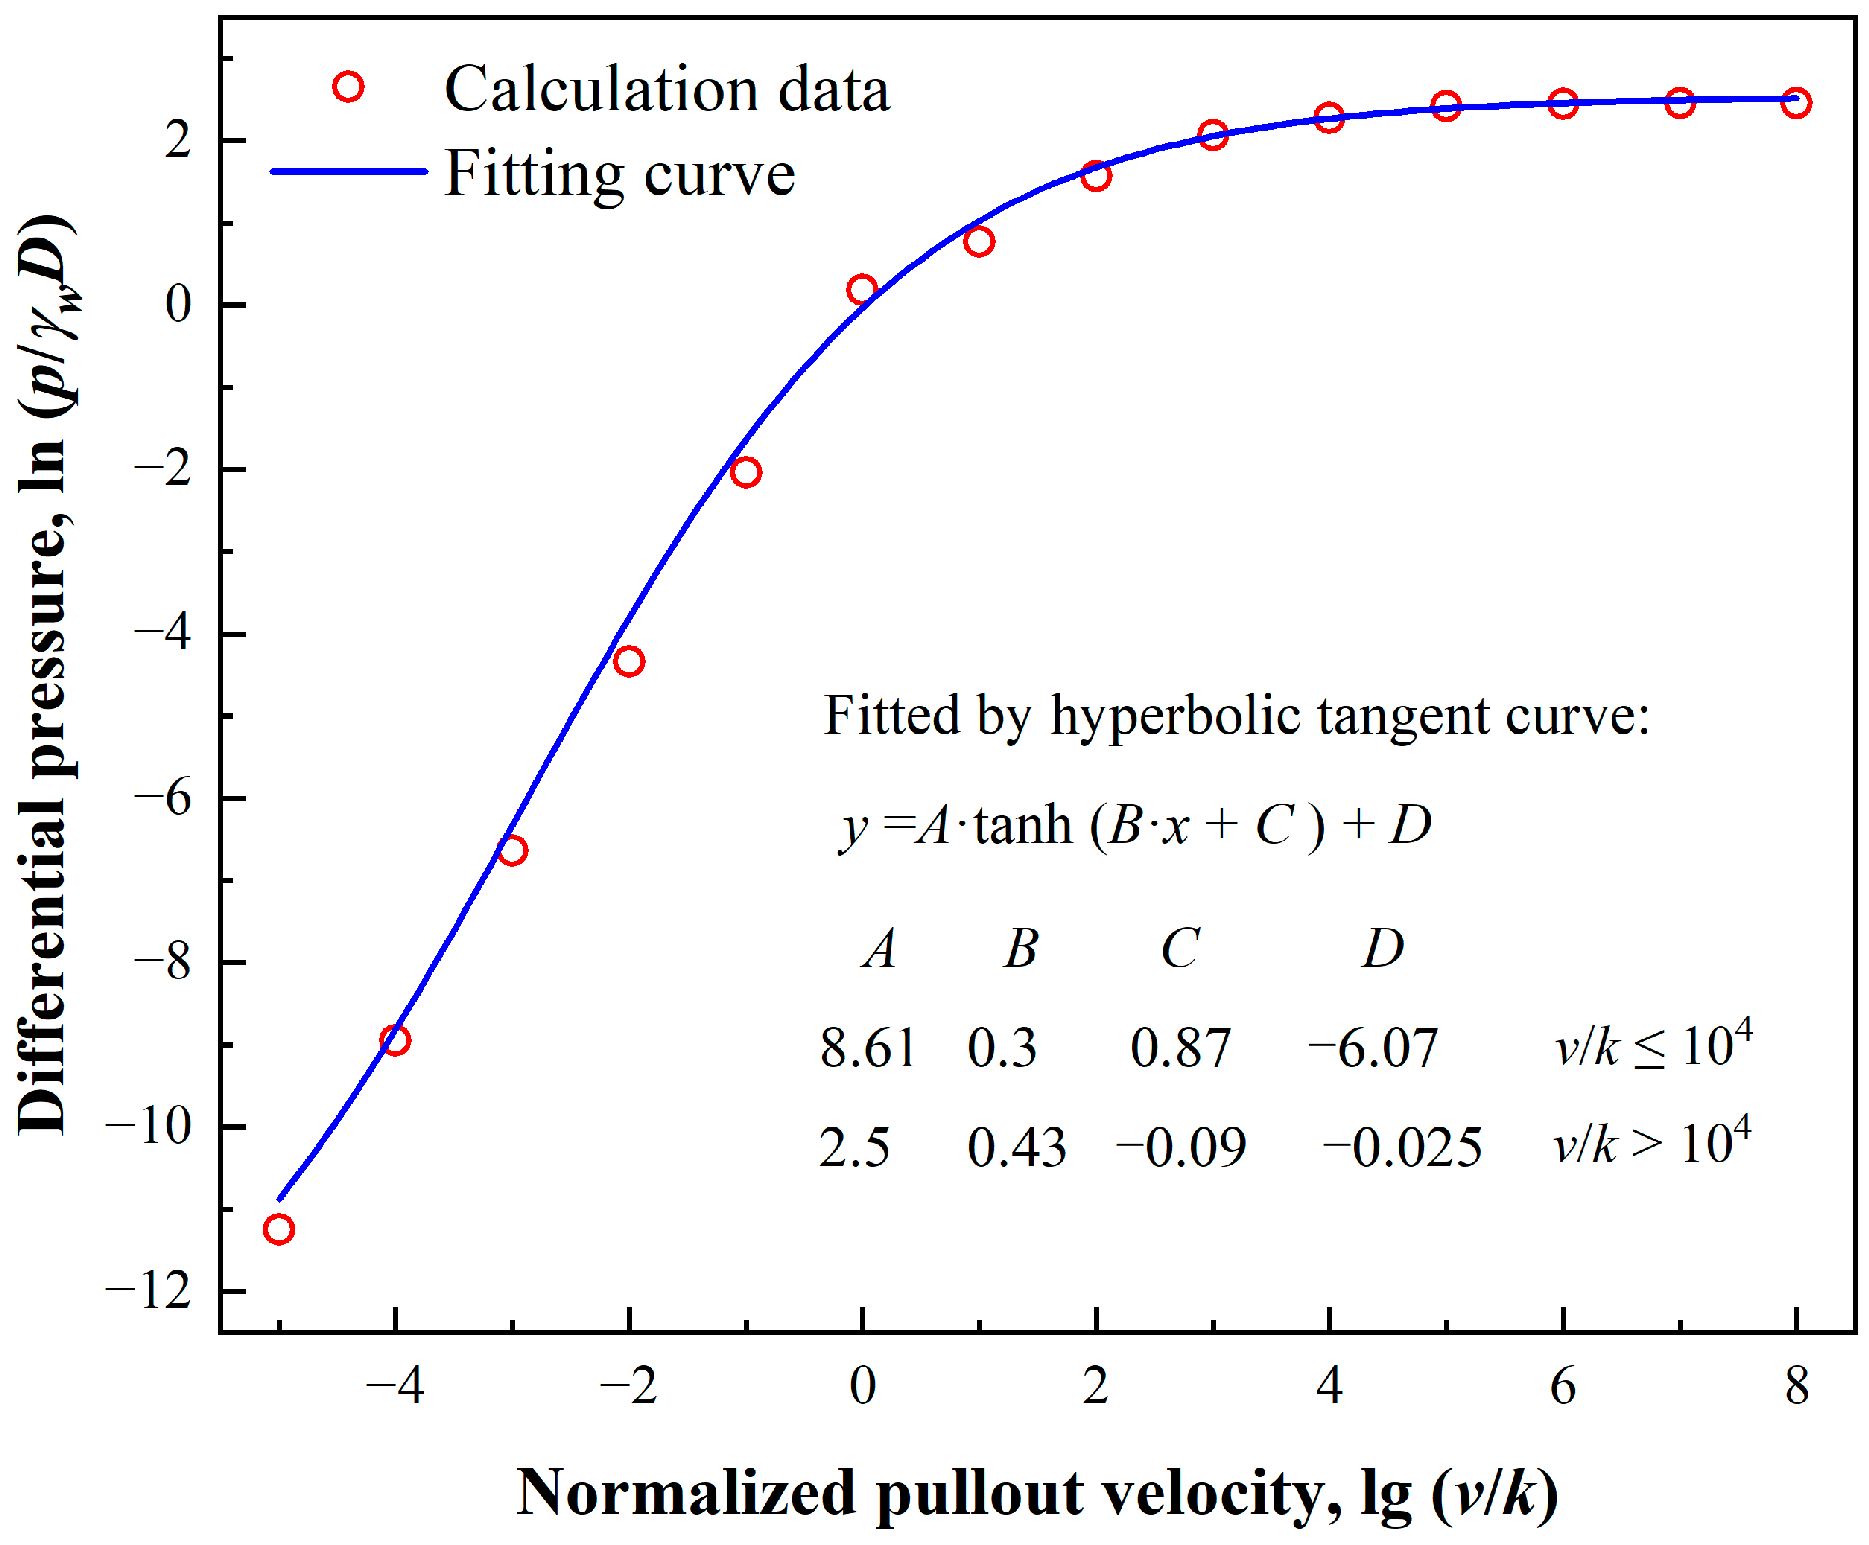
Considering the large fluid flow velocity where Darcy’s law is not applied, a wider range of uplift velocity is selected and the normalized pullout velocity v/k is from 10−5 to 108. The changes in differential pressure are shown in Figure 8, and the calculation data is fitted by hyperbolic tangent curve, which can be expressed as:
f ( v / k ) = { e 8.61 tanh ( 0.3   lg v k + 0.87 ) 6.07 , v / k 10 4 e 2.5 tanh ( 0.43   lg v k 0.09 ) 0.025 , v / k > 10 4

3.2.3. Effect of Aspect Ratio

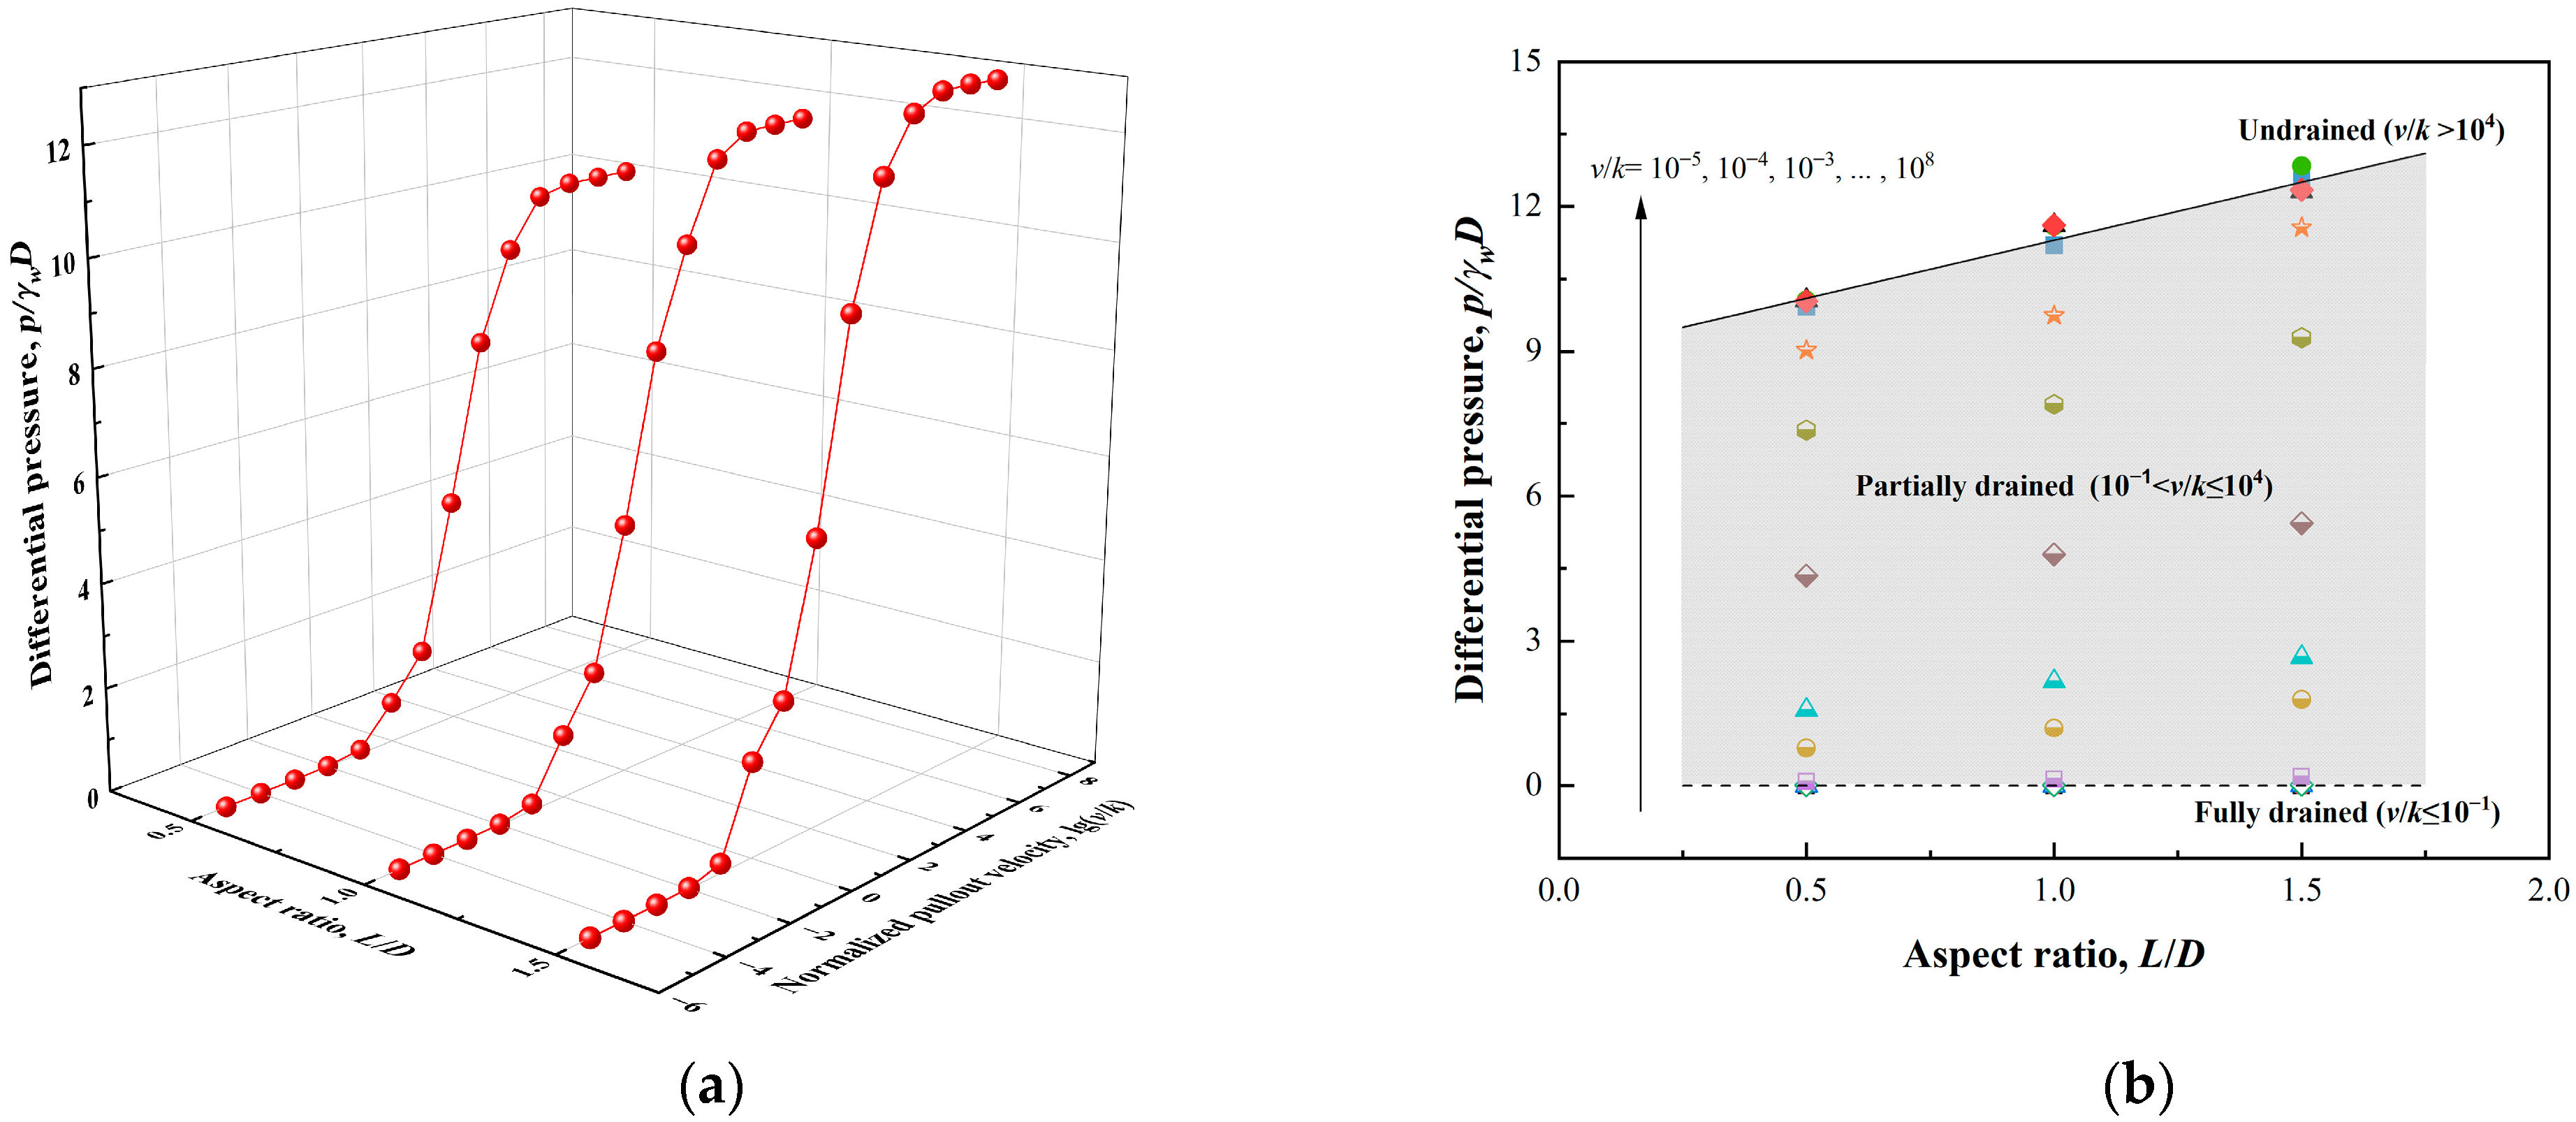
From Section 3.1, the enlargement of aspect ratio extends the seepage length, so the differential pressure increases with it. For v/k from 10−5 to 108 and L/D = 0.5, 1.0, 1.5 & m = 0.5, the variation in differential pressure is shown in Figure 9a. For different normalized pullout velocity, the correlation between differential pressure and aspect ratio is shown in Figure 9b.
The differential pressure is seldomly generated at a low pullout velocity corresponding to v/k ≤ 10−1. As the pullout velocity increases, the differential pressure gradually accumulates corresponding to 10−1 < v/k ≤ 104. According to the analysis of Section 3.2.2, Darcy’s law is still satisfied at this time. With the further increase of pullout velocity, the enlargement of differential pressure is limited corresponding to v/k > 104. Meanwhile, Darcy’s law is not suitable for describing the seepage response inside caisson. The bottom and top boundaries (see Figure 9b) are defined as the separatrices of different drainage conditions [24]. Therefore, the soil inside caisson is closed to fully drained condition for v/k ≤ 10−1 [45], partially drained for 10−1 < v/k ≤ 104 and undrained for v/k > 104.
Taking the results of L/D = 1.0 as a benchmark, the calculation data is fitted by piecewise linear equation to consider the effects of aspect ratio, which can be expressed by:
g ( L / D ) = { 1 , v / k 10 1 0.236 L / D + 0.764 , 10 1 < v / k 10 4 0.212 L / D + 0.788 , 10 4 < v / k

3.2.4. Effect of Ktan δ

The combined influence of K t a n δ is reflected by changing the friction coefficient of soil-structure, which is associated with interface friction angle. According to [46], δ = 10° (corresponding to μ = 0.176) and d = 35° (corresponding to μ = 0.700) can be treated as the relative smooth and rough soil-structure interface, respectively. Therefore, for v/k from 10−5 to 108 and m = 0.1, 0.3, 0.5, 0.7 and L/D = 1.0, the variation of differential pressure is shown in Figure 10a. For different normalized pullout velocity, the correlation between differential pressure and friction coefficient of soil-structure is shown in Figure 10b.
As normalized pullout velocity v/k increases, the differential pressure enlarges and the soil inside the caisson presents various drainage conditions, but the impacts of friction coefficient on seepage is not significant. Therefore, the effects of K t a n δ can be expressed as:
j ( K , δ ) = 1

3.2.5. Verification of Differential Pressure Equation

Combined with the above, the differential pressure equation can be defined as:
p = f ( v / k ) · g ( L / D ) · j ( K , δ ) γ w D
The curve of differential pressure equation (DPE curve) is also divided into three segments corresponding to various drainage conditions.
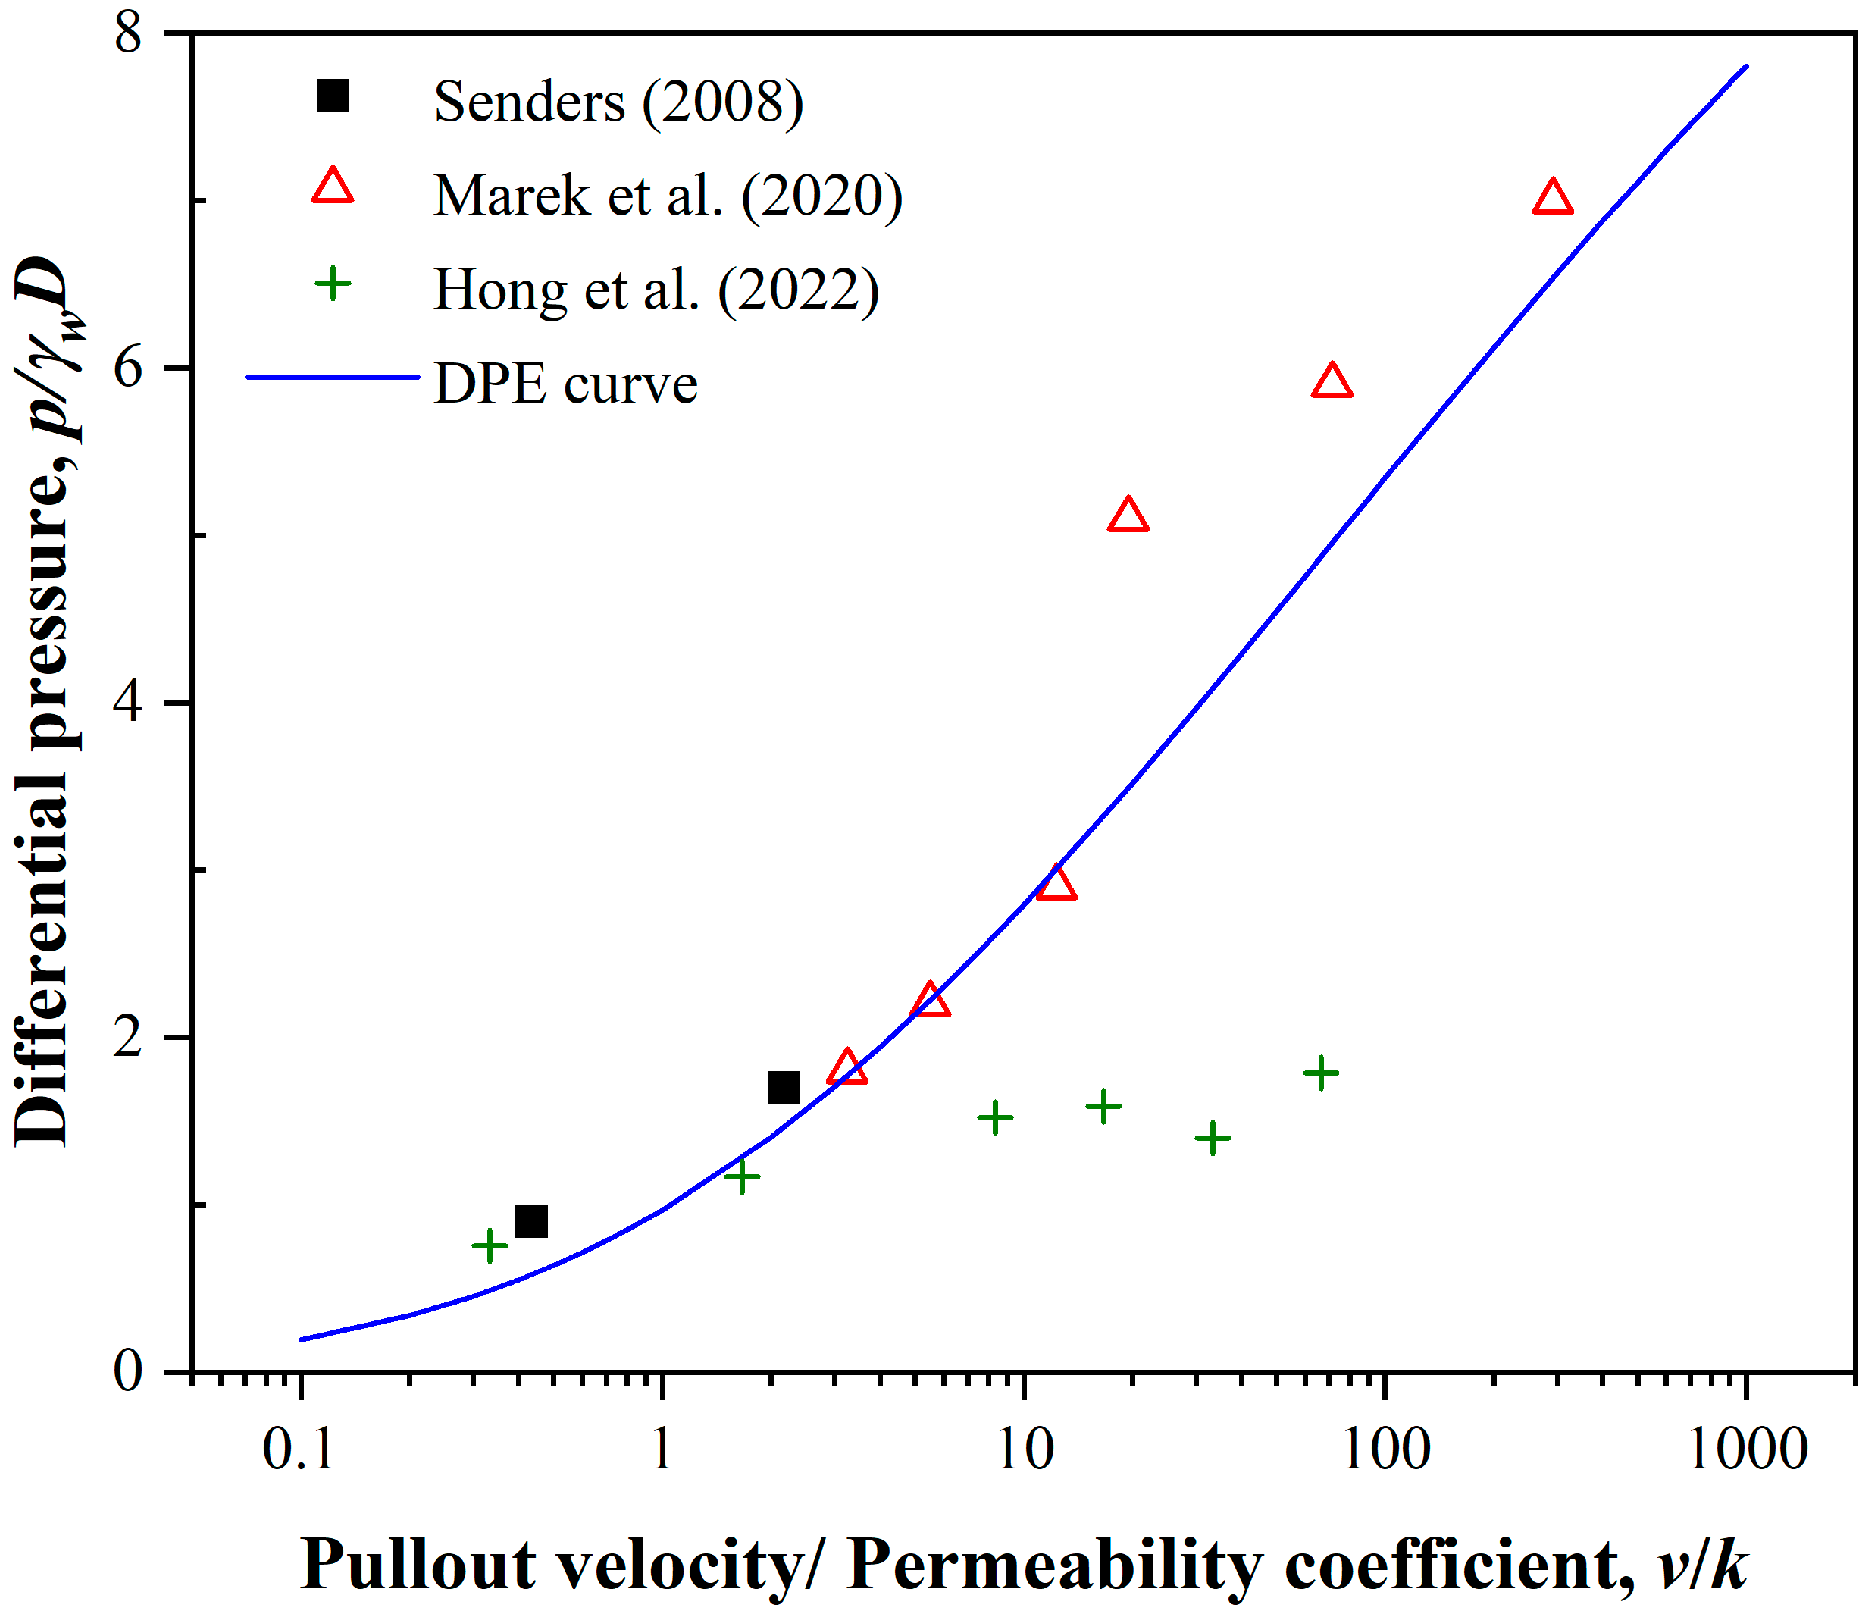
Figure 11 shows the comparisons of DPE curve with three groups of test results. In Section 2.3, the initial void ratio of silica sand used in [22] centrifuge tests is 0.7357, soil permeability coefficient is 2.3 × 10⁻⁴ m/s and aspect ratio L/D is 1.0. The DPE curve coincides well with the two tests (v = 0.1, 0.5 mm/s).
Marek [47] conducted a series of experiment investigations for caisson foundations in sand subjected to rapid uplift. The initial void ratio of Lubiatowo sand used in Marek (2020) experiments is 0.64, soil permeability coefficient is 1.54 × 10⁻³ m/s and aspect ratio L/D is 1.0. The pullout velocity combines 5, 8.5, 19, 30, 110 and 450 mm/s. The DPE curve presents a better prediction for differential pressure.
Hong [19] performed a series of 1 g tests to research the effects of drainage conditions on the pullout characteristics of caisson foundations in sand. The initial void ratio of sand used in Hong [19] tests is 0.826, soil permeability coefficient is 3 × 10⁻⁴ m/s and aspect ratio L/D is 1.0. The pullout velocity includes 0.1, 0.5, 2.5, 5, 10 and 20 mm/s. The DPE curve coincides well with Hong [19] tests with v = 0.1 mm/s and 0.5 mm/s. As the pullout velocity increases, the change in differential pressure is slight and mismatches the prediction results of DPE curve. The possible reason is that the scale effect of seepage cannot be satisfied in a 1g test, causing the impacts of differential pressure to not be amplified into the prototype.

4. Calculation Method of Uplift Capacity

4.1. The Uplift Capacity Mechanism of Suction Caisson

For a certain seabed, there are little differential pressure beneath caisson lid and tiny soil plug inside caisson when the pullout velocity is small [48,49,50]. As the pullout velocity increases, the differential pressure gradually accumulates and soil plug expands. Neglecting the interaction between caisson and plug, the overall bearing mode is shown in Figure 12a, including uplift loading Ftot, external skirt wall friction Ffri_out, gravity Wplug + Wcai and bottom force Fbottom, which can be expressed by:
F t o t = F f r i _ o u t + W p l u g + W c a i + F b o t t o m
Dividing the overall bearing mode into soil plug and suction caisson modules, their force modes are shown in Figure 12b,c, which can be expressed as:
p π D i 2 / 4 + F f r i _ i n = W p l u g + F b o t t o m
F V = F t o t W c a i = p π D i 2 / 4 + F f r i _ i n + F f r i _ o u t
where p is the differential pressure beneath the lid and can be calculated by Equation (10). Ffri_in is the internal skirt wall friction.
The calculations of internal and external skirt wall friction can be expressed as:
F f r i _ i n = 0 L σ v d z ( K t a n δ ) i ( π D i )
F f r i _ o u t = 0 L σ v d z ( K t a n δ ) o ( π D o )
where σ v is the vertical effective stress. Di and Do are the internal and external diameters of caisson, respectively.
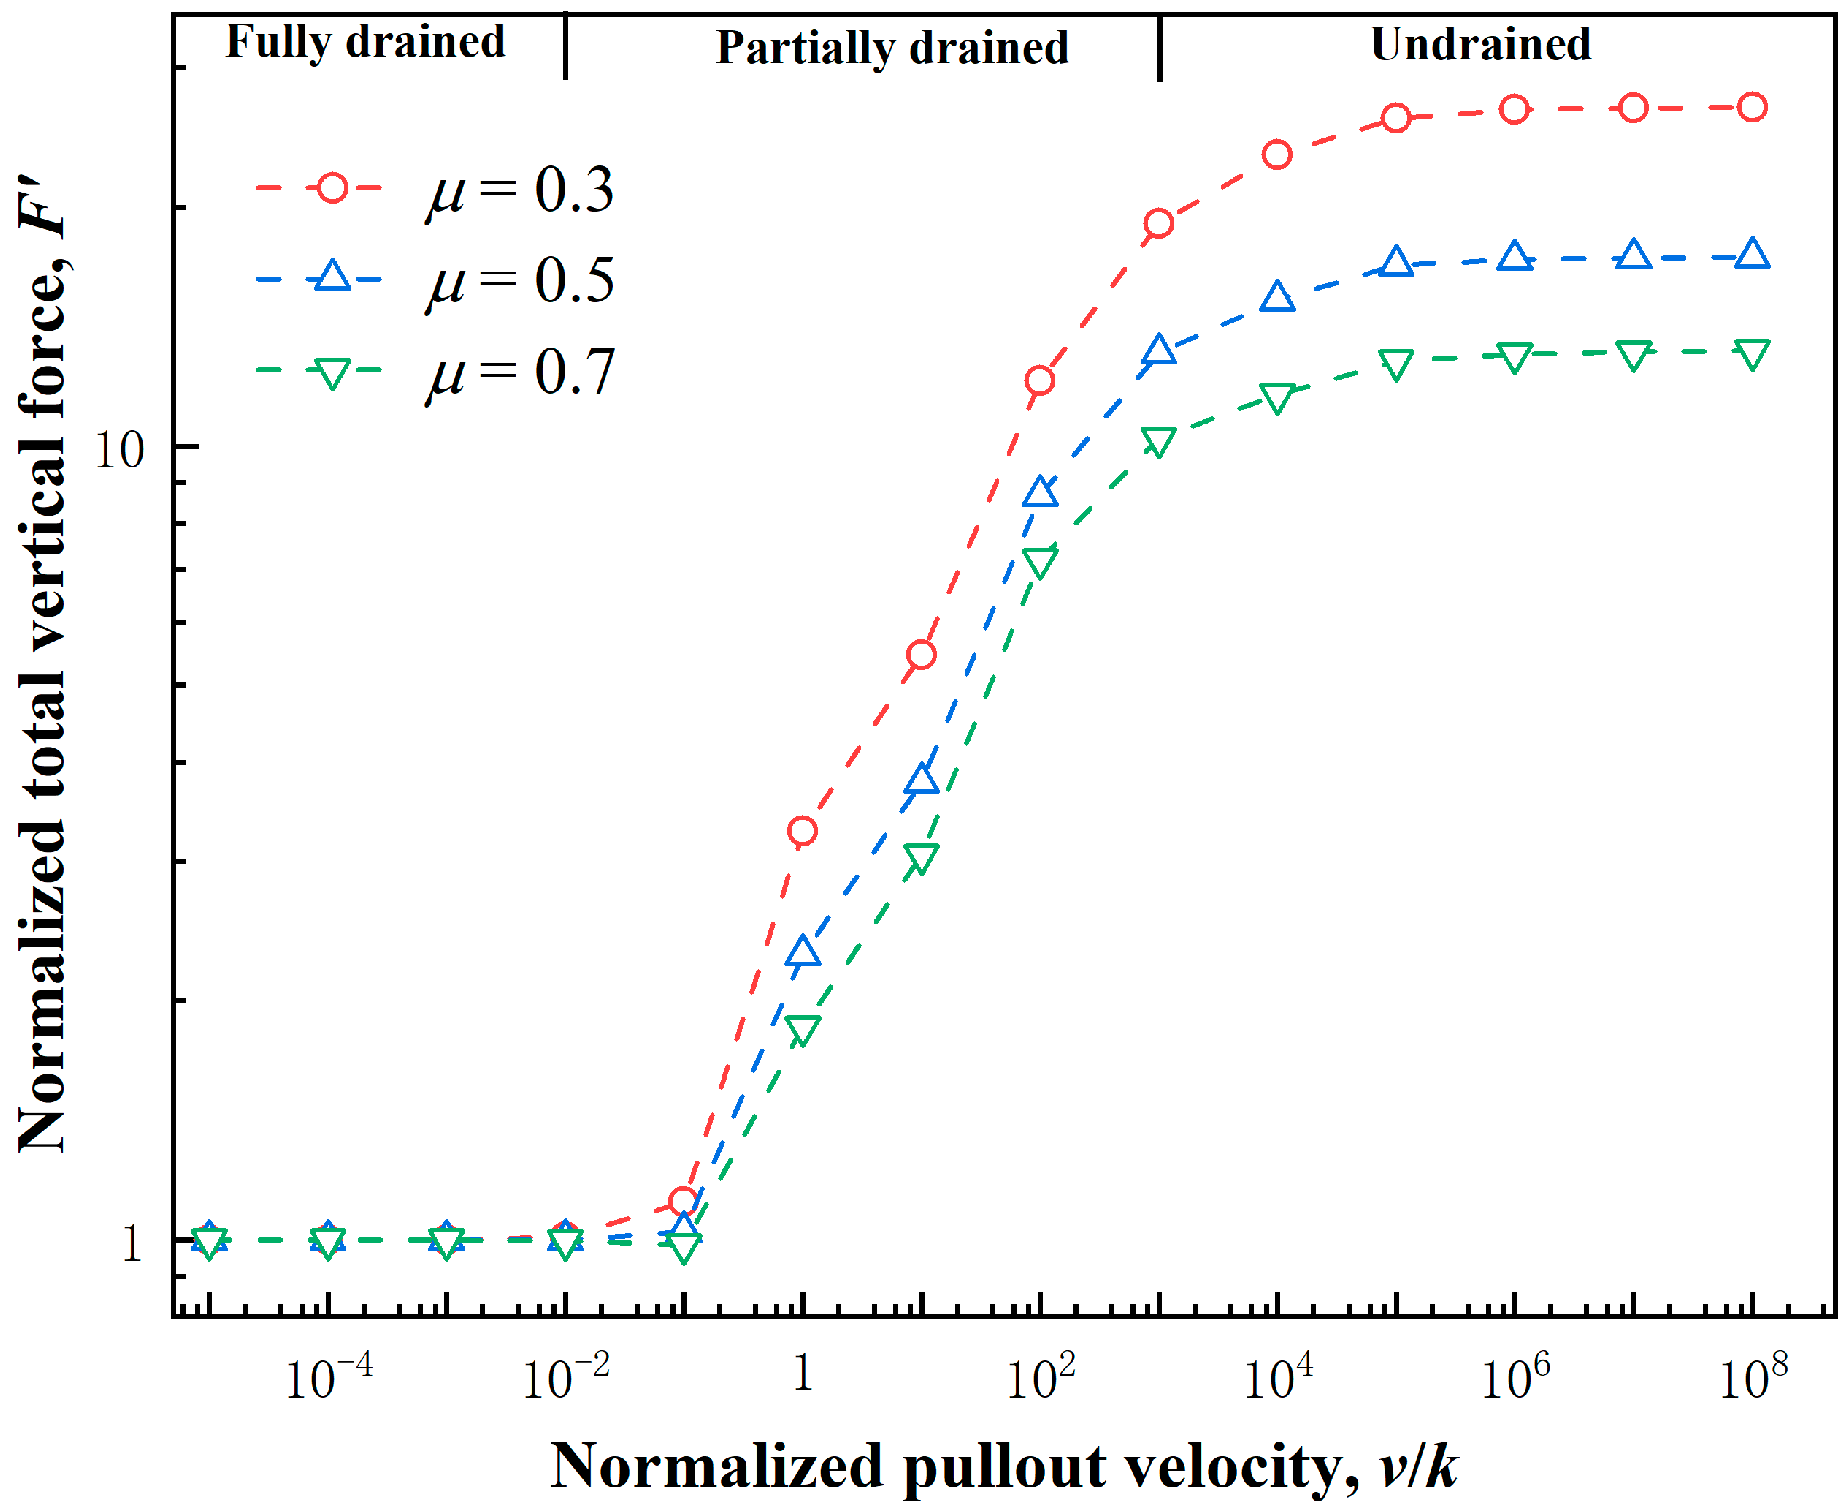
The differential pressure contributes to the uplift capacity of suction caisson, and the skirt wall friction is also changed due to the seepage field in soil domain. The uplift capacity FV is normalized by the fully drained uplift resistance, and the relationship between the normalized uplift capacity F V against the normalized pullout velocity v/k is shown in Figure 13. Under fully drained condition, the uplift capacity is mainly contributed by skirt wall friction. As the pullout velocity increases, the seepage effect is gradually prominent, and the differential pressure accumulates beneath the caisson lid. The uplift capacity can reach 10 times or more of the fully drained resistance, showing an undrained response. Further, with the decrease in interface friction coefficient of soil-structure, the uplift capacity gradually enlarges. Therefore, the design of suction caisson is conservative when the drainage condition is not considered [25].

4.2. Fully Drained Capacity

4.2.1. Soil Stress State

For the fully drained condition, the effects of differential pressure can be ignored, and the pivotal point is how to determine the soil effective stress acting on the skirt wall, namely σ v [20,21]. Extracting the soil effective stress around skirt wall along the depth (in Figure 14), the soil stress at the pullout state is different from in situ soil stress. One possible factor is that the soil around skirt is disturbed due to the relative movement of the soil-structure interface, leading to the variations of soil stress field.

4.2.2. Soil Stress Release Model

Houlsby [20,21] proposed an analytical model to reflect the stress reduction effects of seabed soil during caisson being pulled out. For caisson internal side, assuming that the internal skirt friction results in uniform reduction of soil vertical stress, it generates proportional decrease in soil-skirt normal contact stress [14]. Based on this assumption, the vertical soil stress on internal skirt is calculated by:
d σ v d z = γ σ v ( K t a n δ ) i ( π D ) i π D i 2 / 4 = γ 4 σ v ( K t a n δ ) i D i
0 L σ v d z = γ Z i 2 [ exp ( L Z i ) 1 + L Z i ]
Z i = D i 4 ( K t a n δ ) i
For caisson external side, it is supposed that there is a uniform soil stress release region within a certain range outside the skirt. Assuming that the stress release region is in a cylindrical soil ring outside the skirt, the outer diameter of release region is defined as Dm = mDo (m is the outer diameter coefficient), and the vertical soil stress on external skirt is calculated by:
d σ v d z = γ σ v ( K t a n δ ) o ( π D ) o π ( D m 2 D o 2 ) / 4 = γ 4 σ v ( K t a n δ ) o ( m 2 1 ) D o
0 L σ v d z = γ Z o 2 [ exp ( L Z o ) 1 + L Z o ]
Z o = D o ( m 2 1 ) 4 ( K t a n δ ) o
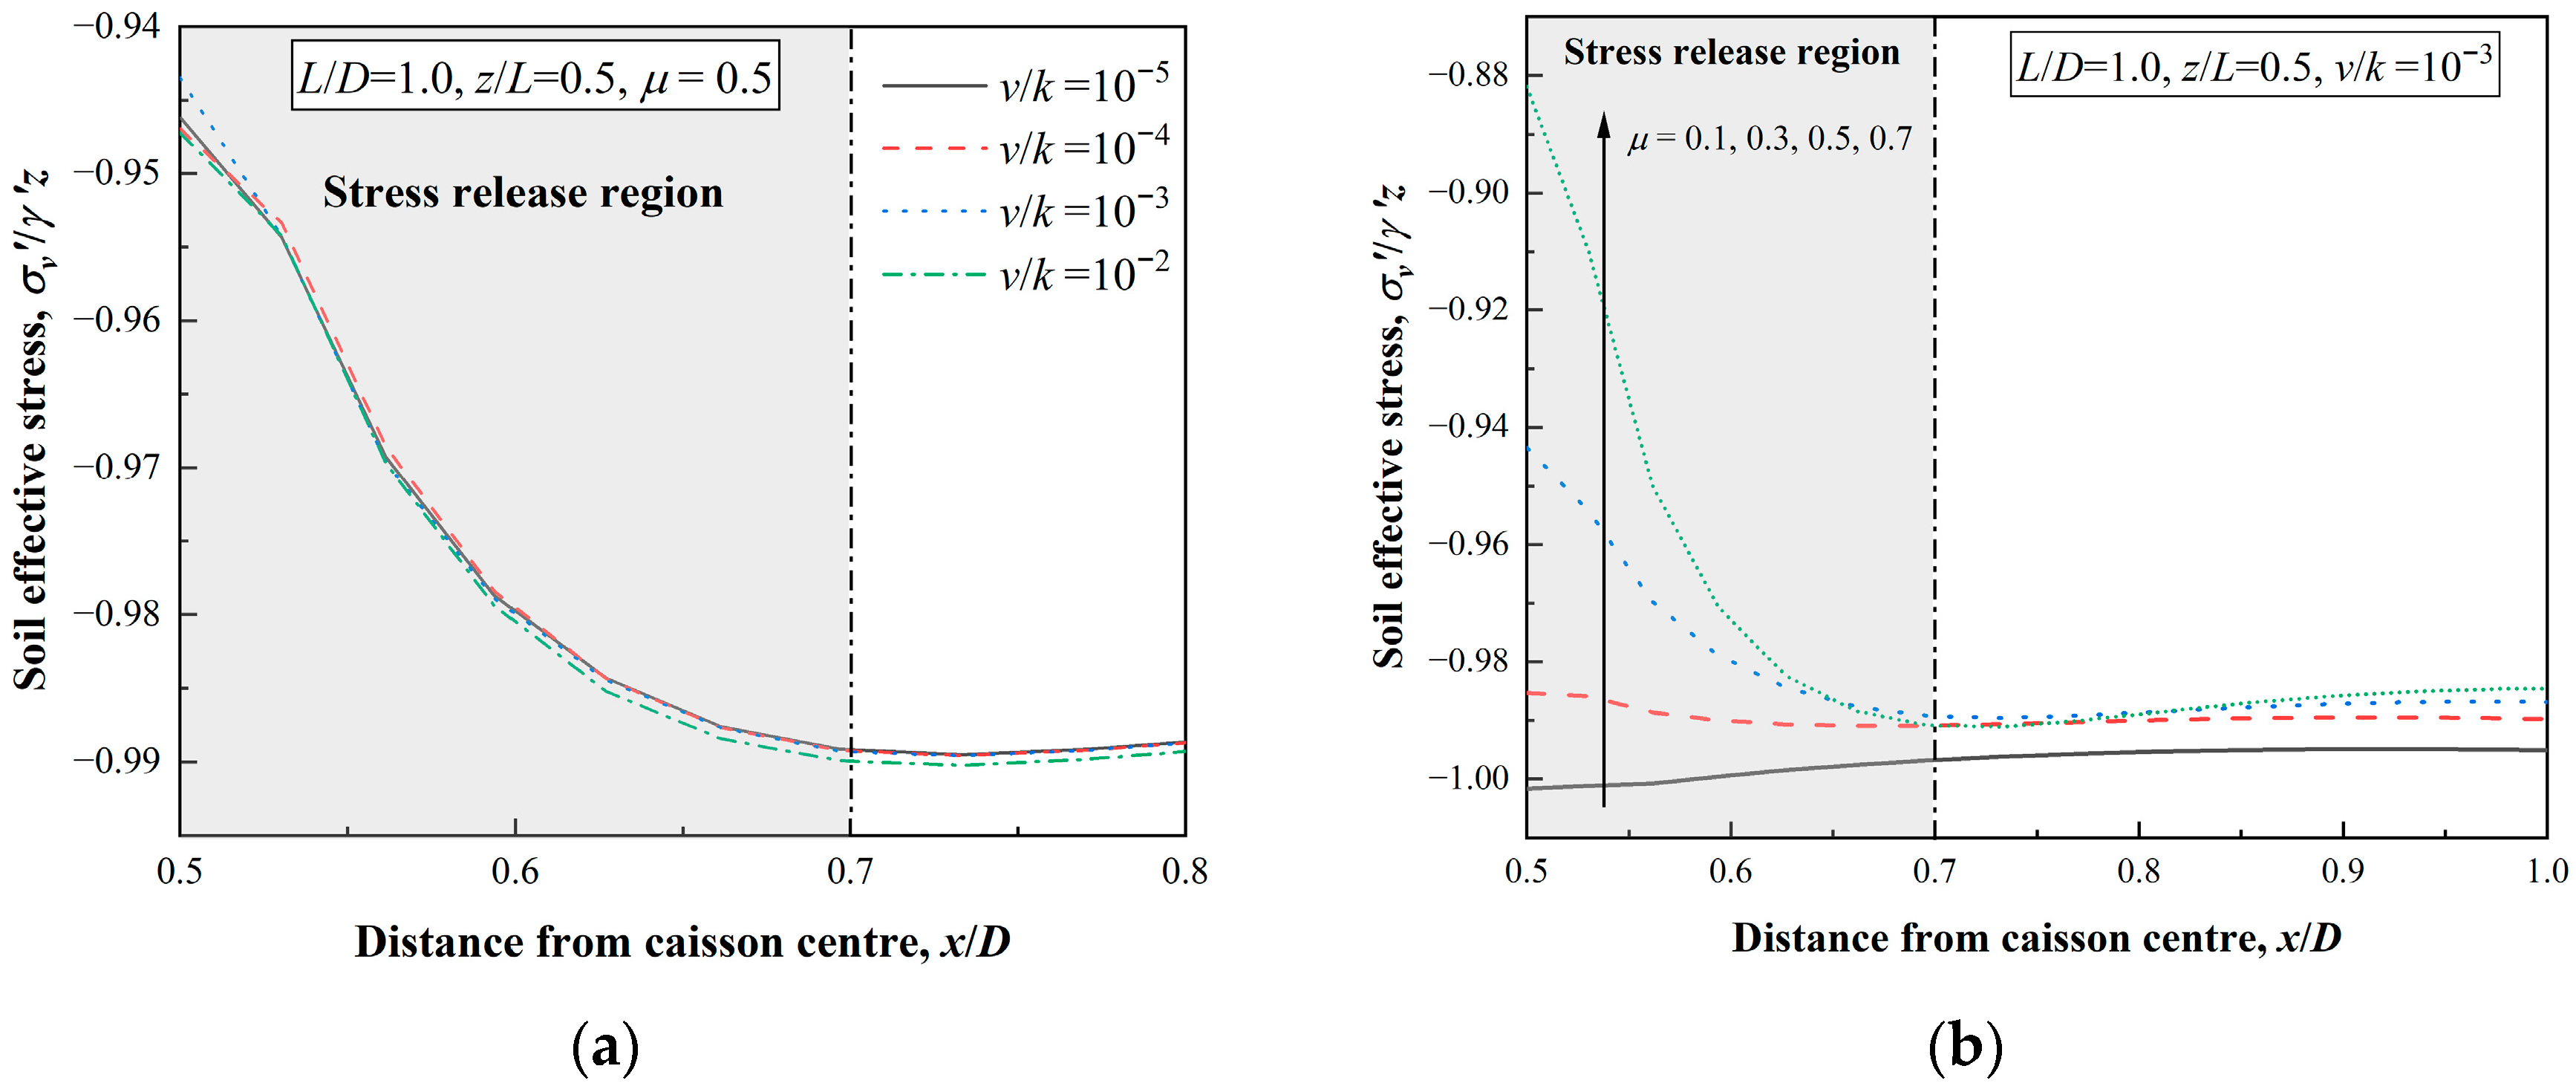
Considering the effects of normalized pullout velocity v/k and K t a n δ on the range of stress release region, the soil effective stress (caisson aspect ratio L/D = 1.0; soil depth z = 5.0 m) along the radial direction of caisson is shown in Figure 15. Under fully drained, the change in normalized pullout velocity v/k has negligible impacts on the soil stress state (in Figure 15a). As shown in Figure 15b, the reduction of soil stress increases with the friction coefficient of soil-structure, presenting that the degree of soil disturbance enlarges, but the range of soil release region does not change. Next, the soil stress presents an approximately linear attenuation within the stress release region. At x/D = 0.7 in Figure 15, it is found that the curve of soil effective stress turns and soil stress no longer decreases along radial direction, and the position of x/D = 0.7 is defined as the outer boundary of stress release region. Therefore, the outer diameter of stress release region is defined as Dm = 1.4Do (m = 1.4) for L/D = 1.0 & z = 5.0 m.
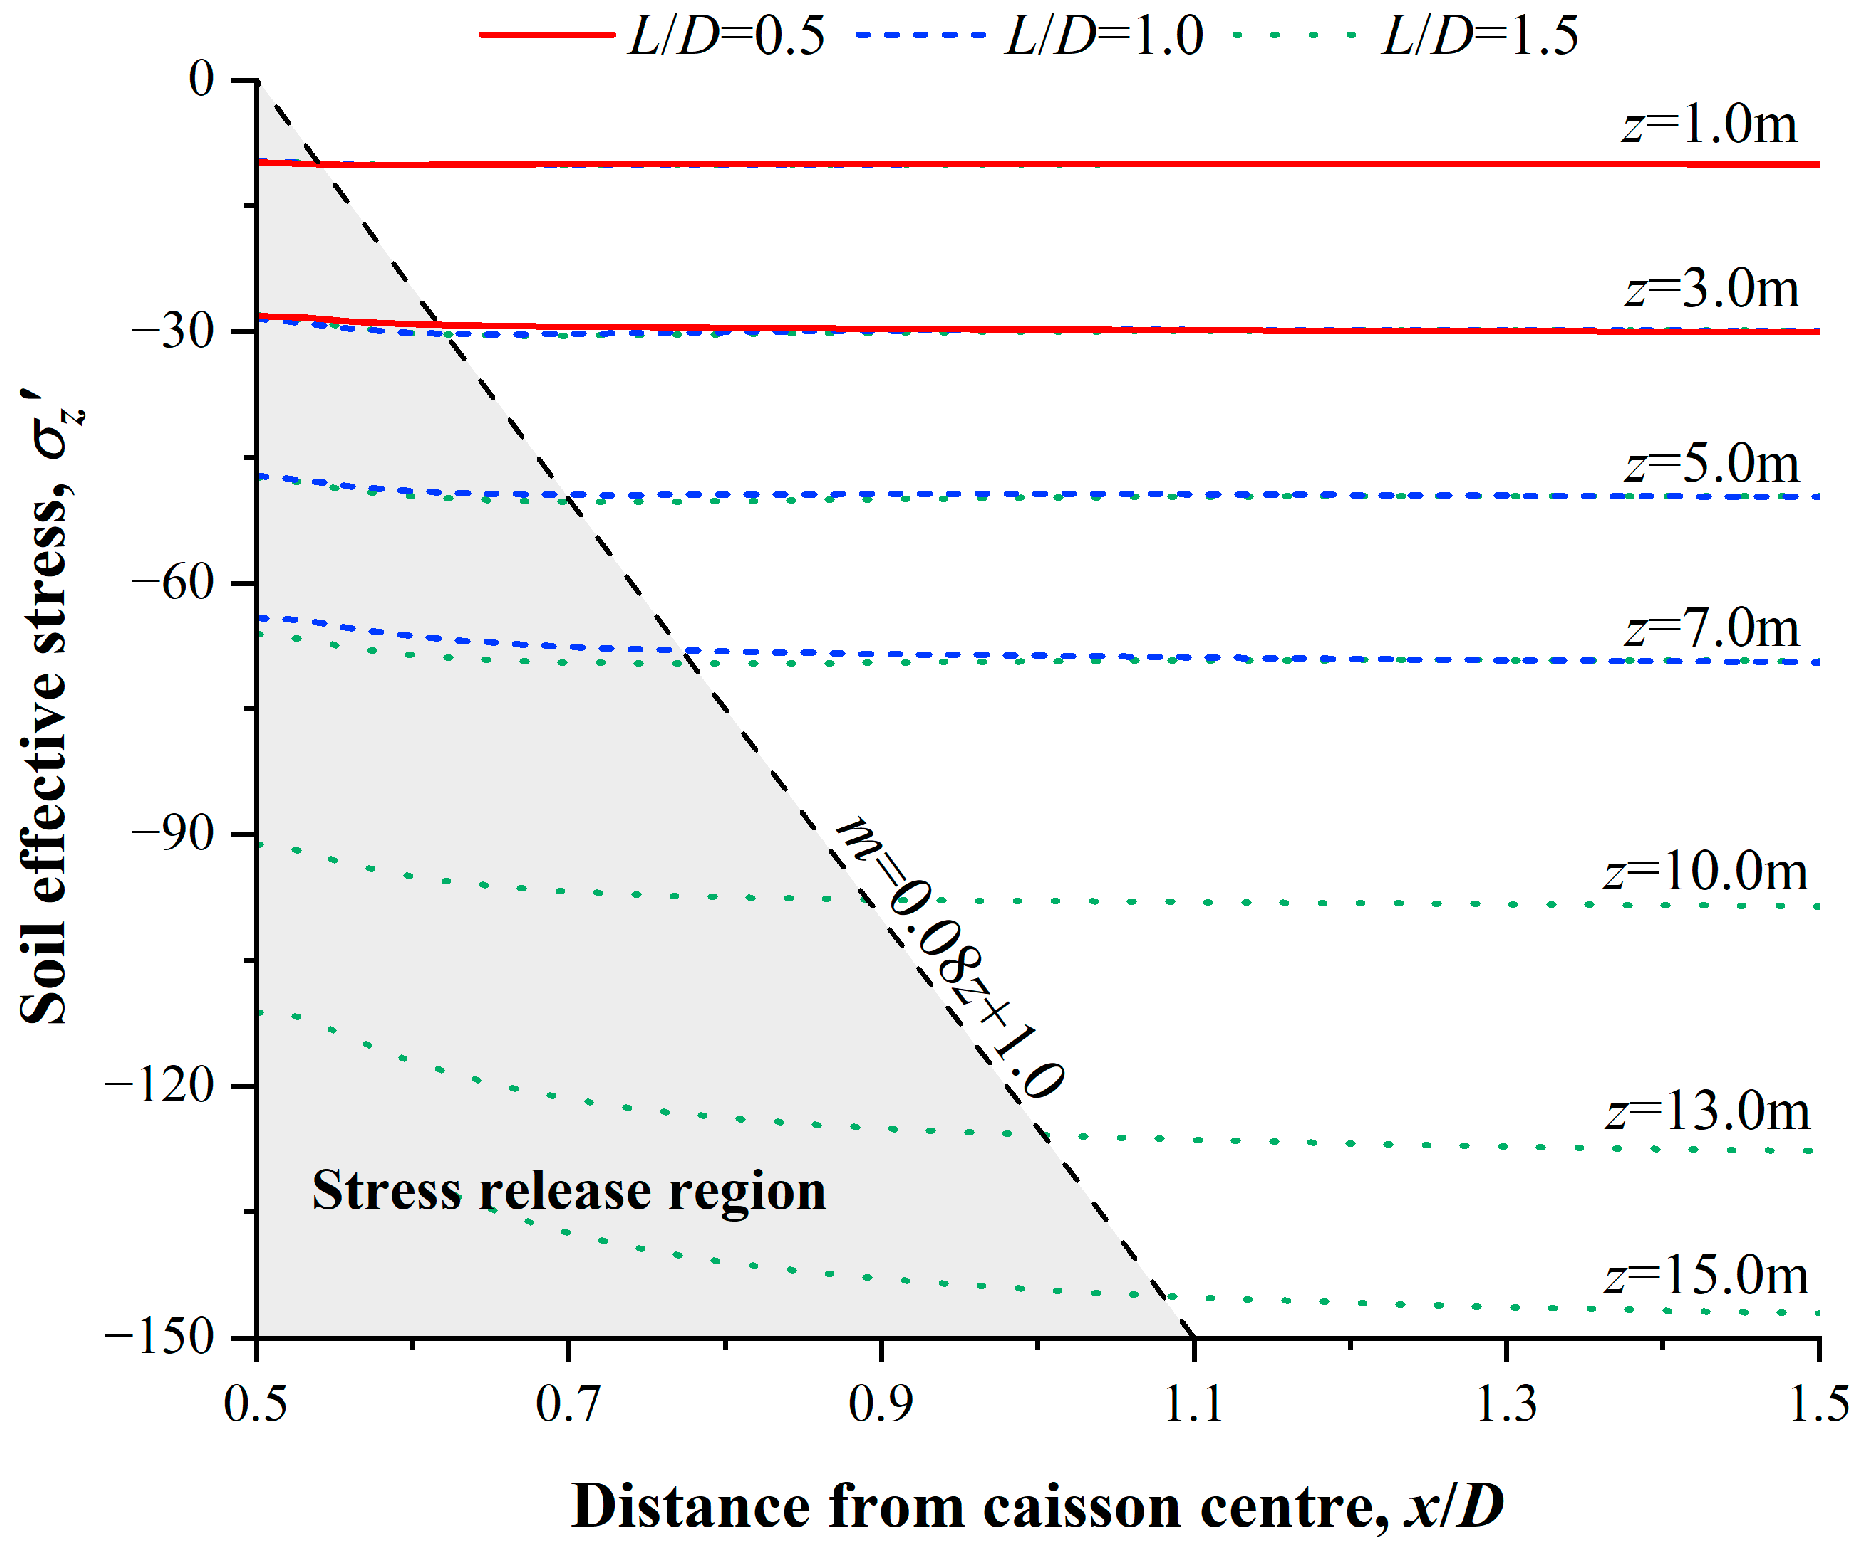
Figure 16 shows the soil effective stress for L/D = 0.5 and z = 1.0, 3.0 m, L/D = 1.0 and z = 1.0, 3.0, 5.0, 7.0 m and L/D = 1.5 and z = 1.0, 3.0, 5.0, 7.0, 10.0, 12.0, 14.0 m. Referring to the above method for defining the outer diameter, the gray area in Figure 16 is the stress release region. The outer diameter coefficient m is approximately linearly related to depth z, which is different from the assumption of Houlsby [21], and m is expressed as:
m = 0.08 z + 1.0
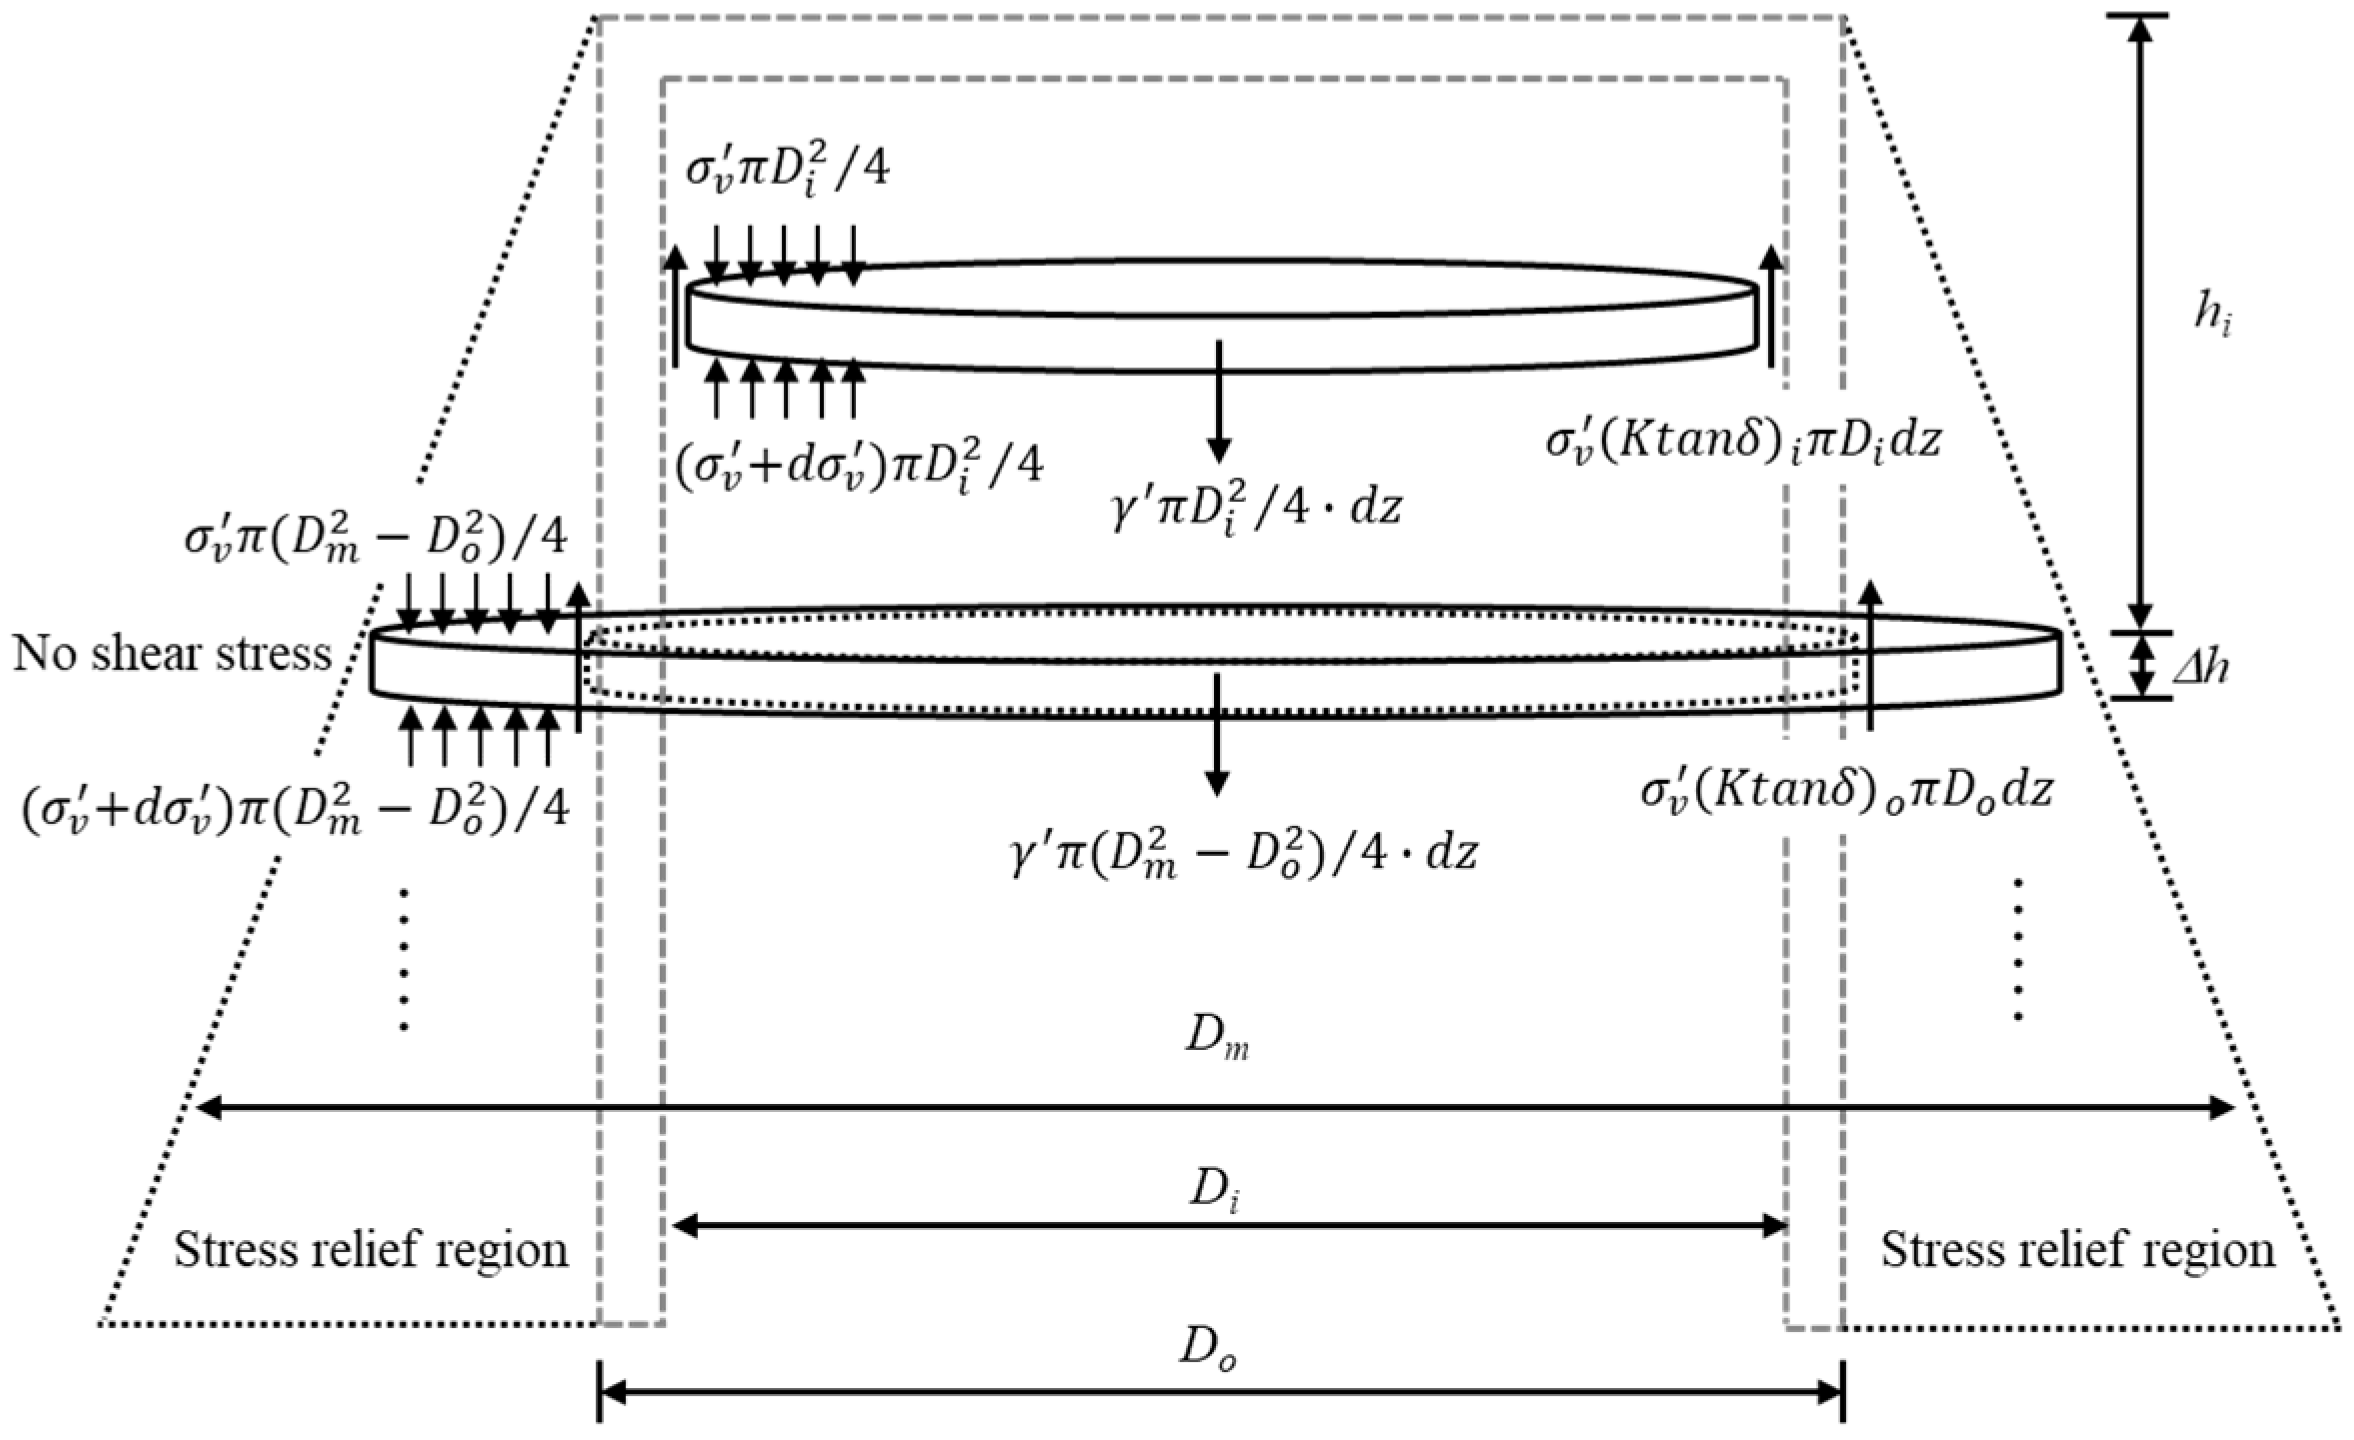
Combined with the previous analysis and the assumption of Houlsby [21], it is further supposed: (1) there is a stress disturbance zone that expands along the depth, and the outer diameter coefficient m is linearly related to depth z; and (2) the vertical earth pressure within the stress release region is calculated according to the soil stress at x = (Do + Dm)/2.
The diagram of stress release model proposed by this paper is shown in Figure 17. For the soil slice in the range z = hi to z = hi + Δhh is small enough, and m is regarded as a constant value in the range of Δh), its vertical force equilibrium inside the caisson remains the same (see Equations (16)~(18)), and that outside the caisson can be expressed as:
h i h i + Δ h σ v d z = γ Z o 2 [ exp ( h i + Δ h Z o ) exp ( h i Z o ) + Δ h Z o ]
where Zo and m can be referred to Equations (21) and (22), respectively.

4.2.3. Verification of Soil Stress Release Model

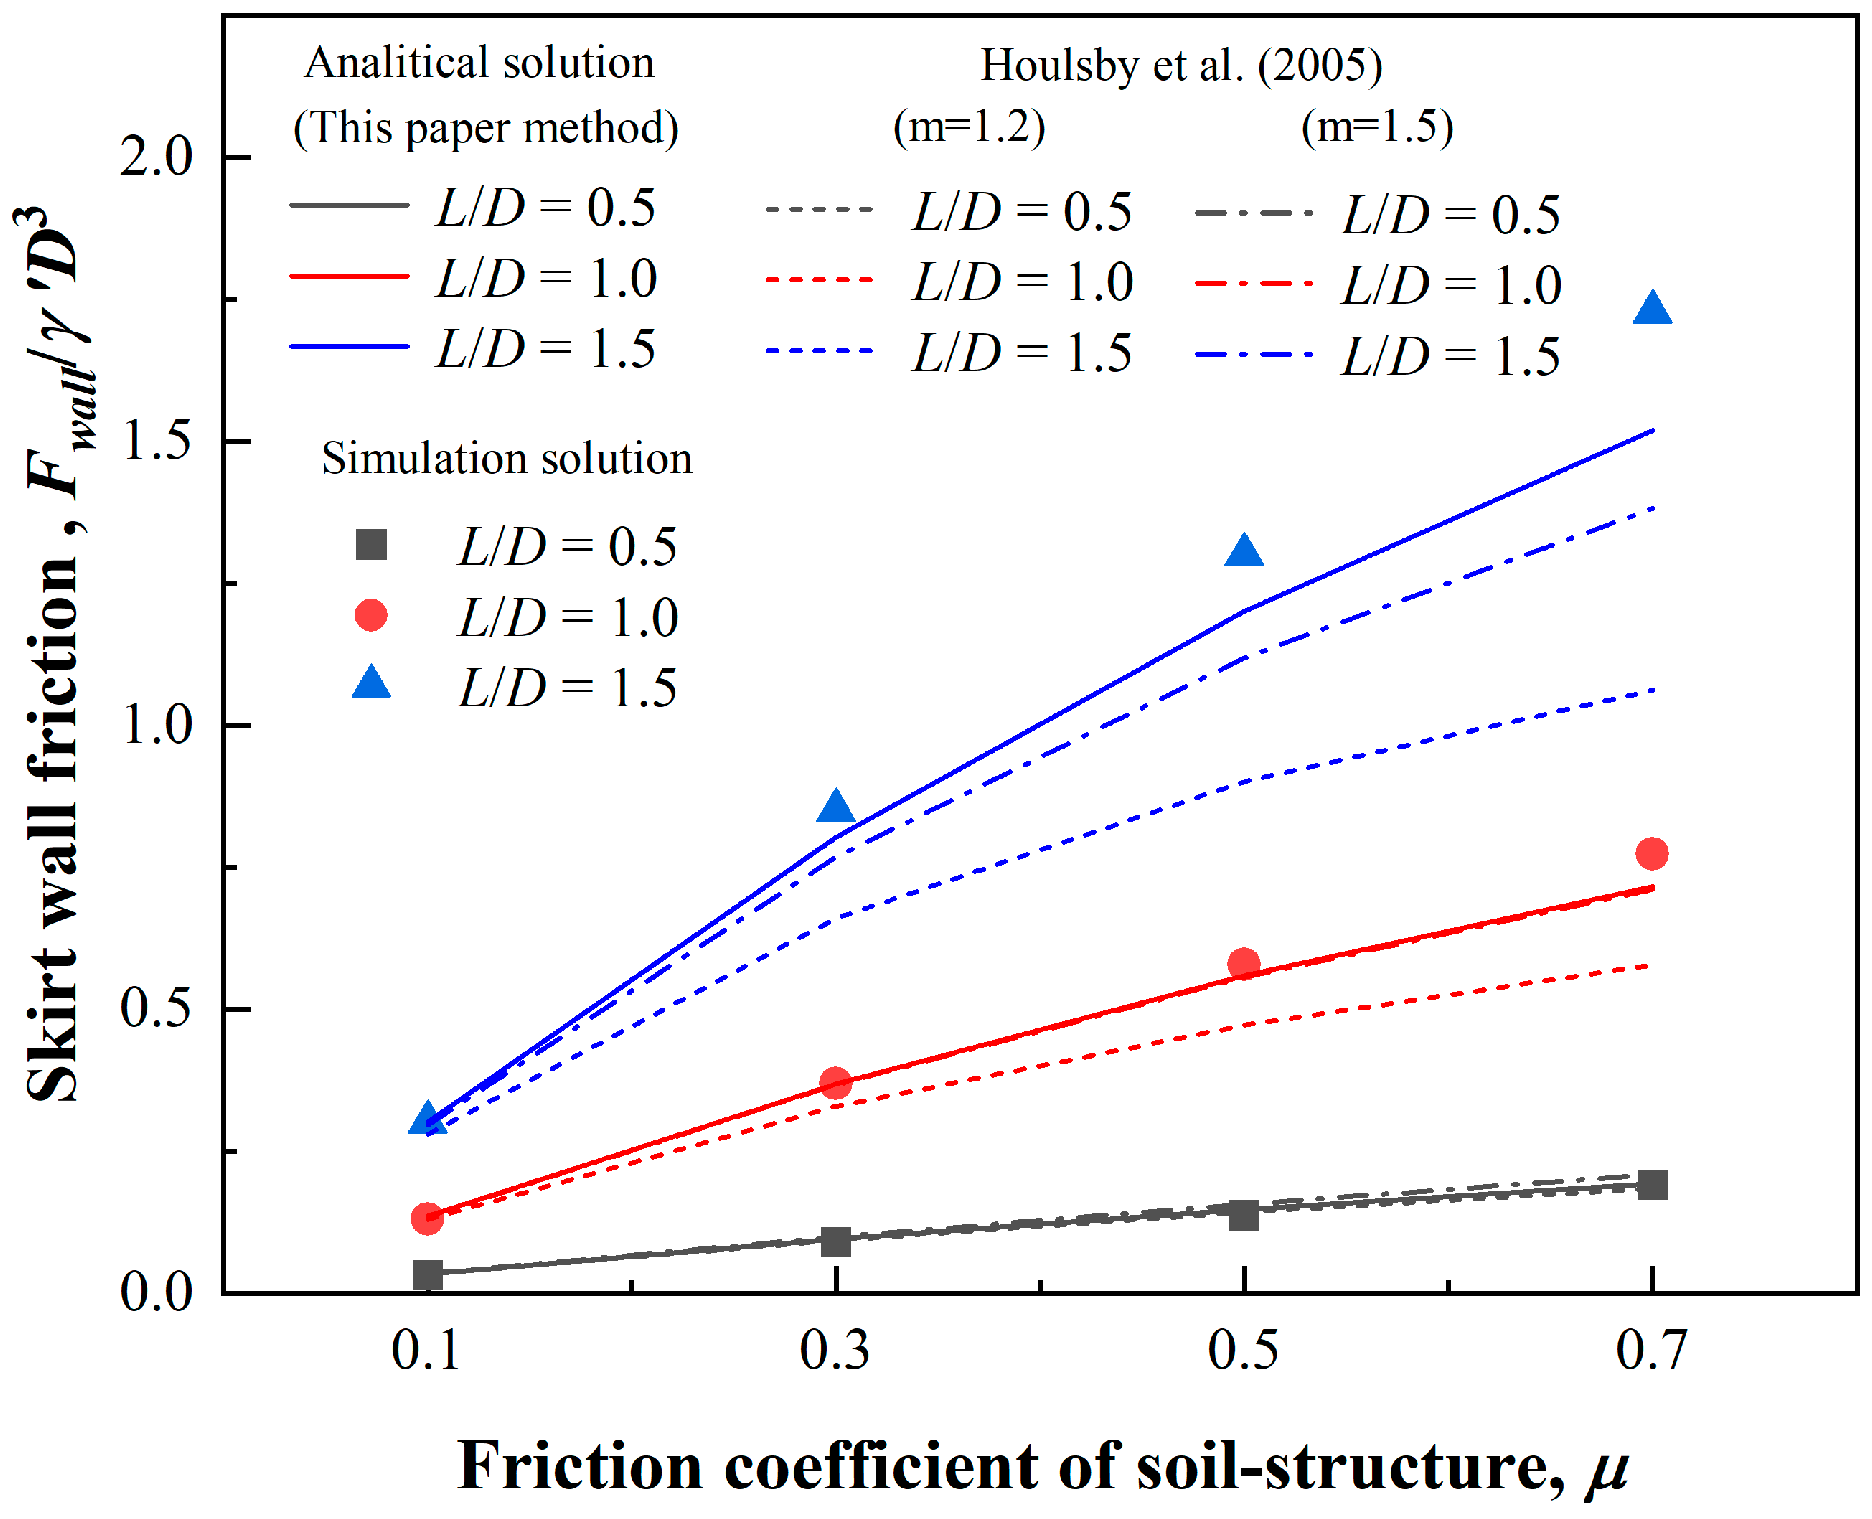
Combined with Equations (14)~(23), the analytical solution of total skirt wall friction is shown in Figure 18, which is compared with the simulation solution and analytical solution proposed by Houslby [21]. The analytical solution of this paper, which considers the variation of the stress release range along the depth, is closer to the simulation solution than adopting fixed outer diameter coefficient (m = 1.2, 1.5 in Figure 19) proposed by Houslby et al. (2005) [21]. Moreover, the analytical solution of Houslby et al. (2005) [21] increases with the value of m, so its accuracy depends on the determination of stress release range.
In Figure 18, the difference value between analytical solution of this paper and simulation solution obviously enlarges with the friction coefficient of soil-structure, and total skirt wall friction is underestimated by 12.06% at L/D = 1.5 & m = 0.7. Under the constraint of surrounding soil, the soil dilatancy caused by interface shear stress generates an increase in the normal effective stress. However, this dilatancy effect is affected by the interface friction angle between the soil and skirt wall. As the sand reaches the interface limit friction force, slippage first occurs at the interface between the soil grains and the skirt wall, and relative sliding and dilatancy no longer occurs inside the sand [14]. As the interface roughness of soil-structure increases, the soil dilatancy intensifies before the sand reaches the interface limit friction force, causing the increment of soil stress produced by soil dilatancy to also enlarge. The stress release model neglects the increase in soil stress caused by soil dilatancy, so the difference enlarges with the friction coefficient.
According to Section 2.2, Senders [22] conducted a group of centrifuge test under fully drained. The skirt wall friction measured in centrifuge test is compared with the analytical solution, which is summarized in Table 3. For the analytical solution of Houslby et al. (2005) [21], although the calculation results can be closer to the centrifuge test by adjusting the value of m, it is difficult to obtain the accurate value of m for every project, which brings difficulty to the engineering application.
In this paper, the outer diameter coefficient m is defined as a depth dependent parameter and its expression is given in Equation (22). The analytical solution of this paper method is 1478.27 kN with an error of −15.5% (in Table 3). Although the result is conservative, it facilitates the application of the project and improves the prediction accuracy of uplift capacity.

4.3. Undrained Capacity

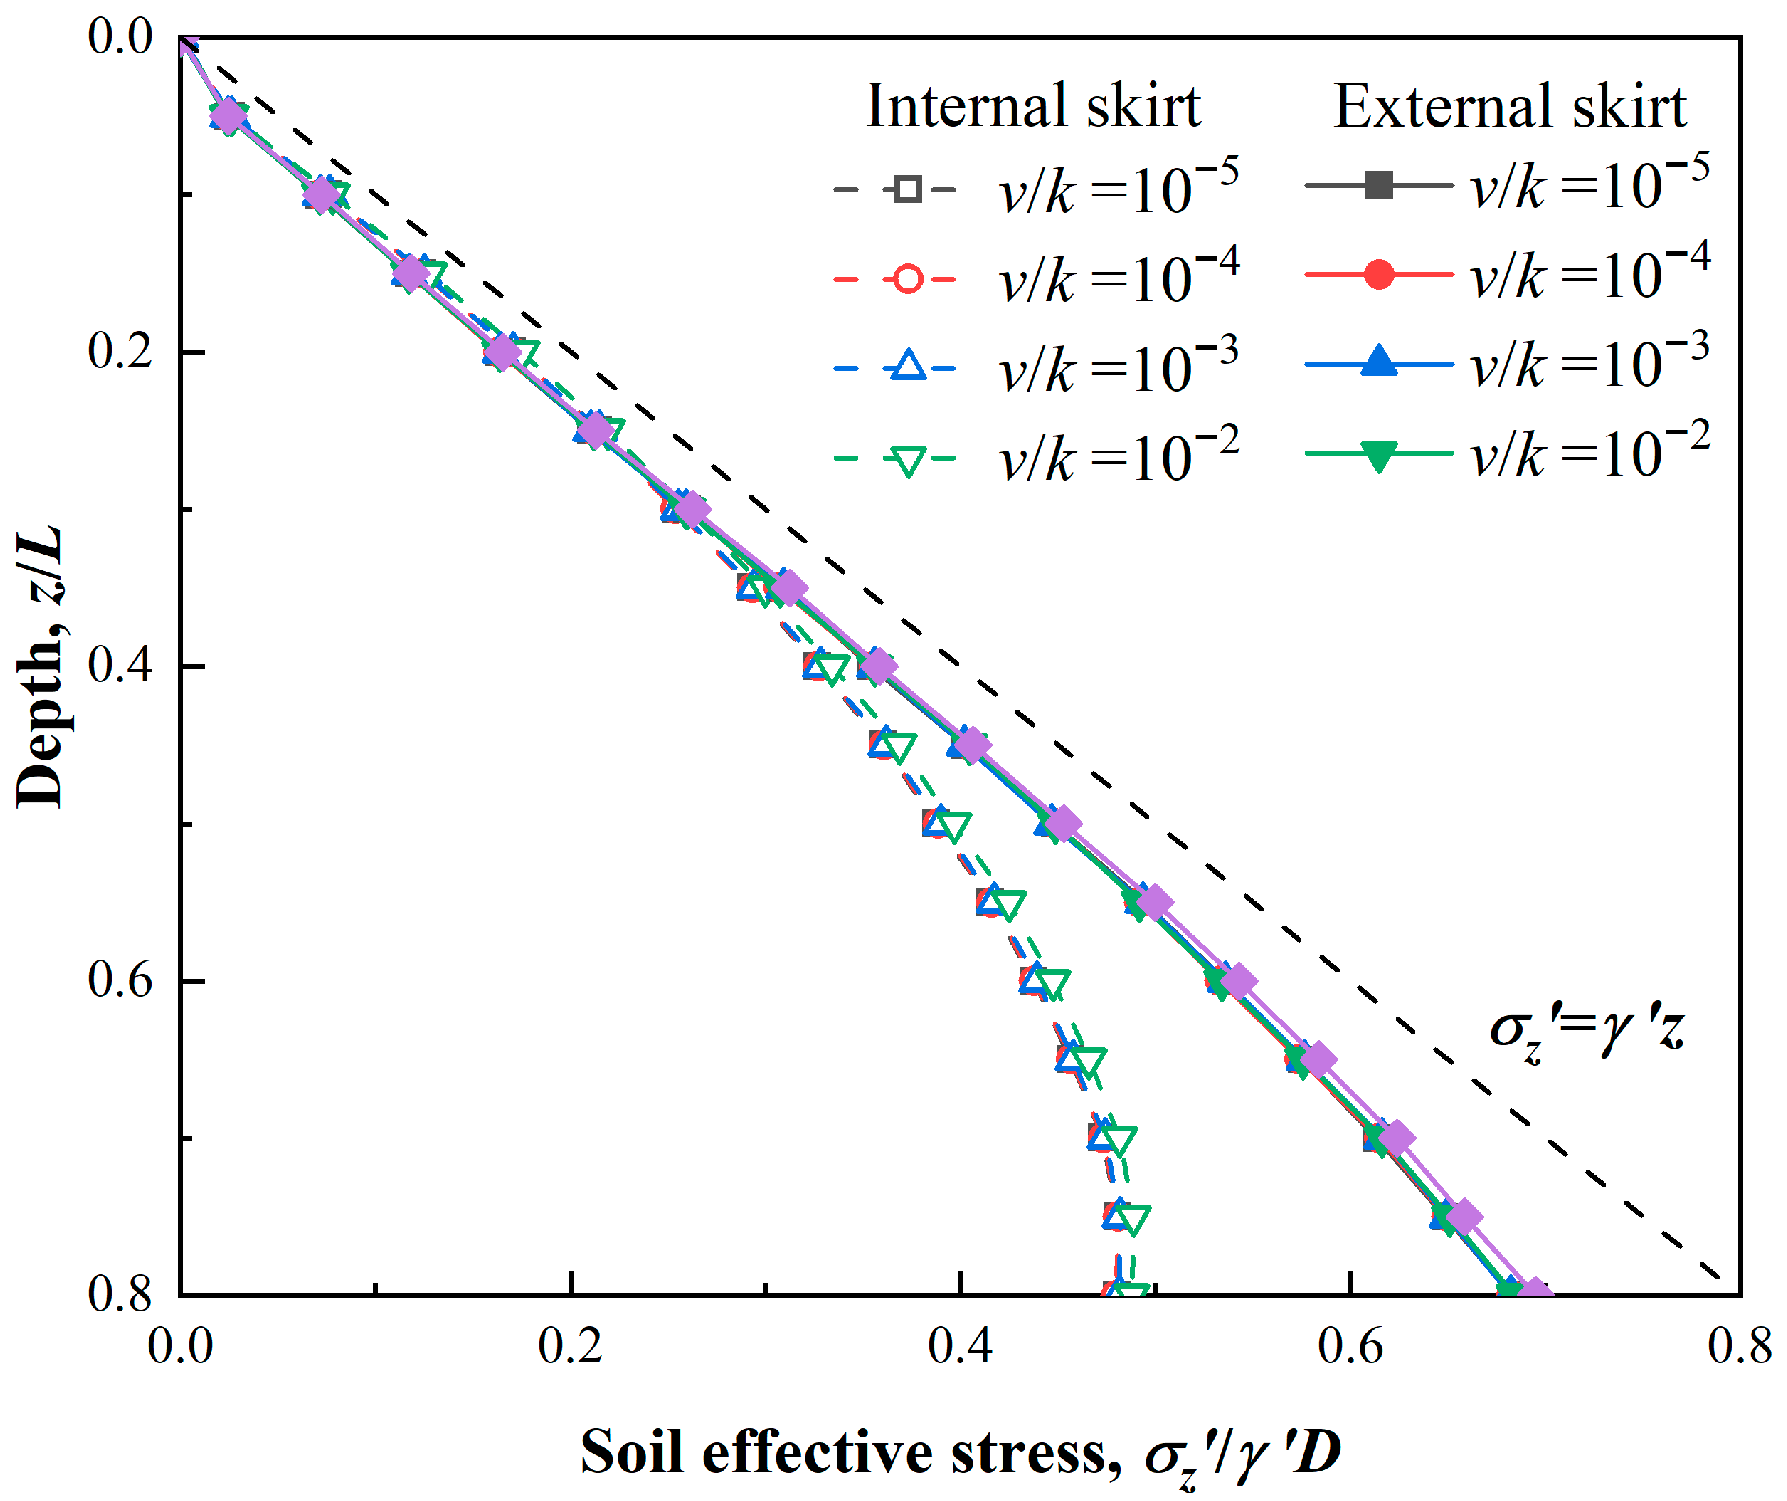
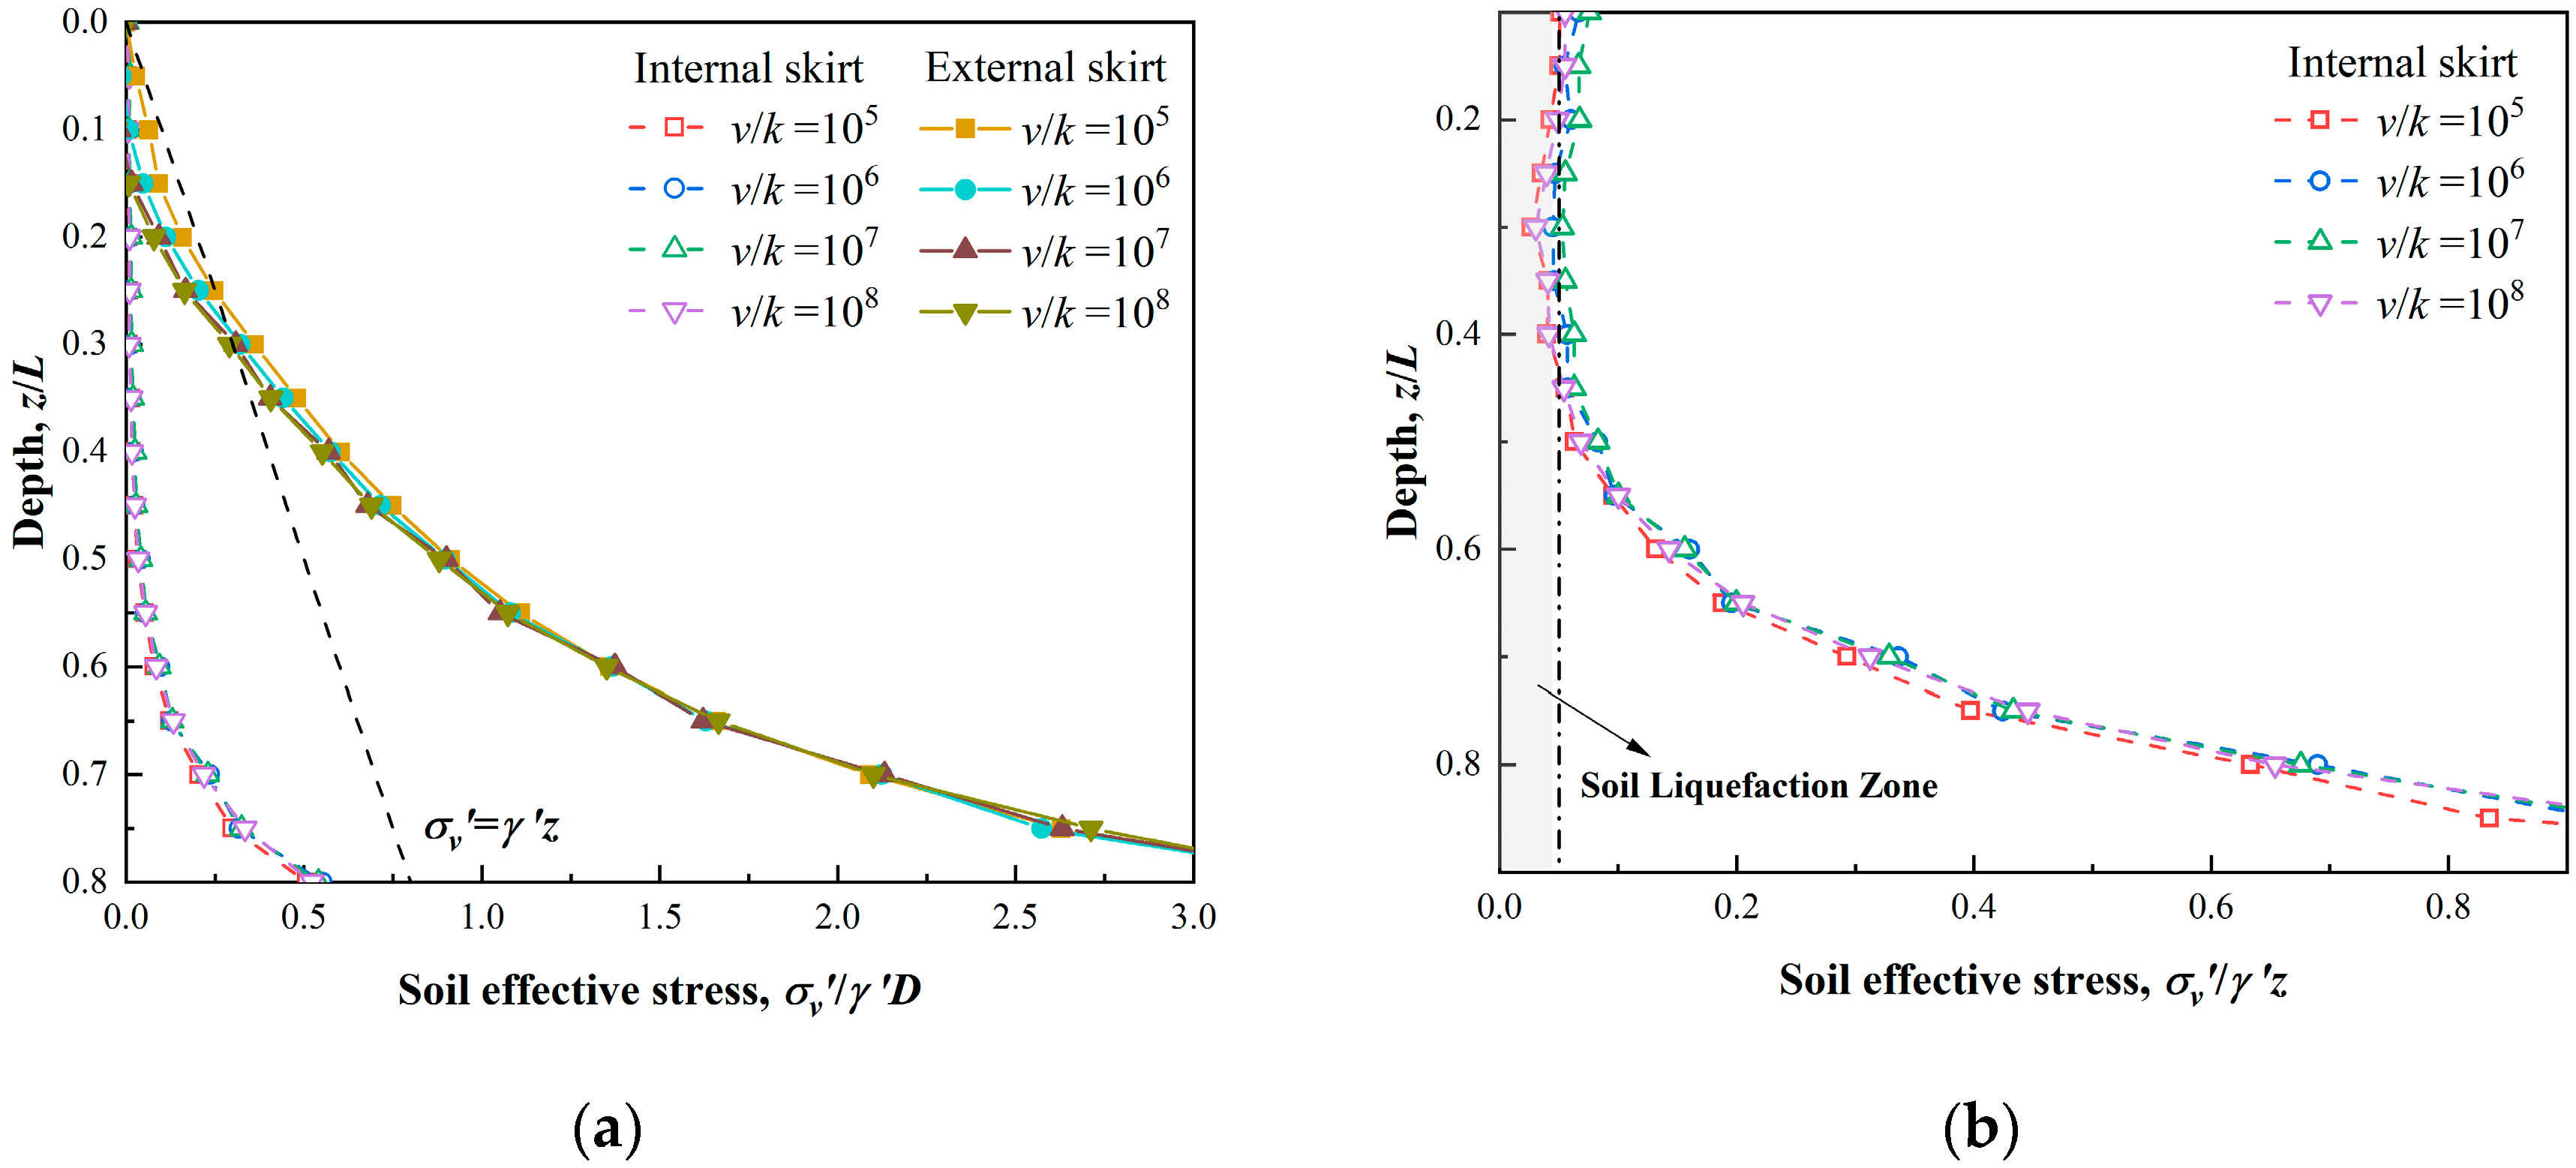
In sand, two cases need to be considered for tensile loading: slow (fully drained) loading and rapid (undrained) loading [27]. For fully drained condition, the calculation method of uplift capacity is introduced in Section 4.2. Then, for the undrained condition, the uplift resistance contributed by differential pressure enlarges the uplift capacity of suction caisson, but the soil effective stress inside and outside the caisson is also being changed. Figure 16 shows the soil effective stress around skirt wall along depth. The soil effective stress outside caisson is enhanced due to seepage, but the large pore pressure in the caisson leads to soil liquefaction. The reduction of soil effective stress is severe, resulting in nearly half of the soil (0~0.5L, Figure 19b) being liquefied (soil strength loss reaches to 95% [51,52]).
Assuming that the increase in outer skirt wall friction due to seepage force is the same as the decrease in inner that [23,24], a simplified calculation method of uplift capacity [27] is expressed as:
F V = p π D i 2 / 4 + γ h 2 2 [ ( K t a n δ ) i ( π D i ) + ( K t a n δ ) o ( π D o ) ]
which can be simplified as:
F V = p π D 2 / 4 + 2 π D γ h 2 2 K t a n δ
The comparison of total vertical force is shown in Table 4 for L/D = 1.0. The relative error is less than 5%, presenting good prediction accuracy of uplift capacity. Under undrained condition, the differential pressure has a pivotal effect on anti-pullout of caisson (see Figure 13), and its evaluation is the key to the calculation of suction bucket uplift capacity. The influence of friction coefficient is reflected in skirt wall friction, whose contribution is smaller than differential pressure. Therefore, the influence of friction coefficient on uplift capacity is insignificant in Table 4.

5. Conclusions

Considering the soil drainage conditions during caisson being pulled out, the fully drained, partially drained and undrained are divided. An equation is proposed to evaluate the development of differential pressure beneath the caisson lid, which can quantify its contribution to uplift capacity under undrained. Further, the calculation method considering soil stress release is proposed to calculate the uplift capacity under fully drained. Key conclusions from this study are summarized below:
(1) During caisson being pulled out, the differential pressure is positively associated with normalized pullout velocity v/k and aspect ratio L/D, but the impacts of lateral earth coefficient K and interface friction angle of soil-structure δ on seepage is not significant. When the normalized pullout velocity v/k is less than 10−1, the differential pressure is seldomly generated, presenting the fully drained response. The enlargement of differential pressure is limited and the soil inside caisson is closed to undrained condition for v/k > 104.
(2) Under fully drained condition, the uplift capacity of suction caisson is basically undertaken by skirt wall friction. The soil effective stress around skirt wall has been reduced due to the relative slippage between soil and caisson. On account of the stress reduction, a stress release model, considering the variation of stress release range along the depth, is proposed to calculate the skirt wall friction. Compared with the previous method of fixing the range of stress release region, it facilitates the application of the project and improves the prediction accuracy of uplift capacity.
(3) Under undrained condition, the uplift capacity of suction caisson can reach 10 times or more of the fully drained resistance due to the differential pressure acting on the caisson lid. However, the reduction of soil effective stress inside caisson is severe, and nearly half of the soil is liquefied. The differential pressure has a pivotal effect on anti-pullout of caisson, and its impact is calculated based on the proposed differential pressure equation. Then, a simplified method is proposed to calculate the uplift capacity, which is composed of skirt wall friction and differential pressure, showing good prediction accuracy.

Author Contributions

Conceptualization, C.X.; Methodology, M.X.; Software, M.X.; Validation, C.X.; Formal analysis, C.X. and H.J.; Investigation, D.S.; Data curation, C.X.; Writing—original draft, M.X.; Writing—review & editing, S.R. All authors have read and agreed to the published version of the manuscript.

Funding

This work was financed by the National Natural Science Foundation of China (51779220) and the Natural Science Foundation of Zhejiang Province (LR22E080005). The authors are grateful for the receipt of this funding.

Institutional Review Board Statement

Not applicable.

Informed Consent Statement

Not applicable.

Data Availability Statement

All relevant data is presented in the manuscript.

Conflicts of Interest

The authors declare no conflict of interest.

References

  1. Pérez-Collazo, C.; Greaves, D.; Iglesias, G. A review of combined wave and offshore wind energy. Renew. Sustain. Energy Rev. 2015, 42, 141–153. [Google Scholar] [CrossRef] [Green Version]
  2. Guo, Z.; Yu, L.Q.; Wang, L.Z.; Bhattacharya, S.; Nikitas, G.; Xing, Y. Model tests on the long-term dynamic performance of offshore wind turbines founded on monopiles in sand. J. Offshore Mech. Arct. Eng. 2015, 137, 041902. [Google Scholar] [CrossRef] [Green Version]
  3. Abhinav, K.A.; Saha, N. Stochastic response of jacket supported offshore wind turbines for varying soil parameters. Renew. Energy 2017, 101, 550–564. [Google Scholar] [CrossRef] [Green Version]
  4. Zhou, W.J.; Wang, L.Z.; Guo, Z.; Zhang, Y.R.; Rui, S.J. Numerical model for suction caisson under axial cyclic loadings. Ocean Eng. 2021, 240, 109956. [Google Scholar] [CrossRef]
  5. Wang, X.F.; Zeng, X.W.; Li, J.L. Vertical performance of suction bucket foundation for offshore wind turbines in sand. Ocean Eng. 2019, 180, 40–48. [Google Scholar] [CrossRef] [Green Version]
  6. Achmus, M.; Abdel-Rahman, K.; Schaefer, D.; Kuo, Y.S.; Chung, C.Y.; Tseng, Y.H. Capacity degradation method for driven steel piles under axial cyclic loadings. In Proceedings of the International Society of Offshore and Polar Engineers, San Francisco, CA, USA, 25–30 June 2017. [Google Scholar]
  7. Bhattacharya, S.; Nikitas, G.; Arany, L.; Nikitas, N. Soil-structure interactions (SSI) for offshore wind turbines. Eng. Technol. Ref. 2017, 24, 16. [Google Scholar]
  8. Guo, Z.; Wang, L.Z.; Yuan, F. Set-up and pullout mechanism of suction caisson in a soft clay seabed. Mar. Georesour. Geotechnol. 2014, 32, 135–154. [Google Scholar] [CrossRef]
  9. Iskander, M.; El-Gharbawy, S.; Olson, R. Performance of suction caissons in sand and clay. Can. Geotech. J. 2002, 39, 576–584. [Google Scholar] [CrossRef]
  10. Patel, S.K.; Singh, B. A parametric study on the vertical pullout capacity of suction caisson foundation in cohesive soil. Innov. Infrastruct. Solut. 2019, 4, 1. [Google Scholar] [CrossRef]
  11. Guo, Z.; Jeng, D.; Guo, W.; He, R. Simplified approximation for seepage effect on penetration resistance of suction caissons in sand. Ships Offshore Struct. 2017, 12, 980–990. [Google Scholar] [CrossRef]
  12. Mana, D.S.K.; Gourvenec, S.; Randolph, M.F. Numerical Modelling of Seepage beneath Skirted Foundations Subjected to Vertical Uplift. Comput. Geotech. 2014, 55, 150–157. [Google Scholar]
  13. Thieken, K.; Achmus, M.; Schroder, C. On the Behavior of Suction Buckets in Sand under Tensile Loads. Comput. Geotech. 2014, 60, 88–100. [Google Scholar] [CrossRef]
  14. Shen, K.; Zhang, Y.; Klinkvort, R.T.; Sturm, H.; Jostad, H.P.; Sivasithamparam, N.; Guo, Z. Numerical simulation of suction bucket under vertical tension loading. In Proceedings of the 8th International Conference on Offshore Site Investigation and Geotechnics, London, UK, 12–14 November 2017; Volume 1, pp. 488–497. [Google Scholar]
  15. Shen, K.; Zhang, Y.; Wang, K.; Wang, B.; Zhao, X. Effect of partial drainage on the pullout behaviour of a suction bucket foundation. Europ. J. Environ. Civil Eng. 2021, 26, 1–29. [Google Scholar]
  16. Wang, X.X.; Yang, Q.; Tang, X.W. Responses of suction buckets subjected to sustained vertical uplift. Mar. Georesources. Geotechnology 2020, 40, 36–51. [Google Scholar] [CrossRef]
  17. Moghaddam, F.; Imam, R. The seepage study of transient caisson pull-out in sand. Ocean Eng. 2022, 258, 111804. [Google Scholar]
  18. Vaitkunaite, E. Physical Modelling of Bucket Foundations Subjected to Axial Loading. Ph.D. Thesis, Aalborg University, Aalborg, Denmark, 2016. [Google Scholar]
  19. Hong, S.; Vicent, S.; Gu, K.Y.; Kim, S.R. Effect of drainage condition on the pullout characteristics of bucket foundations in sand. Ocean Eng. 2022, 260, 111994. [Google Scholar]
  20. Houlsby, G.T.; Byrne, B.W. Design procedures for installation of suction caissons in sand. Geotech. Eng. 2005, 158, 135–144. [Google Scholar] [CrossRef]
  21. Houlsby, G.T.; Kelly, R.B.; Byrne, B.W. The tensile capacity of suction caissons in sand under rapid loading. In Proceedings of the International Symposium on Frontiers in Offshore Geomechanics, Perth, Australia, 19–21 September 2005; pp. 405–410. [Google Scholar] [CrossRef]
  22. Senders, M. Suction Caissons in Sand as Tripod Foundations for Offshore Wind Turbines. Ph.D. Thesis, The University of Western Australia, Perth, Australia, 2008. [Google Scholar]
  23. Vicent, S.; Kim, S.R.; Bong, T. Effect of loading rate on the pullout capacity of offshore bucket foundations in sand. Ocean Eng. 2020, 210, 107427. [Google Scholar]
  24. Vicent, S.; Hong, S.; Bong, T.; Kim, S.R. Effects of embedment depth on the pull-out capacity of bucket foundations in sand. Ocean Eng. 2021, 237, 109643. [Google Scholar]
  25. DNV. Support Structures for Wind Turbines (DNVGL-ST-0126); Det Norske Veritas: Bærum, Norway, 2018. [Google Scholar]
  26. ISO 19901-4:2003; Specific Requirements for Offshore Structures, Part 4-Geotechnical and Foundation Design Considerations. International Organisation for Standardisation: Geneva, Switzerland, 2014.
  27. OWA. Suction Installed Caisson Foundations Design Guidelines for Offshore Wind. Offshore Wind Accelerator. 2019. Available online: https://www.engins.org/event/owa-suction-installed-caisson-foundations-design-guidelines-for-offshore-wind/ (accessed on 19 December 2022).
  28. Guo, Z.; Jeng, D.S.; Guo, W.; Wang, L.Z. Failure mode and capacity of suction caisson under inclined short-term static and one-way cyclic loadings. Mar. Georesour. Geotechnol. 2018, 36, 52–63. [Google Scholar] [CrossRef] [Green Version]
  29. Systemes, Dassault, Abaqus 2017 Documentation; Dassault Systèmes Simulia Corp: Providence, RI, USA, 2017.
  30. Cao, J.; Phillips, R.; Popescu, R. Numerical analysis of the behavior of Suction Caissons in clay. Int. J. Offshore Polar Eng. 2003, 13, 154–159. [Google Scholar]
  31. Dafalias, Y.F.; Manzari, M.T. Simple plasticity sand model accounting for fabric change effects. J. Eng. Mech. 2004, 130, 622–634. [Google Scholar] [CrossRef]
  32. Dafalias, Y.F.; Papadimitriou, A.G.; Li, X.S. Sand plasticity model accounting for inherent fabric anisotropy. J. Eng. Mech. 2004, 130, 1319–1333. [Google Scholar] [CrossRef]
  33. Dafalias, Y.F.; Taiebat, M. SANISAND-Z: Zero elastic range sand plasticity model. Geotechnique 2016, 66, 999–1013. [Google Scholar] [CrossRef]
  34. Tran, M.N. Installation of Suction Caissons in Dense Sand and the Influence of Silt and Cemented Layers. Ph.D. Thesis, The University of Sydney, Sydney, Australia, 2005. [Google Scholar]
  35. Byrne, B.W.; Houlsby, G.T. Experimental investigations of the response of suction caissons to transient vertical loading. J. Geotech. Geoenviron. Eng. 2002, 128, 926–939. [Google Scholar]
  36. Byrne, B.W.; Houlsby, G.T. Experimental investigations of the response of suction caissons to transient combined loading. J. Geotech. Geoenviron. Eng. 2004, 130, 240–253. [Google Scholar]
  37. Zhu, B.; Dai, J.L.; Kong, D.Q.; Feng, L.Y.; Chen, Y.M. Centrifuge modelling of uplift response of suction caisson groups in soft clay. Can. Geotech. J. 2020, 57, 1294–1303. [Google Scholar] [CrossRef]
  38. Blaker, Ø.; Andersen, K.H. Shear strength of dense to very dense Dogger Bank sand. In Frontiers in Offshore Geotechnics III, Proceedings of the 3rd International Symposium on Frontiers in Offshore Geotechnics, Oslo, Norway, 10–12 June 2015; Meyer, V., Ed.; CRC Press: London, UK, 2015; pp. 1167–1172. [Google Scholar]
  39. Blaker, Ø.; Andersen, K.H. Cyclic properties of dense to very dense silica sand. Soils Found. 2019, 59, 982–1000. [Google Scholar]
  40. Cotterill, C.; Dove, D.; Long, D.; James, L.; Duffy, C.; Mulley, S.; Forsberg, C.F.; Tjelta, T.I. Dogger Bank-A Geo Challenge. In Proceedings of the Seventh International Conference, London, UK, 12–14 September 2012. [Google Scholar]
  41. Forchheimer, P. Wasserbewegung durch boden. Z. Ver. Deutsch, Ing. 1901, 45, 1782–1788. [Google Scholar]
  42. Chai, Z.; Shi, B.; Lu, J.; Guo, Z. Non-Darcy flow in disordered porous media: A lattice Boltzmann study. Comput. Fluids 2010, 39, 2069–2077. [Google Scholar] [CrossRef]
  43. Sharqawy, M.H.; Lienhard, J.H.; Zubair, S.M. Thermophysical properties of seawater: A review of existing correlations and data. Desal. Water Treat. 2010, 16, 354–380. [Google Scholar]
  44. Grossmann, S.; Lohse, D. Scaling in thermal convection: A unifying theory. J. Fluid Mech. 2000, 407, 27–56. [Google Scholar] [CrossRef]
  45. Deng, W.; Carter, J.P. A theoretical study of the vertical uplift capacity of suction caissons. Int. J. Offshore Polar Eng. 2002, 12, 89–97. [Google Scholar]
  46. Han, F.; Ganju, E.; Salgado, R.; Prezzi, M. Effects of Interface Roughness, Particle Geometry, and Gradation on the Sand–Steel Interface Friction Angle. J. Geotech. Geoenvironmental Eng. 2018, 144, 04018096. [Google Scholar]
  47. Marek, K. Experimental investigation of skirted foundation in sand subjected to rapid uplift. Arch. Hydro-Eng. Environ. Mech. 2020, 67, 17–34. [Google Scholar]
  48. Sgardeli, C.G. A Finite Element Analysis of the Pullout Capacity of Suction Caissons in Clay. Ph.D. Thesis, Massachusetts Institute of Technology, Cambridge, MA, USA, 2009. [Google Scholar]
  49. Koh, K.X.; Wang, D.; Hossain, M.S. Numerical simulation of caisson installation and dissipation in kaolin clay and calcareous silt. Bull. Eng. Geol. Environ. 2017, 77, 953–962. [Google Scholar]
  50. Sun, L.; Qi, Y.; Feng, X.; Liu, Z. Tensile capacity of offshore bucket foundations in clay. Ocean Eng. 2020, 197, 106893. [Google Scholar]
  51. Idriss, I.M.; Boulanger, R.W. 2nd Ishihara lecture: SPT-and CPT-Based relationships for the residual shear strength of liquefied soils. Soil Dyn. Earthq. Eng. 2015, 68, 57–68. [Google Scholar]
  52. Guo, Z.; Jeng, D.S.; Zhao, H.Y.; Guo, W.; Wang, L.Z. Effect of seepage flow on sediment incipient motion around a free spanning pipeline. Coast. Eng. 2019, 143, 50–62. [Google Scholar]
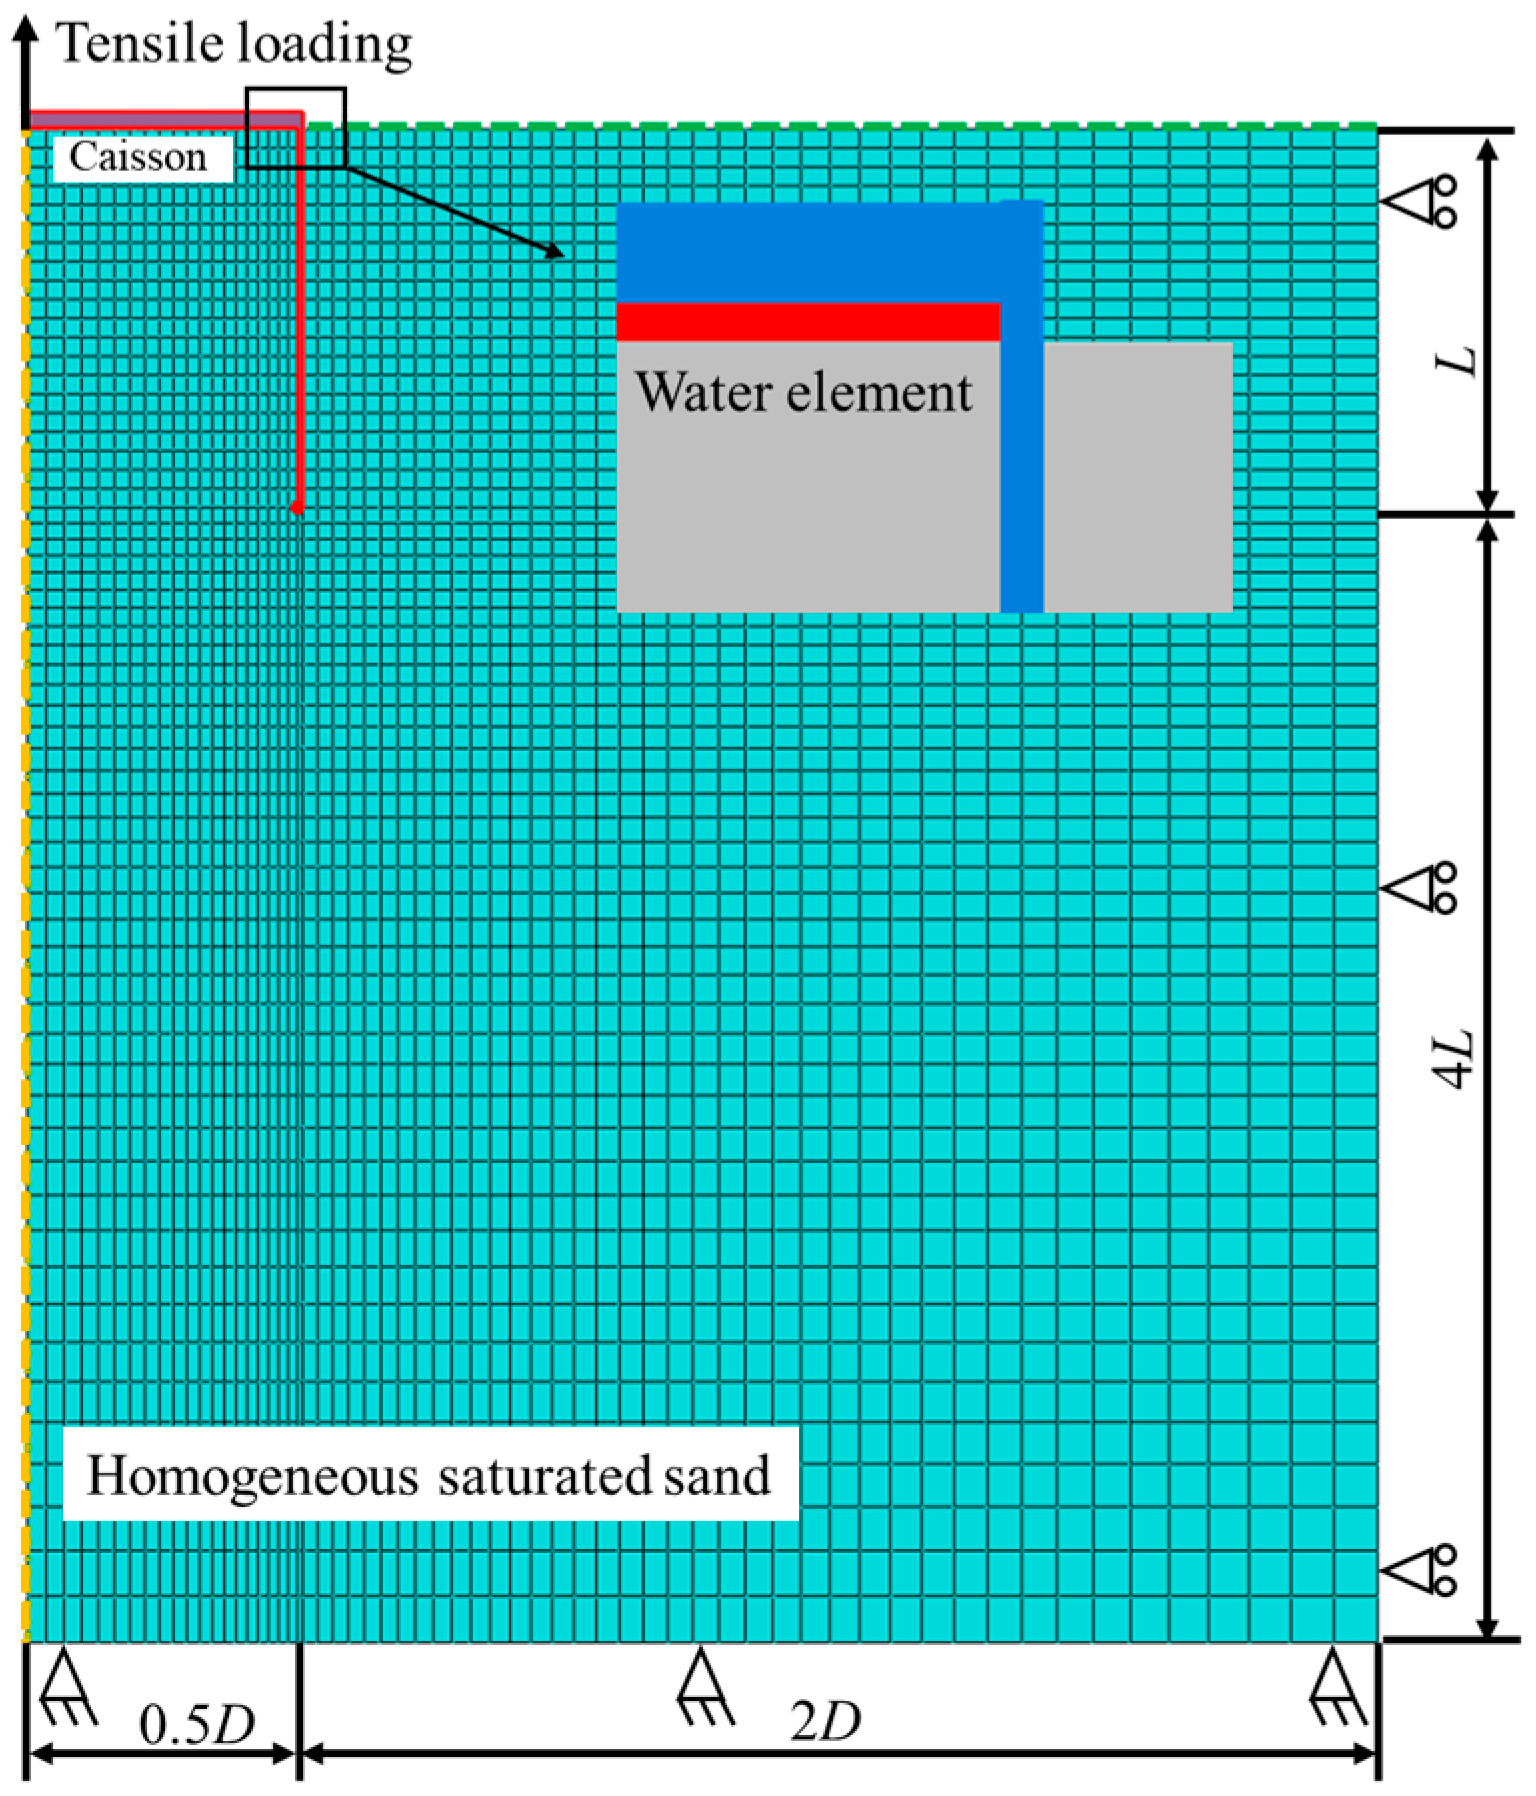
Figure 1. Finite element model.
Sustainability 15 00454 g001
Figure 2. Comparisons between simulations and centrifuge tests: (a) differential pressure; (b) skirt wall friction; (c) total vertical force; and (d) comparison of normalized results at w = 0.015D.
Sustainability 15 00454 g002aSustainability 15 00454 g002b
Figure 3. Differential pressure beneath caisson lid: (a) effects of permeability; (b) effects of pullout velocity; and (c) effects of aspect ratio (the caisson diameter is constant).
Sustainability 15 00454 g003aSustainability 15 00454 g003b
Figure 4. Pore pressure field (unit: kPa): (a) k = 5 × 10⁻⁶ & v = 0.001 mm/s; (b) k = 5 × 10⁻⁶ & v = 1 mm/s; and (c) k = 5 × 10⁻⁶ & v = 100 mm/s.
Sustainability 15 00454 g004
Figure 5. Soil displacement field: (a) k = 5 × 10⁻⁶ & v = 0.001 mm/s; (b) k = 5 × 10⁻⁶ & v = 1 mm/s; and (c) k = 5 × 10⁻⁶ & v = 100 mm/s.
Sustainability 15 00454 g005
Figure 6. Displacement diagram of pullout suction caisson.
Sustainability 15 00454 g006
Figure 7. Differential pressure beneath the caisson lid (L/D = 1.0): (a) relationship with pullout velocity; and (b) relationship with normalized pullout velocity.
Sustainability 15 00454 g007
Figure 8. Differential pressure for different normalized pullout velocity (L/D = 1.0).
Sustainability 15 00454 g008
Figure 9. Differential pressure for different aspect ratio and normalized pullout velocity: (a) in three dimensions; and (b) in two dimensions.
Sustainability 15 00454 g009
Figure 10. Differential pressure for different friction coefficient of soil-structure and normalized pullout velocity: (a) in three dimensions; and (b) in two dimensions.
Sustainability 15 00454 g010
Figure 11. Comparisons between test results and DPE curve.
Sustainability 15 00454 g011
Figure 12. Bearing capacity mechanism: (a) overall bearing mode; (b) soil plug module; and (c)suction caisson module.
Sustainability 15 00454 g012
Figure 13. Normalized uplift capacity against the normalized pullout velocity.
Sustainability 15 00454 g013
Figure 14. Soil effective stress along the depth.
Sustainability 15 00454 g014
Figure 15. Soil effective stress along the caisson diameter: (a) considering the effects of v/k; and (b) considering the effects of K t a n δ .
Sustainability 15 00454 g015
Figure 16. Soil effective stress along the caisson diameter at different depth.
Sustainability 15 00454 g016
Figure 17. Soil effective stress along the caisson diameter at different depth.
Sustainability 15 00454 g017
Figure 18. Comparison of simulation solution with analytical solution (fully drained).
Sustainability 15 00454 g018
Figure 19. Soil effective stress around caisson along depth (a) internal skirt and external skirt; (b) internal skirt.
Sustainability 15 00454 g019
Table 1. The basic parameters of this paper’s simulations.
PropertiesValues
Caisson
Diameter, D (m)10
Skirt length, L (m)10
Skirt wall thickness, ts (m)0.1 (ts/D = 0.01)
Friction coefficient of soil-structure, μ0.5
Material propertyRigid body
Seabed soil
Permeability coefficient, k0 (m/s)5 × 10−6
Initial void ratio, es0.658
Buoyant unit weight, γ′ (kN/m3)10
Specific weight of water, γw (kN/m3)10
Earth pressure coefficient, K0.45
Water element
Element thickness, tw (m) 0.2
Young’s modulus, Ew (kPa)10−5
Poisson’s ratio, nw0
Permeability coefficient, kw (m/s)1
Initial void ratio, ew0.658
Table 2. Parameters of the SANISAND model for Dogger Bank sand [15].
ParameterVariableValue
ElasticityG0206
ν′0.05
Critical stateMc1.4
Me1.05
λc0.007
ec00.75
ee00.699
ξ0.7
Yield surfacem0.05
Plastic modulesh07
ch0.98
nb2.9
DilatancyA01.6
nd2
Fabric-dilatancy tensorzmax0
cz0
Table 3. Comparison of centrifuge test (Sender [22]) with analytical solution (fully drained).
Calculation MethodSkirt Wall Friction (kN)Relative Error
Centrifuge testSenders [22]1750-
Analytical solutionHoulsby et al. (2005)
m = 1.2
1249.37−28.6%
Houlsby et al. (2005)
m = 1.5
1543.75−11.8%
Stress release model
this paper
1478.27−15.5%
(Relative error less than 0 indicates underestimation)
Table 4. Comparison of simulation with analytical solution.
Friction CoefficientTotal Vertical Force (kN)Relative Error
Simulation SolutionAnalytical Solution
0.196,48991,813−4.85%
0.398,06393,227−4.93%
0.599,54194,640−4.92%
0.7100,36896,054−4.30%
Disclaimer/Publisher’s Note: The statements, opinions and data contained in all publications are solely those of the individual author(s) and contributor(s) and not of MDPI and/or the editor(s). MDPI and/or the editor(s) disclaim responsibility for any injury to people or property resulting from any ideas, methods, instructions or products referred to in the content.