Abstract
As Ghana seeks to diversify its agricultural export commodity trade away from its over-reliance on cocoa, empirical evidence is critical to inform policy direction on the implementation of programs to promote such an agenda. The objective of the study was to determine whether farmers who cultivate perennial crops as their primary source of livelihood have better welfare gains than farmers who cultivate perennial crops. The study used cross-sectional data collected from 386 farming households in the northern region of Ghana. The propensity score-matching technique augmented with a control function estimator was employed in order to account for self-selection biases in household characteristics that could invalidate the quality and magnitude of the estimates. Factors identified to positively and significantly influence households’ decision to cultivate perennial crops include number of male adults in a household, farm size, membership of farmer groups, value of agricultural credit, and distance from homestead to the farm. The empirical evidence further indicated that farmers who grow perennial crops have higher welfare gains in terms of consumption expenditure per capita, household income per capita, and farm income per hectare than farmers who grow annual crops as their primary source of income. On the other hand, annual crop farmers have a wider spread of income (income diversification) than perennial crop farmers. Sensitizing farming households to engage in perennial crop production, at the very least, as an alternative source of livelihood, will aid in the fight against poverty and food insecurity, as well as improve Ghana’s macroeconomic balances through agricultural export revenue.
1. Introduction
There is a growing global awareness of food security and environmental issues related with the crop production chain. As a result, most nations are being confronted with the challenges of drawing policies to re-articulate agriculture towards safer and more sustainable practices [1]. The United Nation’s agenda on Sustainable Development Goal (III), which advocates for “zero hunger”, observed that there is the need for a reflective shift in global food and agricultural system if we are to cater for sufficient nutritional needs of the 815 million people who are hungry today and the additional 2 billion people expected to be undernourished by 2030 [2]. Therefore, to help eliminate the incidence of hunger by ensuring an increase in agricultural productivity and sustainable food production systems, significant investments in agriculture cannot be underestimated [2]. Several concerns have been raised to address this challenge, including how agriculture will adapt to climate variations, how food security can be improved, and how extreme poverty can be eliminated, all of which have fueled the desire to improve the roles crops will play in the future farming systems [3]. Perennials or tree crops recently have been recommended as an alternative approach to transform agriculture in a more sustainable way [4,5]. The sustainable production system in agriculture has always depended on the flexibility, efficiency, and several functions of perennial trees and forages cultivated alongside annual legumes, cereals, and oil species. Perennial crops have received much attention in terms of research over a decade as a result of their potential to improve ecosystem services in agricultural systems [6]. In Africa, perennials are becoming more intensive in terms of knowledge, inputs, and quality control, owing in part to rising health standards imposed by importers. Africa’s substantial market share in perennial crops may indicate that the promotion of these crops could make a major contribution to Africa’s growth [7].
Significant portions of arable land in Ghana’s northern region have been subjected to continuous production of annual crops over the years. This has resulted in various environmental issues, including soil erosion and degradation, dryland salinity eutrophication, and nutrient leaching [8]. Increasing ground cover and decreasing water usage, reintroducing profitable perennial crops into the agricultural landscape can help revitalize the original vegetation [9]. Over the last half-century, Ghana’s perennial crop sector has been dominated by cocoa and coffee production. Although other crops such as orange, oil palm, mango, and other fruit crops exist, their production has been on a small scale for both domestic consumption and the local market. However, large-scale cashew and mango production has recently received a lot of attention due to their ability to command high prices in domestic and international markets, which directly impacts farmers’ lives and welfare. Recently, governmental, non-governmental, and private sector organizations have enrolled programs and projects to support the production of perennial crops, particularly mango and cashew, in Ghana’s northern region, where poverty is prevalent. The Export Trade, Agricultural, and Industrial Development Fund (EDAIF) and the Integrated Tamale Fruit Company (ITFC) are two of the programs. Moreover, cashew and mango have been earmarked as part of the seven selected perennial crops for Ghana’s Planting for Export and Rural Development (PERD) Program. These crops command huge potentials in both the local and the international domain. As such, it can contribute significantly to reducing poverty and improve the welfare of farmers.
Many observational studies [10,11,12] on impact evaluation in the crop production sector in Sub-Saharan Africa (SSA) focused on improved crop varieties. Other studies [13,14,15] have examined the effects of inputs, such as the use of pesticides, fertilizers, and other improved farm management techniques, on household welfare and the environment. Despite all of the potential of perennial crops and stakeholders’ efforts to promote them, the authors of this study are yet to come across a systematic study that ascertains whether farmers who cultivate perennial crops as their main source of income experience greater welfare gains than farmers who cultivate annual or food crops in SSA in general, and Ghana in particular. Thus, the objective of the study was to determine whether farmers who cultivate perennial crops as their primary source of income have better welfare gains than farmers who cultivate annual crops. Ghana’s quest to transform its economy through agriculture is gaining traction, with the promotion of perennial crops such as mango and cashew being a top government priority this time. As a result, analyzing the welfare impacts of perennial crop production in northern Ghana, where poverty and food insecurity are widespread, is critical for policy decision-making. Evidence from the study may serve as an information guide for the design and implementation of programs oriented toward the promotion of perennial crop production.
The study focused on two major crops grown in the study area: cashew and mango. Our sample data is divided into two groups: perennial crop producers (mango and/or cashew) and annual crop producers (production of any one or more of rice, maize, yam, soybeans, millet, and sorghum). The welfare of households is captured by the following indicators: consumption expenditure per capita, household income per capita, farm income per hectare, and income diversification. To address the challenges of non-randomness that may lead to issues of sample selection biases, we used the Propensity Score Matching (PSM) estimator in conjunction with the control function technique (within the framework of instrumental variable [IV]).
Perennial Crop Production in Ghana
Large-scale production of perennial crops in Africa can be traced back to 1914 in West Africa, except for areas under the German colony. European traders collected oil palm produce from indigenous producers and collectors. Furthermore, a significant breakthrough in the production of cocoa began in the late 19th century that saw Ghana and Nigeria as leading producers for over half a decade [6]. Ghana’s perennial crop sector for decades until recently has been dominated mainly by cocoa. However, several attempts have been put forward by successive governments to develop and explore the full potentials of other non-traditional perennial crops. Among them are cashew, mango, rubber, oil palm, shea, and orange. Except for cocoa, the two perennial tree crops that have attracted Ghanaian farmers in recent years are cashew and mango. The enormous increase in cashew exports in 2011 is attributable to an upsurge in cashew nut prices in 2010 and a subsequent drop in prices that maintained that level until the end of the year [16].
While tree crop farmers see various agricultural activities as a part of their investment portfolio, other farmers might view these tasks as part of their daily operations. The households’ primary food comes from food crops. A competing metaphor is that a medium to long-term investment of capital is provided by perennials such as cashew and mango, which helps farmers obtain additional resources for their farm expansions and other expenditures [17]. Perennial and annual crops tend to complement each other and intercropping consisting of two or more types of crops are, thus, quite common among small-scale farmers in Ghana. Perennial crops have the potential to produce income for the farming household for an extended period of time, but they have some drawbacks that may restrict the growth of tree crop cultivation in Ghana [18]. High start-up costs and a long-term capacity-building requirement are two examples of trees’ extensive initial investment [19]. The main prospects and opportunities for tree crop chain transformation in Ghana relate to the agricultural system and specifically the opportunities available for various tree crop types [20]. Intercropping of yams, rice, maize, or groundnuts results in a continuous source of food and income for the farm household.
Following the successful implementation of Ghana’s Planting for Food and Jobs (PFJ) program in 2017, the government is set to achieve another milestone in the agriculture sector with the establishment of the Tree Crop Development Authority (TCDA) in 2020, as part of the larger policy framework of Planting for Export and Rural Development (PERD). The TCDA is expected to lead the agenda for diversifying Ghana’s agricultural export commodity away from over-reliance on cocoa as the primary agricultural export commodity. The authority has identified six major crops: cashew, mango, shea, coconut, rubber, and oil palm. The TCDA’s primary responsibility is to coordinate the activities of the major stakeholders involved in producing, marketing, and exporting these tree crops. The promotion of tree crops in the country is expected to boost Ghana’s export earnings; create jobs through a chain of activities; and, most importantly, improve the well-being of rural farming households. As a result, empirical evidence that seeks to understand the welfare gains of tree crop production, such as mango and cashew, which are two of the key crops promoted under this program, is critical. This study’s findings are expected to guide the design and implementation of such an intervention program.
2. Materials and Methods
2.1. The Study Area, Sampling and Data Collection Techniques
This study was conducted in Ghana’s northern region, which is part of the Savanna northern region. A total land area of 97,702 km2 is controlled in the region. It borders on the North with Upper East and Upper West regions of Ghana, on the South with Bono East and Volta regions of Ghana, and on the West with Togo. Northern Ghana is prone to extreme precipitation patterns and has a longer drought period that can extend to 7 months per year. The rainy season usually starts in April/May and ends in October/November. The rest of the 7 months are mostly dry with low or no precipitation. The yearly precipitation ranges from 400 mm to 1200 mm and is irregular. The primary economic activity of the people of the region is agriculture, with around 70% of the population in agriculture [21].
The multi-stage sampling technique was employed to draw respondents for the study. Six districts in the Northern region of Ghana were selected for their production of perennial crops, specifically cashew and mango. Six farming communities from each district were selected by stratified and simple random sampling techniques, resulting in a total of 36 communities. Ten to twelve respondents were randomly selected from the group of annual and perennial crop farmers. We collected information from 400 farming households in total. However, 386 questionnaires were used for data analysis after data cleaning. The data was gathered through face-to-face interviews. The questionnaire collected information on the socioeconomic characteristics of the head of the household, types of perennial crops, and farmers’ income and expenditure.
2.2. The Empirical Approach
2.2.1. Impact Evaluation
The critical research question here is: what effect do perennial crops have on farmer welfare in the Northern region? In the context of this study, impact refers to the welfare implications of cultivating perennial crops (cashew and mango). Regardless of whether the cultivation of perennial crops has the desired effect on the welfare of rural farming households compared to the cultivation of annual crops such as rice, maize, sorghum, millet, and others, it is worth acknowledging that creating a counterfactual is critical in impact evaluation. That is, what would have been the impact in the absence of the treatment or the intervention? In this study, the treatment variable is the production of perennial crops. Thus, farming households cultivating perennial crops are the “treated group,” and those cultivating food crops are called “the control or untreated group”. Two methods usually come to bear in analyzing impact evaluation, experimental and non-experimental. The experimental method is employed when participation is randomly determined, or the researcher exercises control participation. In this situation, a randomly determined group before the intervention is excluded from the activity [22]. This method, however, cannot be adopted in this study since perennial crop production in agriculture is neither influenced by the researcher nor random. With the non-experimental methods, a set of techniques that help in comparison with the treatment group is considered.
In order to analyze the impact of perennial crops (cashew and/or mango) production on farmers’ welfare, we begin with a linear equation:
where denotes outcome (dependent) variable: farmers welfare measured as food per capita consumption expenditure, household income per capita, farm income per capita, and income diversification. is a vector representing household characteristics, is a dummy, representing 1 if a farmer cultivates perennial crop and 0 if otherwise (It is important to note that a farmer who produces both perennial and annual crops was specifically asked “which of the crops contribute more to the livelihood of the household”). Thus, what proportion does each of the two categories contribute to the household income. Based on this, the farmer is assigned 1 or 0. Moreover, perennial crop farmers are those who cultivated and own the farms (those who inherited farms were excluded from the sample). is the random error term.
In Equation (1), the decision to cultivate perennial crop is treated as an exogenous variable on the premise that households engage in perennial crops to better their welfare status. This may not be a necessary condition since some farmers may be better prepared to engage in the production of perennials. Also, the decision to produce perennial or annual crops may arise from the benefits they both come with, which explains that crop production may not be random. Thus, there is the presence of selection bias, which occurs when unobservable characteristics influence the error term of a given selection and outcome equations. Consequently, the problem of selection may be encountered in an attempt to estimate Equation (1) with Ordinary Least Square (OLS). To address selection bias in impact evaluation, two main approaches have been employed in the literature: Propensity Score Matching (PSM) and Instrumental Variable (IV). Although the IV approach can correct for both observed and unobserved heterogeneities in household characteristics as opposed to PSM that corrects for only observed characteristics, the IV approach has major drawbacks. The IV approaches tend to impose linear functional form assumption, which may suggest that coefficients on control variables may be similar for both participants and non-participants [23]. Coefficients could however vary, which may render this assumption a weak one [24]. Second, miss-specified econometric models using observational data occasionally produce biased estimators. One basis of such bias is that the two samples lack distribution overlap, and regression analysis cannot tell researchers the distribution overlap between the two samples. Third, linear or logistic models have been used to adjust for confounding covariates, but such models rely on assumptions on the subject of functional form. For example, one assumption needed for a linear model to produce an unbiased estimator is that it does not suffer from endogeneity. Contrary to the IV technique, PSM as a non-parametric technique allows researchers to re-construct counterfactuals by adjusting covariates between the treated and the control groups using an observational data set. Thus, PSM can easily identify the lack of covariate distribution between the two groups, adjust the distribution accordingly, and subsequently produce unbiased causal effects. In addition, PSM does not require a function to evaluate the linkage between treatment and the outcome variables in order to determine causal effects.
PSM matches the observed outcomes of the treated and the control by creating randomized experiment conditions to aid in evaluating a causal effect in a controlled experiment [25]. However, the assumption of conditional independence (CIA) is a downside of PSM technology. The CIA states that treatment is regardless of the potential outcomes of a given set of characteristics observed. However, Jalan and Ravallion [26] noted that, for cross-sectional data analysis, selection based on the observables is not restrictive but relaxed. The study used PSM as the main technique for estimating the impact of perennial crop production in rural farm households because of the cross-sectional data and the difficulty of identifying right and solely exogenous variables for use in IV. To test the reliability of the PSM estimates, we used the control function estimator within the IV structure. The control function corresponds with the endogenous explanatory variables, which is perennial crop production. This makes the approach to the control function more consistent for linear models. Another important advantage of the control function estimator is that it accounts for multiple heterogeneity sources and the possibility of self-selection, which are factors affecting both observed and unobserved characteristics (For more information on control function estimation in IV, readers should kindly consult Cerulli (2011). A user-written STATA command ivtreatreg was used in the control function estimation.).
2.2.2. Estimating the Treatment Effects
In estimating the average treatment effects of perennial crop production, the potential observed welfare outcomes for both perennial crop farmers and annual crop farmers are represented as and , respectively. Therefore, represents the impact of cultivating perennial crop measure on the farmer called the treatment effect. The and of the same perennial crop farmer cannot be observed but rather , making it difficult to estimate the treatment effects of each perennial crop farmer.
The PSM process consists of two stages. The first stage consists of using probit modeling to simulate the likelihood of perennial crop production. Afterwards, propensity scores are calculated for each observation. The perennial crop model can be specified as:
where is a probit model and is the set of covariates. Equation (3) is the propensity score or likelihood of participation in perennial crop production [27]. In the second stage, an algorithm compares perennial crop producers to annual crop producers in order to estimate the average treatment effect on the treated [ATT] (i.e., every perennial crop producer to an annual crop producer with similar characteristics is matched). The impact of the treatment would be on the outcomes of the treatment group. In that case, ATT would be the gap in the outcome of the perennial crop producers and its counterfactual . Following Bello, Baiyegunhi and Danso-Abbeam [12], ATT can be specified as:
Though there are several matching methods in the literature, the commonest used in welfare impact studies are the Nearest Neighbor Matching (NNM), Kernel-based Matching (KMM), and Radius Matching (RM). Hence, the study employed these three matching techniques within the framework of the PSM as a robustness check.
3. Results
3.1. Description of Variables and Summary Statistics
Following many empirical studies [11,28,29] on welfare impacts, the study selected some indicators of welfare, and independent variables hypothesized to influence farmers’ decision to engage in perennial crop production. The study considered two different sets of respondents: perennial and annual crop farmers. Perennial crop farmers were 215, which represented 55.6% of the total sample size of 386. Out of 215 perennial crop farmers, about 129 cultivated only cashew, representing 60.3%; 46 cultivated mangoes exclusively, representing 21.3%; and 39 (18.2%) cultivated both cashew and mango (Table 1). The large proportion of farmers cultivating cashew could be attributed to the many projects about cashew being implemented in northern Ghana. The study used four variables as a proxy for household welfare: consumption expenditure, household income, crop farm income, and income diversification. Consumption expenditure and household income were adjusted for adult equivalent to get consumption expenditure per capita and household income per capita. The average food consumption expenditure per capita from the data is GH¢ 1147.38 ($234.16) (Exchange rate at the time of data collection was 1$ = GH¢4.9000) for the full sample, with a corresponding significant difference between the perennial crop farmers (GH¢1195.11/$243.70) and annual crop farmers (GH¢1092.33/$222.92) (The data for the food consumption expenditure was taken based on the last 7 days from the day of the survey and was projected for the annual consumption expenditure.). The respondents also reported the annual income earned by all members of the household. Earnings from all economic activities are included, with the exception of crop farm income (perennial and/or annual). They include earnings from livestock production, petty trading, salaried work, vocational jobs (e.g., carpentry, masonry, etc.) and remittances. These non-crop and non-farm activities include livestock, petty trading, and salaried employment, among others. The result from Table 1 indicates that the average annual household income per capita was GH¢ 1264.89($258.14) for the full sample, and GH¢1669.24 ($340.66) and GH¢725.73 ($148.12) for the perennial and annual crop, respectively. The difference in the two samples is significant at 1% as indicated by the t-values. By implication, annual incomes distribution was more skewed toward perennial crop farmers. Observations from the field indicate that most perennial crop producers either have vocational or formal salaried workers, although their scope of diversification was less. Our sampled farmers’ average farm income per ha is approximately GH¢2544 ($519.18), with no significant difference between the perennial and annual crop farmers. With income diversification, the mean value as revealed by the study is 0.54 for the entire sample (We used Simpson Index of diversification (SID) to calculate the extent of diversification among the sampled respondents (both treated and control group). The SID is given by: , where denotes the proportion of income from the ith source. Five income sources were used to calculate SID: cropping, animal rearing, salaries from formal employment, non-farm business (e.g., petty trading, vocational jobs, etc.), and remittances). The index is slightly higher for the annual crop producers (0.550) than the perennial crop producers (0.523). There are, however, no significant differences between them. This suggests that our sampled farmers rely on a variety of economic activities for a living.

Table 1.
Descriptive statistics of the respondents.
The second section of Table 1 contains summary statistics for the independent variables used in the econometric model. According to the table, men account for roughly 80% of the study’s respondents. However, there is no discernible difference between annual and perennial crop producers. The data revealed that the average age of the respondents was 47 years, with a standard deviation of 11 years. This suggests that the majority of respondents were in the labor force. In addition, the average number of male adults per household for perennial crop farmers was significantly lower than the annual crop farmers. This indicates that annual crop farmers have relatively large family labor to engage in various production activities. However, perennial crop farmers have significantly higher dependents than annual crop farmers. For agricultural credit, perennial crop farmers received a higher amount compared with that received by the annual crop farmers.
Furthermore, while perennial crop farmers who are members of farmer groups are significantly higher than that of the annual crop farmers, annual crop farmers had more contact with agricultural extension agents than perennial crop farmers. In terms of distance to the nearest market where some of them sell their perennial and annual crop produce, 11 km was found to be the average distance travelled by the perennial crop farmers, which is significantly higher than the distance travelled by annual crop farmers.
This implies that perennial crop farmers could spend a relatively large amount of money on transportation. In addition, the study showed that the average distance from home to the farm was found to be 4.87 and 3.42 km for perennial and annual crop farmers, respectively. This indicates that farm fields were relatively close to farming communities.
3.2. Determinants of Perennial Crop Production
The findings of the determinants of perennial crop production are presented in Table 2. The probit model is statistically significant at 1% as indicated by the LR (Chi-square (18), p = 0.000). This suggests that the model depicts the data accurately. While the coefficient parameters have no numerical interpretations, we estimated the marginal effects to get a quantitative understanding of the results. The results in Table 2 indicate that a household with many male adults is more likely to engage in perennial crop production than annual crop. Thus, adding a male member to a household increases the likelihood of cultivating perennial crops by about 6%.
Table 2.
Estimates of the probit regression model for the determinants of participating in perennial crop production.
This is not surprising given that perennial crop production activities (particularly mango and cashew) are more laborious than annual crop production activities, and thus naturally suit men more than women. The findings also revealed that total farm size (uncultivated) had a significant and positive effect on perennial crop production, with a marginal effect of 0.09. In comparison to annual crops, perennial crops such as cashews and mangoes require a larger plot of land for cultivation. As a result, farmers with larger plots of uncultivated farmlands are more likely to engage in perennial crop production. Furthermore, lands for perennial crop production are rarely rented out because they require a longer period of time. This makes it difficult for households that do not own a large plot of land to cultivate perennials because their small plot of land is used for annual crops to feed themselves and their households. Previous studies have found that productive farm assets significantly influence farmers’ farm operation decisions [29,30]. According to the study’s findings, farming households with higher farm productive asset values (e.g., ownership of motorbikes and tricycles, cutlasses, hoes, and other farm machinery) are more likely to cultivate annual crops than perennial crops.
Farmers’ social and network capital, such as farmer group membership and contacts with agricultural extension agents, increases their awareness of what is going on in their environment. Farmers learn about new marketable crops, farm innovations, and farm management activities through farmer group. Similarly, frequent contact with agricultural extension agents allows farmers to gain new and more managerial and technical skills. From our findings, farmers who are members of the farmer group are approximately 25% more likely to cultivate perennial crops than annual crops. Social capital variables (e.g., FBOs) are instrumental in explaining household decisions. Farmers’ organizations membership is a major driver of an increase in access to information about perennial crop production. Farmers who have more contacts with agricultural extension agents, on the other hand, are more likely to cultivate annual crops than perennial crops. This could be attributed partly to the fact that annual crops such as maize, rice, and yam have been the main staple crops in the northern part of the country. Agricultural credit obtained in the form of inputs or cash increases the likelihood of farmers taking on capital-intensive agricultural activities [31]. Our results align with that of Kassie, Teklewold [32] as higher value of agricultural credit encourages farmers to cultivate perennial crop production, which is more capital intensive than annual crop production activities.
The distance between farmers’ homes and their farms had a positive effect on perennial crop production. This means that the farther the farm is from the main road, the more likely it is to grow perennial crops. This could be because farms located far from residential areas are easy to obtain and are not encroached upon by animals or other human activities. A 1-kilometer increase in distance from home to farm increases the likelihood of cultivating perennial crops by about 1.3%. Furthermore, farmers’ locations influence their decision to cultivate a specific type of crop. According to the findings, farmers in the Savelugu, Mion, and Yendi districts are more likely to cultivate perennials than farmers in the Bole districts. (Bole district was used as the base or the reference district.)
3.3. Impact of Perennial Crop Production on Households’ Welfare
3.3.1. Diagnostic Tests
Some diagnostic tests were done to investigate the impact of perennial crop production on the quality of the matching process, following which the matching propensity of both perennial and annual crop farmers was predicted. Figure 1 illustrates the population distribution of propensity scores for farmers who grow both perennials and annual crops. The estimated propensity score for the full sample ranges from almost zero (0.00008) to 1 with a mean value of 0.53396 and a standard deviation of 0.36905. The propensity score for the perennial crop farmers varies from 0.02094 to 1 with mean and standard deviation values of 0.79367 and 025881, respectively. For the annual crop producers, the minimum, maximum and the mean propensity scores are 0.00008, 0.99622, and 0.23600, respectively with a standard deviation of 0.22209. The difference between the propensity score of the perennial and annual crop producers was statistically significant at 1%. The estimated propensity score distributions for the common support region of the two groups (perennial and annual crop producers) ranges between 0.02094 and 0.99622. Farmers whose propensity scores lie outside this range were dropped from the impact evaluation analysis. The study found 18 representing about 5.14% of the total sampled population of farmers who did not find their match; hence, their propensity scores were outside.
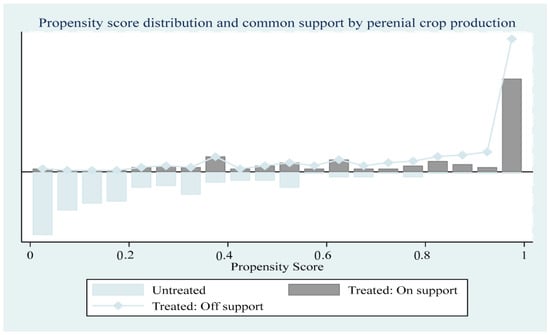
Figure 1.
Density distribution of propensity score. Notes: “Treated: on support” indicates perennial crop farmers have a suitable comparison group (annual crop farmers). “Treated: off-support” indicate the perennial crop producers that did not have a suitable comparison group (annual crop farmers).
Consequently, the conditions for common support are met. The top and bottom of the histogram show the score distribution of perennial and annual crop farmers, and the vertical axis shows the score distribution density. To illustrate how successful the matching technique has been, another indicator is the mean standardized test results before and after matching [27]. In Table 3, the covariates’ combined matching quality is presented. Prior to matching, the standardized mean difference in the covariates is 15.2%. However, this is reduced to 4.4% after matching, for a total bias reduction of 71%. We can say that the process was statistically successful at this point because the average standardized value after matching is less than 5% [27]. Furthermore, the joint significance was not rejected prior to the match (p-value = 0.000), but was rejected after the match (p-value = 0.151), as indicated by the likelihood ratio test p-value.
Table 3.
Summary of the equality indicators before and after matching.
The Pseudo-R2 also decreased significantly after matching. The evidence of the relatively successful matching process, which can be applied to evaluate the impact of perennial crop production on households’ welfare, is found in high bias reduction, low Pseudo R2, and the relatively low value of the LR after matching.
3.3.2. Average Treatment Effects
Table 4 shows the results of the estimates of the average impact of perennial crop production on the welfare of the treated farm households using three different matching algorithms: NNM, KM, and RM of the PSM. The last column of Table 4 also includes estimates of the average treatment effects using the IV approach, specifically the control function estimator as a robustness check of the estimates from the PSM techniques. The estimated treatment effects of the three PSM algorithms and control function estimator are qualitatively similar but quantitatively different. The estimated results confirm that perennial crop production has a positive and significant impact on the welfare of farmers in Northern Ghana. Because the raw values of food consumption expenditure per capita, household income per capita, and farm income per ha are expressed in logarithmic terms, the average effects can be expressed as percentages. The estimated impact on per capita consumption expenditure varies from 15.3% to 23.3% depending on the PSM algorithm used, and 14.6% when the control function technique is used. Thus, perennial crop producers spend between 15.3% and 23.3% more on food per household member than annual crop producers.
Table 4.
Impact of perennial crop production on farmers’ welfare.
For household income per capita, the estimated impact is between 40.4% and 47.8% per member across the PSM techniques, and 48.5% when the IV approach is used, indicating that perennial crop farmers earn more per capita than annual crop farmers.
The estimated treatment effects of perennial cultivation on-farm income per ha were 21.5% when RM was used, and about 11% when the control function was used. This finding is in tandem with the studies of Miller, Muñoz-Mora [33] in their policy research paper on the prevalence, economic contribution, and determinants of trees on farms across Sub-Saharan Africa. In their study, the real per capita consumption levels (2011 PPP) of tree-growing households and non-tree-growing households were compared. After controlling for district level effects, the study found out that tree cash crop growers were on average substantially better off. However, NNM and KM have a marginally positive effect on farm income per capita. We also found that perennial crop production had a significant and negative impact on income diversification. The effect is significant in two of the PSM-matching techniques: NNM and KM, and the IV technique’s control function. However, it has no bearing on the PSM’s RM. As a result, perennial crop producers diversified less in other areas of income generation than annual crop producers. Furthermore, given that the average IDI in the sample is about 0.533 and ranges from 0 to 0.89, the effects ranging from 0.102 to 0.179 are considered relatively small. The negative effects of perennial crop production on income diversification may be due, in part, to the fact that perennial crop production requires longer-term investment than annual crop production. A mongo tree, for example, takes about 4 years to bear fruit, whereas a cashew tree takes 3–5 years to bear its first fruit. This means that farmers must continue to invest in farm management activities (such as labor, agrochemicals, and so on) for at least 3 years before harvesting begins to earn a return on their investment. As a result, perennial crop farmers tend to invest entirely in farm activities, leaving little room for other income-generating activities.
To summarize, one of the shortcomings of PSM is that treatment is chosen based on observed characteristics. Estimates derived from matching processes may be vulnerable to hidden bias because unobserved variables are not taken into account [34]. The study evaluates the statistical rigor of the estimates obtained using PSM, given the strong assumption put forth by the CIA using the bounded technique proposed by Rosenbaum [24]. This test determines whether the estimate resulting from matching is resistant to undetected confounders. The Rosenbaum bound (r-bounds) test result is shown in column 5 of Table 5. According to the results in Table 4 (column 5), the lowest r-bound generating a 95% confidence interval is at least 2, 3, 5, and 10 for food consumption expenditure per capita, household income per capita, farm income per ha, and IDI, respectively. This finding implies that ATT estimates are resistant to unobserved heterogeneity as long as the log odds of differential treatment assignment remain above 2 (gamma > 2). Hence, the result that was achieved by the PSM technique was free from hidden biases, and thus there was an increase in the overall welfare of the treated group resulting from the production of perennial crops.
Table 5.
Heterogeneous treatment effects of perennial crop production over household characteristics.
3.4. Heterogeneous Effects among Perennial Crop Producers
One of the central questions in impact evaluation analysis with cross-sectional data is the heterogeneous impact of the treated group and thus, whether perennial crop cultivation impacts households’ demographic, farm-specific, and economic characteristics. We start this analysis by first examining the impact distribution of perennial crop production across the four outcome variables. Figure 2 shows a considerable variation in the cultivation of perennial crops in response to the outcome variables. One key concern here is that most of our sampled farming households would have had lower food consumption expenditure per capita, household income per capita, and IDI in the absence of perennial crop production. For farm income per ha, perennial crop producers would have been better-off had they produced annual crops. These findings confirm the earlier results regarding the average treatments obtained from the PSM and the IV procedures. As a result, we examine the heterogeneities to identify the sources of the variation in the impact.
Figure 2.
Distribution of the impact of perennial crop production across households on food consumption per capita, household income per capita, farm income per capita, and livelihood diversification.
When we estimated the impact of perennial crop production on all farmers in the treatment group, we assumed that the impact is homogeneous. While this is true, the effects may differ among perennial crop producers due to differences in their characteristics. It is critical to investigate the differentiated impact of perennial crop production in order to design and implement appropriate policy that targets individual farming households. The study examines the extent to which the impact of perennial crop production is heterogeneous across various socioeconomic and institutional parameters using the OLS approach. Following Wosen et al. [28], the dependent variable is the ATT of each of the welfare indicators. The finding from Table 5 suggests that perennial crop production has a heterogeneous effect to some extent. From the results, age of the respondent, total uncultivated farmland owned, membership of farmer group, and distance from home to the farm are the factors exerting significant influence for food consumption expenditure per capita. This implies that perennial crop production exerts a higher effect on food consumption expenditure per capita for older farmers, farmers with a larger parcel of farmlands, and farmers who are members of farmer groups. However, for farmers who have to travel distances to access market for their products, the cultivation of perennials has a lower effect on their welfare measured by food consumption expenditure per capita. There are positive and significant differentiated effects for farmers with higher educational attainment and total farmland in terms of household income per capita, but negative and significant differentiated effects for farmers who reside far from the nearest market center. The study found no significant differentiated effects for farm income per ha, except for total farmland and farmers residing in Savelugu district. Thus, among the perennial crop producers, those with larger farmlands and coming from Savelugu are better-off in terms of the amount of money generated per hectare of perennial crop farm. Finally, with regards to IDI, significant differentiated effects of perennial crop production exist among the treated farming households with respect to total farmland, value of asset and the total value of the credit. Thus, perennial crop farming households with larger farmland and a higher value of asset and total value of credit benefit more from the cultivation of perennial crops.
4. Conclusions and Policy Implications
The study explored the effect of perennial crop production on farmers’ welfare by comparing the welfare characteristics of perennial and annual crop producers through the PSM and IV methodologies, with four welfare indicators: food consumption expenditure per capita, household income per capita, farm income per capita, and income diversification. Factors that significantly influence farmers’ participation in perennial crop production include the number of male adults in the household, total uncultivated farmland, the total value of farm asset, amount of agricultural credit received, number of extension contacts, and membership of farmer group. The study further reveals that using food consumption expenditure per capita, household income per capita, and farm income per capita as indicators of welfare, perennial crop farmers earn and spend more as compared to annual crop farmers. This suggests that farmers who are into perennial crop production earn more income relative to annual crop farmers, and as such are better off in terms of welfare. However, annual crop farmers have a greater extent of income diversification than perennial crop farmers. This implies that perennial crops in northern Ghana serve as a strong contributor to the welfare of farmers and should be treated with all economic, environmental, and social considerations to boost their productivity and economic returns.
These findings have important policy implications for Ghana’s perennial crop industry. The primary objective of the ongoing PERD module, which has resulted in the establishment of TCDA, is to improve Ghana’s macroeconomic balances through the export of tree crops, particularly cashew. Following the key findings of the study, it is critical to intensify agricultural extension services that target the economic benefits of perennial production activities and crop marketing to spark the interest of farming households. Initiatives to strengthen farmer groups through member participation in scientific research and collaborative situational analyses of internal and external opportunities are highly recommended. These will contribute to the government’s goal of diversifying Ghana’s agricultural export commodity portfolio away from its reliance on cocoa, and consequently improve Ghana’s foreign exchange earnings.
The campaign and sensitization on perennial crop production will also allow farmers to appropriately adopt perennial crop production (mango and cashew) as an alternative means of livelihood, thereby helping to smoothen consumption expenditure and combat poverty and food insecurity in rural households. Because perennial crop production requires relatively large initial capital, it is highly recommended that farmers leverage existing financial institutions, agro-inputs, and processing industries to provide both financial and input support to boost their productivity. Reducing financial barriers for farming households promotes large-scale production, the use of appropriate farm management practices, and farm diversification. Intercropping perennial and food crops is a common practice among farmers. The focus of this study, however, excludes the economic, social, and environmental repercussions of such an intercropped system. Future research should evaluate the productivity as well as economic and environmental sustainability of perennial-food crop intercropped systems.
Author Contributions
Conceptualization, G.D.-A. and K.M.A.; Methodology, G.D.-A. and A.A.O.; Formal analysis, G.D.-A. and K.M.A.; Investigation, K.M.A.; Resources, K.M.A. and A.A.O.; Data curation, K.M.A.; Writing—original draft, G.D.-A.; Writing—review & editing, A.A.O.; Supervision, A.A.O. All authors have read and agreed to the published version of the manuscript.
Funding
This study received no external funding.
Institutional Review Board Statement
Not applicable.
Informed Consent Statement
Verbal consent was sought from each respondent before the survey began, and confidentiality was preserved by allocating codes to each respondent rather than writing down their names. All participants in the survey were fully informed of the objective of the study.
Data Availability Statement
Data set used for the analysis of this study are available from the corresponding author upon request.
Conflicts of Interest
The authors declare no conflict of interest.
References
- Randazzo, L.M.; Robidoux, M.A. The costs of local food procurement in a Northern Canadian First Nation community: An affordable strategy to food security? J. Hunger. Environ. Nutr. 2018, 14, 662–682. [Google Scholar] [CrossRef]
- UN. Transforming Our World: 2030 Agends for Sustainable Development; UN: New York, NY, USA, 2015. [Google Scholar]
- Awazi, P.N.; Tchamba, M.N.; Avana, T.M.-L. Climate change resiliency choices of small-scale farmers in Cameroon: Determinants and policy implications. J. Environ. Manag. 2019, 250, 109560. [Google Scholar] [CrossRef] [PubMed]
- Žalac, H.; Zebec, V.; Ivezić, V.; Herman, G. Land and Water Productivity in Intercropped Systems of Walnut—Buckwheat and Walnut–Barley: A Case Study. Sustainability 2022, 14, 6096. [Google Scholar] [CrossRef]
- Mehraban, N.; Kubitza, C.; Alamsyah, Z.; Qaim, M. Oil palm cultivation, household welfare, and exposure to economic risk in the Indonesian small farm sector. J. Agric. Econ. 2021, 72, 901–915. [Google Scholar] [CrossRef]
- Kane, A.D.; Rogé, P.; Snapp, S.S. A Systematic Review of Perennial Staple Crops Literature Using Topic Modeling and Bibliometric Analysis. PLoS ONE 2016, 11, e0155788. [Google Scholar] [CrossRef]
- Fold, N. Transnational sourcing practices in Ghana’s perennial crop sectors. J. Agrar. Chang. 2008, 8, 94–122. [Google Scholar] [CrossRef]
- Holzworth, P.D.; Huth, N.I.; de Voil, P.G.; Zurcher, E.J.; Herrmann, N.I.; McLean, G.; Chenu, K.; van Oosterom, E.J.; Snow, V.; Murphy, C. APSIM–evolution towards a new generation of agricultural systems simulation. Environ. Model. Softw. 2014, 62, 327–350. [Google Scholar] [CrossRef]
- Vico, G.; Manzoni, S.; Nkurunziza, L.; Murphy, K.; Weih, M. Trade-offs between seed output and life span–a quantitative comparison of traits between annual and perennial congeneric species. New Phytol. 2016, 209, 104–114. [Google Scholar] [CrossRef]
- Khonje, G.M.; Manda, J.; Mkandawire, P.; Tufa, A.H.; Alene, A.D. Adoption and welfare impacts of multiple agricultural technologies: Evidence from eastern Zambia. Agric. Econ. 2018, 49, 599–609. [Google Scholar] [CrossRef]
- Martey, E.; Etwire, P.M.; Kuwornu, K.M. Economic Impacts of smallholder farmers’ adoption of drought-tolerant maize varieties. Land Use Policy 2020, 94, 104524. [Google Scholar] [CrossRef]
- Bello, L.O.; Baiyegunhi, L.J.S.; Danso-Abbeam, G. Productivity Impact of improved rice varieties’ adoption: Case of smallholder rice farmers in Nigeria. Econ. Innov. New Technol. 2020, 30, 750–766. [Google Scholar] [CrossRef]
- Issahaku, G.; Abdul-Rahman, A. Sustainable land management practices, off-farm participation and vulnerability among farmers in Ghana. Is there a nexus? Int. Soil Land Conserv. Res. 2018, 7, 18–26. [Google Scholar] [CrossRef]
- Khonje, M.; Manda, J.; Alene, A.D.; Kassie, M. Analysis of adoption and impacts of improved maize varieties in Eastern Zambia. World Dev. 2015, 66, 695–706. [Google Scholar] [CrossRef]
- Midingoyi, G.S.K.; Kassie, M.; Muriithi, B.; Diiro, G.; Ekesi, S. Do farmers and the environment benefit from adopting integrated pest management practices? Evidence from Kenya. J. Agric. Econ. 2019, 70, 452–470. [Google Scholar] [CrossRef]
- Rabany, C.; Rullier, N.; Ricau, P. The African Cashew Sector in 2015. General Trends and Country Profiles. African Cashew Initiative (ACI) Report; ACI: Accra, Ghana, 2015. [Google Scholar]
- Gro Intelligence. Nutty Prices: Almonds, Cashew, Walnuts, and Pistachios; Gro Intelligence: New York, NY, USA, 2016. [Google Scholar]
- Ntsiful, A.K. Outgrower Oil Palm Plantation Scheme by Private Companies and Poverty Reduction in Ghana. In A Dissertation Presented to St. Clements University, in Turks and Caicos Islands in Fulfilment of the Requirement for the Degree of Doctor of Philosophy (Development Finance); St. Clements University: Lausanne Switzerland, 2010. [Google Scholar]
- Gutierrez, V.; Keijzer, M. Funding forest landscape restoration using a business-centred approach: An NGO’s perspective. Unasylva 2015, 66, 99. [Google Scholar]
- Wardell, A.; Fold, N. Globalisations in a nutshell: Historical perspectives on the changing governance of the shea commodity chain in northern Ghana. Int. J. Commons 2013, 7, 367–405. [Google Scholar] [CrossRef]
- Dufflo, E.; Glennerster, R.; Kremer, M. Using Randomization in development economics research: A tool Kit. In Handbook of Development Economics; Elsevier: Amsterdam, The Netherlands, 2007. [Google Scholar]
- GSS. 2015 Labour Force Report; Ghana Statisitcal Service: Accra, Ghana, 2016; pp. 112–119. [Google Scholar]
- Ali, A.; Abdulai, A. The adoption of genetically modified cotton and poverty reduction in Pakistan. J. Agric. Econ. 2010, 61, 175–192. [Google Scholar] [CrossRef]
- Rosenbaum, P.R. Observational Studies; Springer: New York, NY, USA, 2002. [Google Scholar]
- Becerril, J.; Abdulai, A. The impact of improved maize varieties on poverty in Mexico: A propensity score matching approach. World Dev. 2010, 38, 1024–1035. [Google Scholar] [CrossRef]
- Jalan, J.; Ravallion, M. Does Piped Water Reduce Diarrhea for Children in Rural India? J. Econom. 2003, 112, 153–173. [Google Scholar] [CrossRef]
- Rosenbaum, R.P.; Rubin, D.B. The Central Role of the Propensity Score in Observational Studies for Causal Effects. Biometrika 1983, 70, 41–55. [Google Scholar] [CrossRef]
- Wosen, T.; Abdoulaye, T.; Alene, A.; Haile, M.G.; Feleke, S.; Olansewaju, A.; Manyong, V. Impact of extension access and cooperative membership in technology adoption and household welfare. J. Rural. Stud. 2017, 54, 223–233. [Google Scholar] [CrossRef] [PubMed]
- Ehiakpor, S.D.; Danso-Abbeam, G.; Dagunga, G.; Ayambila, S.N. Impact of Zai technology on farmers’ welfare: Evidence from northern Ghana. Technol. Soc. 2019, 59, 101189. [Google Scholar] [CrossRef]
- Mmbando, E.F.; Baiyegunhi, L.J.S. Socio-economic and institutional factors influencing adoption of improved maize varieties in Hai district, Tanzania. J. Hum. Ecol. 2016, 53, 49–56. [Google Scholar] [CrossRef]
- Kassie, M.; Marenya, P.; Tessema, Y.; Jaleta, M.; Zeng, D.; Erenstein, O.; Rahut, D. Measuring farm and market level economic impacts of improved maize production technologies in Ethiopia: Evidence from panel data. J. Agric. Econ. 2018, 69, 76–95. [Google Scholar] [CrossRef]
- Kassie, M.; Teklewold, H.; Jaleta, M.; Marenya, P.; Erenstein, O. Understanding the adoption of a portfolio of sustainable intensification practices in eastern and southern Africa. Land Use Policy 2015, 42, 400–411. [Google Scholar] [CrossRef]
- Miller, C.D.; Muñoz-Mora, J.C.; Christiaensen, L. Prevalence, economic contribution, and determinants of trees on farms across Sub-Saharan Africa. For. Policy Econ. 2017, 84, 47–61. [Google Scholar] [CrossRef]
- Caliendo, M.; Kopeinig, S. Some Practical Guidance for the Implementation of Propensity Score Matching. J. Econ. Surv. 2008, 22, 31–72. [Google Scholar] [CrossRef]
Disclaimer/Publisher’s Note: The statements, opinions and data contained in all publications are solely those of the individual author(s) and contributor(s) and not of MDPI and/or the editor(s). MDPI and/or the editor(s) disclaim responsibility for any injury to people or property resulting from any ideas, methods, instructions or products referred to in the content. |
© 2022 by the authors. Licensee MDPI, Basel, Switzerland. This article is an open access article distributed under the terms and conditions of the Creative Commons Attribution (CC BY) license (https://creativecommons.org/licenses/by/4.0/).