Article

Virtual Reality Destination Experiences Model: A Moderating Variable between Wisesa Sustainable Tourism Behavior and Tourists’ Intention to Visit

1
Graduate School of Management, Dian Nuswantoro University, Semarang 50131, Indonesia
2
Department of Accounting, Faculty of Economics and Business, Dian Nuswantoro University, Semarang 50131, Indonesia
3
Department of Management, Dian Nuswantoro University, Semarang 50131, Indonesia
*
Author to whom correspondence should be addressed.
Sustainability 2023, 15(1), 446; https://doi.org/10.3390/su15010446
Submission received: 8 October 2022 / Revised: 15 December 2022 / Accepted: 19 December 2022 / Published: 27 December 2022
(This article belongs to the Section Economic and Business Aspects of Sustainability)

Abstract

:
Sustainable tourism in Indonesia is challenging because it must harmonize bringing in tourists and maintaining the sustainability of culture and nature. Environmental problems influence sustainability tourism in Indonesia. Aside from discussing the policy implementation, this research focuses on promoting the local wisdom of sustainable tourism coupled with a virtual reality application. This study is supported by various previous studies on sustainability coupled with digital technology. Placing tourism in the contexts of eco-tourism, ecosystem, and sustainability is based on belief in the existence of values, beliefs, and norms (VBN). This research aims at developing a virtual reality destination experience (VRDE) model as a moderating variable between sustainable tourist behavior (STB) and tourist visit intention (TVI). The portability variable strengthens VRDE, and the content quality variable supports VRDE. The research method used was purposive convenience sampling covering 204 respondents who visited the vicinity of Kebon Indah batik village in Klaten, Central Java, Indonesia. The research findings were H1—STB has a significant effect on VRDE (0.00 < 0.05), H2—VDRE has a significant impact on TVI (0.00 < 0.005), H3—portability has a significant effect on VRDE (0.039 < 0.05), and H4—content quality does not have an impact on VRDE (0.401 > 0.05). The novelty of this research is the VRDE application applied to community sustainable tourist behavior in developing countries. However, the content quality of VR has yet to meet respondents’ expectation.

1. Introduction

The COVID-19 pandemic has ravaged Indonesia’s tourism industry in the last two years. However, in 2022, the pandemic has slowed, and the tourism industry in Indonesia has started to recover again. Indonesia’s tourism industry’s contribution reached USD16.9 billion in 2019 and fell to USD13.6 billion during 2020–2021.
The tourism industry in Indonesia constitutes 6.1 percent of the annual GDP, a significant increase on the 3.5 percent in 2013. Although the industry has a positive effect, there are some worries about its potential detrimental impacts on both local people and the environment. Tourists use more energy, food, and water, hence making more waste than they do at home, placing pressure on some of the world’s most susceptible and/or poor locations. To solve these problems, sustainability is progressively being pondered as a strategic enabler for the tourism industry [1]. In addition, [2] revealed that insuring long-term sustainability in tourism industry requires an appropriate balance in favor of environment protection and natural system restorations to handle the issue of sustainable tourism. Furthermore, the challenge of sustainable tourism can be reached in different ways. For instance, overall information technologies can efficiently be utilized to tackle economic, societal and environment issues. Among several information technologies, blockchain, VR and AR are capable of improving sustainability in tourism.
We are engaged in reviving and promoting our local wisdom, Wisesa, which means Indonesia’s local wisdom and supreme power from God to create a sustainable environment. We develop a model of sustainable tourism behavior, virtual reality, and tourist intentions to visit the tourist destination of Kebon Indah village, Central Java, Indonesia. Foreign as well as domestic tourists who visit Indonesia usually enjoy nature tourism. However, tourists are also interested in experiencing batik using natural coloring materials, including leaves, mangrove tree fruit, wood sap, and herbaceous plants. To promote sustainability tourism, learning to craft natural dyes for batik for a decade can be enticing foreign tourists from South Korea, Japan, USA, Holland, Germany and Canada to visit Kebon Indah aside to enjoy green panoramic views.
Batik is a cultural heritage of native Indonesian fabrics that have been recognized worldwide. Batik cloth can be made into various products such as clothes, blankets, pillowcases, etc. There are two types of batik: stamped batik and written batik. Making batik with this method can be done by painting with canting (a tool to draw patterns and motifs) and affixing wax dots one by one according to the depicted motif. Motifs can be self-made or imitate existing motifs.
Many tourists who visit the destination are concerned and encourage tourism industry players to have an obligation to realize sustainable tourism development by preventing environmental degradation [3,4,5]. Therefore, foreign tourists concerned about environment awareness will participate in promoting sustainable tourism behavior [6,7]. VR (virtual reality) is a revolutionary technology that fundamentally changes the user’s (consumer) experience of entering a three-dimensional world. VR is used in (3D) games, health care, retail sales, social connections, and marketing. Facebook also provides a three-dimensional VR service, Facebook Horizon, allowing people to meet in a three-dimensional digital space. The experience of using VR in marketing is still at an early stage. Consumers have not entirely accepted it, and this is because it causes discomfort when users must use special tools to view objects through a VR headset [8]. However, in subsequent studies, the use of VR for consumers led to an experience that excited them to continue the surfing experience through three-dimensional VR technology [9]. Therefore, the findings of [9] can be said to be a research gap from the study conducted by [8].
Extended reality could make it possible to offer a new type of experience to sports fans. It seems like a game, but everyone should experience it. At Oracle, the idea is to make everything work with virtual reality. For example, you can browse a virtual store, see the store manager, and monitor sales in real time. Augmented reality brings data directly to your products [10]. The apparent distinction between the terms “real” and “virtual” is shown to have different aspects, depending on whether one is dealing with real or virtual objects or real or virtual images. Direct or indirect viewing of these [11] proposes a mixed reality. Many business leaders and academics claim that extended reality represents the future of sports marketing, defining it as the primary trend of the next few years. Shortly, the comprehensive reality could supplant the traditional means of watching sports broadcasts, playing sports, using the products and services of sports brands, or even communicating between practitioners. Approaches based on augmented reality (AR), virtual reality (VR) and mixed reality (MR) could be adopted, these technologies having a relatively low cost and offering new perspectives at the cognitive level [11].
Based on the integrated model of TAM (technology acceptance model) and perceived contingency model, this study investigated how digital news users’ perceptions of usefulness, ease of use, and contingency of AI-powered news platforms influenced their actual use of the media. The newly added variables to the existing TAM in this integrated model were perceived contingency and user engagement with the technology. The proposed model incorporating these two variables further expands the scope of TAM by explaining the adoption of technologies that consider the adaptive interactivity of current digital technologies [12]. In addition, [13] studied the first connection of critical gaps behind drivers of consumers’ VRTMC (virtual reality technologies for marine conservation) adoption to introduce and synthesize Maslow’s hierarchy of needs together with TAM to understand the factors that affect behavioral intentions and then classify environment-related characteristics according to the five layers of the order while considering the COVID-19 pandemic and the addition of the TAM, all of which influence consumers’ VRTMC adoption. This study offers a unique perspective on combining Maslow’s needs and the TAM and a thorough examination of the factors influencing consumers’ VRTMC adoption: environmental knowledge, biosphere values, risk perception of marine pollution, social susceptibility, and green self-image. Furthermore, diffusion of innovation theory mentions that the innovator, in order to succeed in his commercialization process, needs to understand the personal characteristics of his audience.
More literature is discussing the studies on sustainable tourist behavior based on local wisdom [7,14] for visiting and revisiting destinations. Experiential tourists not only want to see the beautiful scenery of an environmentally friendly area but are also moderated by the development of modern VR experience technology. Hence, VR experience technology becomes a research novelty, particularly in Indonesia. In various previous studies, the VR experience for tourists was awe-inspiring and creates the desire to experience it again, both digitally and in the real world [2]. However, the VR experience must be strengthened with content quality and portability [9]. The research questions of this paper are as follows.
1.
How does sustainable tourist behavior affect the VR experience?
2.
How does the VR experience affect tourist intention to visit and revisit?
3.
How does content quality affect the VR experience?
4.
How does portability affect the VR experience?
A recent study conducted by [15] pointed out the importance of local wisdom to assure sustainability in their research in Bali. In addition, they suggested using information technology such as digital marketing, blockchain, VR and AR. Local wisdom-based sustainable tourism in Indonesia is still under research. Therefore, the main objective is to fill the absence of VR technology to enhance sustainable tourism promotion in the country.
The remaining of this paper is ordered as follows. Section 2 illustrates the state of the art of previous research and hypotheses formulation, Section 3 presents the method of research, Section 4 research findings, Section 5 discussions, Section 6 conclusions and finally, Section 7 presents limitations.

2. State-of-the-Art Review of Literature and Hypothesis Formulation

2.1. Local Wisdom Sustainable Tourist Behavior on VR on Tourist Destination Experiences

Reference [16] shows that digitalization through VR and sustainability represents a synergy that enables stakeholders and tourists to prevent environmental damage caused by tourism during travel and in tourist destination areas. Natural resources and the environment will be maintained, which is also supported by [17]. Further studies conducted by [18] revealed that using VR technology is significant in promoting environmental sustainability because VR users are very impressed with the use of three-dimensional VR, which provides an immersive experience. Reference [14] supports the view that local wisdom—Bapak Aksa (Wisesa), a supreme power (God) to promote sustainability in Central Java Indonesia—has significantly promoted sustainability in tourist behavior. Values–beliefs–norms theory can predict sustainable tourist behavior and should apply in the destination management organization [7].
Reference [18] revealed that VR technology opens numerous opportunities for business interests and controlling environmental damage to maintain sustainability. The advantages of using VR technology can provide a high validity, high-presence VR environment leading to real-world reactions and interactions between humans and VR. Furthermore, [2] revealed that VR technology could save communication costs between sales representatives and tourists, primarily to disseminate sustainability to tourists. For example, VR operators can take three-dimensional videos of 360° panoramas at tourist destinations and provide various information about tours with the theme of sustainability and environmental preservation that triggers the curiosity and fascination of the tourists. Based on the discussion, the hypothesis formulation is as follows.
H1. 
Sustainable tourist behavior affects VR experiences positively and significantly.

2.2. VR Experiences and Tourists’ Visit and Revisits Intentions

VR or virtual reality has become viral by combining virtual and natural to create three-dimensional visualizations [19]. We identify four stages of virtual reality (VR): pure real presence, augmented virtually, currently growing and attracting attentiveness in the tourism business [20]. VR technology is applied to the tourism industry, allowing tourists to experience and feel the sensation when they try VR applications [21]. The researcher also stated that VR experiences include six dimensions: basic VR, 360° video, video replica, live motion, interactive VR, and landscape sensations.
In today’s digital era, technological innovation in visualization is the main key point to destination marketing. VR marketing attributes and tourist satisfaction will affect visit intention [22]. VR travel content consists of telepresence, focused attention, and temporal distortion. Reference [23] confirmed that the VR travel experience creates an immersed feeling and a blunted sensation with the passage of time; this affects the positive experience of tourists visiting tourist destinations that they have experienced in VR. The researchers also revealed that the technological features of VR, vividness, and interactivity would stimulate humans and tourists, affecting the experience evaluation using VR and encouraging behavioral intentions to visit tourist destinations [22].
According to [24], tourist satisfaction is the dominant factor that encourages tourists to visit and revisit the destination. Therefore, the authors suggest a theoretical model improve tourists’ satisfaction model from the perspective of tourists’ motivation and destination image to boost destination revisits.
H2. 
VR experience positively and significantly affects the intention to visit.

2.3. Content Quality of VR Experience

VR allows customers to experience their presence and engagement in three dimensions. VR is a technology of digitalization that brings creations of digitalization to the actual world. VR technology brings customers to a digital creation ecosystem [25]. A study by [26] supports that VR technology could be used for marketing purposes, especially in interacting with customers or prospective customers. The concept of VR technology is interaction with content as objects that are integrated with hardware [27]. VR content is a promotional tool that is widely used in marketing activities. Studies on VR content affect customers’ perceptions and can change their behavior [28]. Current research reveals that VR content is an opportunity for telepresence [29,30], which benefits both intention and attitude. Consumers can have the ability to control the product or service in making decisions to buy products. Studies on VR content increase the capacity of consumers to patronize a product or service [31]. On the other hand, VR content can also increase customers’ perceptions of the quality of the advertised product or service [32].
H3. 
Content Quality Affects the VR experience positively and significantly.

2.4. Portability and VR Experience

Portability is essential for tourists who visit the destination because they carry a mobile phone to communicate and record photos and videos of VR content. Portability is also critical for using mobile devices, which is the perception of their mobile devices [33]. The operators efficiently use their gadgets wherever they are. Therefore, many studies on the adoption of mobile devices reveal that portability on the mobility of tourists has a substantial positive effect on the use of VR. Reference [34] examines the determinants that affect personal acceptance of mobile devices relevant to strengthen VR experiences.
Reference [35] also revealed in their study that portability in streaming media is a crucial factor that positively affects the usefulness of the VR experience. Reference [36] also supports this VR experience; they introduced VR portability devices to provide stimuli through the eyes to enhance the VR experience through VR text spelling and navigation.
H4. 
Portability has a positive and significant effect on the VR experience.

3. Research Method

Respondent Profile

This study was undertaken from April 2022 to August 2022. The respondents were those who visited the vicinity of the tourism destination of Kebon Indah village during the data collection. In sum, 204 respondents were the participants. They were either foreign tourists or domestic tourists. In addition, we conducted convenient purposive sampling for those who visited another vicinity in the area, mostly to enjoy the panorama and learn or experience how to craft Batik natural dyes (Table 1).
The sample data indicate that in terms of gender, most of the respondents were female and foreign tourists in the age bracket 31 to 40 years old, and mostly they had not been visited Kebon. Therefore, the VR destination experiences will have them call the destination physically.

4. Findings

4.1. Location

The location chosen is the natural dye batik community cluster in Bayat Kebon Indah, Central Java, Indonesia. We chose this location because of the natural dye batik community that has continuously been developed by university researchers for six years, as our commitment is to foster and develop small and medium enterprises that are environmentally sound and sustainable. However, since we would attract other vicinity destination tourists to visit Kebon Indah village, we developed VR technology to enable tourists to experience 3-D images of Kebon Indah village through VR gadgets.
We utilized PLS-SEM (Oststeinbek, Germany) as a tool for data analysis. The reason for using PLS-SEM is simple, with the second most common reason being non normal data. Model complexity and formative constructs are now the two most common reasons, with explanatory research and small sample tied to the third [37].

4.2. Outer Model Testing (Measurement Model)

For data analysis, we used Smart-PLS 3.0 software.

4.2.1. Convergent Validity

Convergent validity can be determined using loading factor values. The definition of factor loadings is a value that indicates the relationship among the values of a statement item through a construct indicator that measures the construct. The validity criterion is the factor loading >0.7; [37]. Using Smart-PLS version 3.0, loading factor values were obtained as follows (Table 2).
In Table 3, the value of cross-loading indicates that the relationship value concerning constructs is higher than the relationship with other constructs. The constructs have good discriminant validity. Cross-loading is another method to determine discriminant validity by looking at the cross-loading value. If the loading value of each item on the construct is larger than the cross-loading value, then the standard is met.
The next gauge assesses the root of the AVE value with the correlation amongst constructs. The criterion is that the root value of AVE is larger than the interaction amongst constructs. A measurement model would have an improved validity of discriminant value if AVE’s square root value in each construct is larger than the relationship of the two model’s constructs. The minimum necessity of the AVE value is more than 0.50 [37,38,39]. Therefore, all AVE’s result values and square roots have met the minimum requirement (Table 4):
Table 4 depicts that the value of AVE for all constructs is more significant than 0.50. According to [35], AVE larger than 0.5 is significant, and the most significant value is 0.703 on the sustainable tourist behavior variable, 0.665 for the content quality variable, 0.671 for the portability variable, 0.663 for virtual reality destination experience and 0.663 for visit intention. Therefore, these values meet the minimum standard of 0.50. The following measure contrasts the value of square root with association amongst constructs in the research model. Table 4 shows that the value of the AVE square root in each construct is more significant than the correlation value. Therefore, the constructed model has good discriminant validity. The composite reliability computation shows that the value is more than 0.7 and AVE > 0.5. Therefore, the value has good reliability and meets the minimum standards.
The results reveal the association amongst constructs with the value of square root AVE in the Fornell–Larcker Criterion, as follows (Table 5 and Table 6).
Hetero- and monotraits described the discriminant validity test. The discriminant validity meets the standard if the HTMT value is less than 0.9.

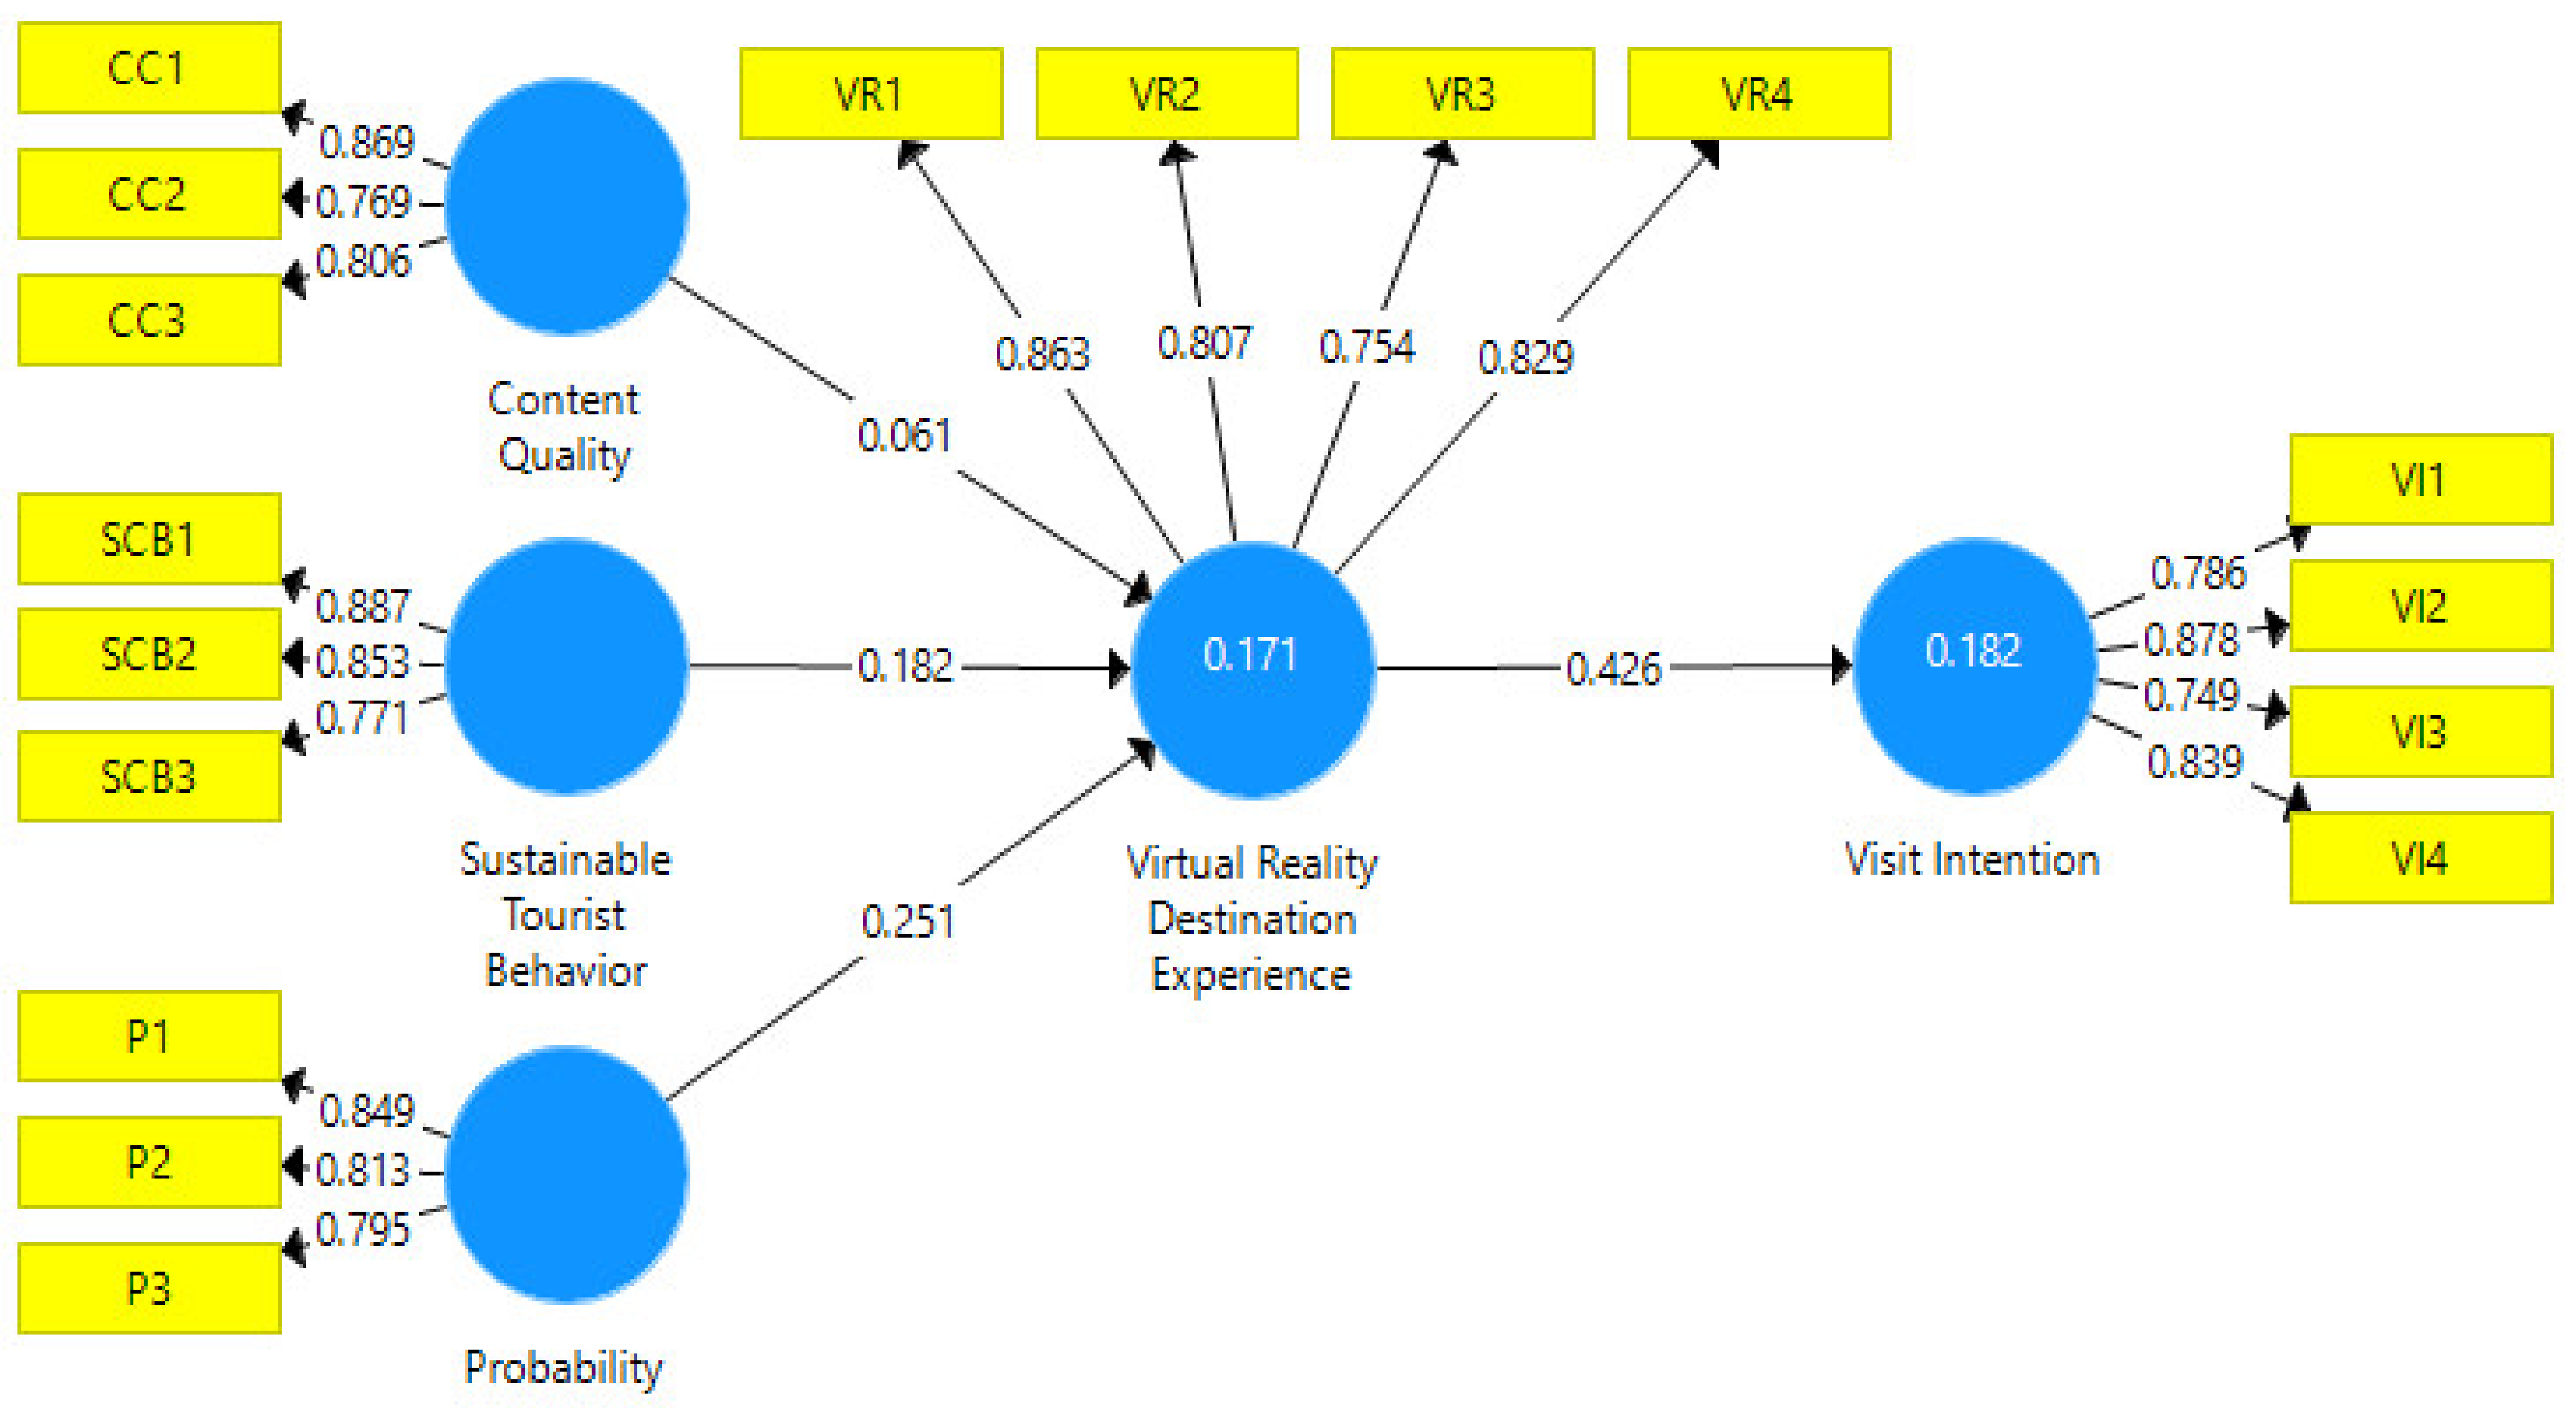
4.2.2. Hypothesis Tests

We undertake hypothesis tests to assess the inner structural model, which consists of coefficients parameter, and T-statistics. The significance values amongst constructs, T-statistics, and p-values need to be considered. The test utilizes Smart-PLS SEM 3.0 software through bootstrapping testing. The criteria used in this research were a T-statistic larger than 1.96, and a significance level of p-value is 0.05 coupled with a positive beta coefficient. The results depict the model in Figure 1. The hypotheses are significantly proven, except the content quality variable (Table 7).

5. Discussion

Statistical calculations using Smart-PLS version 3 reveal that sustainable tourist behavior significantly affects the use of VR destination experiences 0.035 < 0.05. Values, beliefs, and norms of foreign as well as domestic tourists believe it to preserve the environment, even when visiting tourist destinations that are environmentally sound and maintain sustainability. This study is supported by various previous studies, including [40,41,42]. It revealed that the individual taking of tourists in contexts, including eco-tourism, ecosystem, and sustainability, is based on the belief in the existence of values, beliefs, and norms (VBN). VBN is a model that explains individual behavior actions or intentions that are determined by the existence of fundamental concepts from values, beliefs, and norms. VBN extends the norm activation model that focuses on specific opinions on awareness and willingness to take responsibility for environmental preservation. This study also identifies the characteristics of tourists who come for essential points that guide tourists, including the existence of biosphere, generous, and egoistic values. Altruistic values are a prominent aspect that leads to prosocial environmental behavior. The current ecological approach paradigm emphasizes the importance of reciprocal relations between humans and their environment. Meanwhile, awareness is a consequence of a belief related to the condition of individuals actively protecting the environment. The individual norm is a consequence of the moral obligation to minimize environmental degradation.
Virtual reality (VR) destination experiences have significantly influenced tourist visit intention (TVI). VR destination experiences significantly influence tourist visit intention, since p-value < 0.05 or 0.00 < 0.05. This study revealed that tourists who initially only visited the vicinity of tourist destinations of Kebon Indah village had a solid intention to visit Kebon Indah tourist destinations. VR experiences give the impression of immersion, interaction, usability, and illusion to foreign or domestic tourists. This study integrates various experiences of tourists, including immersion, interaction, usability, and illusion. The findings of this research are consistent with the results of [20,43,44]. Various components of VR experiences affect satisfaction with using VR. VR operators were shooting 360° movies and providing visitors with multiple themes of travel destinations, including a budget, dark tourism, religious or sharia tourism, games, and simulation for various ages, genders, and origins of visitors.
Tour operators can optimally take advantage of VR technology with immersion to experience being present in the real world without being physically present. VR technology can also save time and costs by allowing direct communication between tourists and tourist marketers. Besides that, VR connoisseurs will experience a virtual journey of excitement to provoke the curiosity of tourists to visit Kebon Indah tourist destinations physically. In this study, VR experience significantly influences the tourist respondents’ intention to stay. Indicators of visit intentions are (a) tourists looking for something new, (b) learning about local knowledge and wisdom, e.g., learning to make batik on a piece of cloth, coloring with natural dyes, and putting wax on the cloth as a separator between colors. Kebon Indah offers visitors to see and live in the village of Kebon Indah to enjoy not only environmental views but also to practice preserving the environment by introducing recycling processes in the batik industry. In addition, in the spirit of togetherness, the local inhabitants facilitate the engagement program, for instance, to live.
Content quality has not significantly influenced VR destination experiences. The proposed hypothesis has rejected the influence between content quality and VR destination experiences 0.381 > 0.05. Content quality components are ease of use, degree of users’ immersion, visual attractiveness, and quality of 3-D images. The better the video quality and 3-D images, the better the user’s immersion in the VR experience; the content quality also affects the immersive environment for the user’s perceived performance [45,46]. Ease of use is the extent to which a person considers that utilizing VR hardware will require less effort to operate the gadget. In other words, ease of use gives users access to mental effort [27]. Finally, visual attractiveness is crucial to providing a tourist destination experience through VR. Visual beauty is related to being an ICT aesthetic product: when users reject content quality, this indicates that the creation of existing VR content quality is not what the users want. The VR content happens because the design of VR is in the introductory stage, and there needs to be improvement and refinement so that the quality of the content is better. Respondents’ suggestions and insight to improve the VR technology have benefited forthcoming 3-D image development.
Portability significantly influenced VR destination experiences, p-value and particularly 5%. The hypothesis result is 0.005 < 0.05; thus, this study passes the hypothesis test for thehe components of easy to carry, mobility, and hedonic value. Portability is a principal factor in mobile devices; portability is also defined as users’ perception of VR gadgets [34,35,47]. Users can easily carry and use their gadgets wherever they are. The findings of this study provide evidence that portability has a significant impact on VR experiences. In other words, based on user experience, they prefer portable devices such as mobile phones and tablets. More prominent media, such as tablets and desktops, are also desirable when tourists are not transferable. Hedonic value in the form of pleasure or emotional response to watching VR, such as playfulness and having fun, is more focused on portable devices. This happens because VR content quality has been adequately applied to small-screen gadgets like mobile phones. This research finding differs from previous similar research in Indonesia, which focuses on sustainability rather than the application of VR (virtual reality). Reference [48] found that environmental problems influenced the sustainability of Indonesia’s national parks. The impact could be decreasing tourist visits to national parks. National parks in Indonesia have a clear legal basis that regulates boundaries and guidelines for managing, controlling, and conserving biodiversity, natural resources, wildlife, ecosystems, water resources, zoning systems, and various detailed regulations. In addition, [49] analyzed an event model of culture and tourism, harmonious culture, and sustainable tourism. The Indonesian government promotes village tourism by involving more villagers to achieve village independence and development. The program has faced various obstacles due to the development of massive money-oriented tourism with less attention to environmental impairment [4,50].
The novelty of the study following up the previous studies in Indonesia is that VR application in local wisdom sustainable tourism has yet to be applied until now in Indonesia. Previous studies in Indonesia strengthen the findings [48,49,50]. For the search in VOS viewer for VR sustainable tourism in Indonesia, the result is null. The use of information management in sustainable tourism was also suggested by [1]. However, their research focused on the use of block-chain rather than VR in sustainable tourism improvement. We can describe that [1] suggested using a management information system. We also employed a management information system, but the focus of our research was on the application of VR.

6. Conclusions

Sustainable tourist behavior significantly affects the use of VR destination experiences, portability has a significant impact on VRDE, sustainable tourism behavior has a significant impact on VRDE, and VRDE also has a significant impact on visit intentions; however, the content quality has not had a significant impact on VRDE. Previous studies on sustainable tourist behavior moderated by VRDE and its impact on visit intention had not been done in Indonesia. Synergizing sustainability with the help of digital technology in various forms (block-chain, Internet of Things, artificial intelligence) will be a challenge to carry out in Indonesia in the next research agenda.

7. Limitation

This study has the limitation that the technology of VR is in an early stage of development. Users maybe feel unpleasant wearing VR glasses. Therefore, VR and its tools must improve to facilitate user-friendly VR. The limitation also addresses why the model development rejected the hypothesis between content quality and VR destination experiences. The model encourages the following research agenda to break down specifically sustainable tourist behavior and VR destination experiences to include TAM (technological acceptance model). In addition, the study has the limitation that technology in the form of VR has not yet reached the time dimension because sustainability is nothing but a concern about what will happen in the future. The second is the interaction dimension between the economic system and the system of natural resources and the environment. The future agenda is the interaction between technology utilization to facilitate static and dynamic sustainability, such as sustainability from a static standpoint, defined as the use of renewable natural resources at a constant rate of technology, while sustainability from a dynamic perspective is defined as nonrenewable resource utilization with ever-changing technological levels. Due to multidimensional and multiple interpretations, the experts agreed to conclude that “Sustainable development is development that meets the needs of the current generation this without compromising the ability of future generations to meet their needs.”

Author Contributions

Software, N.A.P. and U.; Validation, A.; Data curation, Y.W. and A.N.C.; Writing—Original draft, V.D.W.A.; Funding acquisition, I.D.P. All authors have read and agreed to the published version of the manuscript.

Funding

The APC is partially sponsored by Indonesia Ministry of Education, Culture and Research, Grant number: Kedaireka 176/E1/KS.06.02/2022.

Institutional Review Board Statement

The study was conducted according to the guidelines of the Declaration of Helsinki, and approved by the Ethics Committee of Dian Nuswantoro University (protocol code: No. M017/A.15.01/KEP-03/X/2022 and approval date: 14 October 2022).

Data Availability Statement

Acknowledgments

The authors would like to express their gratitude to the Kedaireka scheme under the auspices of the Indonesian Ministry of Education, Culture, Research, and Technology for the generous research fund.

Conflicts of Interest

The authors declare no conflict of interest.

References

  1. Erol, I.; Neuhofer, I.O.; Dogru, T.; Oztel, A.; Searcy, C.; Yorulmaz, A.C. Improving sustainability in the tourism industry through blockchain technology: Challenges and opportunities. Tour. Manag. 2022, 93, 1–20. [Google Scholar] [CrossRef]
  2. Wu, H.C.; Ai, C.H.; Cheng, C.C. Virtual reality experiences, attachment and experiential outcomes in tourism. Tour. Rev. 2020, 75, 481–495. [Google Scholar] [CrossRef]
  3. Garjan, H.S.; Paydar, M.M.; Divsalar, A. A sustainable supply chain for a wellness tourism center considering discount and quality of service. Expert Syst. Appl. 2022, 211, 1–18. [Google Scholar] [CrossRef]
  4. Ahmad, N.; Youjin, L.; Hdia, M. The role of innovation and tourism in sustainability: Why is environment-friendly tourism necessary for entrepreneurship? J. Clean. Prod. 2022, 379, 1–16. [Google Scholar] [CrossRef]
  5. Huang, Z.; Weng, L.; Bao, J. How do visitors respond to sustainable tourism interpretations? A further investigation into content and media format. Tour. Manag. 2022, 92, 1–13. [Google Scholar] [CrossRef]
  6. Sushchenko, O.; Prokopishyna, O.; Kozubova, N. Eco-Friendly Behavior of Local Population, Tourists and Companies as a Factor of Sustainable Tourism Development. Int. J. Eng. Technol. 2018, 7, 514–518. [Google Scholar] [CrossRef]
  7. Park, C.Y.; Lee, S.J.; Lee, C.-K.; Reisinger, Y. Volunteer tourists’ environmentally friendly behavior and support for sustainable tourism development using Value-Belief-Norm theory: Moderating role of altruism. J. Destin. Mark. Manag. 2022, 25, 100712. [Google Scholar] [CrossRef]
  8. An, S.; Choi, Y.; Lee, C.K. Virtual travel experience and destination marketing: Effects of sense and information quality on flow and visit intention. J. Destin. Mark. Manag. 2021, 19, 1–10. [Google Scholar] [CrossRef]
  9. Yang, H.; Han, S.Y. Understanding virtual reality continuance: An extended perspective of perceived value. Online Inf. Rev. 2021, 45, 422–439. [Google Scholar] [CrossRef]
  10. Glebova, E. Définir la réalité étendue dans les sports: Limitations, facteurs et opportunités. Manag. Du Sport 2020, 3, 271–293. [Google Scholar] [CrossRef]
  11. Milgram, P.; Kishino, F. A Taxonomy of Mixed Reality Visual Displays. IEICE Trans. Inf. Syst. 1994, 77, 1321–1329. [Google Scholar]
  12. Lim, J.S.; Zhang, J. Adoption of AI-driven personalization in digital news platforms: An integrative model of technology acceptance and perceived contingency. Technol. Soc. 2022, 69, 1–10. [Google Scholar] [CrossRef]
  13. Yuen, K.F.; Chua, J.; Li, K.X.; Wang, X. Consumer’s adoption of virtual reality technologies for marine conservation: Motivational and technology acceptance perspectives. Technol. Forecast. Soc. Change 2022, 182, 1–12. [Google Scholar] [CrossRef]
  14. Aryanto, V.D.W. The Role of Local Wisdom-Based e-Eco-Innovation to Promote Firms’ Marketing Performance. Int. J. Soc. Ecol. Sustain. Dev. 2017, 8, 17–31. [Google Scholar] [CrossRef] [Green Version]
  15. Naja, D.A.; Suprayogi, S.; Marfai, M.A.; Mardiatno, D. A study on the social network analyses of dive centers and sustainable tourism development in pemuteran bali, indonesia. Geoj. Tour. Geosites 2021, 36, 603–615. [Google Scholar] [CrossRef]
  16. Talwar, S.; Kaur, P.; Nunkoo, R.; Dhir, A. Digitalization and sustainability: Virtual reality tourism in a post pandemic world. J. Sustain. Tour. 2022, 1–28. [Google Scholar] [CrossRef]
  17. Schiavone, F.; Appio, F.P.; Mora, L.; Risitano, M. The strategic, organizational, and entrepreneurial evolution of smart cities. Int. Entrep. Manag. J. 2020, 16, 1155–1165. [Google Scholar] [CrossRef]
  18. Jolink, A.; Niesten, E. Virtual reality and sustainable behavior in business. Clean. Responsible Consum. 2021, 2, 1–7. [Google Scholar] [CrossRef]
  19. Wang, J.; Wang, S.; Xue, H.; Wang, Y.; Li, J. Green image and consumers’ word-of-mouth intention in the green hotel industry: The moderating effect of Millennials. J. Clean. Prod. 2018, 181, 426–436. [Google Scholar] [CrossRef]
  20. Beck, J.; Rainoldi, M.; Egger, R. Virtual reality in tourism: A state-of-the-art review. Tour. Rev. 2019, 74, 586–612. [Google Scholar] [CrossRef]
  21. Goodwin, T. The 6 Dimensions of Virtual Reality. 2019. Available online: https://www.forbes.com/sites/tomfgoodwin/2016/04/20/the-6-dimensions-of-virtual-reality/?sh=55213d418be2 (accessed on 30 September 2022).
  22. Van Kerrebroeck, H.; Brengman, M.; Willems, K. Escaping the crowd: An experimental study on the impact of a Virtual Reality experience in a shopping mall. Comput. Hum. Behav. 2017, 77, 437–450. [Google Scholar] [CrossRef]
  23. Lee, J.; Kim, J.; Choi, J.Y. The adoption of virtual reality devices: The technology acceptance model integrating enjoyment, social interaction, and strength of the social ties. Telemat. Inform. 2019, 39, 37–48. [Google Scholar] [CrossRef]
  24. Tang, H.; Wang, R.; Jin, X.; Zhang, Z. The Effects of Motivation, Destination Image and Satisfaction on Rural Tourism Tourists&rsquo; Willingness to Revisit. Sustainability 2022, 14, 1938. [Google Scholar] [CrossRef]
  25. Boyd, D.E.; Koles, B. Virtual reality and its impact on B2B marketing: A value-in-use perspective. J. Bus. Res. 2019, 100, 590–598. [Google Scholar] [CrossRef]
  26. Grewal, D.; Hulland, J.; Kopalle, P.K.; Karahanna, E. The future of technology and marketing: A multidisciplinary perspective. J. Acad. Mark. Sci. 2020, 48, 1–8. [Google Scholar] [CrossRef] [Green Version]
  27. Manis, K.T.; Choi, D. The virtual reality hardware acceptance model (VR-HAM): Extending and individuating the technology acceptance model (TAM) for virtual reality hardware. J. Bus. Res. 2019, 100, 503–513. [Google Scholar] [CrossRef]
  28. Trabelsi-Zoghlami, A.; Touzani, M. How real are virtual experiences? Eur. J. Mark. 2019, 53, 1612–1636. [Google Scholar] [CrossRef]
  29. Martínez-Navarro, J.; Bigné, E.; Guixeres, J.; Alcañiz, M.; Torrecilla, C. The influence of virtual reality in e-commerce. J. Bus. Res. 2019, 100, 475–482. [Google Scholar] [CrossRef]
  30. Pleyers, G.; Poncin, I. Non-immersive virtual reality technologies in real estate: How customer experience drives attitudes toward properties and the service provider. J. Retail. Consum. Serv. 2020, 57, 102–175. [Google Scholar] [CrossRef]
  31. Meißner, M.; Pfeiffer, J.; Pfeiffer, T.; Oppewal, H. Combining virtual reality and mobile eye tracking to provide a naturalistic experimental environment for shopper research. J. Bus. Res. 2019, 100, 445–458. [Google Scholar] [CrossRef]
  32. Beuckels, E.; Hudders, L. An experimental study to investigate the impact of image interactivity on the perception of luxury in an online shopping context. J. Retail. Consum. Serv. 2016, 33, 135–142. [Google Scholar] [CrossRef]
  33. Park, E.; Sung, J.; Cho, K. Reading experiences influencing the acceptance of e-book devices. Electron. Libr. 2015, 33, 120–135. [Google Scholar] [CrossRef]
  34. Merhi, M.I. Factors influencing higher education students to adopt podcast: An empirical study. Comput. Educ. 2015, 83, 32–43. [Google Scholar] [CrossRef]
  35. Yang, H.; Lee, H. Understanding user behavior of virtual personal assistant devices. Inf. Syst. E-Bus. Manag. 2019, 17, 65–87. [Google Scholar] [CrossRef]
  36. Mahmood, T.; Rehman, U. A novel approach towards bipolar complex fuzzy sets and their applications in generalized similarity measures. Int. J. Intell. Syst. 2022, 37, 535–567. [Google Scholar] [CrossRef]
  37. Hair, J.; Hollingsworth, C.L.; Randolph, A.B.; Chong, A.Y.L. An updated and expanded assessment of PLS-SEM in information systems research. Ind. Manag. Data Syst. 2017, 117, 442–458. [Google Scholar] [CrossRef]
  38. Purwanto, A.; Sudargini, Y. Partial Least Squares Structural Squation Modeling (PLS-SEM) Analysis for Social and Management Research: A Literature Review. J. Ind. Eng. Manag. Res. 2021, 2, 114–123. [Google Scholar] [CrossRef]
  39. Memon, M.A.; Ting, H.; Ramayah, T.; Chuah, F.; Cheah, J.-H. Mediation Analysis: Issues and Recommendations. J. Appl. Struct. Equ. Model. 2018, 1, i–xiii. Available online: https://www.researchgate.net/profile/Mumtaz-Memon/publication/322293701_Mediation_Analysis_Issues_and_Recommendations/links/5a54de96aca2726c0ff20031/Mediation-Analysis-Issues-and-Recommendations.pdf (accessed on 7 October 2022). [CrossRef]
  40. Han, H.; Hwang, J.; Lee, M.J. The value–belief–emotion–norm model: Investigating customers’ eco-friendly behavior. J. Travel Tour. Mark. 2017, 34, 590–607. [Google Scholar] [CrossRef]
  41. Yoo, C.-K.; Yoon, D.; Park, E. Tourist motivation: An integral approach to destination choices. Tour. Rev. 2018, 73, 169–185. [Google Scholar] [CrossRef]
  42. Kim, J.; Shinaprayoon, T.; Ahn, S.J. Virtual Tours Encourage Intentions to Travel and Willingness to Pay via Spatial Presence, Enjoyment, and Destination Image. J. Curr. Issues Res. Advert. 2022, 43, 90–105. [Google Scholar] [CrossRef]
  43. Wu, H.-C.; Cheng, C.-C. Relationships between technology attachment, experiential relationship quality, experiential risk and experiential sharing intentions in a smart hotel. J. Hosp. Tour. Manag. 2018, 37, 42–58. [Google Scholar] [CrossRef]
  44. Wu, H.-C.; Cheng, C.-C.; Ai, C.-H.; Chen, G. Relationships between restaurant attachment, experiential relationship quality and experiential relationship intentions: The case of single friendly restaurants in Taiwan. J. Hosp. Tour. Manag. 2019, 40, 50–66. [Google Scholar] [CrossRef]
  45. Shin, D.-H. Conceptualizing and measuring quality of experience of the internet of things: Exploring how quality is perceived by users. Inf. Manag. 2017, 54, 998–1011. [Google Scholar] [CrossRef]
  46. Aboelmaged, M.G. Predicting the success of Twitter in healthcare. Online Inf. Rev. 2018, 42, 898–922. [Google Scholar] [CrossRef]
  47. Yang, G.; Chen, Y.T.; Zheng, X.L.; Hwang, G.J. From experiencing to expressing: A virtual reality approach to facilitating pupils’ descriptive paper writing performance and learning behavior engagement. Br. J. Educ. Technol. 2021, 52, 807–823. [Google Scholar] [CrossRef]
  48. Reindrawati, D.Y.; Rhama, B.; Hisan, U.F.C. Threats to Sustainable Tourism in National Parks: Case Studies from Indonesia and South Africa. Afr. J. Hosp. Tour. Leis. 2022, 11, 919–937. [Google Scholar] [CrossRef]
  49. Astawa, I.P.; Triyuni, N.N.; Santosa, I.D.M.C. Sustainable tourism and harmonious culture: A case study of cultic model at village tourism. J. Phys. Conf. Ser. 2018, 953, 1–9. [Google Scholar] [CrossRef]
  50. Butarbutar, R.; Soemarno, S. Environmental Effects of Ecotourism in Indonesia. J. Indones. Tour. Dev. Stud. 2013, 1, 97–107. [Google Scholar] [CrossRef]
Figure 1. Research Model Results.
Sustainability 15 00446 g001
Table 1. Sample Analysis.
ItemClassificationNumber of PeoplePercentage
GenderMale9647
Female10853
AgeUnder 1780.04
18–306230
31–407938
41–503517
51–602014.96
18–306230
OriginForeign13264
Domestic7236
Visit KebonNot Yet20098
First Time42
Source: Primary Data Processed (2022).
Table 2. Loading Factor Values.
VariablesIndicatorsIndicators NotationOuter Loading
Sustainable Tourist BehaviorValueSCB10.887
BeliefSCB20.853
NormsSCB30.771
VR Destination ExperiencesImmersionVR10.863
InteractionVR20.807
UsabilityVR30.754
IllusionVR40.829
Visit IntentionNewness seekingVI10.786
Learning local knowledgeVI20.878
Natural environmentVI30.749
Social environmentVI40.839
Content QualityEase of useCC10.869
Degree of users’ immersionCC20.769
Visual attractiveness &
quality of 3-D images
CC30.806
PortabilityEase of utilization (easy to carry)P10.849
MobilityP20.813
Hedonic valueP30.795
Source: Primary Data Processed (2022).
Table 3. Cross-Loading Values.
Content_
Quality
ProbabilitySustainable_
Tourist_
Behavior
Virtual Reality_
Destination_
Experience
Visit Intention
CC10.8690.2480.3230.2000.363
CC20.7690.2490.3470.1360.262
CC30.8060.3100.3400.1890.342
P10.3180.8490.4520.3320.457
P20.2510.8130.5170.3000.481
P30.2370.7950.4120.2830.513
SCB10.4130.5270.8870.3340.607
SCB20.3130.4510.8530.2870.576
SCB30.2870.4270.7710.2470.560
VI10.3010.4810.4950.3470.786
VI20.3580.4870.6250.3800.878
VI30.3280.4660.5240.3030.749
VI40.3220.4840.6060.3540.839
VR10.1870.3480.3300.8630.404
VR20.1630.2920.2910.8070.354
VR30.1720.3230.2520.7540.309
VR40.1920.2420.2490.8290.307
Source: Primary Data Processed (2022).
Table 4. Average Variance Extracted Value (AVE).
Composite ReliabilityAverage Variance Extracted (AVE)
Content_Quality0.8560.665
Portability0.8590.671
Sustainable_Tourist_Behavior0.8760.703
Virtual Reality_Destination_Experience0.8870.663
Visit Intention0.8870.663
Source: Primary Data Processed (2022).
Table 5. Fornell–Larcker Criterion.
Content_
Quality
ProbabilitySustainable_
Tourist_
Behavior
Virtual Reality_
Destination_
Experience
Visit
Intention
Content_Quality0.816
Probability0.3300.819
Sustainable_Tourist_
Behavior
0.4090.5620.838
Virtual Reality_Destination_Experience0.2190.3740.3480.814
Visit Intention0.4020.5880.6920.4260.814
Source: Primary Data Processed (2022).
Table 6. Heterotraits and Monotraits (HTMT).
Content_
Quality
ProbabilitySustainable_
Tourist_
Behavior
Virtual Reality_
Destination_
Experience
Visit
Intention
Content_Quality
Portability0.434
Sustainable_Tourist_
Behavior
0.5270.724
Virtual Reality_Destination_Experience0.2720.4660.422
Visit Intention0.5010.7480.8560.508
Source: Primary Data Processed (2022).
Table 7. Path Coefficient Results.
Original Sample (O)Sample Mean (M)Standard Deviation (STDEV)T Statistics (|O/STDEV|)p Values
Content_Quality → Virtual Reality_Destination Experience0.0610.0670.0700.8760.381
Portability → Virtual Reality_Destination Experience0.2510.2510.0882.8400.005
Sustainable_Tourist_Behavior → Virtual Reality_Destination Experience0.1820.1840.0862.1150.035
Virtual Reality_Destination_Experience → Visit Intention0.4260.4300.0725.8990.000
Significance α = 0.05. Source: Primary Data Processed (2022).
Disclaimer/Publisher’s Note: The statements, opinions and data contained in all publications are solely those of the individual author(s) and contributor(s) and not of MDPI and/or the editor(s). MDPI and/or the editor(s) disclaim responsibility for any injury to people or property resulting from any ideas, methods, instructions or products referred to in the content.

