1. Introduction
1.1. Background
An increase in the presence of atmospheric gases contributes to the warming of the planet by trapping heat in the atmosphere. Carbon dioxide is the main contributor to greenhouse gas (GHG) emissions at 79%, followed by methane and nitrous oxide at 11% and 7%, respectively [
1]. With that in mind, an increasing number of countries around the world are seeking to reach net-zero emissions. That is, achieving a balance between the GHGs put into the atmosphere and those taken out [
2]. In the U.S., building operations contribute to about 30% of GHG emissions and transportation generates about 27% [
3]. Oftentimes, city planners and national level leaders address the net-zero problem in a fragmented approach, with efforts for improving emissions that focus on individual sectors (e.g., energy, buildings, mobility) [
4]. While this fragmented approach can help move individual sectors towards their net zero objectives, integrated city-wide solutions can result in a greater impact [
4]. Cities are complex systems of infrastructure sectors, which are comprised of multiple interacting subsystems. While each of the city subsystems may have a preference to operate as independently as possible from the other subsystems, collaboration is often needed to achieve common objectives. In order to achieve net-zero objectives, digital tools will be needed to help visualize vast amounts of multi-disciplinary data, and identify opportunities at the intersections between subsystems [
5]. Such tools will assist planners in determining the best-integrated approach to designing and managing city subsystems to meet net-zero (NZ) goals.
An NZ-focused approach to the smart city [
6] concept includes all infrastructure aspects of cities, not just buildings. For instance, particular interest in using electricity as an alternative vehicle fuel has grown in recent years. Although electric vehicles (EVs) mitigate transportation GHG emissions, they increase electricity consumption [
6], which may increase GHG emissions in the energy production sector. Unregulated charging behaviors can increase the peak load of the power grid and charging costs while decreasing system reliability [
7]. Therefore, achieving NZ emissions will involve the simultaneous transformation of several, interconnected infrastructure systems from transport and housing to energy and manufacturing. A few examples of infrastructure integration to achieve net-zero goals include using geothermal energy as a heat source for building cooling and heating [
8], using extracted thermal energy from PV cells for water or air heating [
9], using thermal energy from the sun for water heating [
10], using biogas from building waste to fuel solid oxide fuel cells [
11], and using wind energy to fuel water desalination systems [
12].
Existing tools provide a standard dashboard with minimal visualization and input customization. The net zero engineering support tool (NEST) is a novel tool because the traditionally siloed resources are linked directly to a data warehouse, unique to INL, which then outputs usable information for visualization. By digitizing this process, there is a near real-time update capability.
1.2. Literature Review
The literature shows several initiatives focused on the digitization of NZ effort at the individual sector level. The net-zero America (NZA) study uses a systems approach to define a pathway to reach NZ by 2050 by modeling the energy system infrastructure [
13]. The NZA study indicates that the Biden administration’s NZ by 2050 goal will not be met without a combination of clean energy hubs and infrastructure improvement. A process for understanding the importance of NZ initiatives and increasing the rate of acceptance of NZ technologies are outlined by Moghadassi et al. (2021) [
14]. Though this research outlines the importance of standardized practices, there is a lack of emphasis placed on digitization and the incorporation of the Internet of Things (IoT), which provides a unique platform for easily sharing data and best practices.
O’Flynn et al. (2021) use a Science-Based Targets Initiative (SBTi) to feasibly construct potential pathways for a UK university to achieve carbon NZ by 2030 [
15]. Though this study uses emissions data and various carbon-reducing methods to achieve carbon NZ, there is a lack of digital visualization of campus maps and progress. Ghalebani and Das (2017) used a model-based framework to optimize incentive programs to promote net-zero energy buildings (NZEBs) by developing a mixed integer program that outputs which incentive program would provide the best return on investment based on the commercial building type [
16]. An NZEB ensures an optimized building performance that considers uncertainties associated with electricity consumption and production [
17]. Energy systems with higher values of uncertainty consume more electricity sourced from fossil fuels, which increases carbon emissions. Researchers in New Zealand have initiated the development of zero carbon building practices to achieve carbon NZ by 2050 [
18]. Though standardized practices are beneficial going forward, this study lacks a systematic process for addressing existing buildings that significantly contribute to emissions.
Digital twins (DTs) have been used as an approach to identify existing system elements (buildings, vehicles, generation facilities, etc.) that require modifications to reach NZ [
19]. These DTs help the stakeholder decide what internal components should be replaced to improve efficiency and move toward an NZEB. Existing DT platforms, such as Twinview, store DTs and their associated systems data to be viewed on a single dashboard [
20]. This DT warehouse minimizes GHG emissions during building modification by minimizing modification construction time and maximizing operational performance. Shubbar et al. (2021) use Integrated Environmental Solutions Virtual Environmental software modeling to analyze the current energy performance and emissions of a single industrial building in the UK. This methodology incorporates data and digital visualization; however, it is limited to a single building [
21]. Though DTs are beneficial for identifying system improvement, there is a lack of visualized relationship between current electricity consumption data, emissions data, and the associated facilities. An integrated approach would provide decision makers with a holistic perspective for construction planning. NEST is a part of a bigger ecosystem, powered by its back-end capabilities: primarily predictive models fueled by the data-science approach to the diverse data sources, aggregated in one warehouse.
1.3. Idaho National Laboratory Initiative
INL set a goal to achieve NZ emissions by 2031 by eliminating or offsetting all of the GHG emissions from its 357 buildings, 605 vehicles, and approximately 5400 employees spread over its roughly 900-square-mile campus. INL will eliminate emissions by replacing older technologies with newer or cleaner technologies [
22]. Achieving NZ does not mean INL will not produce any GHG emissions, but any GHGs produced will be offset by carbon-capture technologies. Among other methods, INL shall reduce its reliance on grid power, receiving electricity obtained by the burning of fossil fuels and replacing them with its own GHG emission-free power. It is important to understand the GHG reduction potential (GHGRP) of every activity in synergy with the others to avoid oversizing the carbon sequestration and green power generation facilities. Every activity implemented to eliminate a
e source has a certain
e footprint associated with new materials mining and manufacturing, good transportation, installation and construction, decommissioning, and utilization. Therefore, it is important to size and scope these activities in such a way that minimizes cost and
e overhead.
Though INL may expand initiatives in the future to include waste NZ or water NZ, this paper is focused on the current initiative defined by INL’s NZ program.
1.4. Systems Engineering Approach
Approaching the INL NZ initiative with a systems engineering approach allows for the recognition of autonomous participants within a system working toward both independent and shared goals [
23]. In this scenario, the individual buildings are the autonomous systems. A state of the art representation of these complex systems is achieved by using DTs.
Applying a systems thinking approach to the complex challenge of NZ emission can provide an integrated solution to achieving target emissions. Systems engineering is defined by the International Council on Systems Engineering (INCOSE) as “a transdisciplinary and integrative approach to enable the successful realization, use, and retirement of engineered systems, using systems principles and concepts, and scientific, technological, and management methods.” INL as a holistic complex of buildings, vehicles, and a nation-leading nuclear energy production research facility poses a unique showcase to demonstrating a systems engineering approach to the NZ challenge.
1.5. Scope and Objectives
This work aims to provide a comprehensive visualization and data processing web-based tool for INL stakeholders to use when engaging in strategic planning to achieve carbon emissions reduction. Traditional methodologies for NZ achievement planning lack the variable customization and mapping integration our tool provides. Using NEST allows INL stakeholders to adjust project schedules on an as-needed basis to feasibly achieve the NZ initiative.
The remainder of this paper proceeds as follows:
Section 2 describes the multi-level framework used to integrate and visualize existing data used to predict future
e emissions;
Section 3 provides the results obtained when applying the framework to INL’s EV fleet transition;
Section 4 concludes with a discussion on current achievements and ideas for future research directions.
2. Methodology
The INL NZ strategy team is seeking tools to visualize the impact of actions taken to reduce GHG emissions and exactly measure their aggregated impact. NEST shall provide guidance towards sizing and scheduling of clean power generation facilities (e.g., electricity and hydrogen) and carbon capture facilities meant to offset unavoidable emissions; as well as a means to verify that the NZ goal is achieved by 2031. A systems engineering approach was used to identify stakeholder requirements to build NEST, which are defined and used as a foundation for functionality requirements, and thus, component determination.
2.1. Data Ingress: Digital Thread
A digital thread is a framework that demonstrates communication between traditionally independent systems [
24]. Because INL is a large institution that expands into several domains, relevant data to the NZ strategy team were stored in four different systems: (1) Microsoft (MS) Excel, (2) P6 (Schedules), (3) SkySpark (Energy Usage), and (4) iMap (GIS Data). The Excel spreadsheets are manually updated monthly to represent current electricity and natural gas consumption and their associated, calculated
e emission values. P6 is a project management software that is used to plan, manage, and maintain intended, active, and completed projects. INL’s use of P6 was to identify NZ-relevant projects and identify intermediate
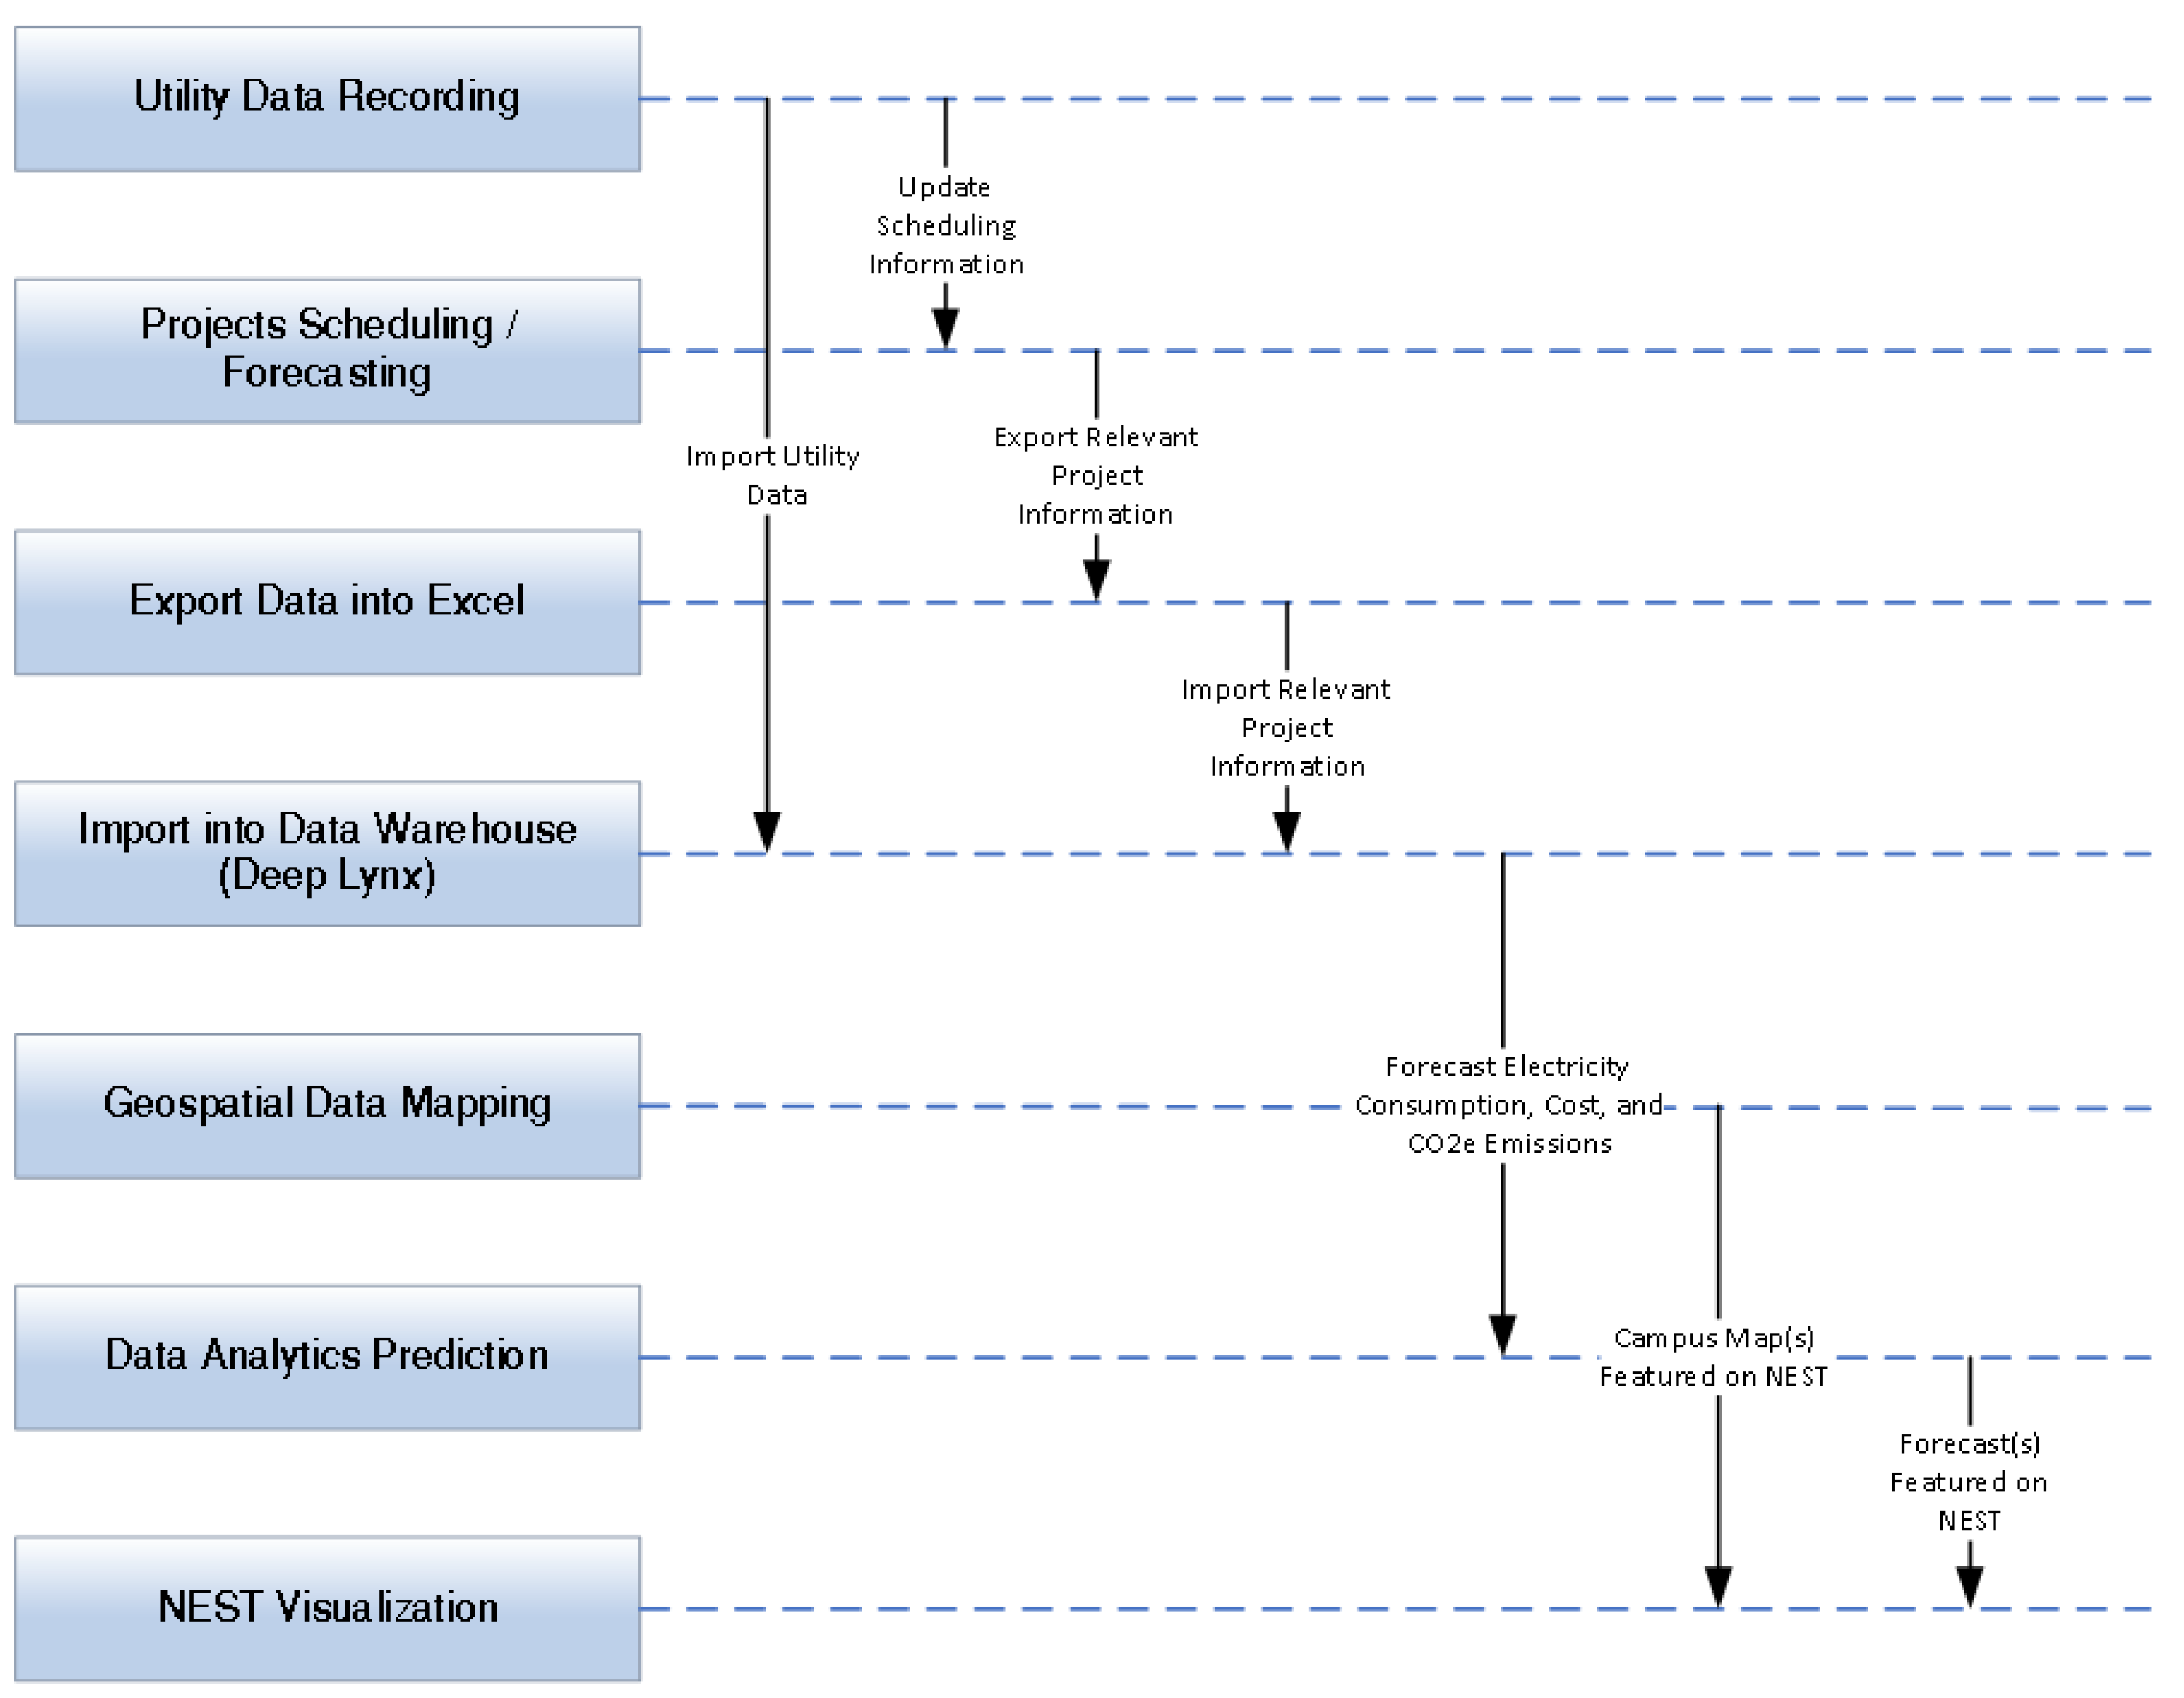
e emissions offset milestones. SkySpark is a data management system that automatically analyzes data. INL currently uses SkySpark as an anomaly detection tool to predict when internal systems should be maintained. However, future use of SkySpark is additionally intended to maintain real-time facility electricity and natural gas consumption data using sensor technology. INL internally maintains iMap, which is a geographic information system (GIS) that incorporates arcGIS building visualization with raw consumption and emissions data. The data flow through the NEST ecosystem is depicted in
Figure 1.
Because of the multiple sources of siloed information, Deep Lynx is used as a data warehouse. Deep Lynx was developed at INL to enable the collaboration of information without source restriction. As seen in
Figure 2, all original data are sent directly to Deep Lynx where it is translated and stored as usable information. The data analysis code, written in Python, then calls information out of Deep Lynx where it is then analyzed. The last step in the digital thread is visualizing the interpreted raw data on NEST.
2.2. Data Processing
Once the data has been placed into Deep Lynx, a data egress adapter is used to generate the forecasted data. The data can then be processed (e.g., the way it is described in
Section 3.2), and put back into Deep Lynx via a data ingress adapter. The format of the processed data does not have to match the format of the incoming data. The Deep Lynx data ontology is format agnostic and can store a variety of data types.
2.3. Data Egress: Net-Zero Engineering Support Tool (NEST)
NEST is intended to provide the INL NZ strategy team with visualized data to determine the best path forward to achieve the set INL NZ initiative. The data are pulled from Deep Lynx and visualized using standard JavaScript graphing libraries. NEST is categorized as a progressive web app because of the full browser compatibility, app-like interface, and its connectivity independence [
25].
A brief description of the purpose behind the development of this tool is provided in the top left corner of the NEST home screen. Below this description are the different areas of the INL campus.
NEST provides a digital approach to iterative visualization and planning on the path to NZ emissions. An integrated design process (IDP) relies on a collaboration of disciplines to define a pathway to achieve socially and environmentally sustainable assets (e.g., buildings, vehicles, generating facilities, landfills) [
26]. The integration of project schedules, energy consumption, and direct and indirect GHG emissions with a GIS visualization of consumption and emissions creates an interactive application.
Figure 3 provides a look at a sample interface mock-up.
Data are also used to determine the largest contributors to both electricity consumption and GHG emissions.
Figure 3 displays building shapes that are colored red, orange, or green depending on the building having values in the high, average, or good thresholds, respectively. This heat map feature is overlaid on the GIS map. The INL NZ strategy team may use this function in NEST to define which buildings should be targeted first for the largest impact on
e emissions.
Sensors for real-time monitoring of electricity consumption have been installed on some building meters at INL, but not all. Building real-time sensor data will be displayed in NEST to the right side of the map when the user clicks their mouse on the building of interest, as seen in
Figure 4. Additionally, INL plans to install sensors on natural gas meters in the near future. Monitoring natural gas consumption is imperative when accounting for all contributors to
e emissions.
Figure 5 shows the Gantt chart stored in P6 for projects related to the specified building. Gantt charts are used to show project activity progress throughout a project lifecycle. NEST provides an interactive version of these previously inaccessible Gantt charts.
Gantt charts are commonly used in project management to estimate the completion time and needed resources. However, NZ adds another dimensional variable, avoided or sequestered . Thus, all key performance indicators (KPIs) should be functions of three variables: (1) time; (2) cost; (3) offset e emissions.
Initially, historical data were used to model existing electricity consumption, consumption cost, and associated
e emissions.
Figure 6 shows the
e and electrical usage historical data for the Research and Education Campus (REC) at INL.
INL sustainability analysts provided the standardized methodology used to track the consumption and emissions values needed for submission to the U.S. Environmental Protection Agency on an annual basis. Total
e emissions are calculated by summing converted
,
, and
emissions from kg/MWh to mt.
Table 1 provides the emission factors used to source data from the EPA eGRID site and used to calculate INL’s GHG emissions. Converting emissions from vehicles uses a similar approach by using fuel type to determine the conversion of gallons/year to total
e emissions by multiplying how many miles each vehicle drove during a given time period. These metrics are important to ensure a standardized practice is used to record accurate emissions. Accurate emission calculations provide realistic data for decision-making when determining a pathway to NZ.
3. Results
In the early adoption stage, DT usage is presently limited. Therefore, NEST is expected to act as a showcase for different groups willing to join the NZ initiative, and demonstrate the benefits of consolidated data storage. This centralized repository will foster collaboration between different groups within INL, as well as its partners. It is also important to note that because NEST is developed concurrently with progress toward achieving the carbon NZ initiative, direct impacts associated with NEST integration are not obvious. Emergent aspects of using NEST are more easily identified when expected consumption and emissions offset values are modeled against the actual values.
NEST is intended to supply INL NZ decision makers with insight towards minimizing or eliminating direct emissions. Direct emissions are those associated with INL operations. Alternatively, indirect emissions are those associated with INL employee work such as travel. At present, the INL fleet operations team has collected the most comprehensive data on fleet decarbonization. Therefore, the EV fleet transition will be used as a primary example to demonstrate the advantages to NEST.
EV integration mitigates transportation GHG emissions, but increases electricity consumption [
6]. The data for individual vehicles, their fuel usage, and associated GHG emissions are stored in P6. So, the first step in the digital thread paradigm is to write a data ingress adapter to the data source (P6) and put it in a format suitable for further processing. The output of this parsing is a consolidated table containing data for all types of vehicles, and for all years in one table. This table contains cumulative data for all vehicles, all fuel types, and all years in a flattened format. We then apply the carrying procedure [
27] and create several tables, each of which is a function of one argument (e.g., year) with others fixed to extract specific data grouped by year, vehicle type, fuel usage, etc.
3.1. Data Forecasting
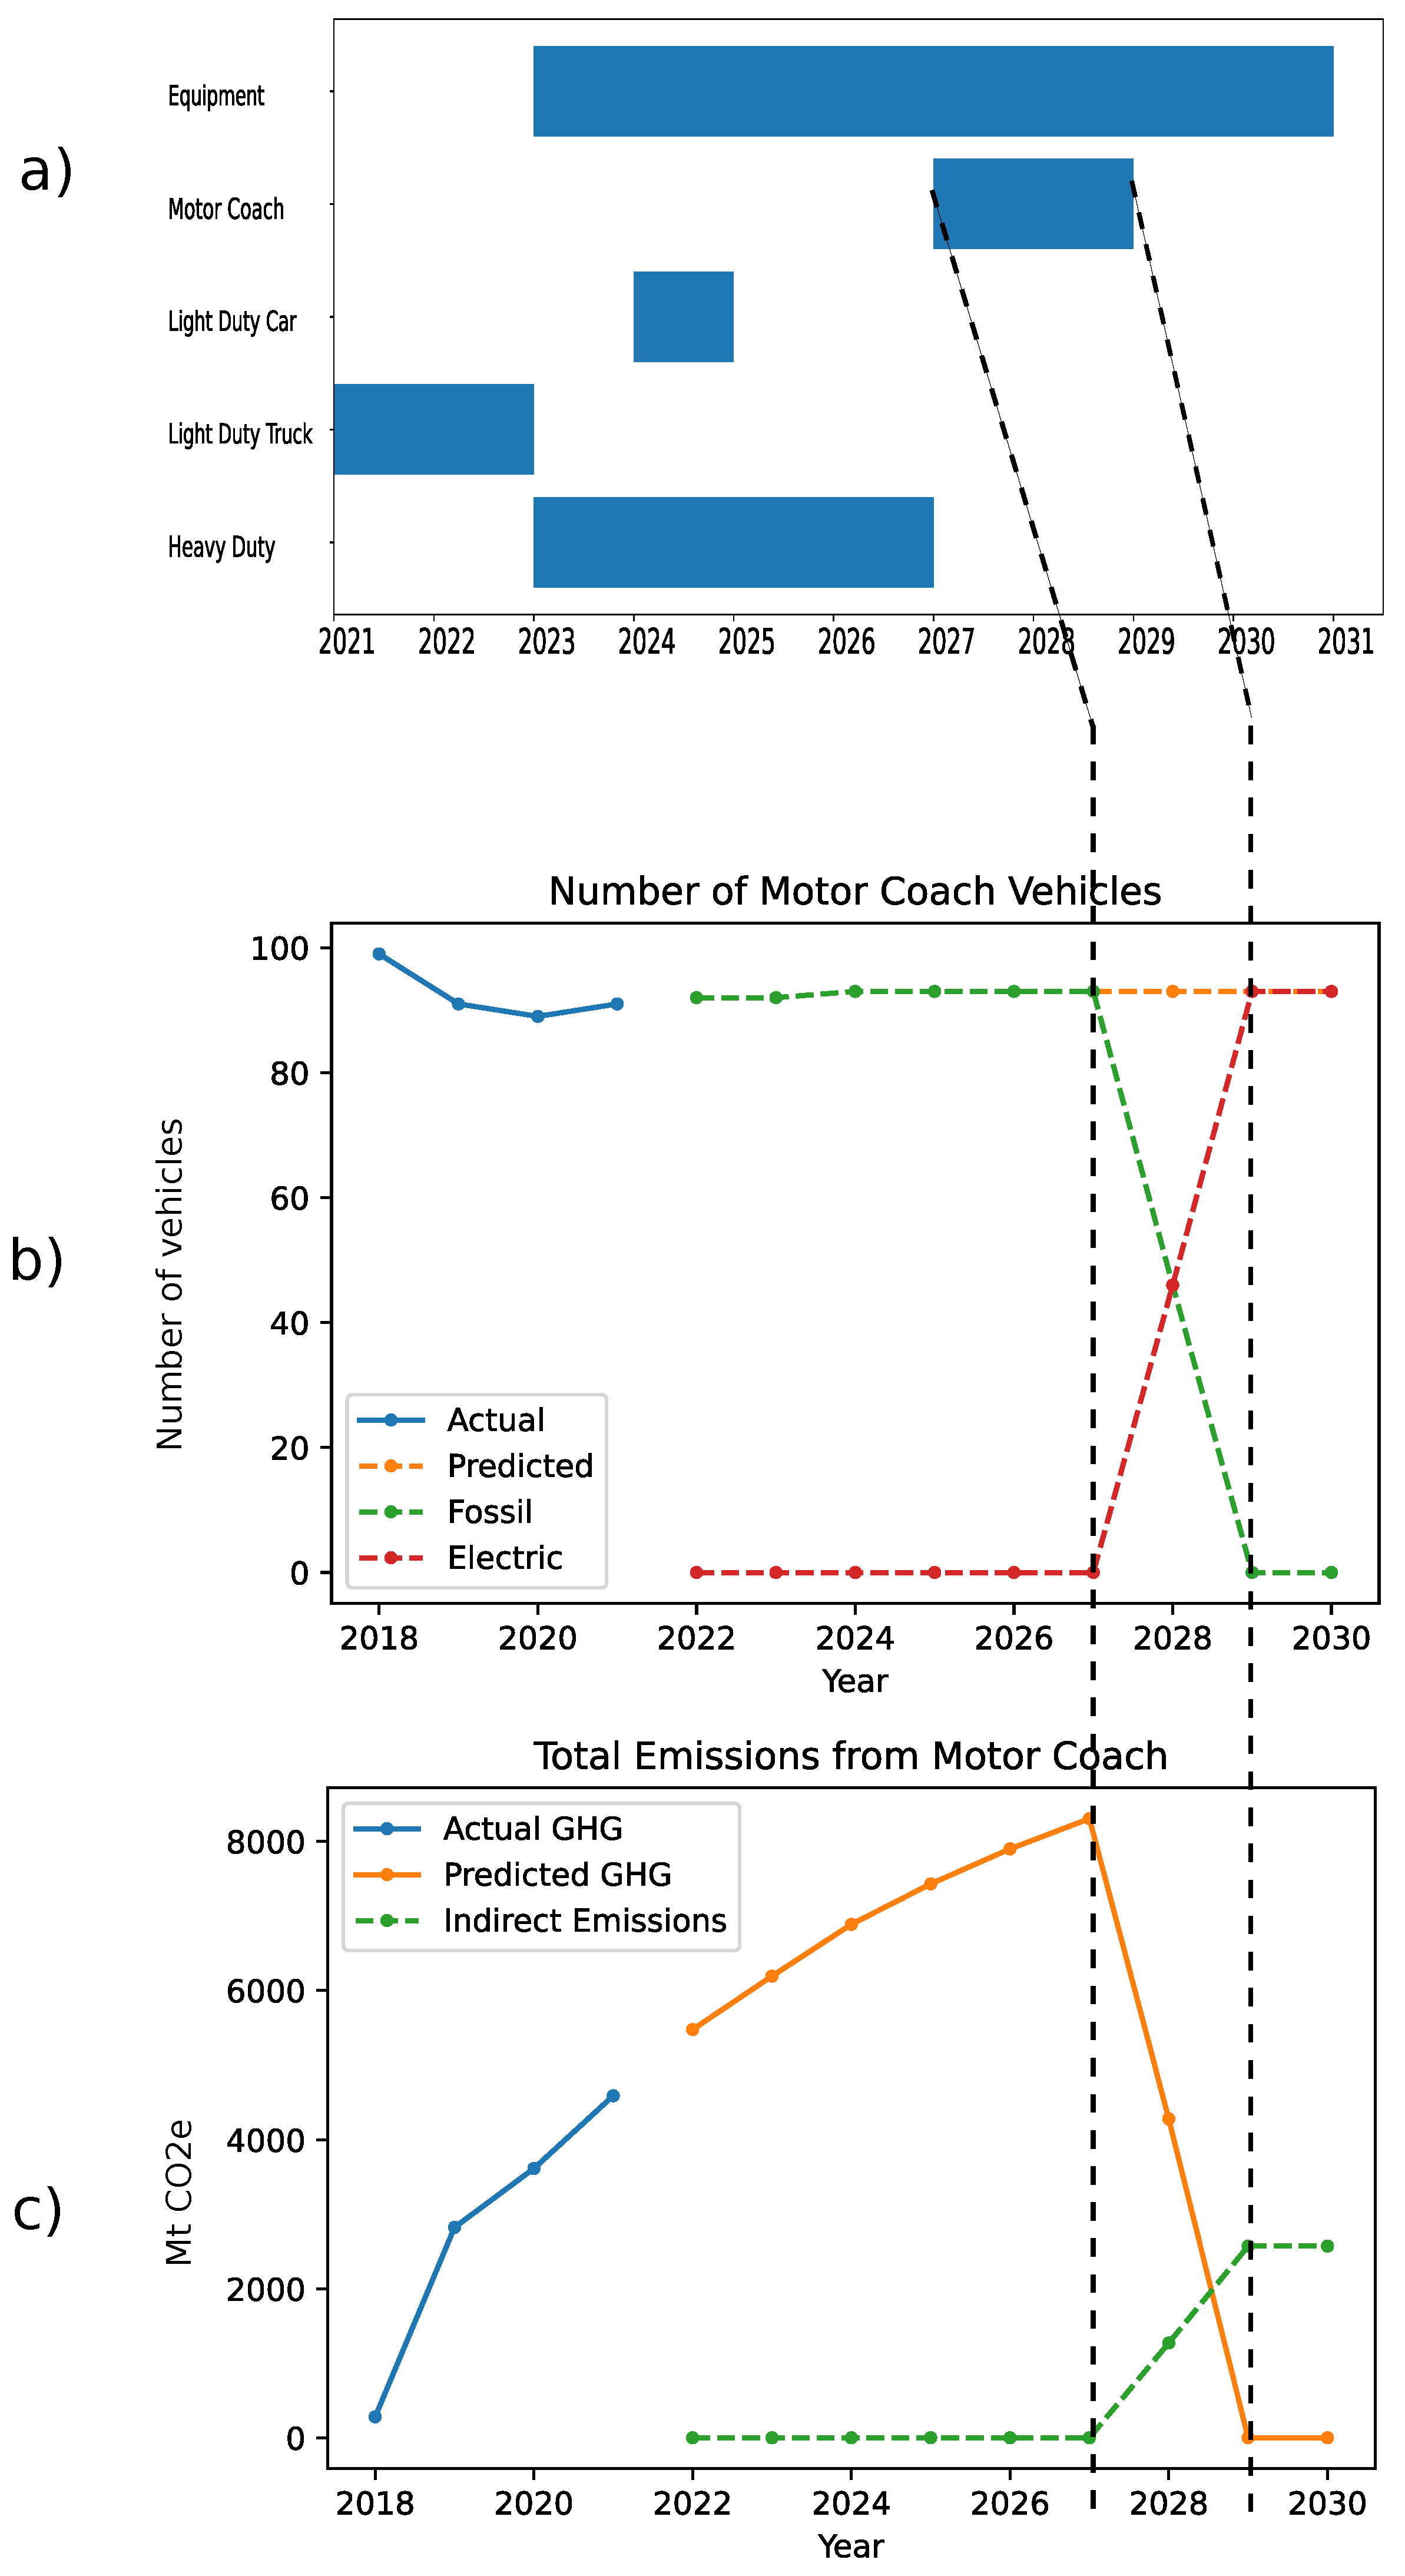
Various trends can be extracted from the consolidated table. An important trend is the number of vehicles operating in each fleet per year. In addition to fleet decarbonization, INL continues to grow, and so should its fleet. The autoregressive moving average (ARIMA), which models the next step in the sequence as a linear function of the observations and residual errors at prior time steps, was used to predict the number of each type of vehicle in the next 10 years, as shown by the orange line in
Figure 7b. At the same, time each vehicle may travel a different number of miles in a year affecting its annual carbon footprint, where current fossil fuel usage per vehicle per year was converted to miles traveled annually; these data were extrapolated in the same manner as the number of vehicles, as seen in
Figure 7c.
A similar approach enables us to highlight different aspects of the model and analyze trends associated with the consumption of only one fuel type. Conversely, once NEST expands to the building level, the same approach will be used to segregate out specific types of buildings (e.g., office vs. research), different activities (e.g., heating, lighting replacement), and specific fuels (e.g., natural gas, electricity). Understanding and ranging of the “worst offenders" helps us to inform the stakeholders about an optimal replacement schedule.
3.2. Replacement Schedule
Within the framework of NEST, the stakeholders are able to select the start and end date of each decarbonization project (e.g., electrification of a particular vehicle type), as shown in
Figure 7a. Once the project begins, a linear rate of replacement of fossil-powered vehicles by EVs is assumed, as shown in
Figure 7b. This model is justified by the findings in [
28]. The vehicle replacement schedule affects the rate at which direct GHG emissions are eliminated and replaced by indirect emissions arising from the use of electricity purchased from the Northwest Power Pool (NWPP) electricity exchange. At present, each megawatt hour (MWh) produced by NWPP generation facilities emits 275 kg of
e [
29]. (The NWPP has its own plan to decarbonize the generating facilities [
30]; therefore, the numbers presented here represent the worst possible scenario. In reality, indirect GHG emissions will be less than those currently predicted by NEST.)
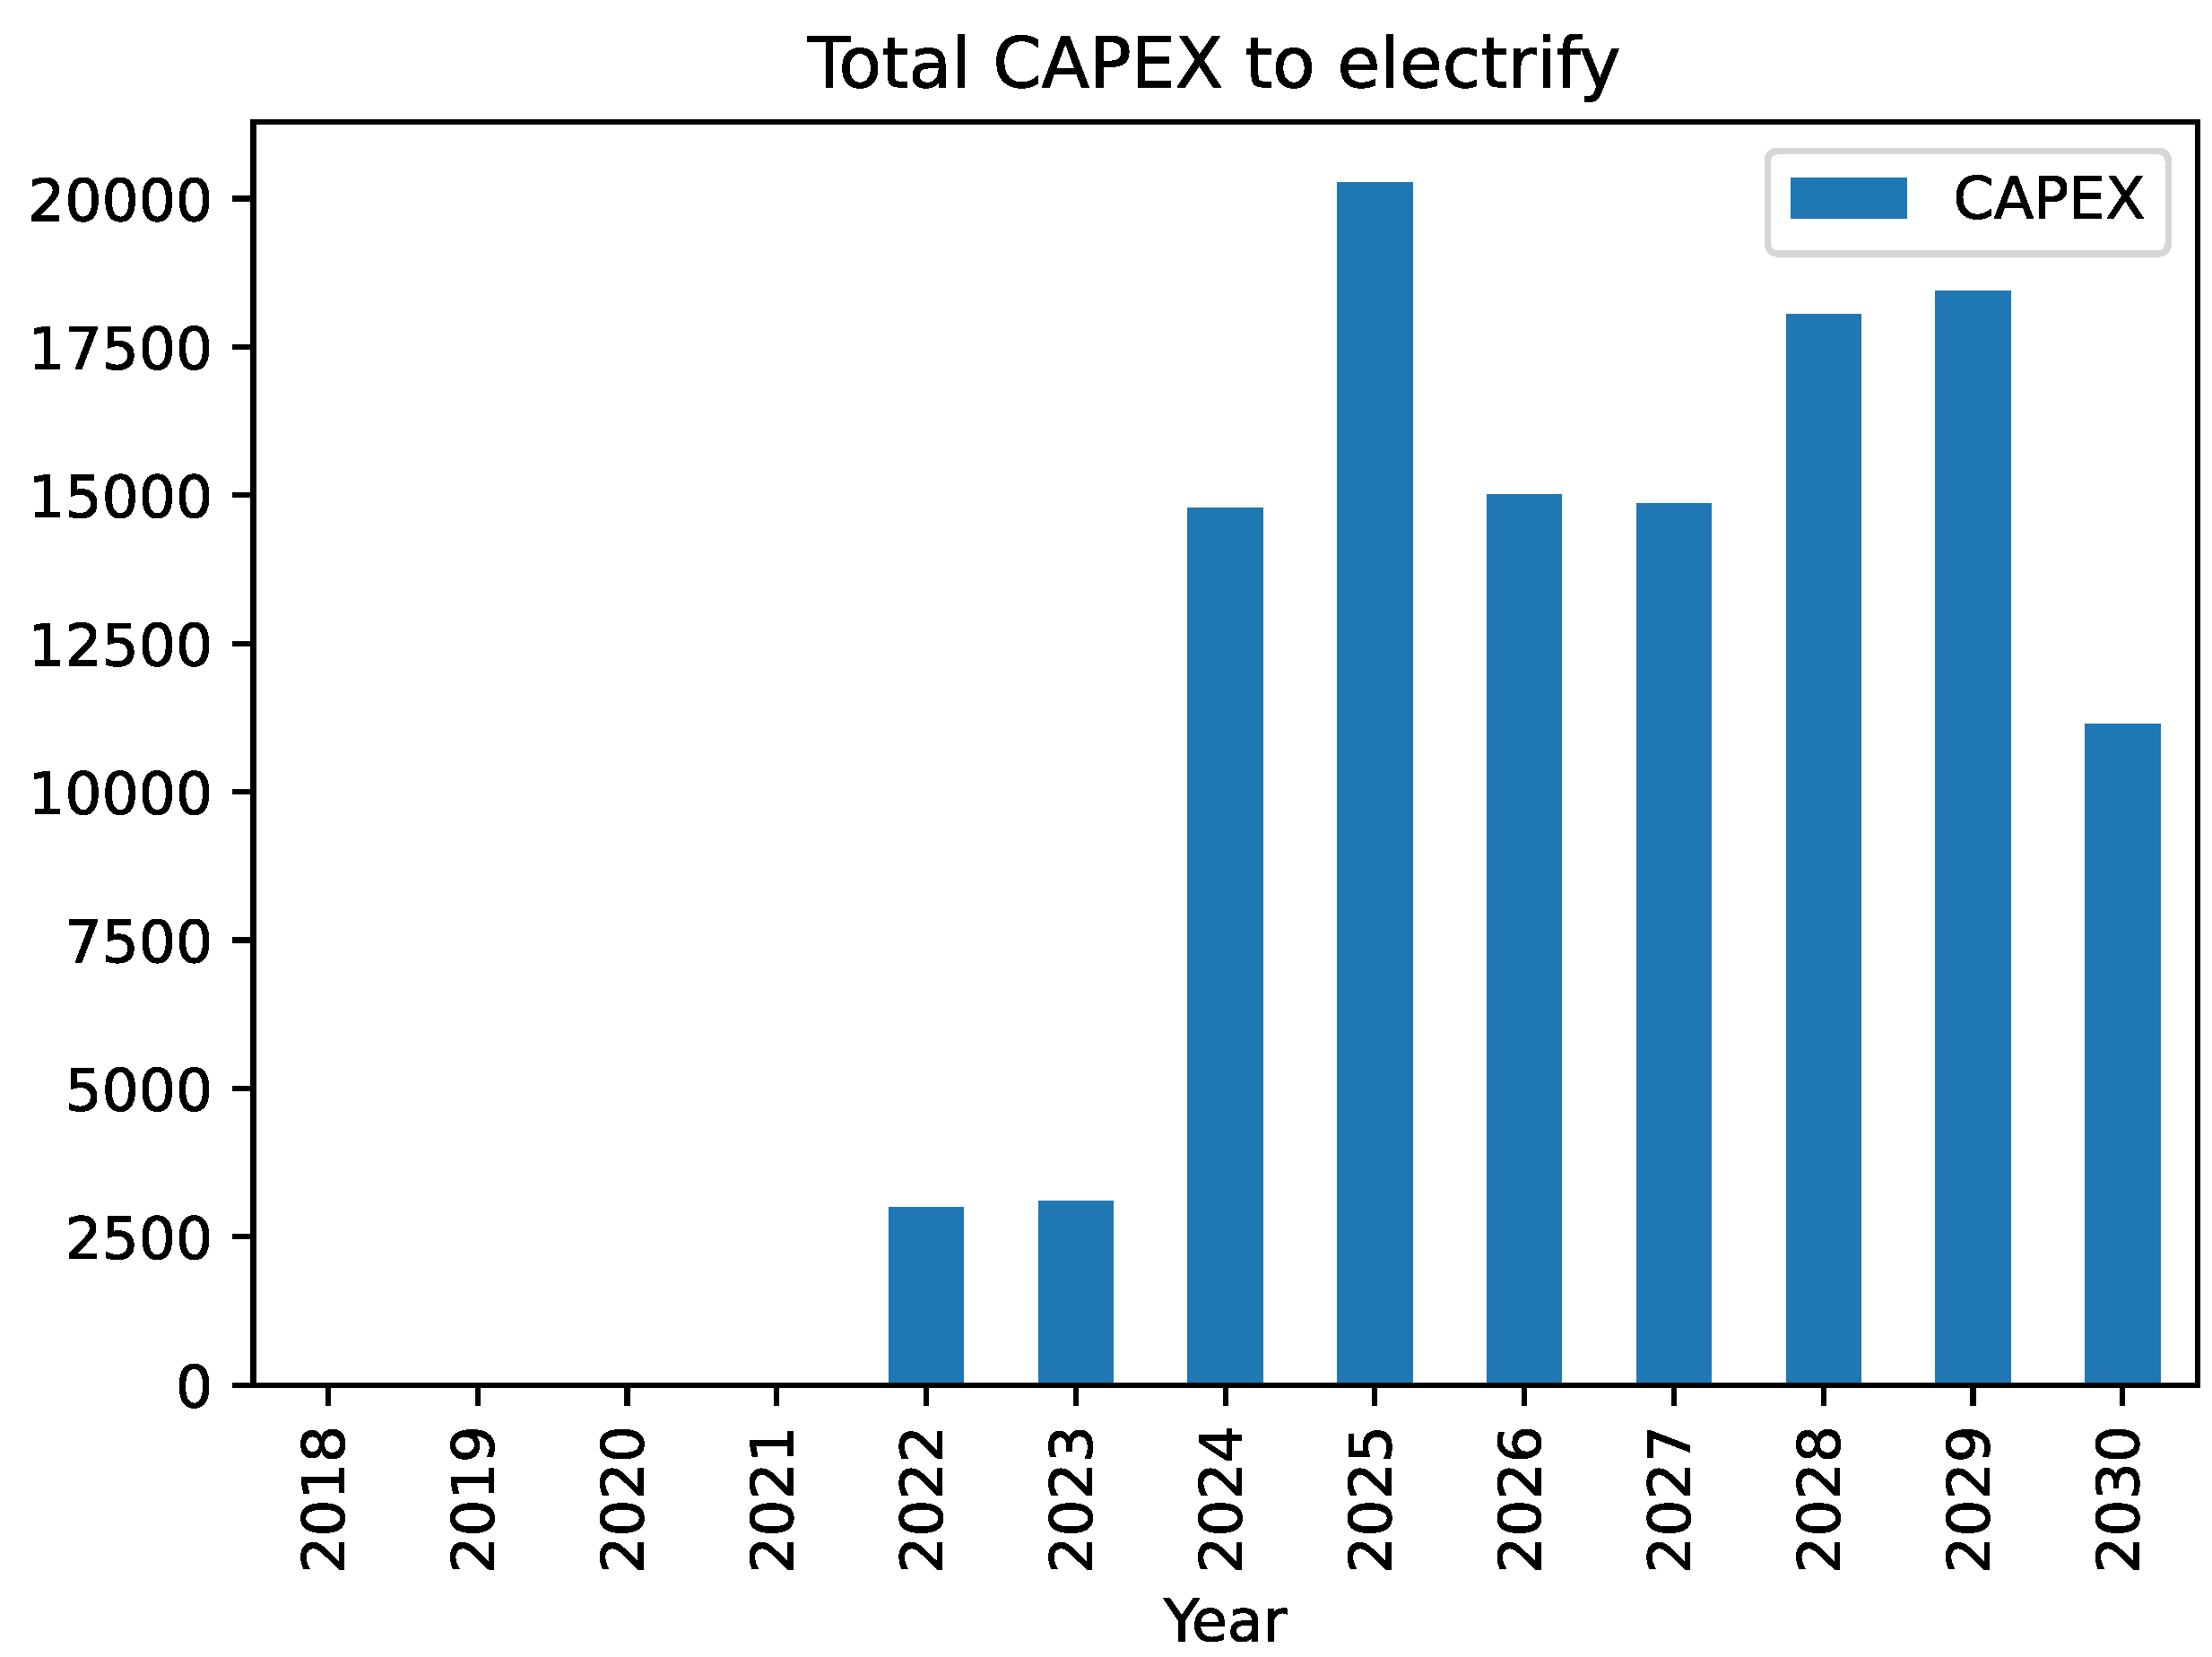
Annual capital expenditure (CAPEX) is calculated as the number of vehicles of each type replaced this calendar year, weighed by their average price, and then summed over all vehicle types, as shown in
Figure 8. Therefore, aggressive replacement schedules require high annual CAPEX, which may not be available. If the annual CAPEX is the driving limitation of the replacement schedule, the NEST simulation engine is capable of running Monte-Carlo-type simulations by proposing random schedules and selecting only those that yield CAPEX to be below the threshold.
NEST allows stakeholders to find the schedule that best fits their budget and enables the fastest decarbonization. At the same time, they will be able to see the impact of each scenario.
4. Discussion
The same type of analysis that has been demonstrated here for the vehicles can be carried out for buildings to study the impact of various activities scheduled to reduce passive energy loads, such as heating/ventilation/air conditioning and lighting (INL’s primary mission is scientific research; therefore, there is no plan to eliminate electrical loads arising from experiments. The Microreactor AGile Non-nuclear Experimental Testbed (MAGNET) at INL consumes 0.25 MW). The same approach that is vetted on fleet electrification can then yield the amount of electrical load to support INL operations. Since complete decarbonization of NWPP will not happen before INL’s target date of 2031 [
30], INL will use these simulation results to properly size its own carbon-neutral electricity generation facilities and carbon capture facilities.
Carbon-free energy sources are an electricity supply that produces little to no GHG emissions. Though photovoltaics (PVs) enable clean energy consumption at a reasonable cost, the intermittence of solar energy creates a need for an alternative electricity supply. However, advanced nuclear reactors that are being designed at INL [
31] and commercial companies [
32] are aimed to bridge the gap between baseload generation and demand.
The uncertainty associated with electricity generation indicates an emissions gap that should be taken into consideration. An emissions gap is the difference between actual emissions and intended emissions after offset processes are implemented [
33]. Until a single company (e.g., INL), a conglomerate of companies, or a whole industry completely switches to carbon-neutral sources, for them to claim NZ they will have to purchase carbon credits. Carbon credits are certificates that represent how many metric tons of GHG that have been removed from the atmosphere [
34]. Using an integrated information tool, such as NEST, the stakeholders can make decisions using a holistic, systems approach to assess the balance between the purchase of carbon credits and activities directed towards the construction of carbon-free energy sources at any given moment considering the economic situation.
Future work can expand this research by developing an interactive map that demonstrates the impact on
e emissions and electricity consumption if further urban or campus development is planned. An integrated information visualization tool, such as NEST, is especially applicable for universities, city planners, and utility companies. Universities demonstrating a desire to decrease carbon emissions can use a tool such as NEST to define which buildings should be targeted first for the largest impact on carbon emissions. Utility companies integrating NEST can take consumer end-users into consideration and holistically address the utility death spiral [
35]. The utility death spiral indicates a decline in end-user electricity demand from the utility because end-users are investing in distributed energy resources (DERs). When end-users purchase less electricity from the utility, the utility recoups lost revenue by increasing electricity prices, which encourages more end-users to invest in DERs. Utility companies may use NEST to visualize electricity consumption or production hot spots and address them accordingly.
At present, NEST provides a forecasting capability that defines the direction for INL’s NZ team. As the initiative’s scheduled deadline of 2031 approaches, there will be more retrospective data available to compare the predicted model to the “as-built" results.
5. Conclusions
This work presented a tool developed at INL, NEST, which provides a holistic visualization of integrated data and prediction capability needed for achieving NZ goals across different sectors more efficiently. A framework for data ingress, processing, and egress was established, as well as posterior data forecasting and visualization. This is a novel framework that improves the decision-making capability of stakeholders because of the near real-time visualization updates when the siloed data are adjusted. The data include project type (i.e., improvement vs. replacement), schedules, costs, energy consumption, and direct and indirect GHG emissions. The INL’s initiative to transition into an EV fleet was used as a test case to demonstrate the developed framework and the advantages of using NEST. Actual and predicted emissions were provided for different types of vehicles. Electrification schedules were analyzed by obtaining CAPEX quantities. By testing different replacement schedules, decision makers can prioritize those that yield CAPEX below a certain threshold, while meeting target milestones. The customized map visualization of NEST is beneficial for relating raw data with initiative priorities. In this way, NEST empowers INL decision makers with the necessary information to collaborate in achieving optimized planning. Expanding this capability to include both static and dynamic data will enhance the tool’s robustness.
The framework established by NEST can be used in contexts other than INL. As more organizations and companies implement an NZ initiative, using a dashboard that displays collected and traditionally siloed data improve decision-making capabilities. NEST demonstrates a successful process of developing an integrative tool. Though other companies offer access to a dashboard that is customized based on stakeholder values, NEST provides INL stakeholders with a customizable tool that also has the capability to expand with other INL initiatives.
Author Contributions
Conceptualization, P.P. and J.M.; methodology, P.P.; software, P.P.; validation, P.P.; formal analysis, P.P. and J.M.; investigation, P.P. and J.M.; resources, P.P. and J.M.; data curation, P.P.; writing—original draft preparation, P.P., J.M. and M.C.; writing—review and editing, P.P., J.M. and M.C.; visualization, P.P.; supervision, P.P. and J.M.; project administration, J.M.; funding acquisition, J.M. All authors have read and agreed to the published version of the manuscript.
Funding
This research was funded by the Net-Zero Program at Idaho National Laboratory.
Institutional Review Board Statement
Not applicable.
Informed Consent Statement
Not applicable.
Data Availability Statement
Not applicable.
Acknowledgments
We would like to thank the Net-Zero team at Idaho National Laboratory for supporting our research that aids in the achievement of carbon net zero. We would also like the express appreciation to management in the Digital Engineering department at Idaho National Laboratory for their unwavering encouragement.
Conflicts of Interest
The authors declare no conflict of interest.
Abbreviations
The following abbreviations are used in this manuscript:
| ARIMA | Autoregressive Moving Average |
| CAPEX | Capital Expenditures |
| e | Equivalent |
| DER | Distributed Energy Resource |
| DT | Digital Twin |
| EPA | Environmental Protection Agency |
| EV | Electric Vehicle |
| GHG | Greenhouse Gas |
| GHGRP | Greenhouse Gas Reduction Potential |
| GIS | Geographic Information System |
| IDP | Integrated Design Process |
| INL | Idaho National Laboratory |
| kg | Kilogram |
| KPI | Key Performance Indicators |
| mt | Metric Tonnes |
| MWh | Mega Watt Hour |
| NEST | Net-Zero Engineering Support Tool |
| NWPP | Northwest Power Pool |
| NZ | Net Zero |
| NZA | Net-Zero America |
| NZEB | Net-Zero Energy Building |
| PV | Photovoltaic |
| REC | Research and Education Campus |
References
- United States Environmental Protection Agency. Overview of Greenhouse Gases. 2022. Available online: https://www.epa.gov/ghgemissions/overview-greenhouse-gases (accessed on 13 July 2022).
- Intergovernmental Panel on Climate Change Working Group III. Climate Change 2014: Mitigation of Climate Change. 2014. Available online: https://www.ipcc.ch/site/assets/uploads/2018/02/ipcc_wg3_ar5_full.pdf (accessed on 28 November 2022).
- United States Environmental Protection Agency. Sources of Greenhouse Gas Emissions. 2022. Available online: https://www.epa.gov/ghgemissions/sources-greenhouse-gas-emissions (accessed on 13 July 2022).
- Net Zero Carbon Cities: An Integrated Approach. 2021. Available online: https://www3.weforum.org/docs/WEF_Net_Zero_Carbon_Cities_An_Integrated_Approach_2021.pdf (accessed on 28 November 2022).
- International Energy Agency. Empowering Cities for a Net Zero Future: Unlocking Resilient, Smart, Sustainable Urban Energy Systems; OECD Publishing: Paris, France, 2021. [Google Scholar]
- Razmjoo, A.; Nezhad, M.M.; Kaigutha, L.G.; Marzband, M.; Mirjalili, S.; Pazhoohesh, M.; Memon, S.; Ehyaei, M.A.; Piras, G. Investigating Smart City Development Based on Green Buildings, Electrical Vehicles and Feasible Indicators. Sustainability 2021, 13, 7808. [Google Scholar] [CrossRef]
- Zhang, K.; Xu, L.; Ouyang, M.; Wang, H.; Lu, L.; Li, J.; Li, Z. Optimal Decentralized Valley-filling Charging Strategy for Electric Vehicles. Energy Convers. Manag. 2014, 78, 537–550. [Google Scholar] [CrossRef]
- Liu, R.; Salem, M.; Rungamornrat, J.; Al-Bahrani, M. A comprehensive and updated review on the exergy analysis of ground source heat pumps. Sustain. Energy Technol. Assess. 2023, 55, 102906. [Google Scholar] [CrossRef]
- Guedri, K.; Salem, M.; Assad, M.E.H.; Rungamornrat, J.; Malek Mohsen, F.; Buswig, Y.M. PV/Thermal as Promising Technologies in Buildings: A Comprehensive Review on Exergy Analysis. Sustainability 2022, 14, 12298. [Google Scholar] [CrossRef]
- Mirlohi, S.M.; Sadeghzadeh, M.; Kumar, R.; Ghassemieh, M. Implementation of a Zero-energy Building Scheme for a Hot and Dry Climate Region in Iran (a Case Study, Yazd). Renew. Energy Res. Appl. 2020, 1, 65–74. [Google Scholar]
- Beigzadeh, M.; Pourfayaz, F.; Pourkiaei, S. Modeling heat and power generation for green buildings based on solid oxide fuel cells and renewable fuels (biogas). Renew. Energy Res. Appl. 2020, 1, 55–63. [Google Scholar]
- Rashidi, M.M.; Mahariq, I.; Murshid, N.; Wongwises, S.; Mahian, O.; Nazari, M.A. Applying wind energy as a clean source for reverse osmosis desalination: A comprehensive review. Alex. Eng. J. 2022, 61, 12977–12989. [Google Scholar] [CrossRef]
- Jenkins, J.; Mayfield, E.; Larson, E.; Pacala, S.; Greig, C. Mission Net-Zero America: The Nation-Building Path to a Prosperous, Net-Zero Emissions Economy. Joule 2021, 5, 2755–2761. [Google Scholar] [CrossRef]
- Moghaddasi, H.; Culp, C.; Vanegas, J.; Ehsani, M. Net Zero Energy Buildings: Variations, Clarifications, and Requirements in Response to the Paris Agreement. Energies 2021, 14, 3760. [Google Scholar] [CrossRef]
- O’Flynn, C.; Seymour, V.; Crawshaw, J.; Parrott, T.; Reeby, C.; Silva, S.R.P. The Road to Net Zero: A Case Study of Innovative Technologies and Policy Changes Used at a Medium-Sized Unviersity to Achieve Czero by 2030. Sustainability 2021, 13, 9954. [Google Scholar] [CrossRef]
- Ghalebani, A.; Das, T.K. Design of Financial Incetive Programs to Promote Net Zero Energy Buildings. IEEE Trans. Power Syst. 2017, 32, 75–84. [Google Scholar] [CrossRef]
- Lu, Y.; Wang, S.; Yan, C.; Shan, K. Impacts of Renewable Energy System Design Inputs on the Performance Robustness of Net Zero Energy Buildings. Energy 2015, 93, 1595–1606. [Google Scholar] [CrossRef]
- Bui, T.T.P.; Wilkinson, S.; Domingo, N.; MacGregor, C. Zero Carbon Building Practices in Aotearoa New Zealand. Energies 2021, 14, 4455. [Google Scholar] [CrossRef]
- Kaewunruen, S.; Rungskunroch, P.; Welsh, J. A Digital-Twin Evaluation of Net Zero Energy Building for Existing Buildings. Sustainability 2019, 11, 159. [Google Scholar] [CrossRef]
- Twinview. The Building Safety Bill Handbook. Available online: https://www.twinview.com/assets/white-papers/twinview-building-safety-bill-handbook-alt-digital.pdf (accessed on 25 July 2022).
- Shubbar, A.; Nasr, M.; Falah, M.; Al-Khafaji, Z. Towards Net Zero Carbon Economy: Improving the Sustainability of Existing Industrial Infrastructures in the UK. Energies 2021, 14, 5896. [Google Scholar] [CrossRef]
- Ischay, C.P.; Fisher, M.D.; Fossum, E.L.; Scully, K.I. FY2021 Idaho National Laboratory Site Sustainability Plan. 2020. Available online: https://www.osti.gov/biblio/1735974-fy-idaho-national-laboratory-site-sustainability-plan (accessed on 25 July 2022).
- Boardman, J.; Sauser, B. Systems Thinking Coping with 21st Century Problem; CRC Press: Boca Raton, FL, USA, 2008. [Google Scholar]
- Leiva, C. Demystifying the Digital Thread and Digital Twin Concepts. Ind. Week 2016, 1, 2016. [Google Scholar]
- Altexsoft. Progressive Web Apps: Core Features, Architecture, Pros and Cons. 2018. Available online: https://www.altexsoft.com/blog/engineering/progressive-web-apps/ (accessed on 25 July 2022).
- Lu, Y.; Sood, T.; Chang, R.; Liao, L. Factors impacting integrated design process of net zero energy buildings: An integrated framework. Int. J. Constr. Manag. 2020, 1–13. [Google Scholar] [CrossRef]
- Curry, H.B.; Feys, R.M. Combinatory Logic Vol. 1; North-Holland Publishing Company: Amsterdam, The Netherlands, 1958. [Google Scholar]
- Schey, S.; Smart, J.; Pray, I. Idaho National Laboratory Plug-in Electric Vehicle Adoption Plan. 2021. Available online: https://www.google.com.hk/url?sa=t&rct=j&q=&esrc=s&source=web&cd=&cad=rja&uact=8&ved=2ahUKEwiz78u7q4z8AhVD7rsIHaHgCoIQFnoECBMQAQ&url=https%3A%2F%2Favt.inl.gov%2Fsites%2Fdefault%2Ffiles%2Fpdf%2Fdod%2FNSWITask2VehicleSelection%2520.pdf&usg=AOvVaw1zBdDB4616zxbFrveZQJoM (accessed on 13 July 2022).
- United States Environmental Protection Agency. GHG Emission Factors Hub. 2022. Available online: https://www.epa.gov/climateleadership/ghg-emission-factors-hub (accessed on 13 July 2022).
- Northwest Power and Conservation Council. Northwest Power Plan for a Secure & Affordable Energy Future. 2021. Available online: https://www.nwcouncil.org/sites/default/files/2021powerplan_2021-5.pdf (accessed on 13 July 2022).
- Office of Nuclear Energy. TNew MARVEL Project Aims to Supercharge Microreactor Deployment. 2021. Available online: https://www.energy.gov/ne/articles/new-marvel-project-aims-supercharge-microreactor-deployment (accessed on 28 November 2022).
- X-Energy. Reactor: Xe-100. 2020. Available online: https://x-energy.com/reactors/xe-100 (accessed on 20 July 2022).
- United Nations Environment Programme. The Emissions Gap. 2018. Available online: https://www.un-ilibrary.org/content/books/9789210476690c008 (accessed on 28 November 2022).
- Blaufelder, C.; Levy, C.; Mannion, P.; Pinner, D. A Blueprint for Scaling Voluntary Carbon Markets to Meet the Climate Challenge. Published by McKinsey & Company. 2021. Available online: https://netzeroanalysis.com/wp-content/uploads/2021/11/03_NEWS__McKinsey_Voluntary-Offset-Growth.pdf (accessed on 28 November 2022).
- Stephen Lacey. This Is What the Utility Death Spiral Looks Like. 2014. Available online: https://www.greentechmedia.com/articles/read/this-is-what-the-utility-death-spiral-looks-like (accessed on 20 July 2022).
| Disclaimer/Publisher’s Note: The statements, opinions and data contained in all publications are solely those of the individual author(s) and contributor(s) and not of MDPI and/or the editor(s). MDPI and/or the editor(s) disclaim responsibility for any injury to people or property resulting from any ideas, methods, instructions or products referred to in the content. |
© 2022 by the authors. Licensee MDPI, Basel, Switzerland. This article is an open access article distributed under the terms and conditions of the Creative Commons Attribution (CC BY) license (https://creativecommons.org/licenses/by/4.0/).


