Abstract
Freeway bottleneck areas are prone to congestion and have high accident risk. A variable speed limit provides technical support for alleviating congestion and improving traffic safety in such areas. The existing variable speed limit rules in the related literature have a single focus, and most of them do not give specific quantitative speed limits. In this study, a variable speed limit system suitable for freeway bottleneck areas was constructed. Variable speed limit rules under different levels of traffic congestion and adverse weather conditions were designed, and the parameters for freeways were defined. Then, the VISSIM microscopic traffic simulation software was used to build two bottleneck scenarios of a tunnel area and a merging area for simulation tests. The research shows that in these two scenarios, reasonable speed limits can effectively reduce roadway delays and improve the operational efficiency of bottleneck areas in certain traffic flow ranges (e.g., a medium flow of around 900 pcu/h/lane). Unreasonable speed limits in low flow inhibit freeway efficiency more significantly. When congestion has already formed with high flow, different speed limits have a limited effect on efficiency improvement. The research results reported in this paper can provide a theoretical reference for the design and practical application of variable speed limit systems in freeway bottleneck areas. This provides a certain contribution to sustainable traffic development.
1. Introduction
The problem of freeway congestion often occurs at bottleneck sections and fixed bottleneck points, which are mainly merging areas, construction areas, tunnels, bridges, and toll stations [1]. A bottleneck area is defined as a road element where demand exceeds capacity [2]. When drivers reach a bottleneck section or fixed bottleneck point, there are many accelerations, decelerations, and lane changes, which easily cause traffic congestion and affect driving safety. Speed is one indicator that visually reflects congestion, and is closely related to traffic safety. Related research shows that when the vehicle speed is closest to the overall average speed, the accident rate is the lowest [3]. The higher the speed and the greater its discrete distribution, the higher the accident rate will be [4,5]. Reasonable speed limit measures can improve traffic safety on the road to a certain extent. From the perspective of improving freeway efficiency, it is necessary to take active traffic control measures to smooth the transition of traffic velocity in order to alleviate congestion in bottleneck areas and improve efficiency. As an active freeway prevention and control method, a variable speed limit (VSL) system can smooth traffic velocity in the process of vehicle operation in real-time based on the traffic environment and road conditions. The VSL system can also reduce the dispersion of vehicle speed [6] and improve driving safety while ensuring traffic efficiency. Therefore, domestic and foreign scholars have worked extensively on evaluating the design and simulation of VSL systems, aiming to maximize their function and better apply them to actual freeway efficiency improvement. A VSL system can prompt drivers to travel at the speed limit through variable information boards or gantries. Thus, drivers can adjust to the optimal speed in advance and pass the road bottleneck smoothly before entering bottleneck areas, such as merging areas, construction areas, or tunnels.
2. Literature Review
2.1. Research Related to VSL System Designing
In terms of designing a VSL system, some scholars have optimized the VSL model for the traffic flow characteristics of the mainline, bottleneck areas, and the combination of the mainline and ramps of the freeway [7,8]. They designed the corresponding VSL system considering the factors of communication, sight distance, weather, delay, speed difference, and traffic efficiency. Yu et al. [9] established an optimization model of VSL control in the bottleneck area of a freeway with the goal of maximizing the total traffic volume and minimizing the total vehicle travel time. The simulation results showed that the proposed model could alleviate the congestion problem of the bottleneck section of the freeway to a certain extent. Lu et al. [10] established a control method combining VSL and ramp control to solve the speed limit problem in bottleneck sections of freeways and constructed a corresponding optimal control model. Hegyi et al. [11] determined a speed limit strategy and speed limit for the shortest travel time using METANET model prediction data based on the results of a freeway traffic survey. Zegeye et al. [12] considered environmental factors, selected three control factors (the environment, resource consumption, and travel time), and determined the speed limit by multi-objective optimization. Frejo et al. [13] proposed a VSL controller for frequent congestion. When the density of bottleneck roads reaches the set threshold, the VSL control can be automatically turned on or off, which results in strong model robustness. In addition, Table 1 represents the studies of different scholars on VSL systems under different conditions. These studies verify the effectiveness of VSL systems.

Table 1.
Research related to VSL system designing.
2.2. Research Related to Simulation Evaluation of VSL System
In terms of evaluating simulations of the VSL system, scholars mainly use microsimulation software such as Aimsun, VISSIM, SUMO, MATLAB, TransModeler [20], and Paramics [21] to evaluate simulated speed variation and congestion detection, using single or joint simulations. Papamichail et al. [22] simulated the road capacity in a construction area based on Aimsun microsimulation model software. They evaluated the effectiveness of integrating the proportional integral regulator into the VSL system. Shi et al. [23] proposed a VSL strategy based on a construction area, taking MSDE as the evaluation index. They verified through VISSIM software that the strategy could improve the security of the construction area by reducing conflicts. Jo et al. [24] verified through VISSIM that the implementation of VSL can significantly reduce speed differences and average maximum speed differences in traffic flow to improve freeway driving safety. Ali et al. [25] used SUMO traffic microsimulation software to evaluate the effectiveness of an intelligent advisory speed limit (IASLD). The simulation results showed that compared with the traditional control strategy, the event detection time was reduced by 31.2% and the traffic flow efficiency and travel time were greatly improved. Grumert et al. [26] used SUMO traffic microsimulation software to study the effect of personalized VSL settings in a vehicle–road co-operative environment. The simulation results showed that the personalized speed limit had a good effect on coordinating traffic speed and reducing emissions. In addition to using microsimulation software, Zhao et al. [27] used the AutoSimAS driving simulator to evaluate speed limits on foggy days under different visibility conditions, providing a reference for the design of a speed suggestion system in adverse weather. In addition, Table 2 represents the virtual simulation scenarios developed by different scholars based on the actual road conditions. The different VSL schemes were also tested.
Table 2.
Research related to simulation evaluation of VSL system.
2.3. Knowledge Gap and Our Contribution
The literature review shows that the current research on VSL is focused mainly on designing models and algorithms and evaluating simulations, and there is less analysis of the architecture and the information interaction process of VSL systems in freeway bottleneck areas. However, the traffic flow between the upstream and downstream of freeway bottleneck areas is complicated and the speed difference between vehicles is large. Drivers need to be informed of road congestion in advance in order to slow down and adjust their driving behavior. Therefore, it is necessary to explore the architecture and the information interaction process of the VSL system in freeway bottleneck areas. In addition, most of the current studies do not suggest specific quantitative speed limits and do not perform simulation evaluations for different speed limits under different traffic conditions and congestion levels. However, these works can provide a useful theoretical basis for the engineering applications of VSL systems. Based on this, in this study we designed the architecture for a VSL system for freeway bottleneck areas based on the current research. VSL rules were designed for different levels of traffic congestion and various adverse weather conditions. The VSL rules were also quantified for typical bottleneck areas on highways. Based on the current simulation test study, a freeway simulation environment was built. Finally, the experimental simulation results are analyzed to provide suggested warning speeds in different bottleneck scenarios.
3. Methodology and Models
3.1. Architecture of VSL System in Bottleneck Area of a Freeway
3.1.1. Analysis of Freeway Bottleneck Area Characteristics
Areas such as freeway mainline and ramp connections, construction sites, and sudden traffic accidents are potential bottleneck areas. In bottleneck areas of freeways, many phenomena occur, such as increasing and decreasing speed and merging of vehicles, and traffic congestion is relatively frequent and severe, which seriously affects the efficiency of the mainline of the freeway. The characteristics of bottleneck areas on freeways and the reasons for their formation are shown in Figure 1 [34].
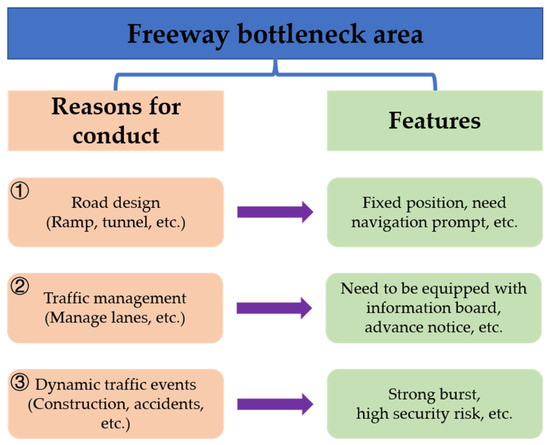
Figure 1.
Causes and characteristics of freeway bottleneck areas.
As shown in Figure 1, to alleviate the congestion in a bottleneck area, a variable information board should be set at a reasonable position in front of the area to alert drivers, so that they can adjust their speed and pass through the bottleneck area at the optimal speed. The optimal speed limit obtained by the calculation is communicated to road users in a dynamic form through information release equipment such as variable information boards, which can smooth the traffic flow and improve road safety and traffic capacity.
3.1.2. Architecture of the VSL System for a Bottleneck Area
To realize the function of the VSL system, the system should contain at least four parts: data acquisition layer, data transmission layer, VSL algorithm layer, and information release layer. A control structure diagram of the system and the components of each part are shown in Figure 2 [15,34].
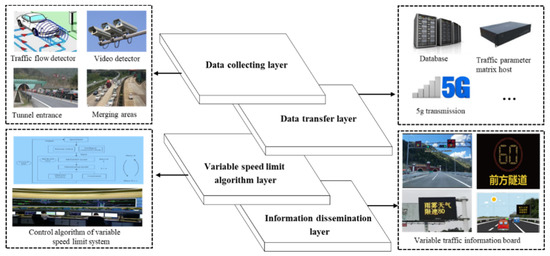
Figure 2.
Control structure diagram of VSL system.
In the data acquisition layer, traffic flow detectors are used to obtain the real-time traffic flow state in bottleneck areas of the freeway. The data transmission layer acts as an intermediary between the detection device and the control layer, transmitting the detection information to the information base by means of an optical cable or cellular network, and obtaining the final traffic parameters by analyzing and processing the matrix host [35,36]. The algorithm layer refers to the VSL control algorithm based on the traffic state parameter information obtained to calculate the optimal speed limit of the current road. It should be used to determine the content of the information release. The VSL algorithm was mostly designed for this purpose. The information release layer is the freeway information control center that calculates the optimal speed limit through the road information equipment to achieve the speed limit output. The VSL system realizes the flow of sensing–transmission–operation–release of traffic information through the close co-operation of the four parts. Finally, it can provide safe and efficient VSL information for road users.
3.1.3. Analysis of the Information Flow of the VSL System
During the implementation of a VSL system, it is necessary to ensure information interaction among vehicles, road infrastructure, and traffic control centers. The information exchange process of the VSL system is shown in Figure 3 [9,10], and contains the following steps: ①, ② The traffic control center obtains effective information such as the movement position of vehicles in the bottleneck area, road parameters, and weather through road traffic detectors. ③ The traffic control center collects and deals with all kinds of available data comprehensively. ④ The traffic control center discriminates the traffic flow of the road section based on the acquired real-time data on events such as congestion and accidents. ⑤ The traffic control center generates a VSL strategy based on the above (①–④) and sends this strategy to the variable information board in the bottleneck area. ⑥ Drivers adapt their driving behavior and adjust their driving speed after reading the contents of the information board. ⑦ The traffic control center records traffic events, VSL strategy, command execution, and results for offline system performance evaluation.
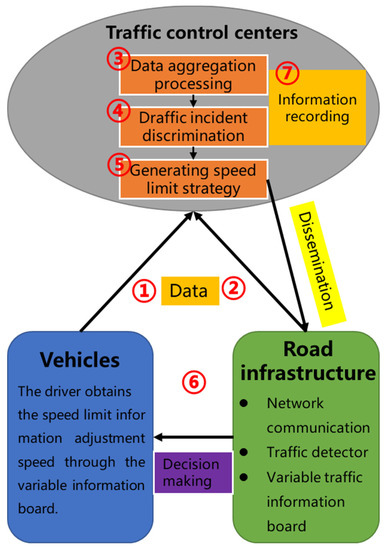
Figure 3.
Information interaction of VSL system.
3.2. Research on VSL Rules Based on Different Scenarios
At present, research regarding VSL rules on freeways primarily considers the application rules in different traffic congestion and adverse weather scenarios. The freeway itself carries a large volume of different types of traffic, and the running state of traffic flow is relatively complex; this results in the formation of traffic bottlenecks and congestion problems. In addition, visibility in adverse weather conditions is low, which causes traffic accidents. Based on the related research results, we studied the VSL rules under the above two conditions.
3.2.1. VSL Rules Based on Traffic Congestion
Drivers will adjust their speed immediately to prevent rear-end collisions when they encounter congestion without being warned. This will increase the degree of dispersion of vehicle speed and lead to the occurrence of serious accidents. The purpose of VSL system control is to reduce the dispersion of vehicle speed and control speed in advance to alleviate traffic congestion and reduce the possibility of secondary accidents while ensuring safety. The speed limit triggered by the system is based on traffic congestion. Different levels of congestion correspond to different optimal speed limits. Rule 1 gives the VSL rule of a freeway based on the congestion state.
| Rule 1: Variable rate-limiting rule in crowded state |
| if C = N, then Slimit = Vcongestion |
In Rule 1, C indicates the color representing the degree of congestion, N indicates the color corresponding to different degrees of congestion, Slimit (km/h) is the warning speed limit, and Vcongestion (km/h) is the warning speed limit with different degrees of congestion.
3.2.2. VSL Rules Based on Adverse Weather
Adverse weather refers to various phenomena that can reduce the safety of road travel, such as fog and rain. Adverse weather conditions will greatly reduce drivers’ perception of the traffic environment, which may lead them to misjudge existing phenomena [37]. At the same time, rainy weather will also affect the friction between the car tires and the road surface, reduce the adhesion coefficient, and increase the possibility of drivers losing control of their vehicles [38]. The VSL system detects the traffic flow parameters under different meteorological conditions in real time and provides the optimal speed limit for the corresponding scenario based on the VSL control rule. This is particularly important for improving road safety. Therefore, based on relevant research, this section gives the VSL rule under different types of adverse weather conditions [39,40,41,42]. This way, we can form a complete VSL value determination system under adverse weather conditions and provide a reference for the determination of speed limits under such conditions.
Drivers’ visibility on foggy days is much lower than in normal weather conditions, and their effective visibility can drop to less than 50 m, which is extremely dangerous for vehicles running at high speed. Rule 2 is the VSL rule for freeways with different visibility levels on foggy days.
| Rule 2: VSL rule on foggy days |
| if visfog ∈ (x1, x2), then Slimit = Vfog |
In Rule 2, visfog (m) is visibility under foggy conditions, x1 and x2 are specific values of visibility, Slimit (km/h) is the warning limit, and Vfog (km/h) is the warning limit under different visibility levels.
Unlike foggy days, rainy days not only affect the driver’s visibility but also have a negative impact on the friction coefficient between the tires and the road, which makes it easy for serious accidents to occur without speed control. The occurrence of accidents on rainy days is mostly related to slippery road surfaces. The existing studies include VSL rules based on different levels of rainfall severity and different water-film thicknesses. In practical applications, information on 12 h of rainfall is easy to obtain, and the variable rate-limiting rule for rainy days based on hourly rainfall (drain12, in mm) is shown as Rule 3.
| Rule 3: VSL rule on rainy days |
| if drain12 ∈ (x3, x4), then Slimit = Vrain |
In Rule 3, x3 and x4 are specific values of hourly rainfall, Slimit (km/h) is the early-warning limit, and Vrain (km/h) is the early-warning limit of drain12 (mm) under different hourly rainfall conditions.
3.2.3. Parameter Calibration of the VSL Rule
Rules 1–3 can be used alone or in combination according to the available data in the actual application. For a single application, only the input data for the corresponding rule are needed. If multiple data sources are available on-site, the rate limit can be calculated based on different rules. Rules 1–3 can be used in combination as follows:
where Slimit-(multi-situation) (km/h) is the warning speed limit value for multi-situation conditions. Multi-situation indicates two of the three conditions (congestion, fog, and rain) occurring at the same time on the freeway. The minimum of the three different speed limit values (Vcongestion, Vfog, Vrain) is required as the warning speed limit. The meanings of Vcongestion, Vfog, and Vrain are shown above. The practical application rules of Rules 1–3 were determined based on the case data for a freeway section (speed limit 100 km/h) studied in this paper.
Slimit-(multi-situation) = Minimum {Vcongestion, Vfog, Vrain}
Traffic congestion status is classified based on microscopic parameters and traffic data, among which vehicle speed is the most commonly used and recommended index for evaluating traffic status [43]. According to the Temporary Technical Requirements for Monitoring and Service of Freeway Network Operation issued by the Ministry of Transport in 2012 [44], the congestion degree of freeway sections is divided into five levels based on speed: smooth, basically smooth, light congestion, congestion, and severe congestion (Table 3).
Table 3.
Congestion classification standard of freeway sections.
Based on Table 3, the actual application rules of VSL Rule 1 were determined as follows.
| Rule 1: Variable rate-limiting rule in crowded state (taking design speed of 100 km/h as an example) |
| if C = R, then Slimit = 20 if C = O, then Slimit = 40 if C = Y, then Slimit = 60 if C = B, then Slimit = 80 if C = G, then Slimit = 100 (no speed limit warning) |
In Rule 1, the colors assigned to the degree of road congestion are green (G), blue (B), yellow (Y), orange (O), and red (R), which correspond to the five freeway sections in Table 3: smooth, basically smooth, light congestion, moderate congestion, and severe congestion, respectively.
The standard Traffic Safety Control Conditions of Expressway on Foggy Days (GB/T 31445-2015) [45], issued by the Standardization Administration of China in 2015, divides the control levels of freeways on foggy days with visibility <200 m and puts forward corresponding traffic control regulations according to different visibility levels. The standard suggests that traffic control should be carried out on freeways when visibility is less than 200 m on foggy days. Based on this standard and referring to the calculation method of the vehicle speed limit under foggy conditions [46], the actual application rules of the VSL in Rule 2 are determined as follows.
| Rule 2: VSL rule on foggy days (taking design speed of 100 km/h as an example) |
| if visfog < 50, then Slimit = 40 if 50 ≤ visfog < 100, then Slimit = 50 if 100 ≤ visfog < 150, then Slimit = 60 if 150 ≤ visfog < 200, then Slimit = 80 if 200 ≤ visfog, then Slimit = 100 (no speed limit warning) |
Considering the influence of rainy conditions on driving [47] and referring to the calculation method of the speed limit under rainy conditions [17], the actual application rules of VSL Rule 3 are determined as follows.
| Rule 3: VSL rule on rainy days (taking design speed of 100 km/h as an example) |
| if drain12 > 50, then Slimit = 0 (recommend closing roads) if 29.9 < drain12 ≤ 50, then Slimit = 20 if 14.9 < drain12 ≤ 29.9, then Slimit = 60 if 4.9 < drain12 ≤ 14.9, then Slimit = 80 if drain12 ≤ 4.9, then Slimit = 100 (no speed limit warning) |
Because the security and efficiency factors of the rule differ in each situation and the rate-limiting value of the multi-situation fusion rule should meet the security requirements of each scenario, the minimum value of each rule is taken as the rate-limiting value of the fusion rule.
4. Example Simulation Environment and Parameter Setting
4.1. Simulation Scenario Construction in the VSL System
To study the effectiveness of the VSL system in practical applications and analyze whether the VSL rules in different scenarios can effectively smooth traffic flow velocity and road capacity, a simulation scenario of the system in line with the research purpose was built based on the VISSIM microscopic traffic simulation software (VISSIM4.3, PTV Planung Transport Verkehr, Karlsruhe, Germany). The simulation scenario was designed according to the formation causes and characteristics of the bottleneck area of the freeway described above. Due to the suddenness of dynamic traffic events, the application of the VSL system is difficult, so scenario design was carried out for bottleneck points caused by road design and traffic management issues.
Simulation scenario 1 is a common road and traffic scenario near the entrance of a high-speed tunnel caused by road design issues [30]. The content of the scenario is shown in Figure 4. The total length of the simulated section is 5000 m, the normal section comprises three one-way lanes, the lane width is 3.75 m, and the speed limit is 100 km/h. The number of lanes decreases 500 m upstream of the tunnel entrance, the bottleneck reduces traffic to two one-way lanes, and the speed limit is 80 km/h. The scenario is set at the location where the number of lanes decreases and congestion occurs. The starting position of the speed adjustment of the VSL system is set at 500 m upstream of the congested section. The end position of the speed adjustment of the VSL system is set at 200 m before the tunnel entrance. Due to the large traffic volume, high dispersion of vehicle speed, and fixed bottleneck points, there are frequent accidents and serious congestion at the tunnel entrance in practice. It is urgent to apply a VSL system to realize active risk prevention and traffic control. Therefore, it is of practical significance to study whether the VSL system would be effective in this environment to alleviate the traffic problems.
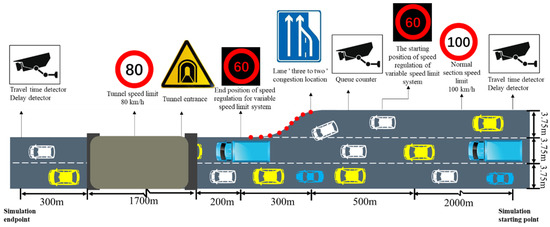
Figure 4.
Diagram of simulation scenario 1 of VSL system.
Simulation scenario 2 is a road traffic operation scenario in a common freeway merging area caused by traffic management issues, in which three lanes are reduced to two lanes [24]. The setting of this scenario is shown in Figure 5. The total length of the simulation section is 4500 m, the normal section comprises three one-way lanes, the lane width is 3.75 m, and the speed limit is 100 km/h. The number of lanes decreases 2000 m upstream of the simulated endpoint, and the merging area reduces to two one-way lanes. The scenario is set at the merging area where the number of lanes decreases and congestion occurs. The start position of the speed adjustment of the VSL system is set 500 m upstream of the congested section, and the end position is set 300 m downstream of the congested area where the three lanes change to two lanes. Due to the daily traffic volume in the merging area, the vehicle delay is large and traffic congestion often occurs, which reduces the service level of the freeway. Therefore, it is significant to study the effectiveness of VSL systems in this environment in order to improve the efficiency of road traffic.
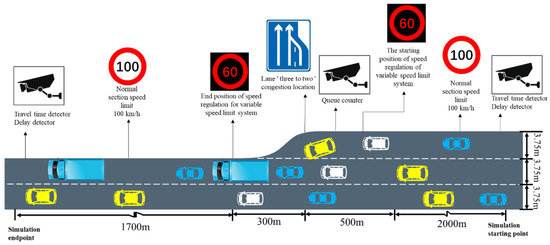
Figure 5.
Diagram of simulation scenario 2 of VSL system.
4.2. Setting the Simulation Parameters of the VSL System
To effectively evaluate the VSL system in the simulation scenario, it is necessary to customize the parameters of the VISSIM microscopic traffic simulation software. In this study, experimental simulation parameters were set from five aspects: driving behavior traffic composition and flow input, parameter setting, congestion scenario parameter setting, VSL parameter setting, and detector setting. The parameter setting interface is shown in Figure 6.
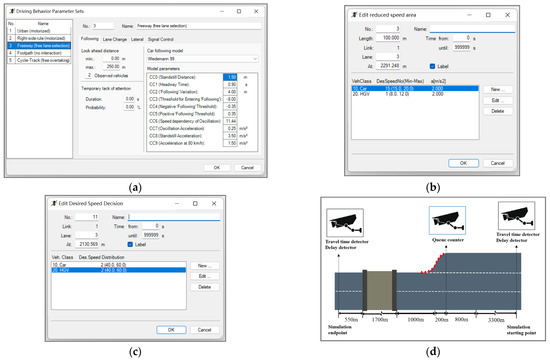
Figure 6.
VISSIM simulation parameter setting: (a) driving behavior; (b) congestion scenario; (c) VSL; (d) detector positions.
The traffic in this section is composed of two types of vehicles: cars and heavy trucks. The following distance of the driver, the parameters of lane change, and the running speed of the vehicle are set. The vehicle-following model is Wiedemann 99, which is suitable for intercity road and freeway traffic. The setting interface is shown in Figure 6a. In the actual scenario, the number of lanes decreases and the bottleneck point is the location where congestion often occurs, so this area was selected as the simulated congestion section. To simulate congestion, the speed in this area was limited accordingly. In the simulated scenario, the expected speed was set as (15, 20) for cars and (8, 12) for heavy trucks in the bottleneck section where the number of lanes decreases. The setting interface is shown in Figure 6b.
The implementation of the VSL system in VISSIM can cause changes in vehicle speed in different sections by setting the desired speed and delimiting the decision range by setting the decision starting and ending points. In the same decision interval, different types of vehicles can have different expected speed distributions. In the scenario where the number of lanes on the road decreases, causing congestion at the bottleneck, and driving speeds are low, to buffer the congestion and reduce the dispersion of vehicle speed, a VSL is implemented 500 m upstream of the congestion area in the simulation. Under the condition that drivers fully obey the VSL, the expected speed of passenger cars and trucks is set according to different speed limits. The parameter-setting method is shown in Figure 6c. Three types of detectors are set up in the simulation scenario: ① travel time detectors at the beginning and end sections, ② delay detectors at the beginning and end sections, and ③ queuing counters 200 m upstream of the congestion area. Detailed information on detector placement is shown in Figure 6d.
The compliance of drivers with the VSL system is assumed to be 100%. The purpose of the experiment is to find the optimal speed limit under different flow conditions. The input flow conditions of the two scenarios were set as shown in Figure 7.
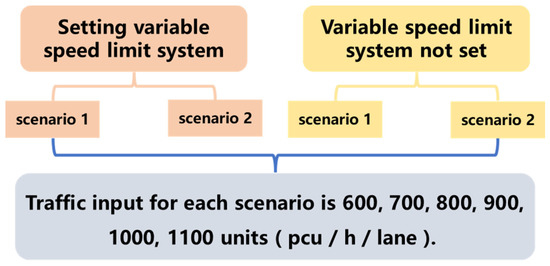
Figure 7.
Traffic volume input of each scenario.
5. Simulation Results and Discussion
Two groups of comparative experiments were simulated for the system with a VSL and the system without a VSL. Since the current driving method is mainly manual driving, drivers themselves decide whether they want to obey the speed limit. It is impossible to give an accurate speed for a single vehicle. The speed limit prompt is mainly to guide the overall traffic flow of a given section. For this reason, driver compliance is set to 100% in the two scenarios where the VSL system is used. The queuing counters and delay detectors on the road can obtain the average queuing length and delay time after each simulation under different conditions and then reflect the traffic running state.
5.1. Analysis of Simulation Results in Scenario 1
First, ten random speed simulation experiments were performed to output the average vehicle speed with different time intervals and different flows in the congested section in scenario 1 without a VSL system. The specific vehicle speeds are shown in Table 4.
Table 4.
Flow speed (km/h) relationship with different time intervals in scenario 1 without VSL system.
The mean value represents the average speed of vehicles in one hour under different flow rates. To explore the influence of the speed limit on traffic efficiency under different flow rates, according to the speed status results in Table 4, the speed limit of 60 km/h was set for the simulation of scenario 1. A comparison of absolute delay values from the VISSIM output after six groups of comparative simulation experiments with ten random speeds is shown in Figure 8.
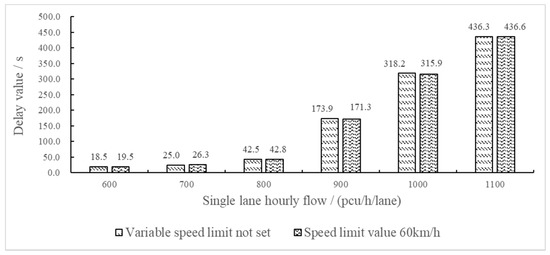
Figure 8.
Comparison of absolute values of delay in scenario 1 with and without VSL system.
Figure 8 shows the following:
① When the flow is 600−800 pcu/h/lane, setting a VSL of 60 km/h increases the delay when the driving speed is reduced. This indicates that when the flow is 600–800 pcu/h/lane, the traffic state is smooth and drivers can drive according to the fixed speed limit of the road. When the flow is low, the VSL system can inhibit traffic efficiency.
② When the flow is 900−1000 pcu/h/lane, setting a VSL of 60 km/h can inhibit traffic congestion in the bottleneck area and reduce the delay. This indicates that when the flow is 900–1000 pcu/h/lane, the traffic state is slightly congested or worse, and the time and degree of downstream traffic congestion can be delayed by speed control. When traffic is congested, the VSL system plays a positive role in alleviating congestion and improving traffic efficiency.
③ When the flow rate further increases to 1100 pcu/h/lane, the VSL system also has a restraining effect on traffic efficiency.
Figure 8 illustrates that the VSL system plays different roles under different flow conditions, which also proves that different flow rates need different speed limits. To find reasonable speed limits under different flow rates, it is necessary to study the delay changes with different speed limits. Based on a simulation scheme with a speed limit of 60 km/h in scenario 1, two simulation experiments with speed limits of 40 and 80 km/h were conducted. In each simulation experiment, six groups of comparison experiments with different flow conditions were conducted. The percentage of delay change in scenario 1 compared with the system without a VSL is shown in Figure 9.
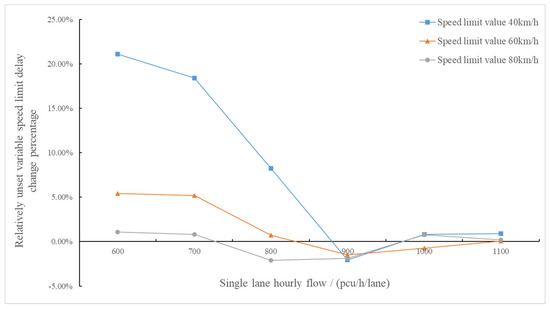
Figure 9.
Comparison of delay change percentages in scenario 1 with and without VSL system.
Figure 9 shows the following:
① At a low flow of 600−700 pcu/h/lane, when two VSLs are set, the change rate of the delay is positive, and the low speed limit seriously affects traffic efficiency. The change in delay is the smallest when the speed limit is 80 km/h, consistent with the actual speed shown in Table 4. When the flow is 800 pcu/h/lane, road congestion has just occurred. At this point, a speed limit value of 80 km/h is just right to keep the traffic flow running properly.
② At a medium flow of 900 pcu/h/lane and variable speed limits of 40, 60, and 80 km/h, the change rate of the delay is negative. In other words, under medium flow, the road is in the initial stage of forming congestion, and traffic efficiency can be improved by a VSL to a certain extent.
③ At a high flow of 1000−1100 pcu/h/lane, setting different speed limits has a limited effect on improving traffic efficiency. Because the road segment is already congested, the influence of different speed limits on traffic efficiency does not differ.
5.2. Analysis of Simulation Results in Scenario 2
First, the vehicle speed data with different time intervals and different flows in scenario 2 without a VSL system were analyzed. The specific vehicle speed operation is shown in Table 5.
Table 5.
Flow speed (km/h) relationship with different time intervals in scenario 2 without VSL system.
According to the speed status results in Table 5, a VSL of 60 km/h was set for the scenario 2 simulation according to the speed limit rule of Rule 1 in Section 3.2. The results of the absolute delay output of VISSIM for six groups of comparative simulation experiments with ten random speeds are shown in Figure 10.
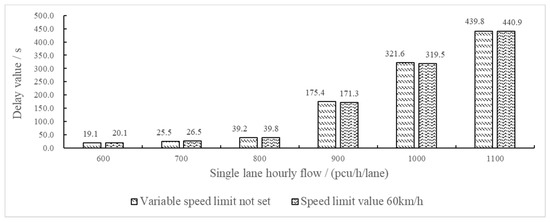
Figure 10.
Comparison of absolute value of delay in scenario 2 with and without VSL system.
The results of the merging area scenario (Figure 10) are consistent with the results of the tunnel area scenario (Figure 9). Therefore, similar conclusions can be drawn from the simulation of speed limits in bottleneck areas on different freeways; that is, the performance of the same speed limit differs under different flows. The results of the percentage change of delay in scenario 2 compared with the system without a VSL, to find a reasonable speed limit under different flows, are shown in Figure 11.
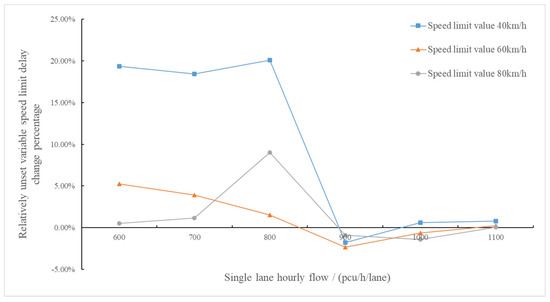
Figure 11.
Comparison of delay change percentage in scenario 2 with and without VSL system.
Figure 11 shows that the overall result is approximately the same as in scenario 1:
① At a low flow of 600−800 pcu/h/lane, VSLs of 40, 60, and 80 km/h were set, and the percentage change rate of the delay was positive. When the VSL was 40 km/h, the percentage change rate of the delay was the largest, which seriously affects traffic efficiency.
② At a medium flow of 900 pcu/h/lane, the percentage change rate of the delay with different VSLs was negative, indicating that when the flow is at approximately this level, setting a VSL can improve the traffic efficiency to a certain extent.
③ At a high flow of 1000−1100 pcu/h/lane, the conclusion was consistent with scenario 1. Congestion already occurred under high traffic conditions when the speed was low and the effect of further speed limits was not obvious. From a safety perspective, it is necessary to have a lower speed limit, which has little impact on the actual traffic flow but a positive impact on the psychology of drivers. This aspect can be explored in depth in future studies.
Rule 1 is used to quantify the corresponding speed limit grading rules specifically for traffic flow congestion. Once the traffic flow is congested, the speed difference between the upstream and downstream of a bottleneck area can be reduced by using graded speed limit rules. This is why the performance results of the simulation test of Rule 1 in two typical bottleneck scenarios using VISSIM are good.
Through the simulation experiment using the two scenarios, the VSL system reduces the driving speed on the whole, improves the speed consistency level, and has a positive effect on improving traffic safety. However, the appropriate speed limit according to different congestion states must be chosen. In practical engineering applications, to avoid drastic speed reduction, it is necessary to consider the difference between the upstream and downstream speed limits to develop a corresponding speed limit scheme. When the difference between the two speed limits is large (e.g., the fixed speed limit is 100 km/h and the VSL rule requires a speed limit of 40 km/h), it is necessary to apply a graded speed limit (i.e., a variable information board should be added in the upstream 500 to 1000 m range stating “Speed limit 60 km/h” or “Speed limit 80 km/h” for the transition).
6. Research Contribution and Novelty
The research results reported in this paper can provide a theoretical reference for the design and practical application of variable speed limit systems in freeway bottleneck areas. The VSL rules proposed in this paper can alleviate traffic congestion and improve traffic efficiency and safety. It also provides a contribution to the active traffic management of freeways. Under the policy guidance of sustainable transportation development, VSL technology will gain an important development opportunity. The VSL technology will provide a potential contribution to the sustainable development of transportation to a certain degree.
7. Conclusions
In this study, we designed the architecture and information interaction flow of a VSL system in a bottleneck area of a freeway and provided rules for the VSL system under different traffic congestion and adverse weather conditions. The above designed and specified VSL rules consider congestion and two adverse weather conditions. Different speed limits corresponding to different congestion levels, visibility levels on foggy days, and rainfall levels on rainy days are quantified. The existing VSL rules in the related literature have a single focus, and most of them do not give specific quantitative speed limits. Through microscopic modeling and simulating the road section in the bottleneck area, a method of determining reasonable speed limits under different flows was explored. The influence mode of different speed limits in different flows on the traffic flow in the bottleneck area was analyzed. Under low flow (600–800 pcu/h/lane), the traffic flow is smooth and the VSL system will reduce traffic efficiency and increase speed fluctuation. Under medium flow (900 pcu/h/lane), a reasonable speed limit can reduce the time and degree of traffic congestion at bottleneck points, and can alleviate traffic congestion to a certain extent and improve traffic efficiency. Under high flow (1000–1100 pcu/h/lane), congestion has already formed in bottleneck areas. The VSL has a limited effect on alleviating traffic congestion and improving traffic efficiency, but a reasonable speed limit is expected to reduce speed deviation and improve traffic safety. It can be seen that the VSL system can alleviate traffic congestion and improve traffic efficiency and safety under certain conditions. This provides a certain contribution to sustainable traffic development.
In practical engineering applications, the principle of graded speed limits mentioned above can be applied. For a better implementation of variable speed limit schemes, it is suggested that relevant speed limits are released using variable message boards to better inform drivers. This paper does not consider where the optimal VSL strategies start to be implemented, which will need to be optimised for future practical applications. In addition, the frequency of data updates is an important aspect to study. For example, a conservative recommendation for the frequency of data updates could be 10 min and a sensitive recommendation could be 5 min.
Based on this paper, further research can be carried out in the following four aspects. First, compliance is a difficult research topic. Therefore, the effect of applying the VSL system under different compliance levels and its influence on speed limits under different flow conditions can be studied to explore the influencing mechanism and measures to improve driver compliance. Second, it is currently difficult to achieve simulation testing of adverse weather conditions and corresponding driving behavior analysis using VISSIM. Scenario development using driving simulation technology could be used to complete such experiments in the future. Third, a comprehensive method for evaluating the impact of VSL on traffic flow in different scenarios, considering the impact of safety, efficiency, and ecology, can be explored for further guidance on the practical application of VSL. Fourth, the VSL system can be evaluated using crashes or surrogate measures such as conflicts.
Author Contributions
Conceptualization, J.N., S.L. and H.L.; Methodology, J.N., E.L. and H.L.; Project administration, K.C.; Validation, E.L. and Z.L.; Writing—original draft, J.N. and S.L.; Writing—review and editing, S.L. and H.L. All authors have read and agreed to the published version of the manuscript.
Funding
This research was funded by the Science and Technology Project of the Henan Transportation Department (Grant No. 2020G-2-16).
Institutional Review Board Statement
Ethical review and approval were waived for this study due to “Not applicable” for studies not involving humans or animals.
Informed Consent Statement
Informed consent was obtained from all the subjects involved in the study.
Data Availability Statement
The research data in this paper are shown in Figures and Tables.
Acknowledgments
We thank the Science and Technology Demonstration Project of the Transportation Department of Guangxi Zhuang Autonomous Region (Traffic Congestion Control and Intelligent Decision System Project of Guangxi Highway) for supporting this research.
Conflicts of Interest
The authors declare no conflict of interest.
References
- Sofer, T.; Polus, A.; Bekhor, S. A congestion-dependent, dynamic flexibility model of freeway networks. Transp. Res. Part C Emerg. Technol. 2013, 35, 104–114. [Google Scholar] [CrossRef]
- Transportation Research Board. Highway Capacity Manual 2000; National Research Council: Washington, DC, USA, 2000. [Google Scholar]
- Wu, J.; Zhou, X.; Peng, Y.; Zhao, X. Recurrence analysis of urban traffic congestion index on multi-scale. Phys. A Stat. Mech. Its Appl. 2022, 585, 126439. [Google Scholar] [CrossRef]
- Yang, Z.; Tang, R.; Zeng, W.; Lu, J.; Zhang, Z. Short-term prediction of airway congestion index using machine learning methods. Transp. Res. Part C Emerg. Technol. 2021, 125, 103040. [Google Scholar] [CrossRef]
- Zhou, Y.; Jiang, X.; Fu, C.; Liu, H.; Zhang, G. Bayesian spatial correlation, heterogeneity and spillover effect modeling for speed mean and variance on urban road networks. Accid. Anal. Prev. 2022, 174, 106756. [Google Scholar] [CrossRef] [PubMed]
- Smulders, S. Control of freeway traffic flow by variable speed signs. Transp. Res. Part B Methodol. 1990, 24, 111–132. [Google Scholar] [CrossRef]
- Lee, J.; Baig, F.; Talpur, M.; Shaikh, S. Public intentions to purchase electric vehicles in Pakistan. Sustainability 2021, 13, 5523. [Google Scholar] [CrossRef]
- Talpur, M.A.H.; Khahro, S.H.; Ali, T.H.; Bin Waseem, H.; Napiah, M. Computing travel impendences using trip generation regression model: A phenomenon of travel decision-making process of rural households. Environ. Dev. Sustain. 2022, 1–24. [Google Scholar] [CrossRef]
- Yu, D.X.; Liu, H.; Zhen, L.L.; Ma, X.; Xing, X.; Zhang, H. Variable speed limit control method for freeway bottleneck area. J. Transp. Syst. Eng. Inf. Technol. 2018, 18, 120–125. [Google Scholar]
- Lu, X.Y.; Varaiya, P.; Horowitz, R.; Su, D.; Shladover, S.E. A new approach for combined freeway variable speed limits and coordinated ramp metering. In Proceedings of the 13th International IEEE Conference on Intelligent Transportation Systems, Funchal, Portugal, 19–22 September 2010. [Google Scholar]
- Hegyi, A.; Schutter, B.D.; Hellendoorn, H. Model predictive control for optimal coordination of ramp meterine and variable speed limits. Transp. Res. Part C 2015, 13, 185–209. [Google Scholar] [CrossRef]
- Zegeye, S.K.; De Schutter, B.; Hellendoorn, J.; Breunesse, E.A. Variable speed limits for green mobility. In Proceedings of the 2011 14th International IEEE Conference on Intelligent Transportation Systems, Washington, DC, USA, 5–7 October 2011. [Google Scholar]
- Frejo, J.R.D.; De Schutter, B. SPERT: A speed limit strategy for recurrent traffic jams. IEEE Trans. Intell. Transp. Syst. 2018, 20, 692–703. [Google Scholar] [CrossRef]
- Choi, S.; Oh, C. Proactive strategy for variable speed limit operations on freeways under foggy weather conditions. Transp. Res. Rec. J. Transp. Res. Board 2016, 2551, 29–36. [Google Scholar] [CrossRef]
- Wang, M.; Daamen, W.; Hoogendoorn, S.P.; van Arem, B. Connected variable speed limits control and car-following control with vehicle-infrastructure communication to resolve stop-and-go waves. J. Intell. Transp. Syst. 2016, 20, 559–572. [Google Scholar] [CrossRef]
- Frejo, J.R.D.; Papamichail, I.; Papageorgiou, M.; De Schutter, B. Macroscopic modeling of variable speed limits on freeways. Transp. Res. Part C Emerg. Technol. 2019, 100, 15–33. [Google Scholar] [CrossRef]
- Jian-bei, L.I.U.; Jing, L.; Teng-feng, G.U.O. Variable speed limit method based on safe permissible speed under wet weather. China J. Highw. Transp. 2015, 28, 128–133. [Google Scholar]
- Wen, H.Y.; Liu, M.; Wang, H.W. A control method of variable speed limits for highway mountain breeze transit road in rainy days. J. South China Univ. Technol. 2016, 44, 67–73. [Google Scholar]
- Wang, X.L.; Zhang, S.D.; Yu, X.T. Sub-area control method of variable speed control for accident section on expressway. J. Shijiazhuang Tiedao Univ. 2017, 30, 41–45. [Google Scholar]
- Yuan, Q.; Liu, Z.H.; Li, J.L.; Zhang, J.M.; Yang, F.C. A traffic congestion detection and information dissemination scheme for urban expressways using vehicular networks. Transp. Res. Part C Emerg. Technol. 2014, 47, 114–127. [Google Scholar] [CrossRef]
- Kattan, L.; Khondaker, B.; Derushkina, O.; Poosarla, E. A probe-based variable speed limit system. J. Intell. Transp. Syst. Technol. Plan. Oper. 2015, 19, 339–354. [Google Scholar] [CrossRef]
- Papamichail, I.; Papageorgiou, M.; Stamatakis, I. Feedback traffic control at highway work zones using variable speed limits. IFAC-PapersOnLine 2018, 51, 329–336. [Google Scholar] [CrossRef]
- Shi, B.Y.; Gao, X.Y.; Ge, Z.; Ma, X.P. Simulation and analysis of the variable speed limit controls on highway maintenance. Appl. Mech. Mater. 2011, 97, 329–336. [Google Scholar] [CrossRef]
- Jo, Y.; Choi, H.; Jeon, S.; Jung, I. Variable speed limit to improve safety near traffic congestion on urban freeways. Int. J. Fuzzy Syst. 2012, 14, 278–288. [Google Scholar]
- Ali, J. Intelligent advisory speed limit dedication in highway using VANET. Sci. World J. 2014, 10, 1–20. [Google Scholar]
- Grumert, E.; Ma, X.; Tapani, A. Analysis of a cooperative variable speed limit system using microscopic traffic simulation. Transp. Res. Part C Emerg. Technol. 2015, 52, 173–186. [Google Scholar] [CrossRef]
- Zhao, X.; Xu, W.; Ma, J.; Li, H.; Chen, Y.; Rong, J. Effects of connected vehicle-based variable speed limit under different foggy conditions based on simulated driving. Accid. Anal. Prev. 2019, 128, 206–216. [Google Scholar] [CrossRef] [PubMed]
- Sadat, M.; Celikoglu, H. Simulation-based variable speed limit systems modelling: An overview and a case study on istanbul freeways. Transp. Res. Procedia 2017, 22, 607–614. [Google Scholar] [CrossRef]
- Wang, X.; Zhang, R.; Gou, Y.; Liu, J.; Zhao, L.; Li, Y. Variable speed limit control method of freeway mainline in intelligent connected environment. J. Adv. Transp. 2021, Pt 6, 8863487.1–8863487.12. [Google Scholar] [CrossRef]
- Cui, J.; Zhao, J. The control of the variable speed limits at long tunnel freeway entrance. J. Saf. Environ. 2016, 16, 119–122. [Google Scholar]
- Tian, L.; Zhu, H.; Zhu, X.; Tian, B. Vehicle-road cooperative speed limiting method facing the traffic efficiency of expressway ramp confluence area. Highway 2019, 64, 310–316. [Google Scholar]
- Sun, C.; Gao, H. Traffic model with variable speed limit control based on correction factor under foggy weather condition. Sci. Technol. Eng. 2020, 20, 4016–4021. [Google Scholar]
- Shi, W. Research on variable speed limit algorithm on expressway. J. Highw. Transp. Res. Dev. 2020, 16, 349–352. [Google Scholar]
- Coifman, B.; Kim, S. Extended bottlenecks, the fundamental relationship, and capacity drop on freeways. Transp. Res. Part A Policy Pract. 2011, 45, 980–991. [Google Scholar] [CrossRef]
- Saifuzzaman, M.; Moon, N.N.; Nur, F.N. IoT based street lighting and traffic management system. In Proceedings of the 2017 IEEE region 10 humanitarian technology conference (R10-HTC), Dhaka, Bangladesh, 21–23 December 2017; pp. 121–124. [Google Scholar]
- Saifuzzaman, M.; Shetu, S.F.; Moon, N.N.; Nur, F.N.; Ali, M.H. IoT based street lighting using dual axis solar tracker and effective traffic management system using deep learning: Bangladesh context. In Proceedings of the 2020 11th International Conference on Computing, Communication and Networking Technologies (ICCCNT), Kharagpur, India, 1–3 July 2020; pp. 1–5. [Google Scholar]
- Yang, M. The influence of weather environment based on simulated driving on driver’s risk perception characteristics. Beijing Automot. Eng. 2017, 2, 11–13. [Google Scholar]
- Ding, G.; Liu, C.; Zhou, J. Impact of meteorological conditions on expressway operation in anhui province. J. Arid. Meteorol. 2018, 36, 146–151. [Google Scholar]
- Wu, Q. Research on Speed Limit of Mountain Highway under the Influence of Adverse Weather. Master’s Thesis, Chang’an University, Xi’an, China, June 2019. [Google Scholar]
- Liu, Y. Research on Variable Speed Limitation Control of Expressway under Unfavorable Weather. Master’s Thesis, Kunming University of Science and Technology, Kunming, China, March 2014. [Google Scholar]
- Kang, H. Research on Expressway Variable Speed Limit System Based on Traffic Weather Environment Monitoring. Master’s Thesis, Shaanxi Normal University, Xi’an, China, May 2019. [Google Scholar]
- Yang, C. Study on the Security Technology of Expressway under Adverse Climate of Fog&Ice in Mountain Area. Master’s Thesis, Chang’an University, Xi’an, China, June 2015. [Google Scholar]
- Jiang, G. Technologies and Applications of the Identification of Road Traffic Conditions, 1st ed.; China Communications Press: Beijing, China, 2004. [Google Scholar]
- Wang, X. Temporary Technical Requirements for Monitoring and Service of Freeway Network Operation, 1st ed.; China Communications Press Co., Ltd.: Beijing, China, 2012; pp. 78–79. ISBN 978-71-1409-665-5. [Google Scholar]
- GB/T 31445-2015; Standard for Expressway Traffic Safety Control under Fog Weather Conditions. American National Standards Institute: New York, NY, USA, 2015.
- Shi, G.; Yuan, H.; Cheng, J. Calculation of speed limit on foggy days. J. Southwest Jiaotong Univ. 2010, 45, 136–139+159. [Google Scholar]
- Li, L.; Liu, T.; Wang, F. Study on the influence of visibility on highway traffic safety in rainy days. Highway 2013, 5, 136–140. [Google Scholar]


Disclaimer/Publisher’s Note: The statements, opinions and data contained in all publications are solely those of the individual author(s) and contributor(s) and not of MDPI and/or the editor(s). MDPI and/or the editor(s) disclaim responsibility for any injury to people or property resulting from any ideas, methods, instructions or products referred to in the content. |
© 2022 by the authors. Licensee MDPI, Basel, Switzerland. This article is an open access article distributed under the terms and conditions of the Creative Commons Attribution (CC BY) license (https://creativecommons.org/licenses/by/4.0/).