
Land Use Pattern Changes and the Driving Forces in the Shiyang River Basin from 2000 to 2018


Abstract
1. Introduction
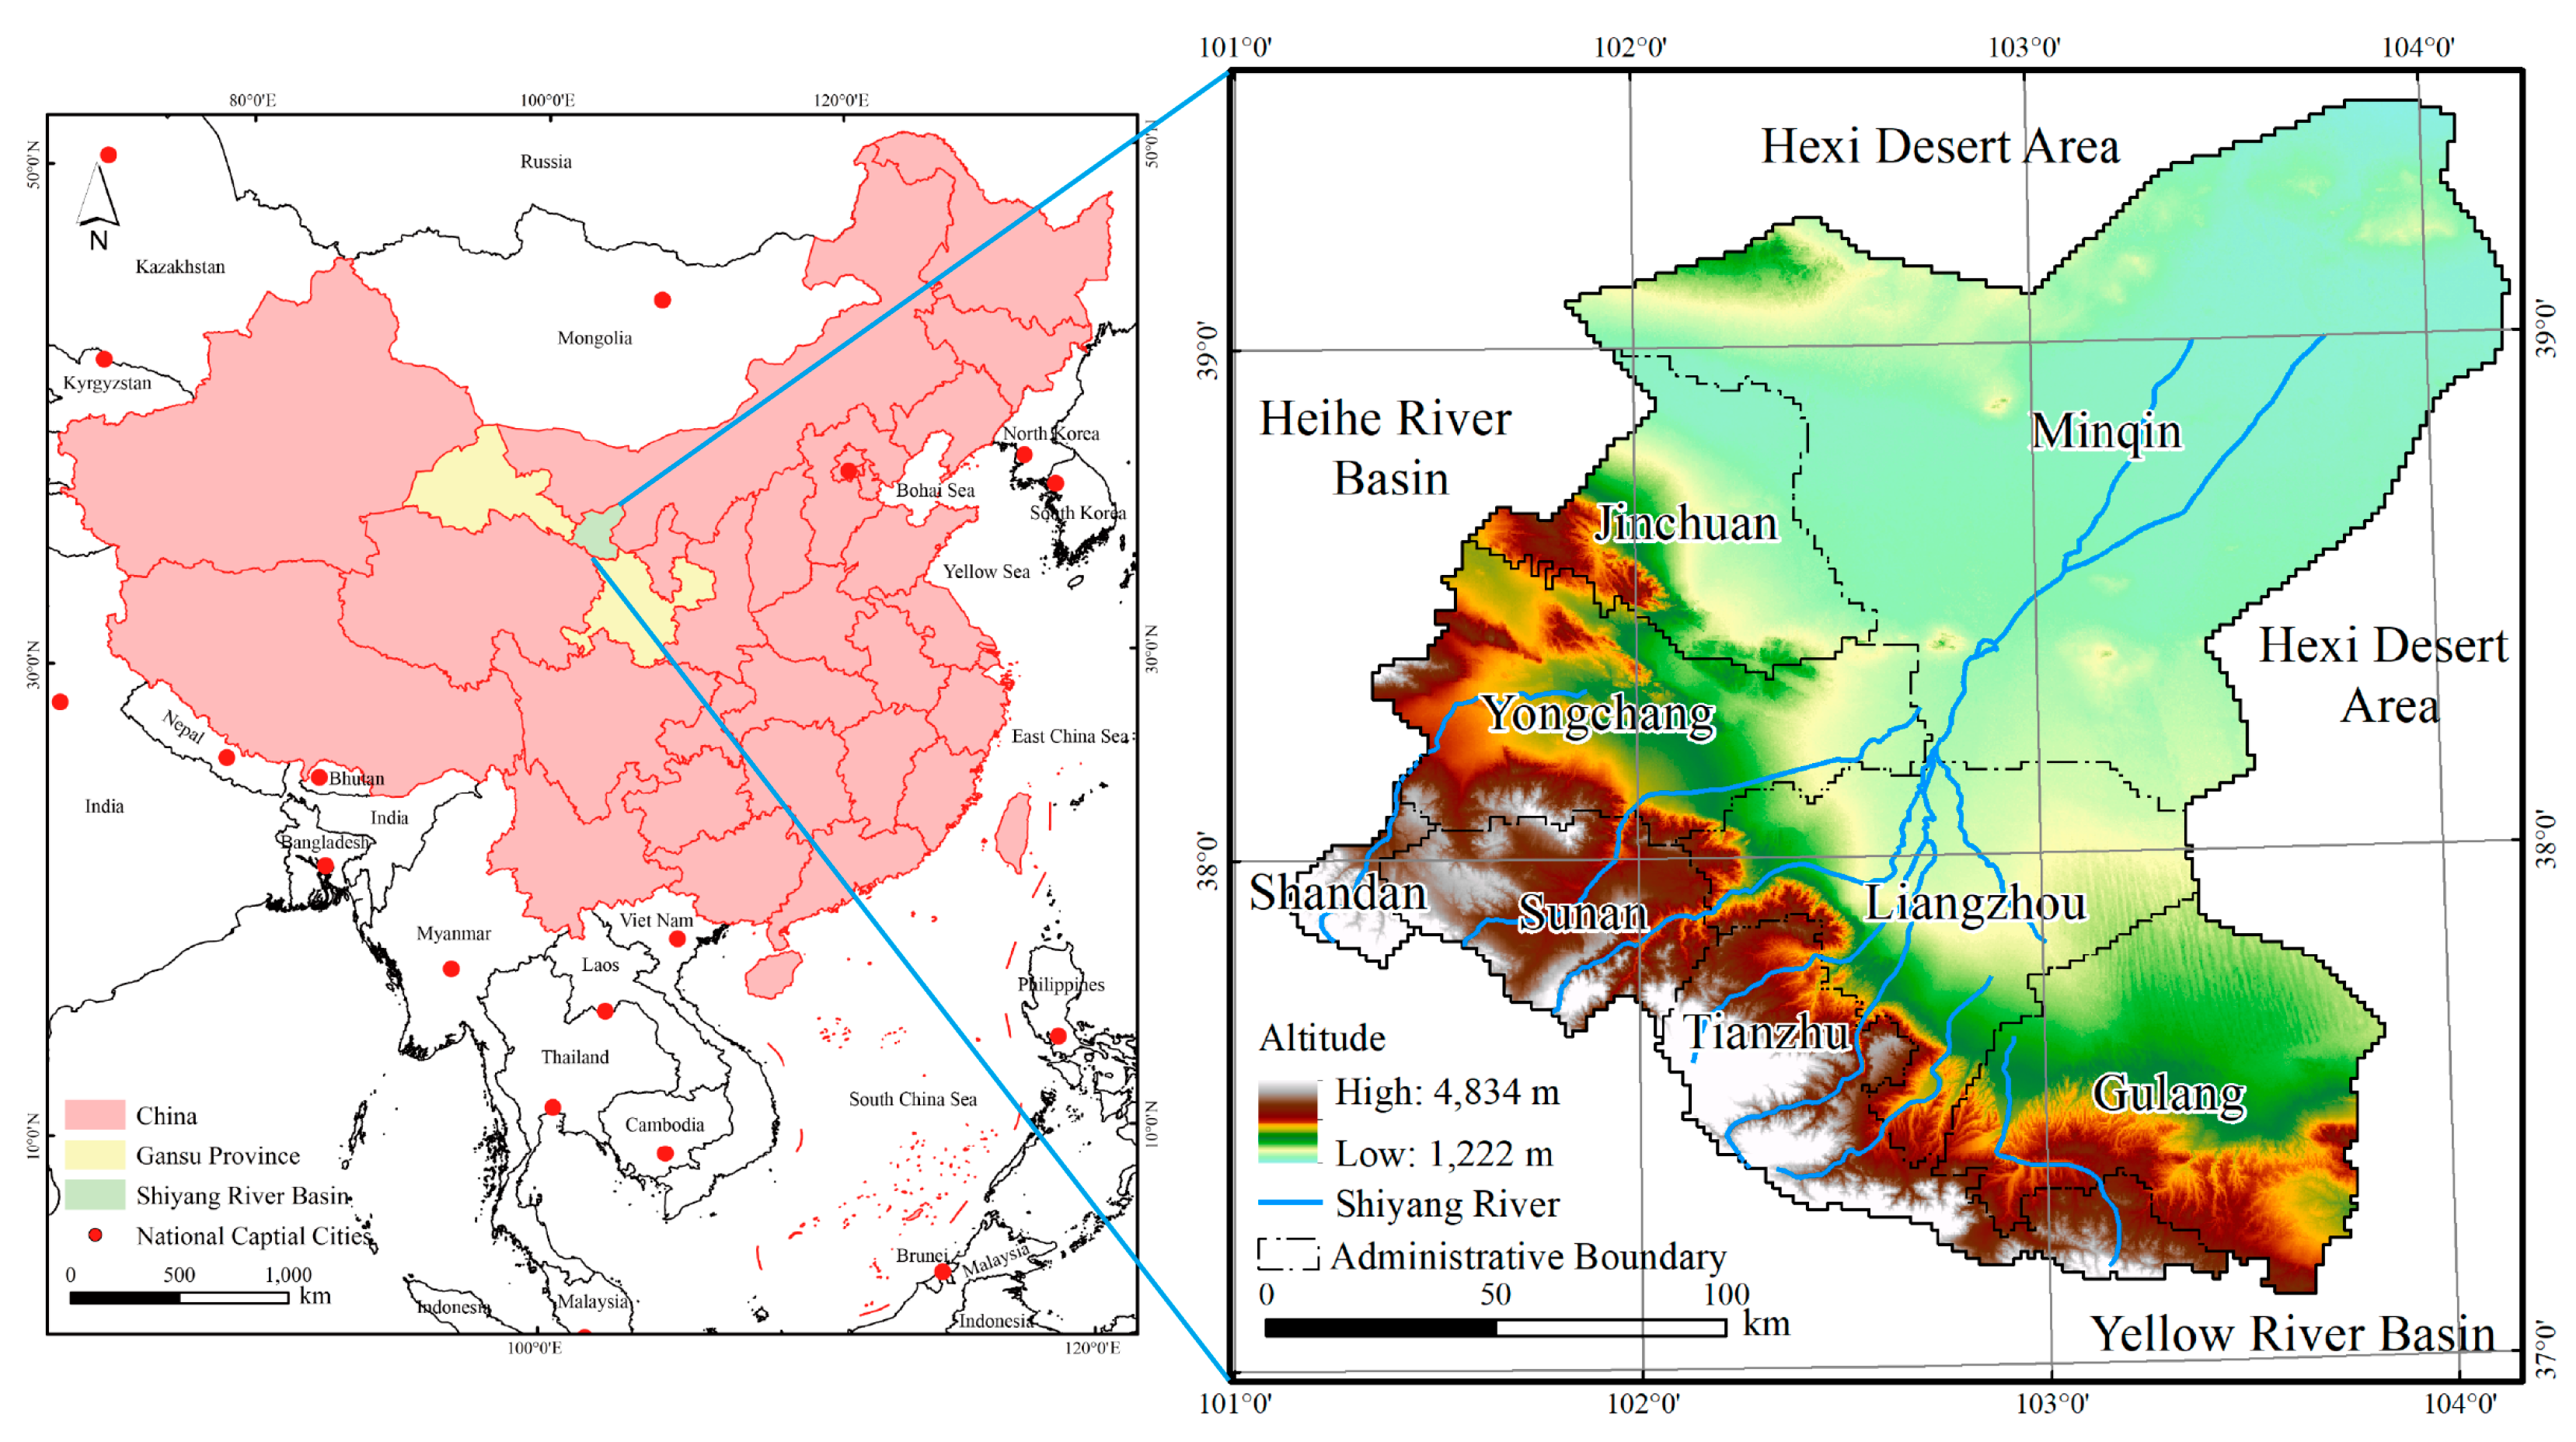
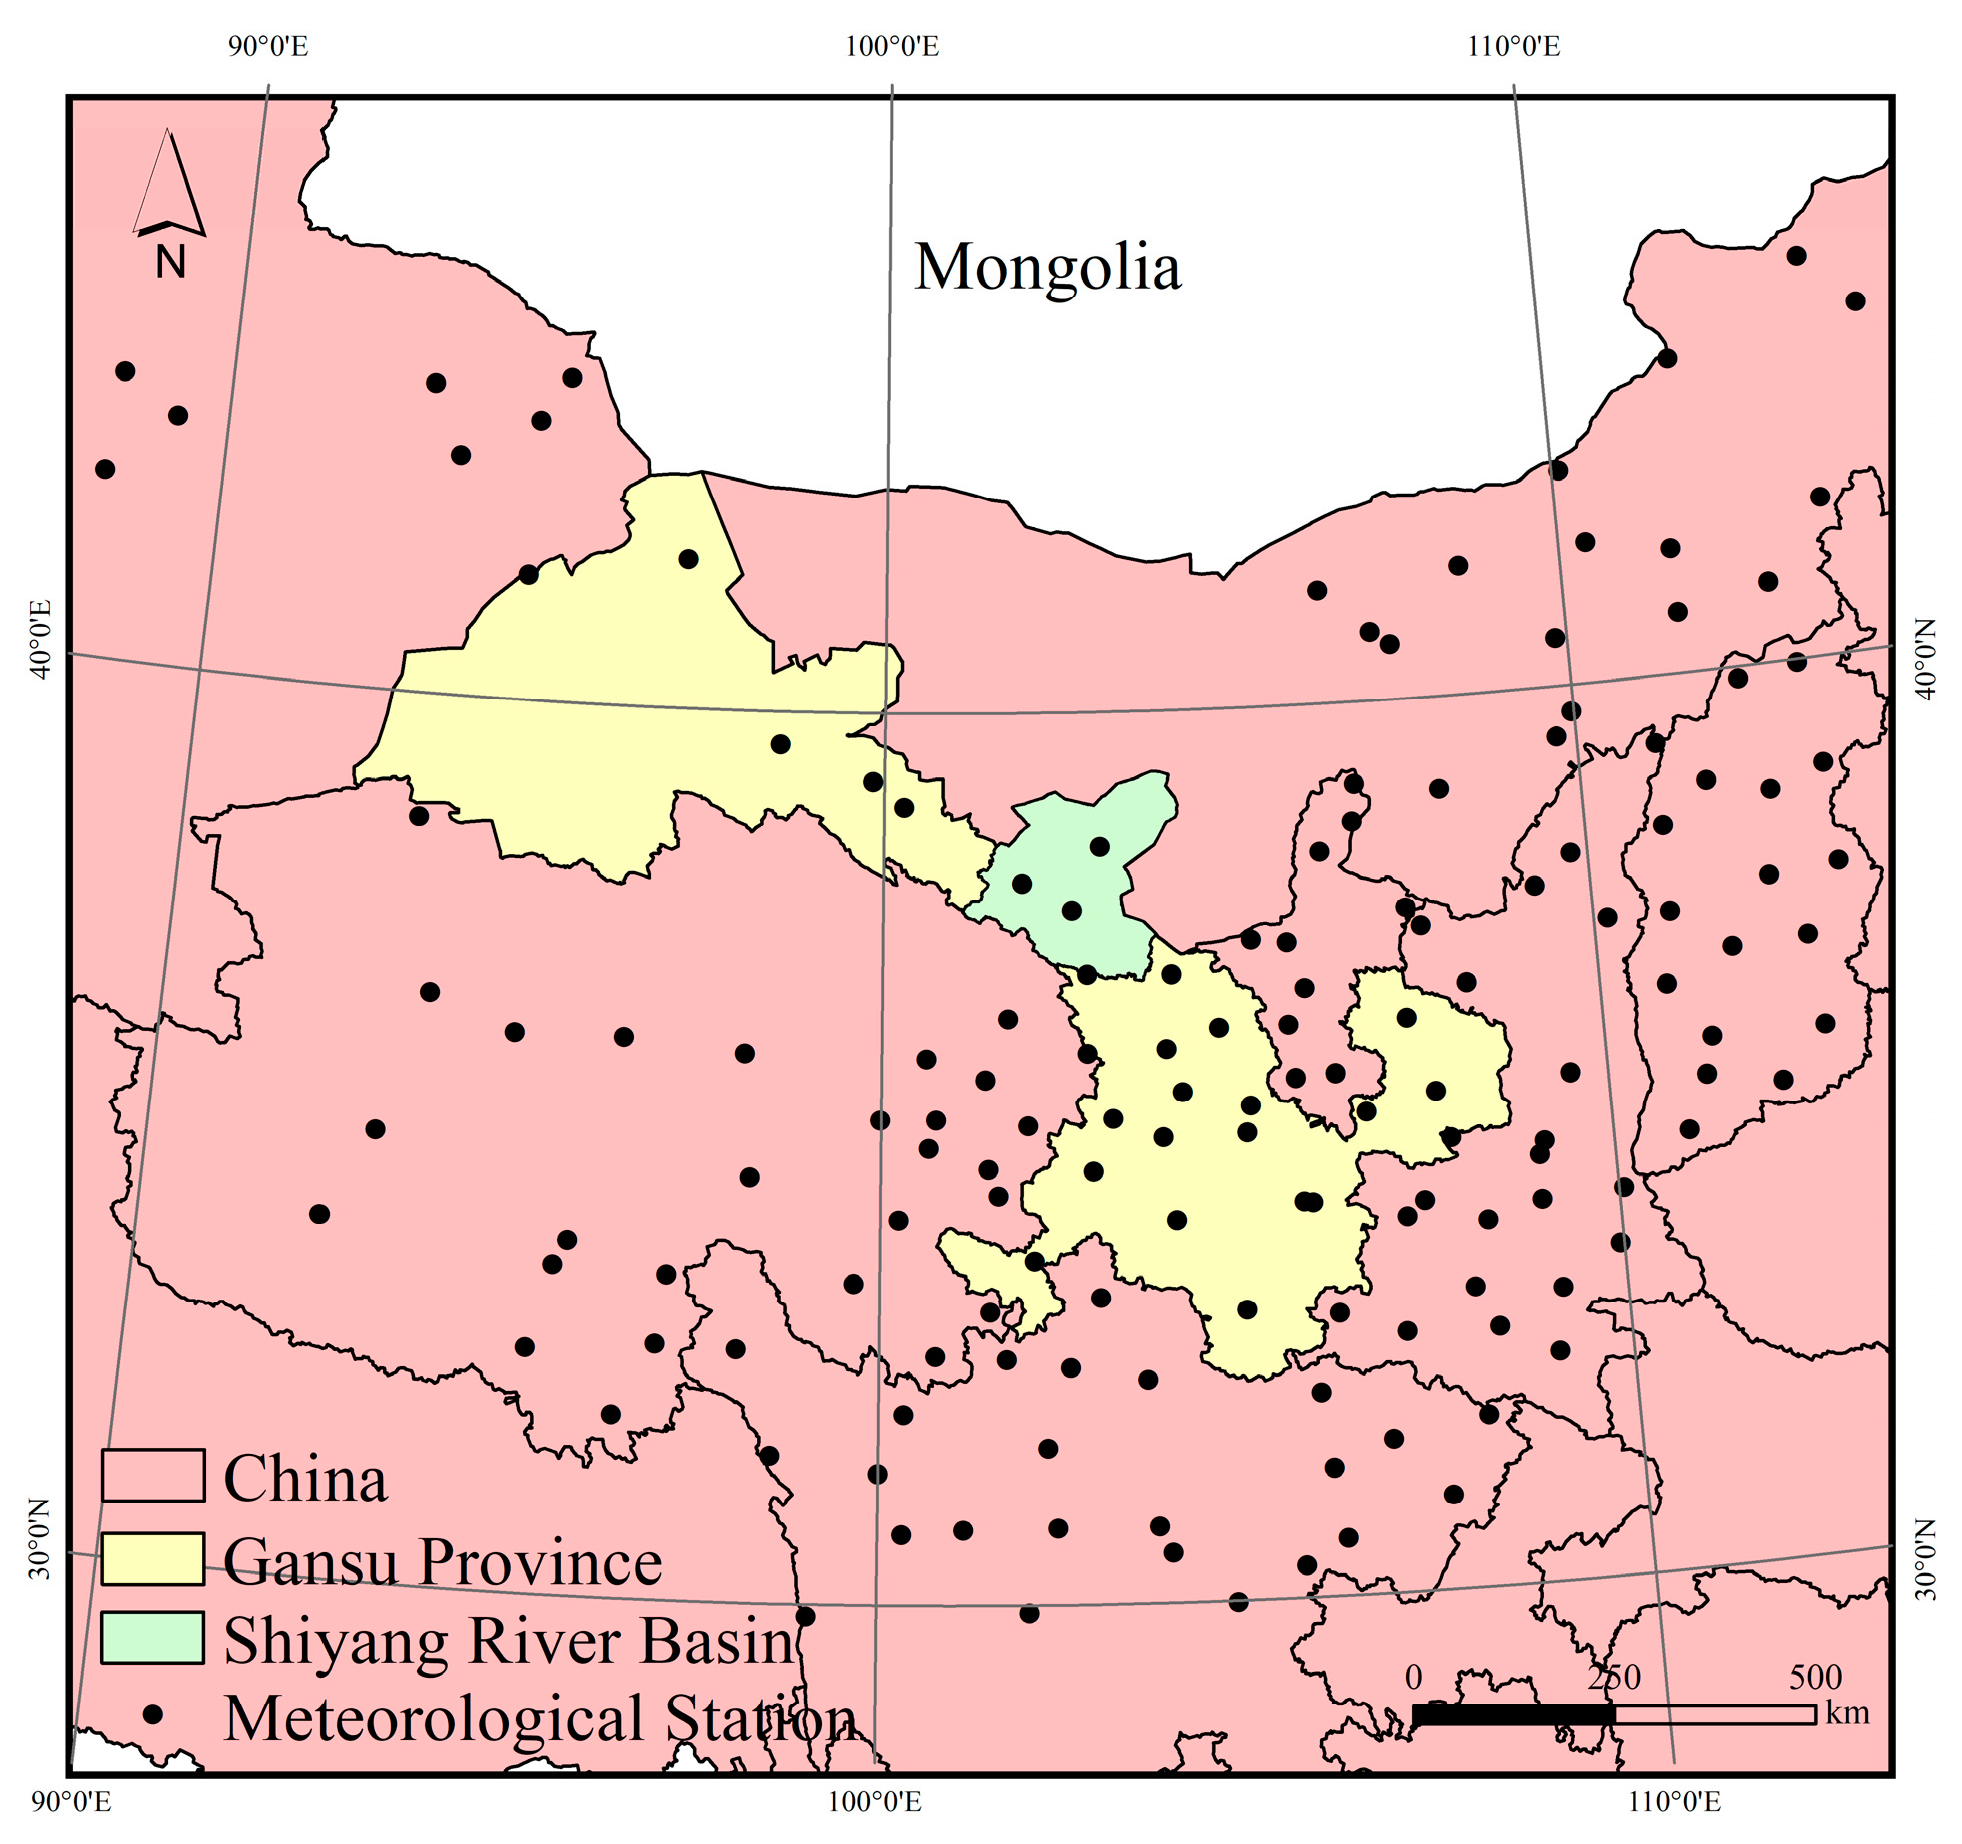
2. Study Area
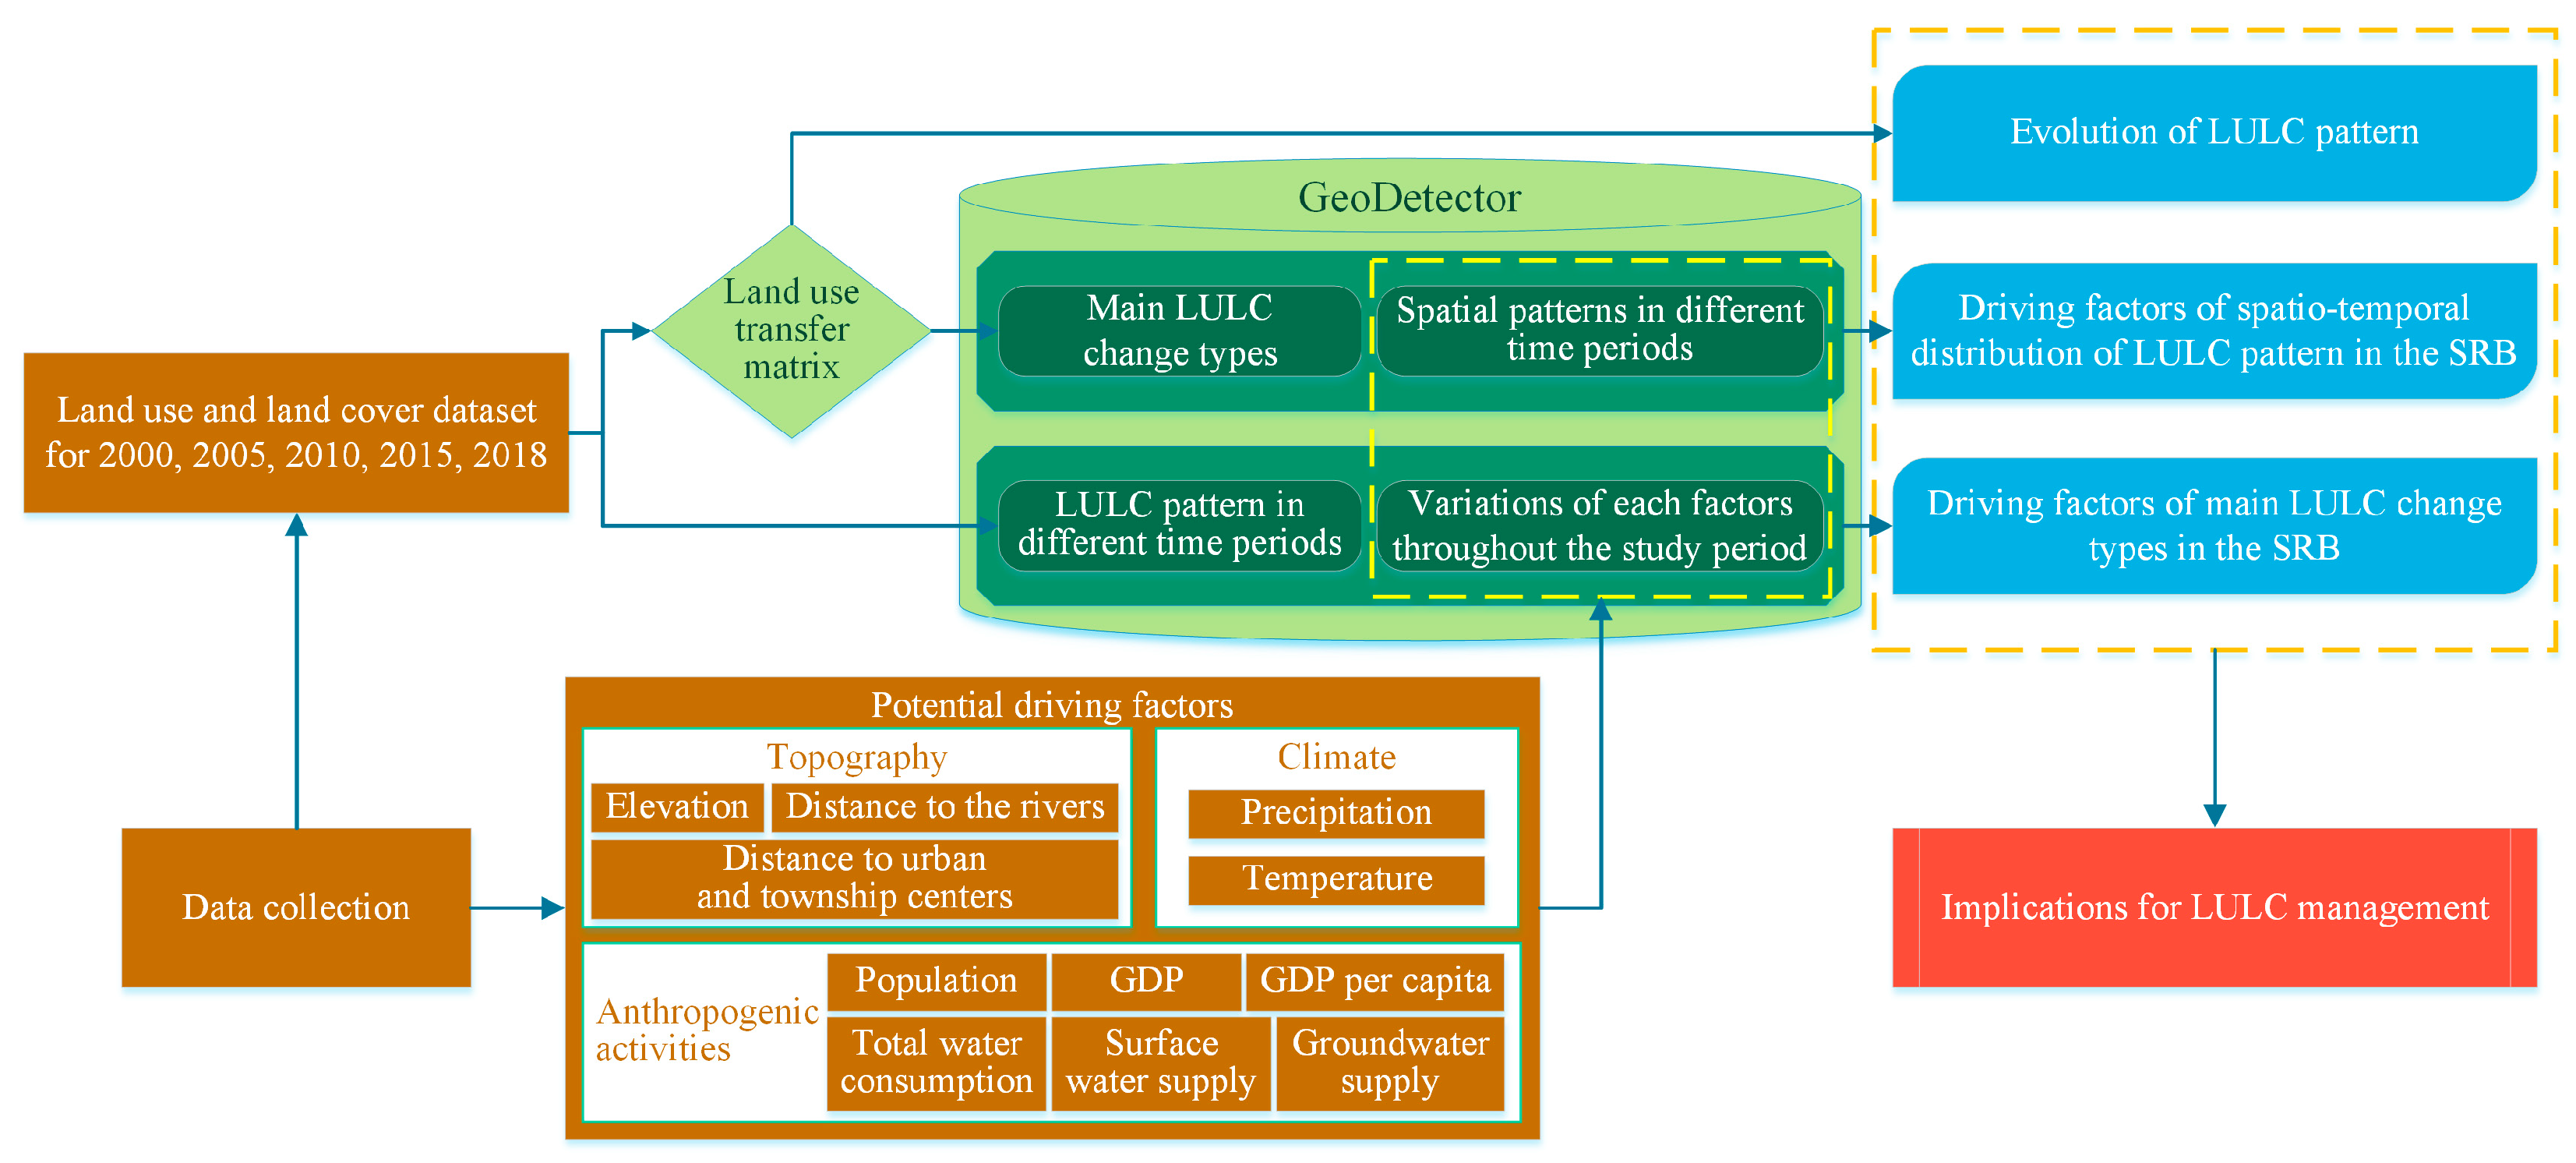
3. Data and Methods
3.1. Data Collection and Processing
3.2. Methods
3.2.1. Land Use Transfer Matrix
3.2.2. Attribution Analysis of LULC Spatial Distribution Patterns and LULC Changes
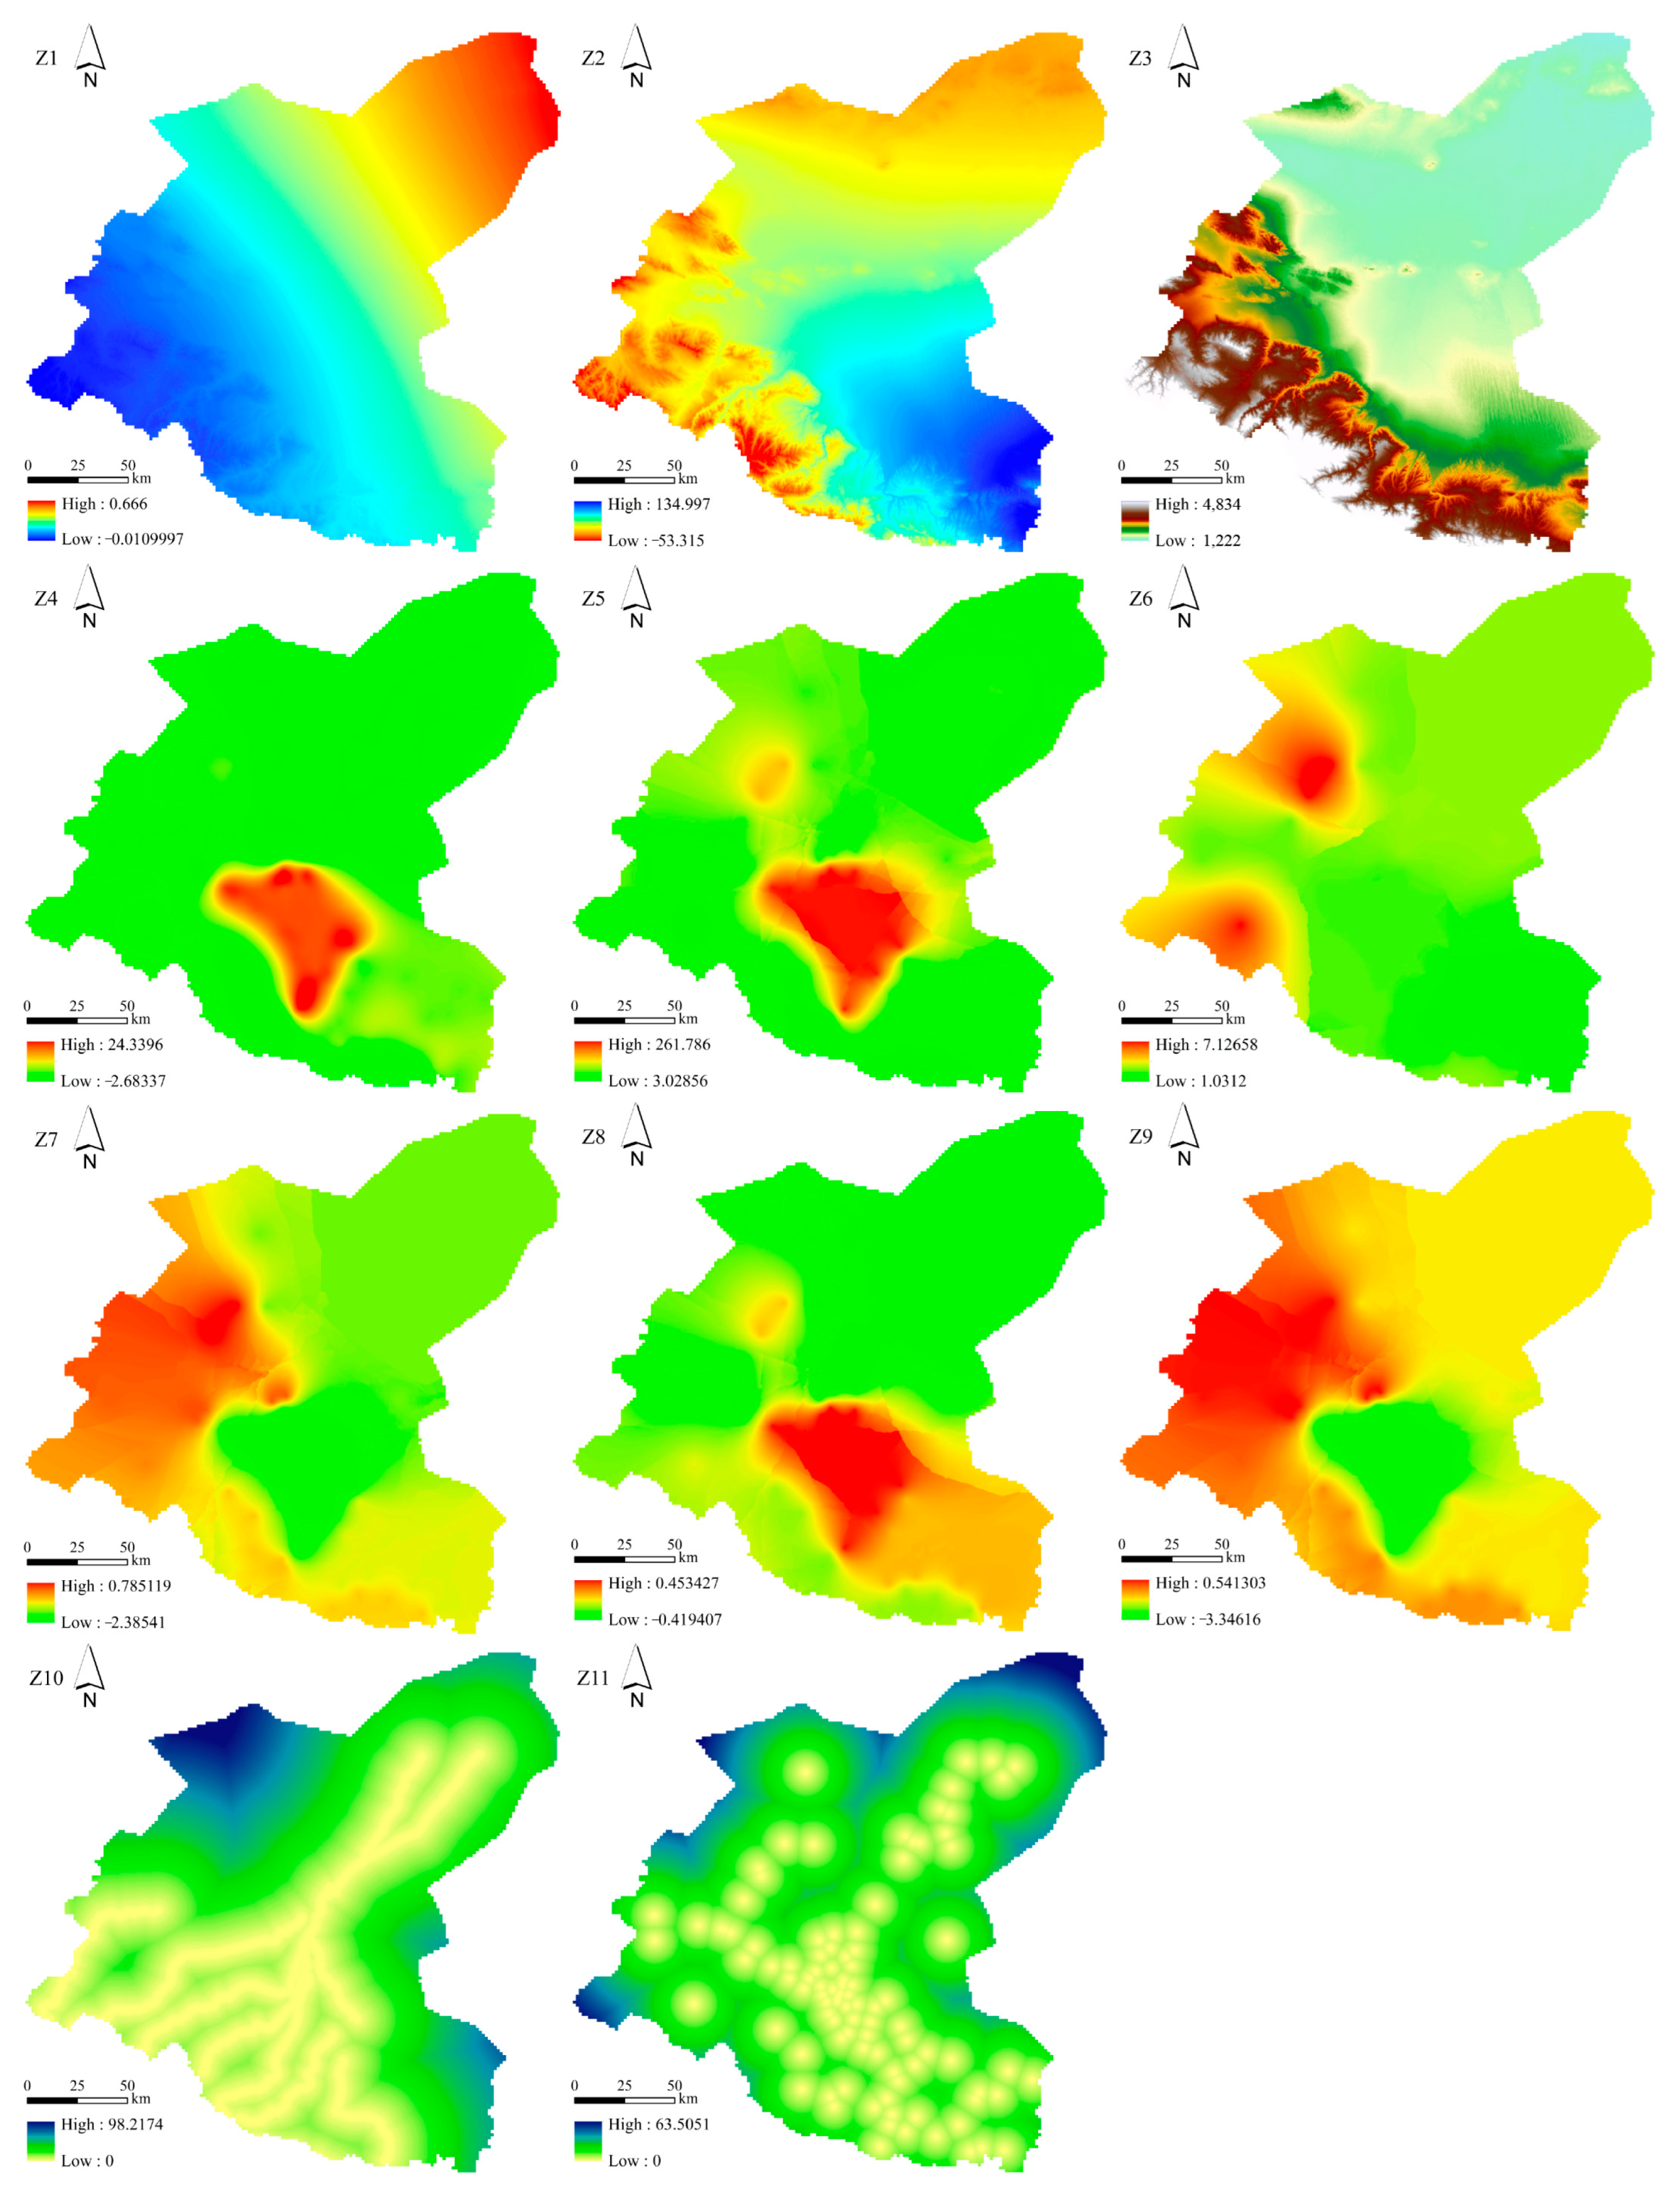
- Factors Selection and Preprocessing
- 2.
- GeoDetector model
4. Results
4.1. LULC Patterns and the Driving Forces in the SRB
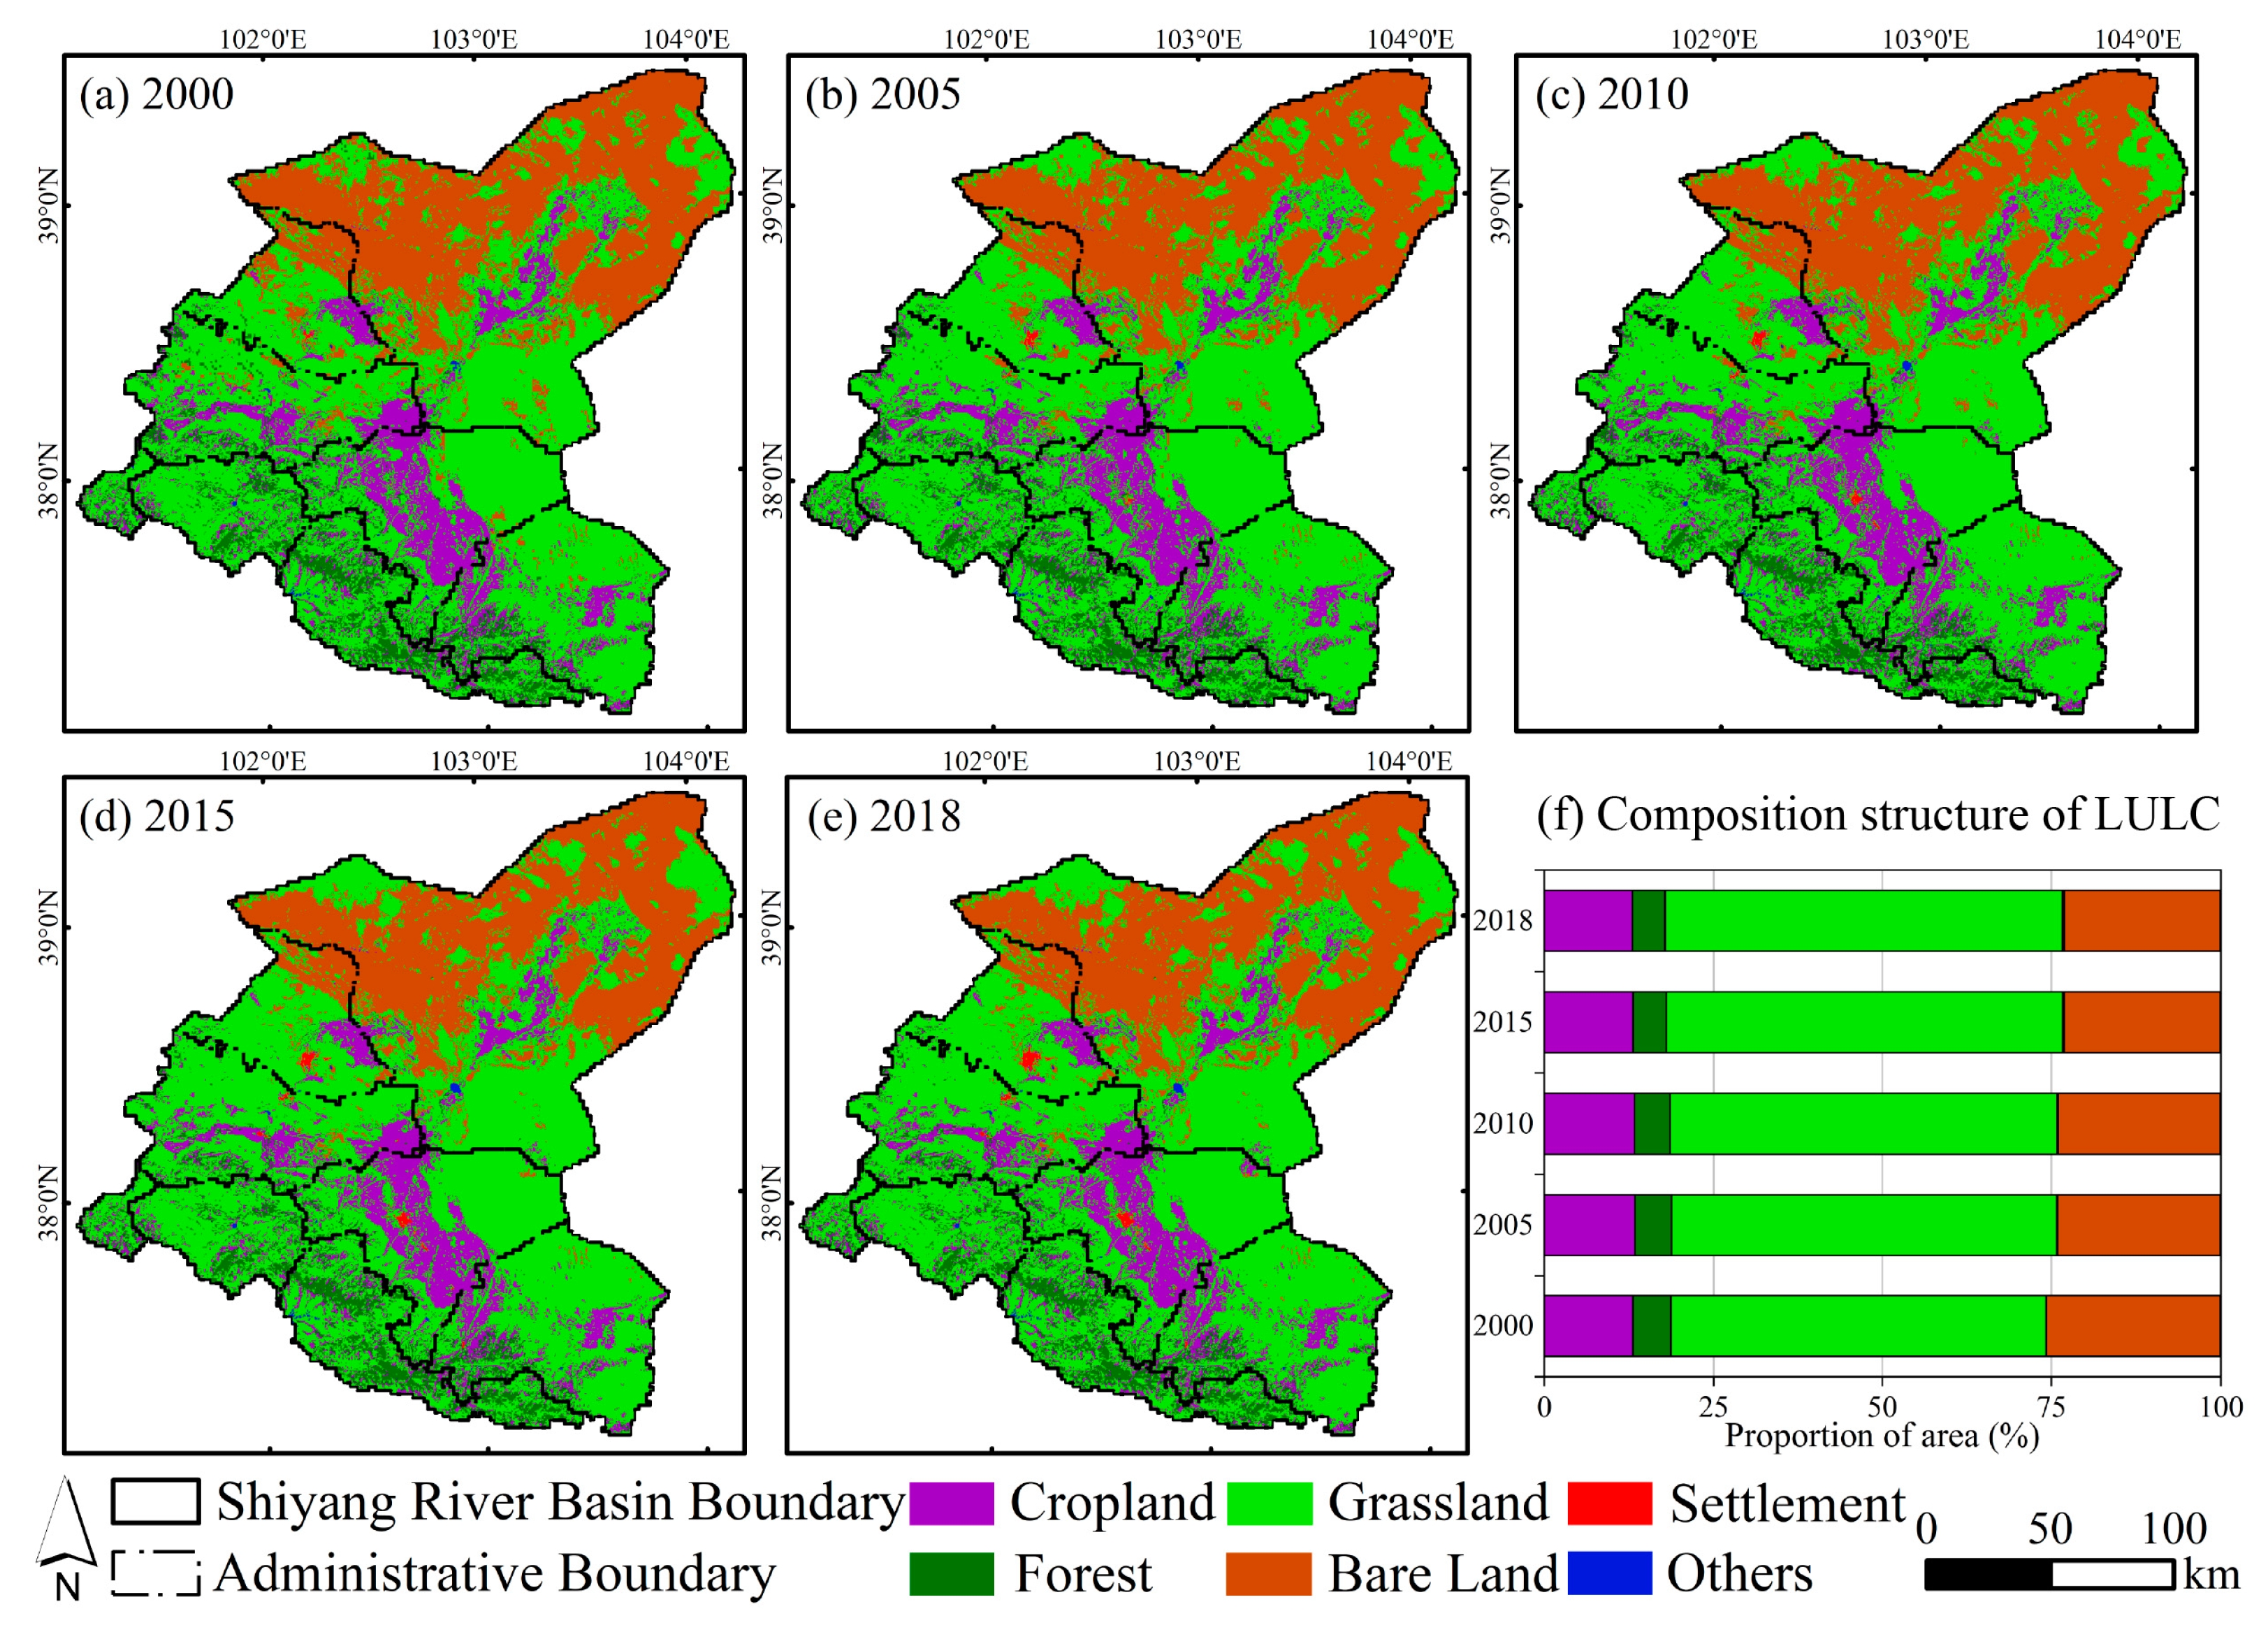
4.1.1. The Composition Structure and Spatial Distribution Patterns of LULC in the SRB
4.1.2. Driving Forces behind LULC Patterns in the SRB
4.2. LULC Change and its Driving Forces in the SRB
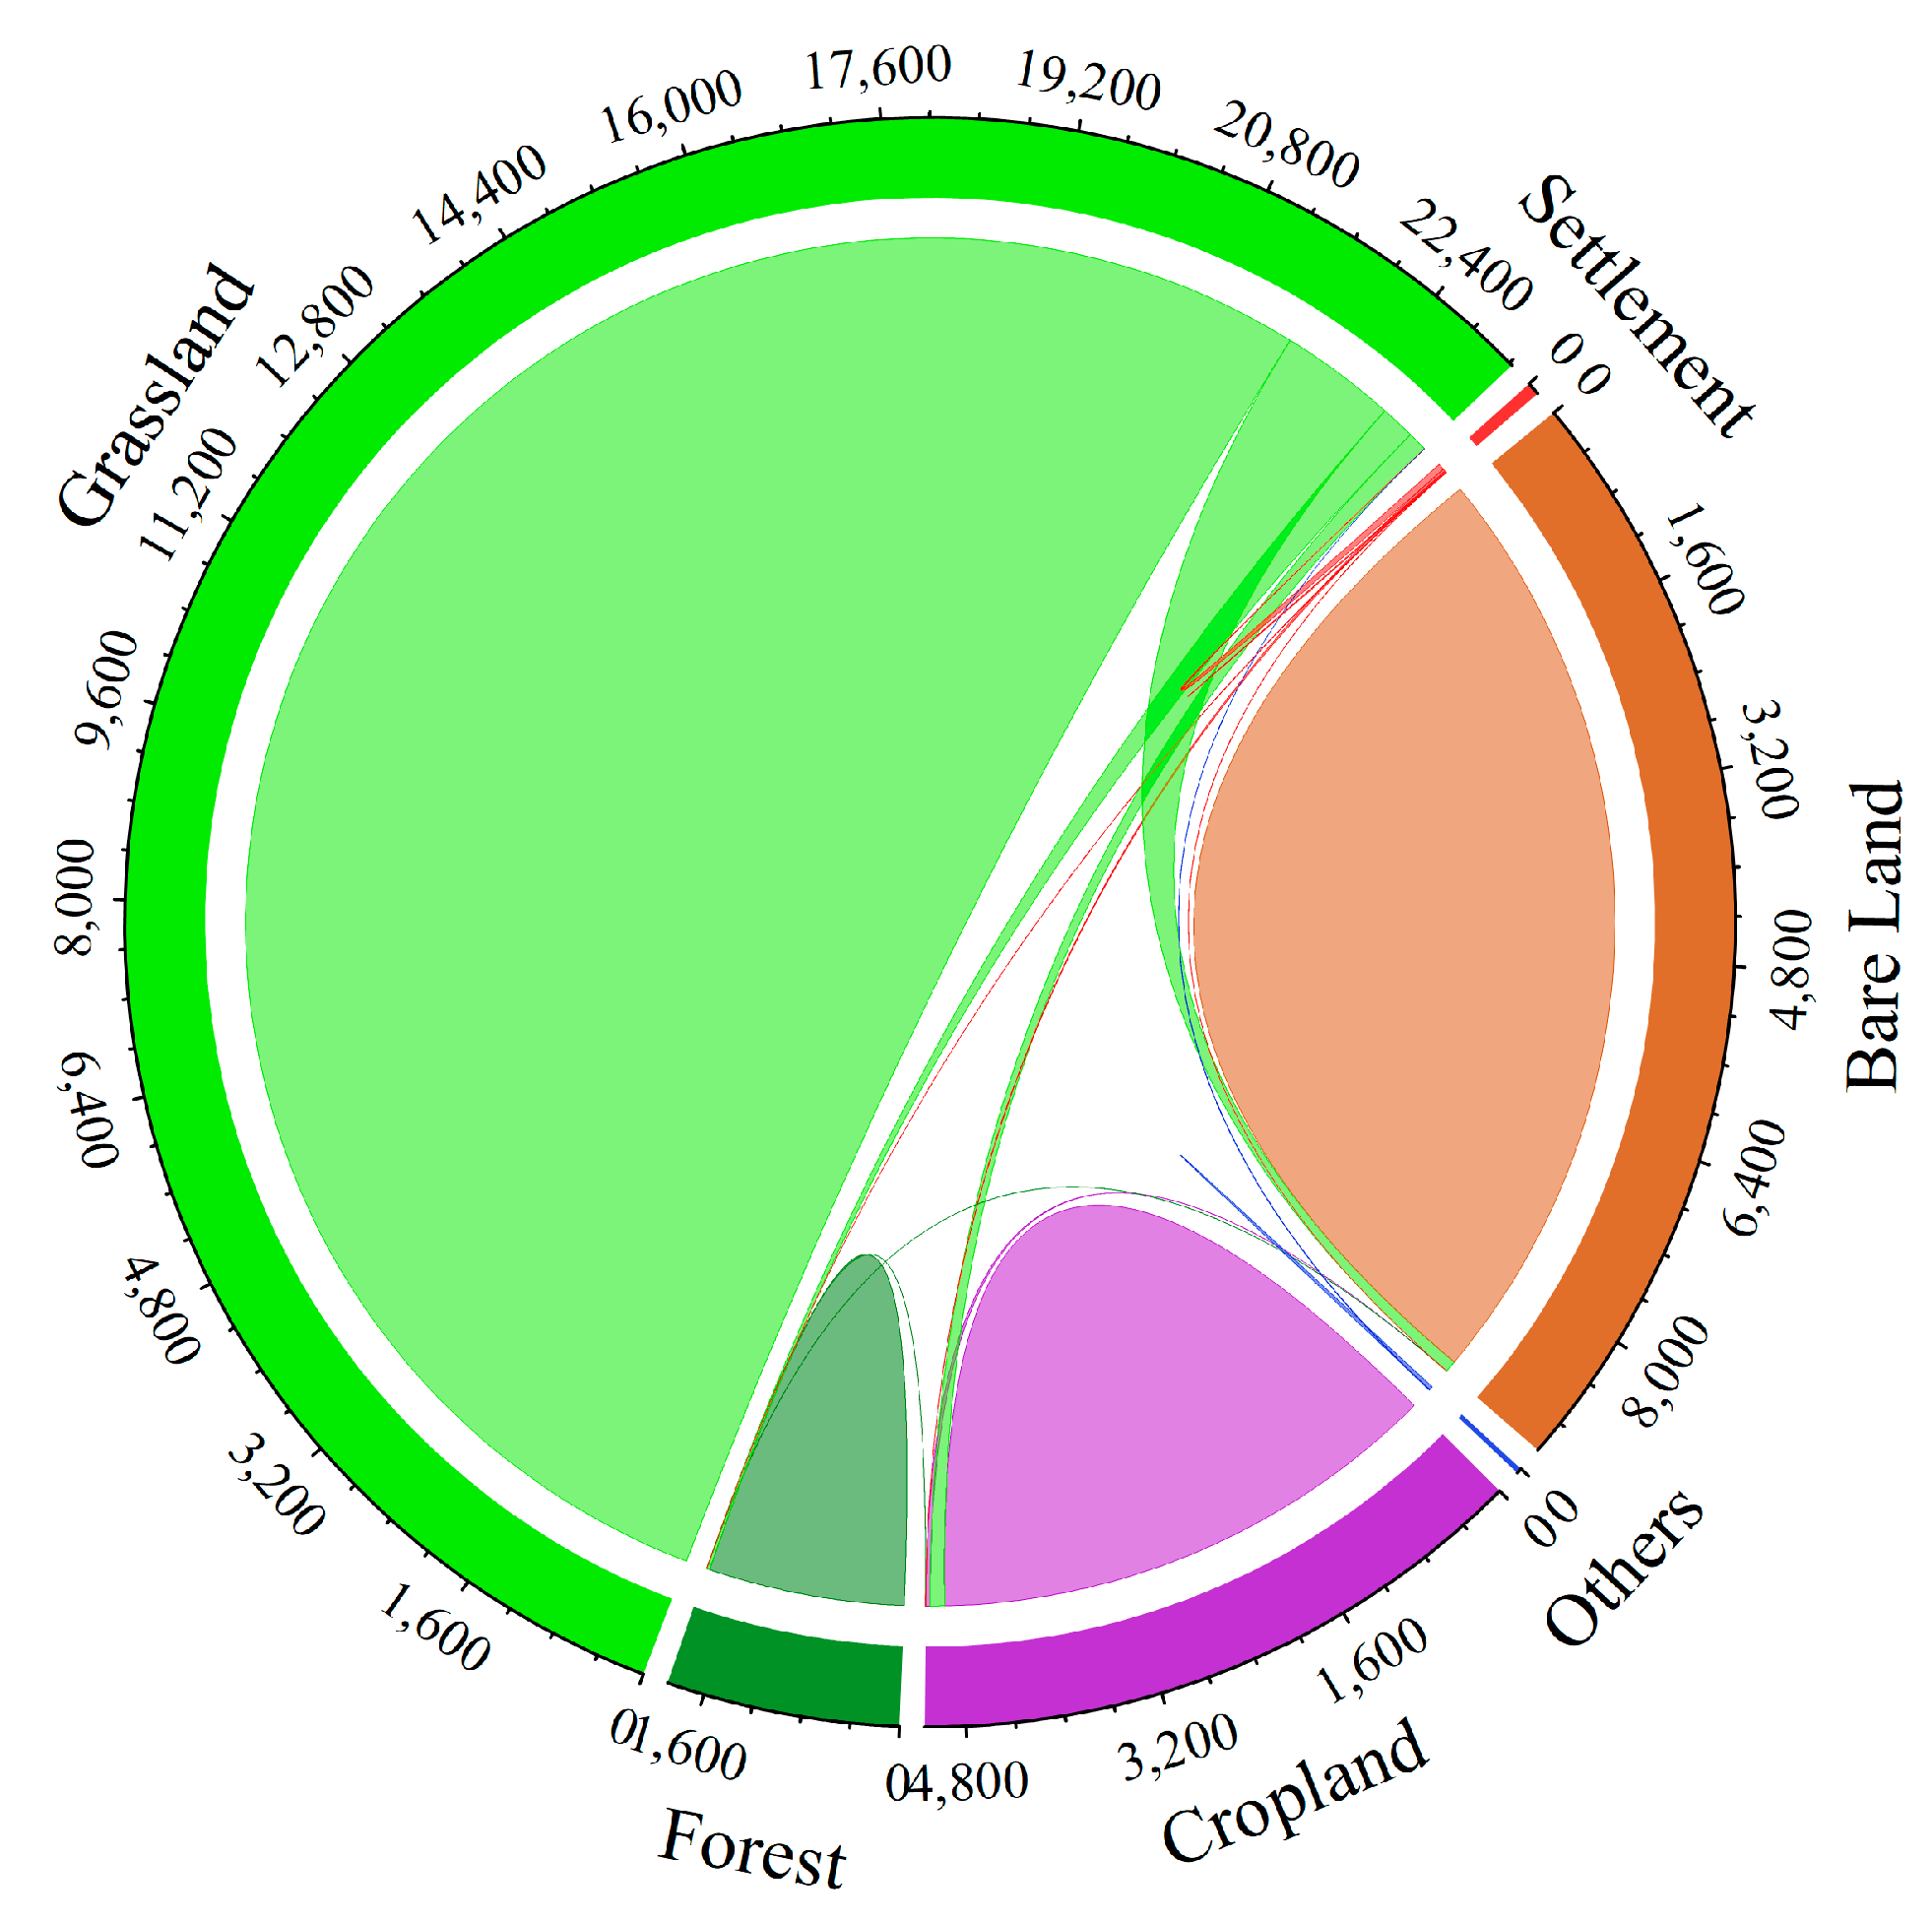
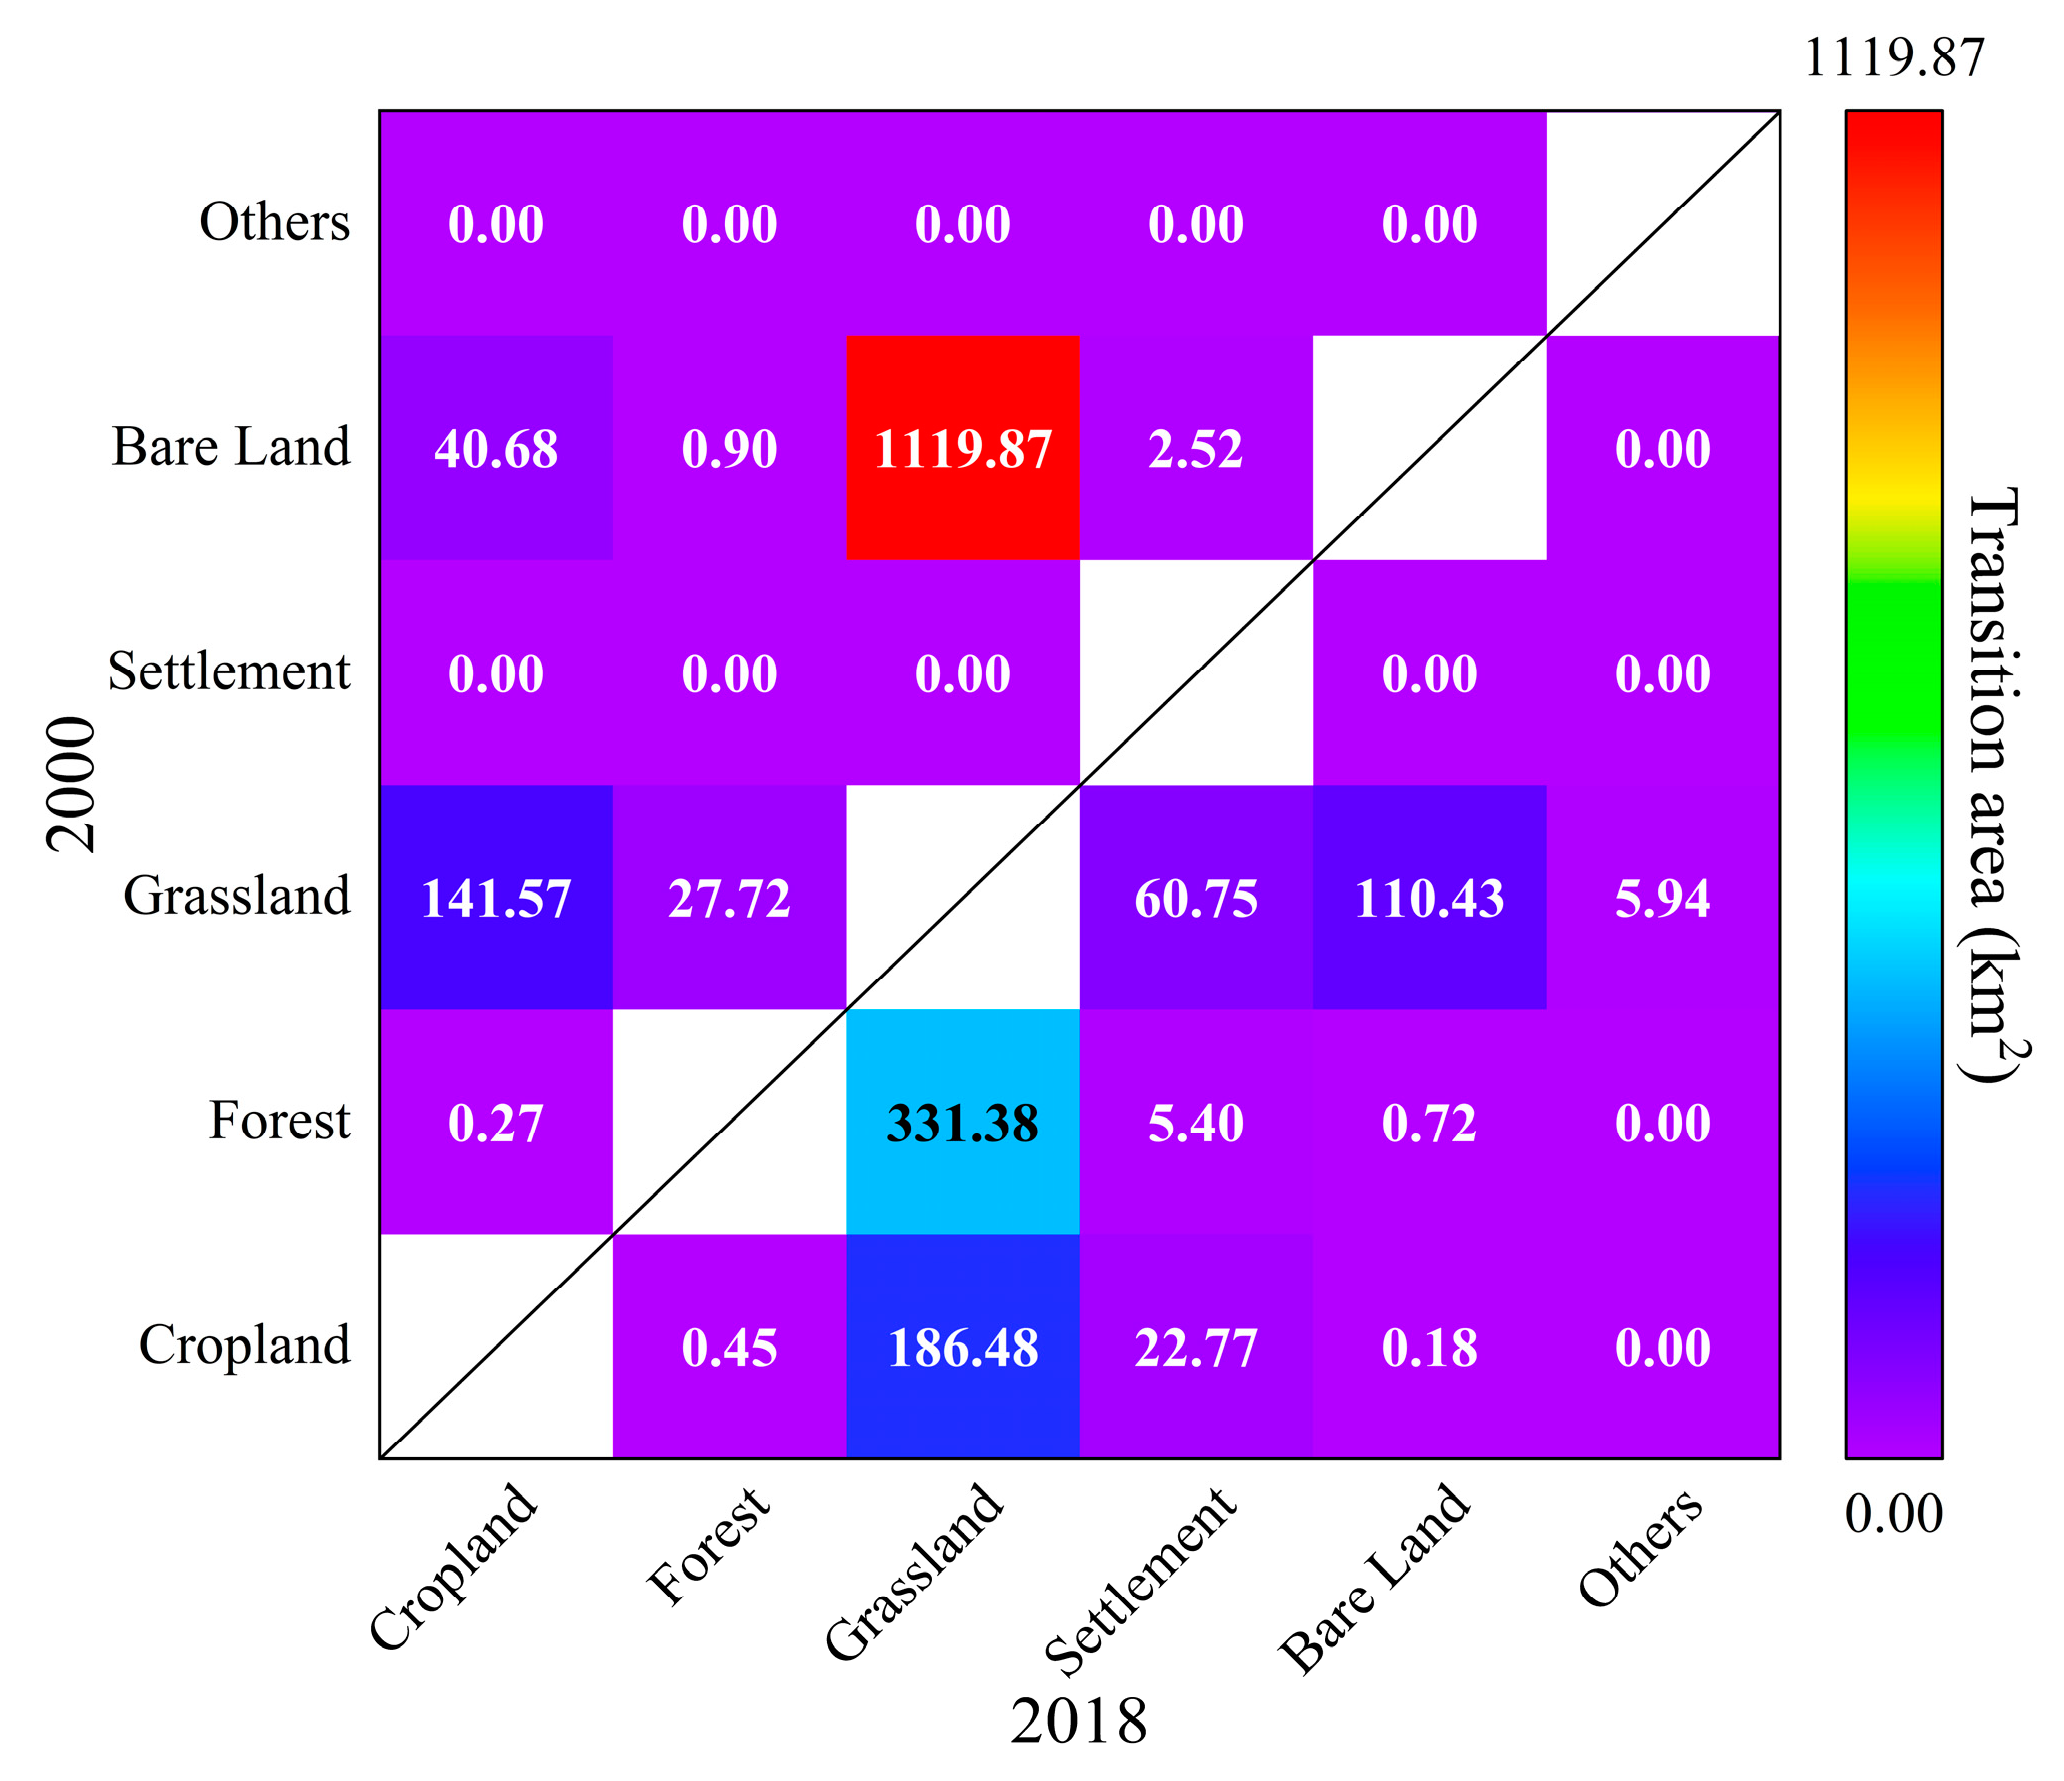
4.2.1. LULC Change in the SRB during 2000–2018
- Temporal Variations in the Areas of LULC in the SRB
- 2.
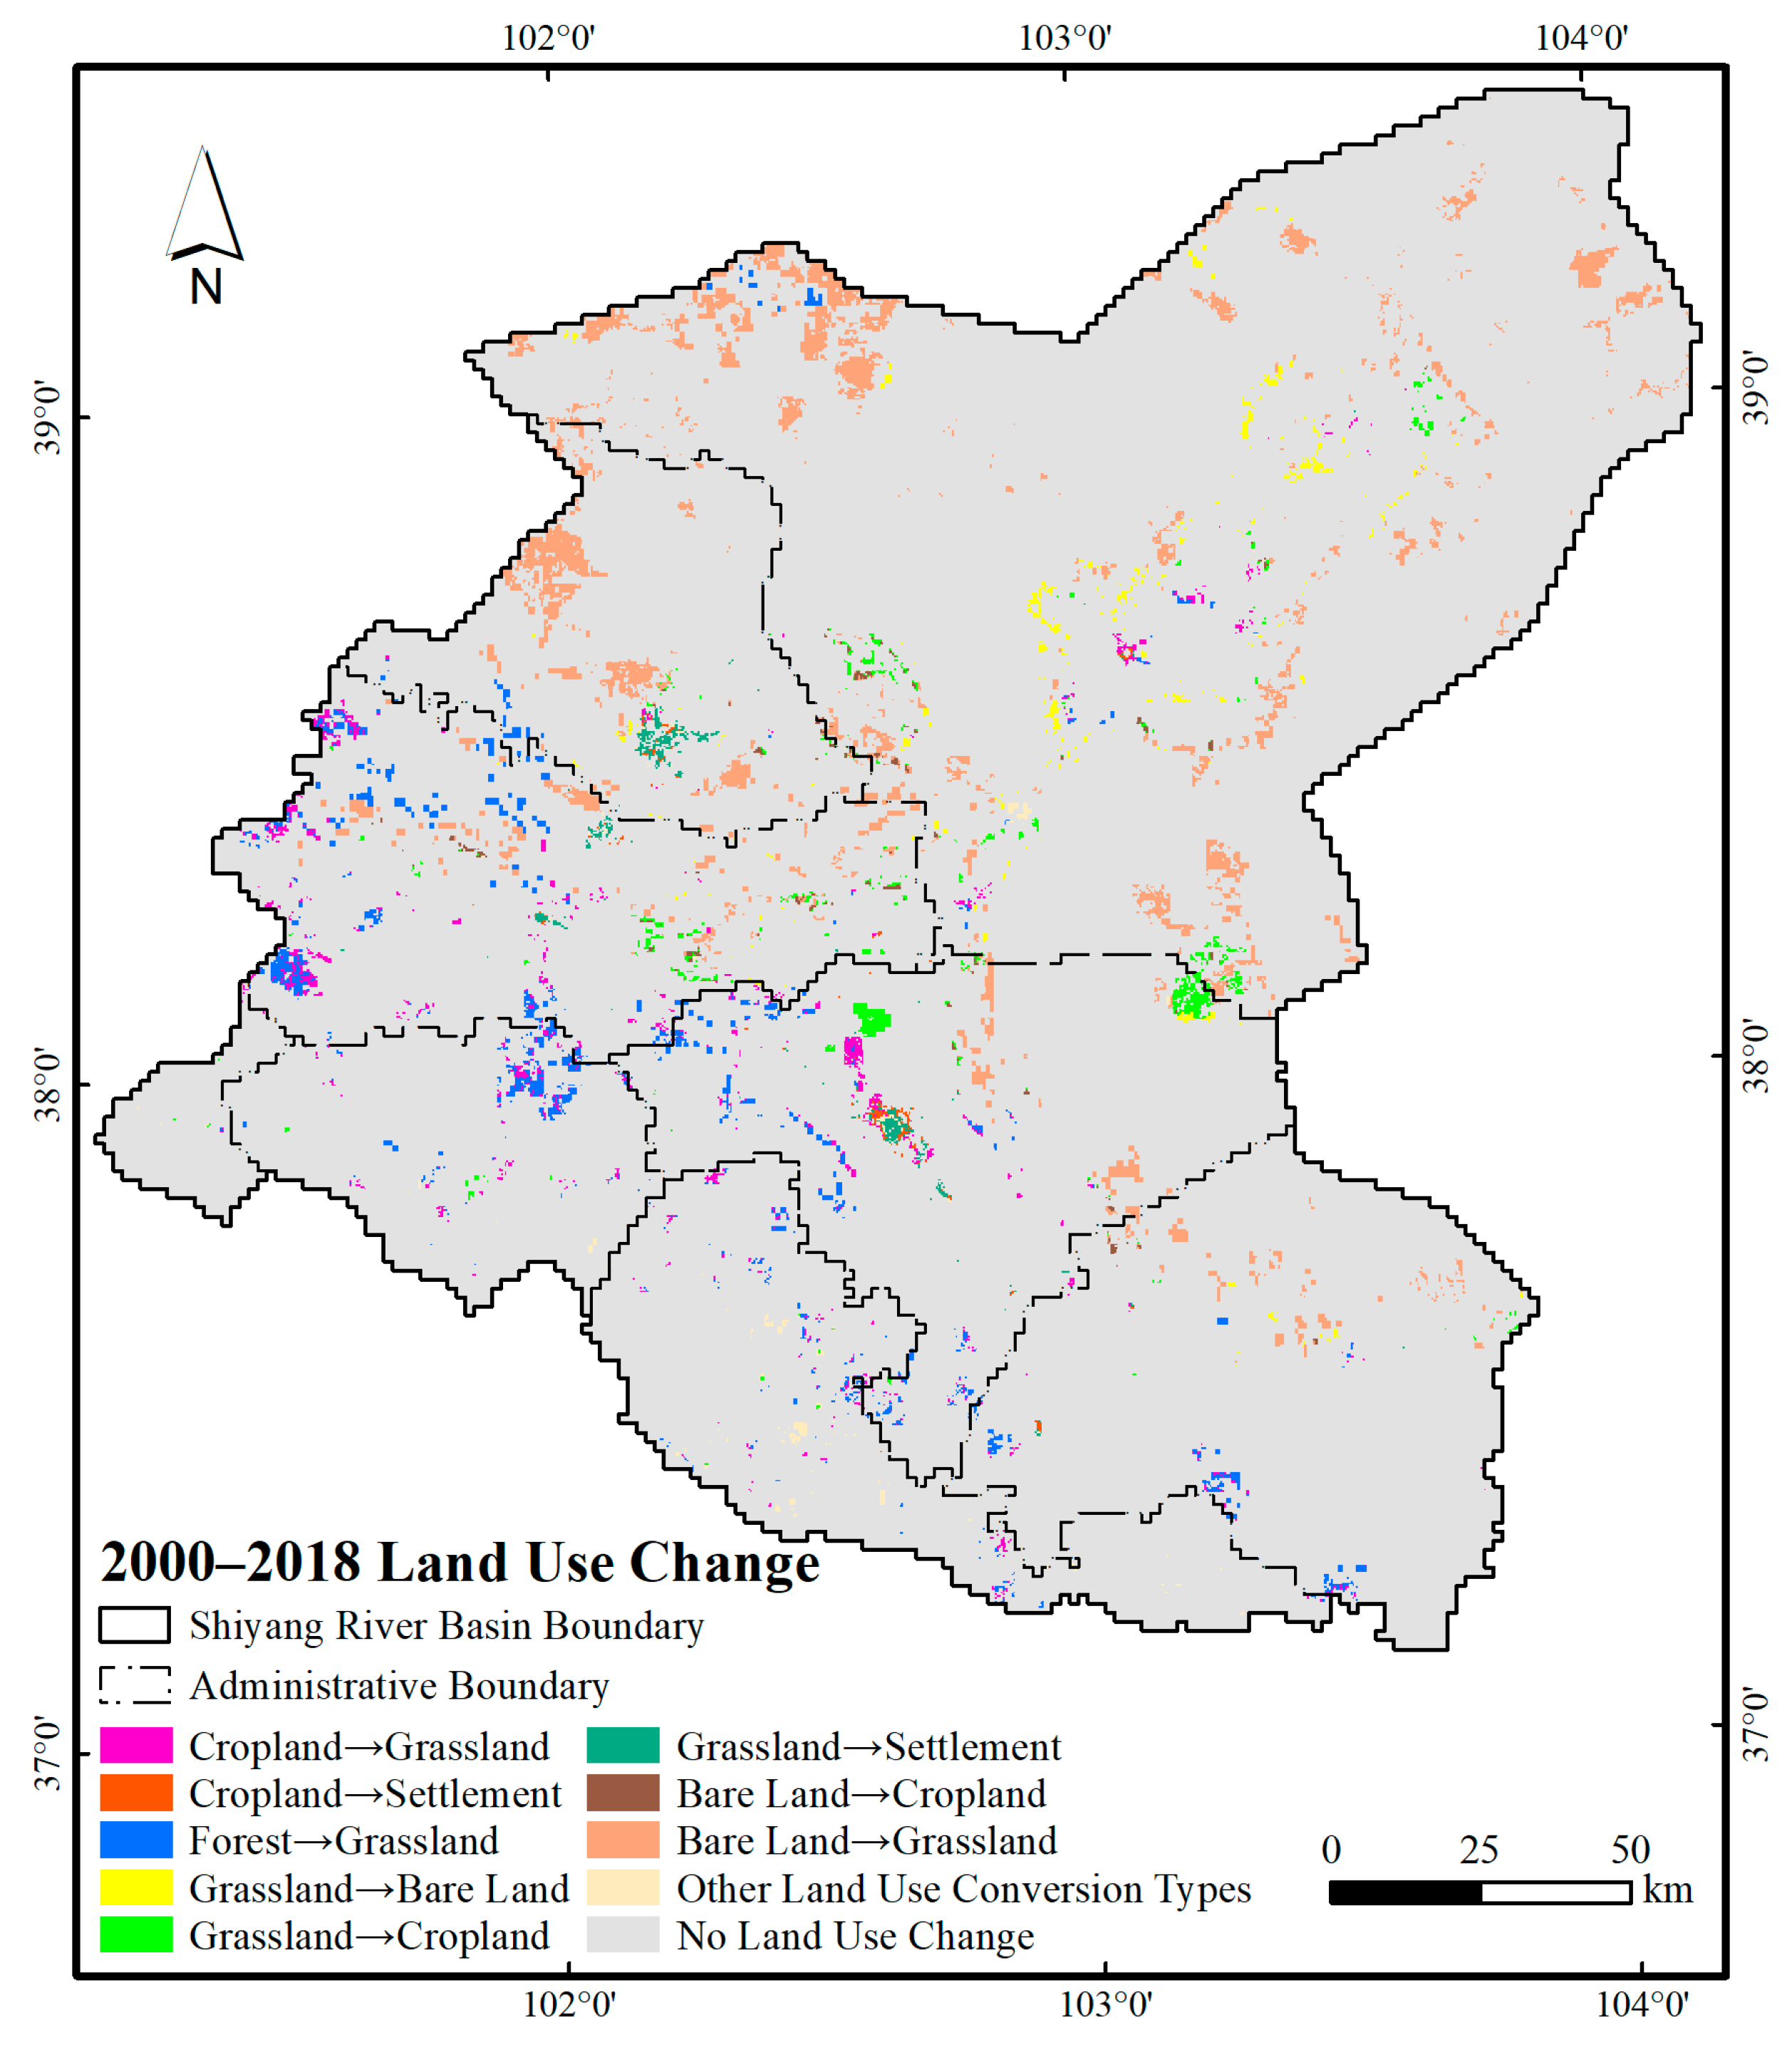
- Spatiotemporal Patterns of the Main LULC Change Types in the SRB
4.2.2. Driving Force Variations in LULC Changes in the SRB
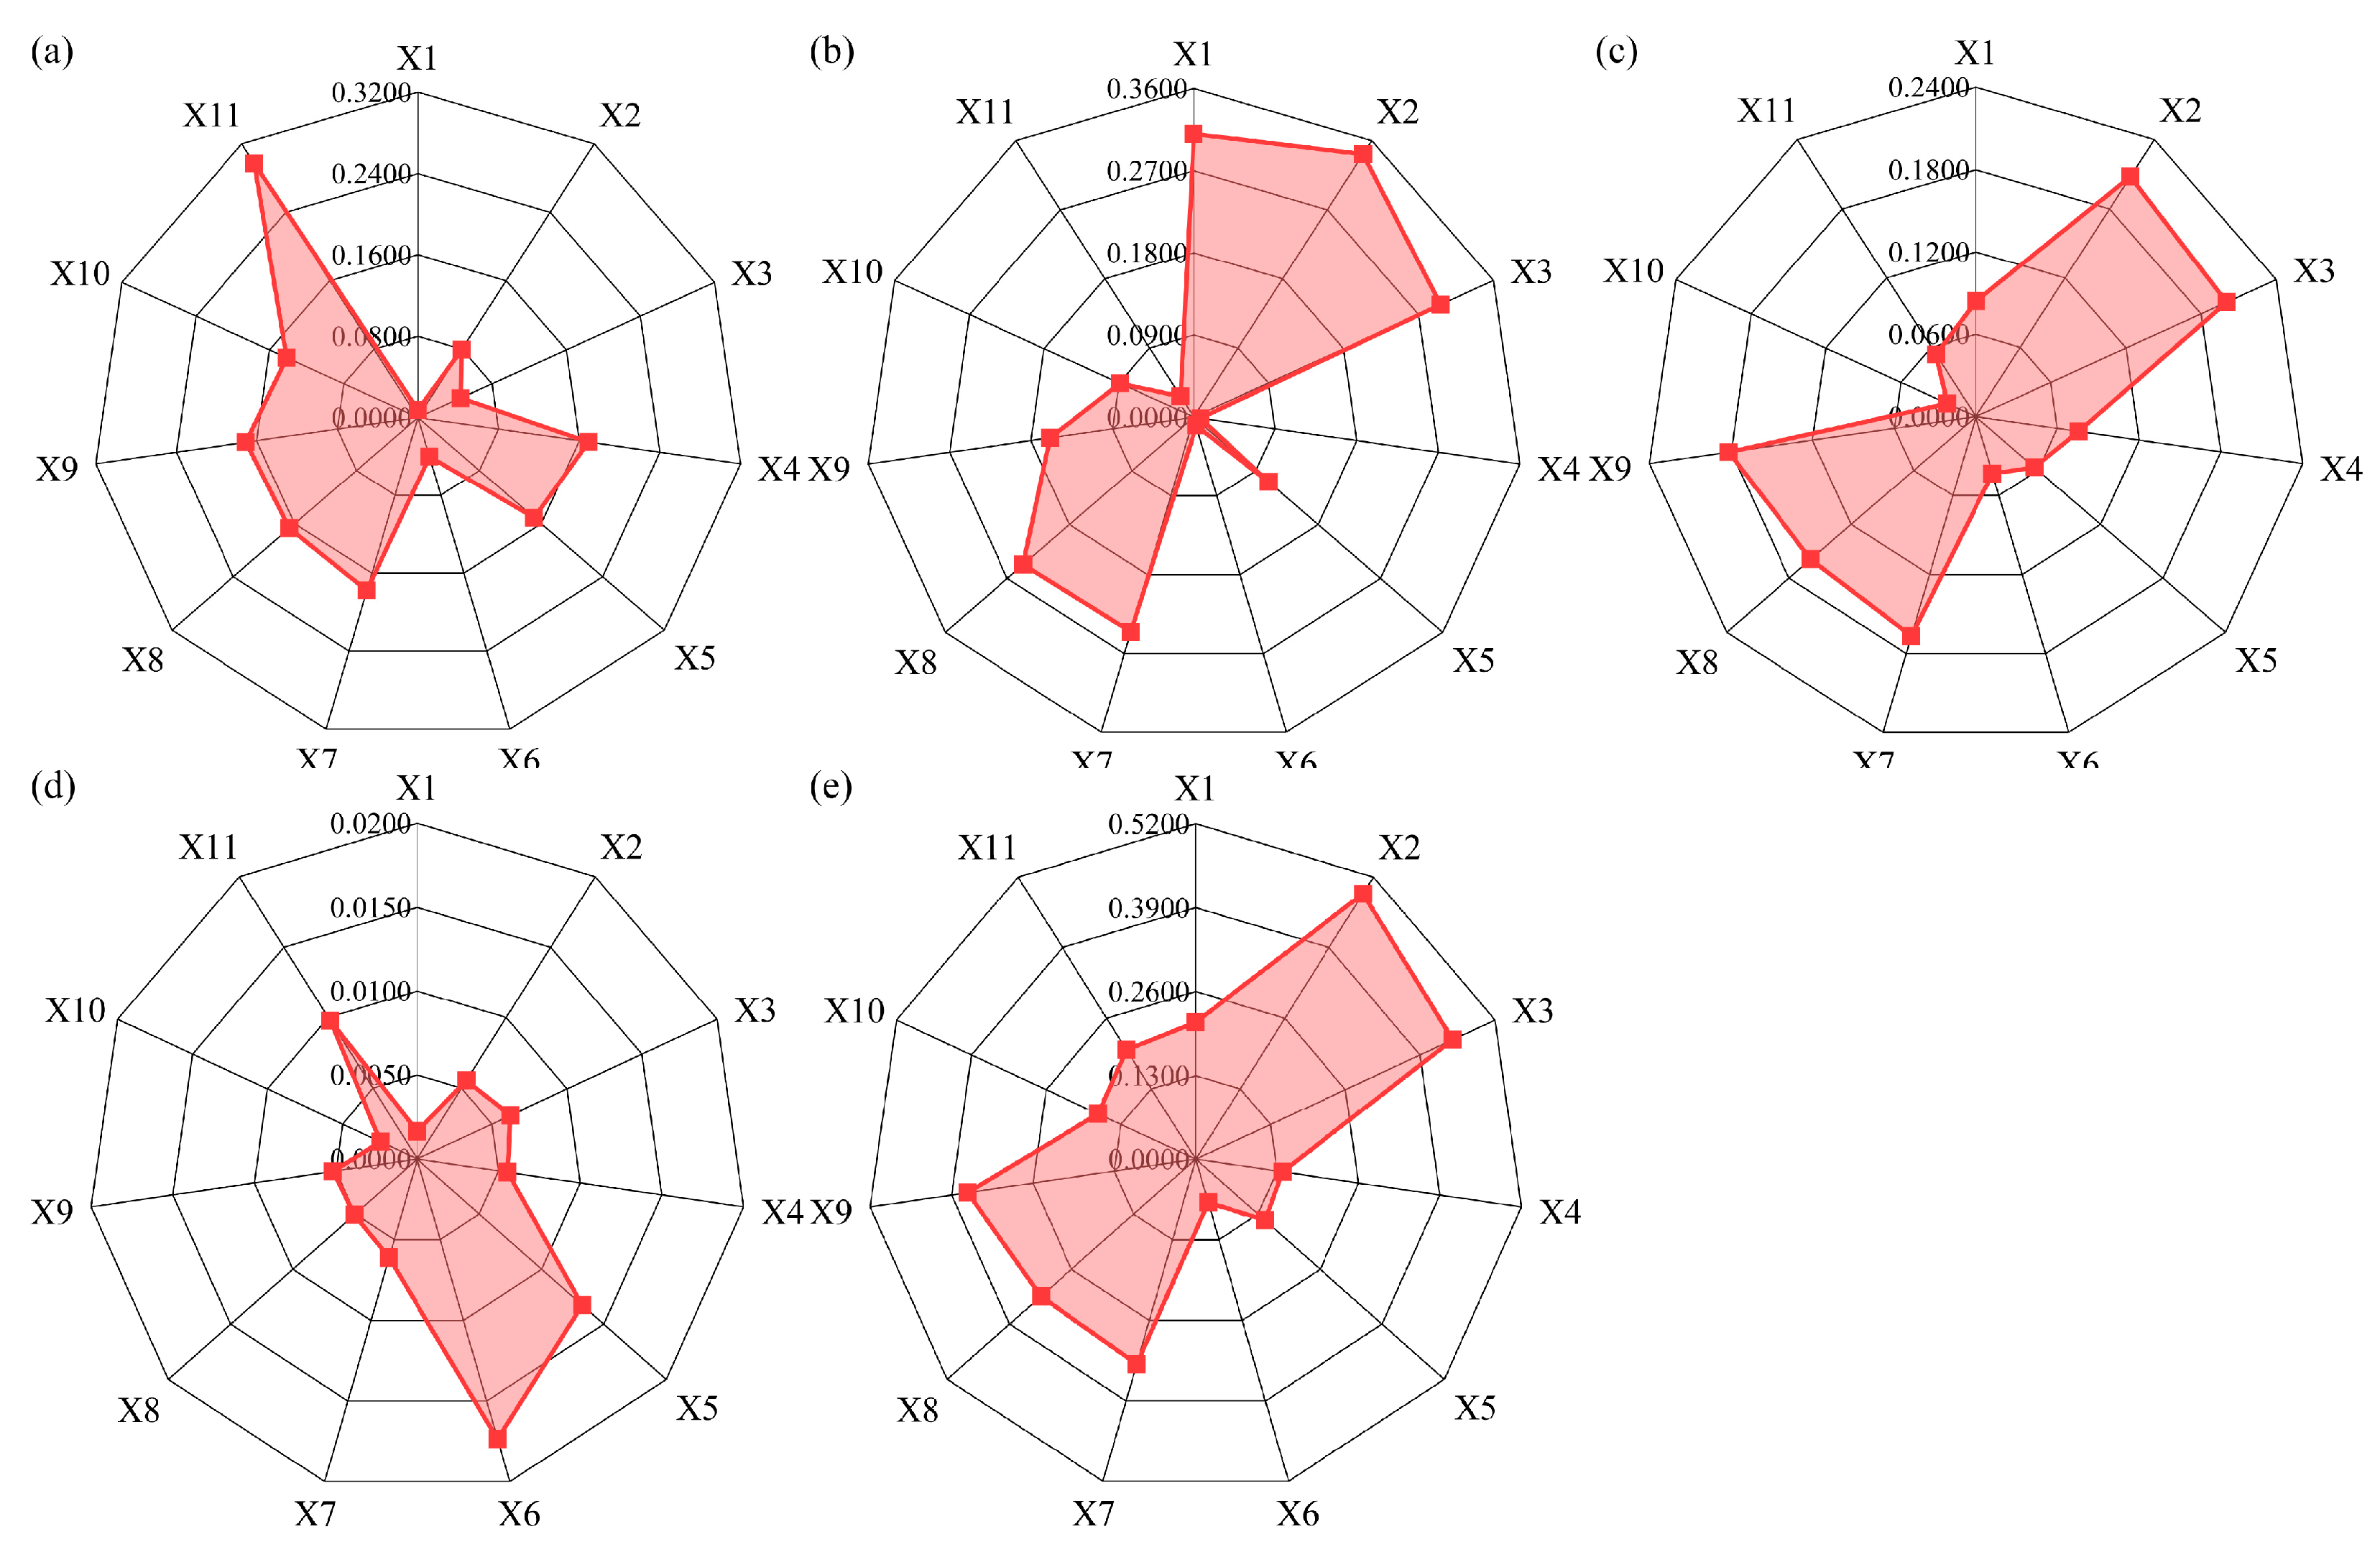
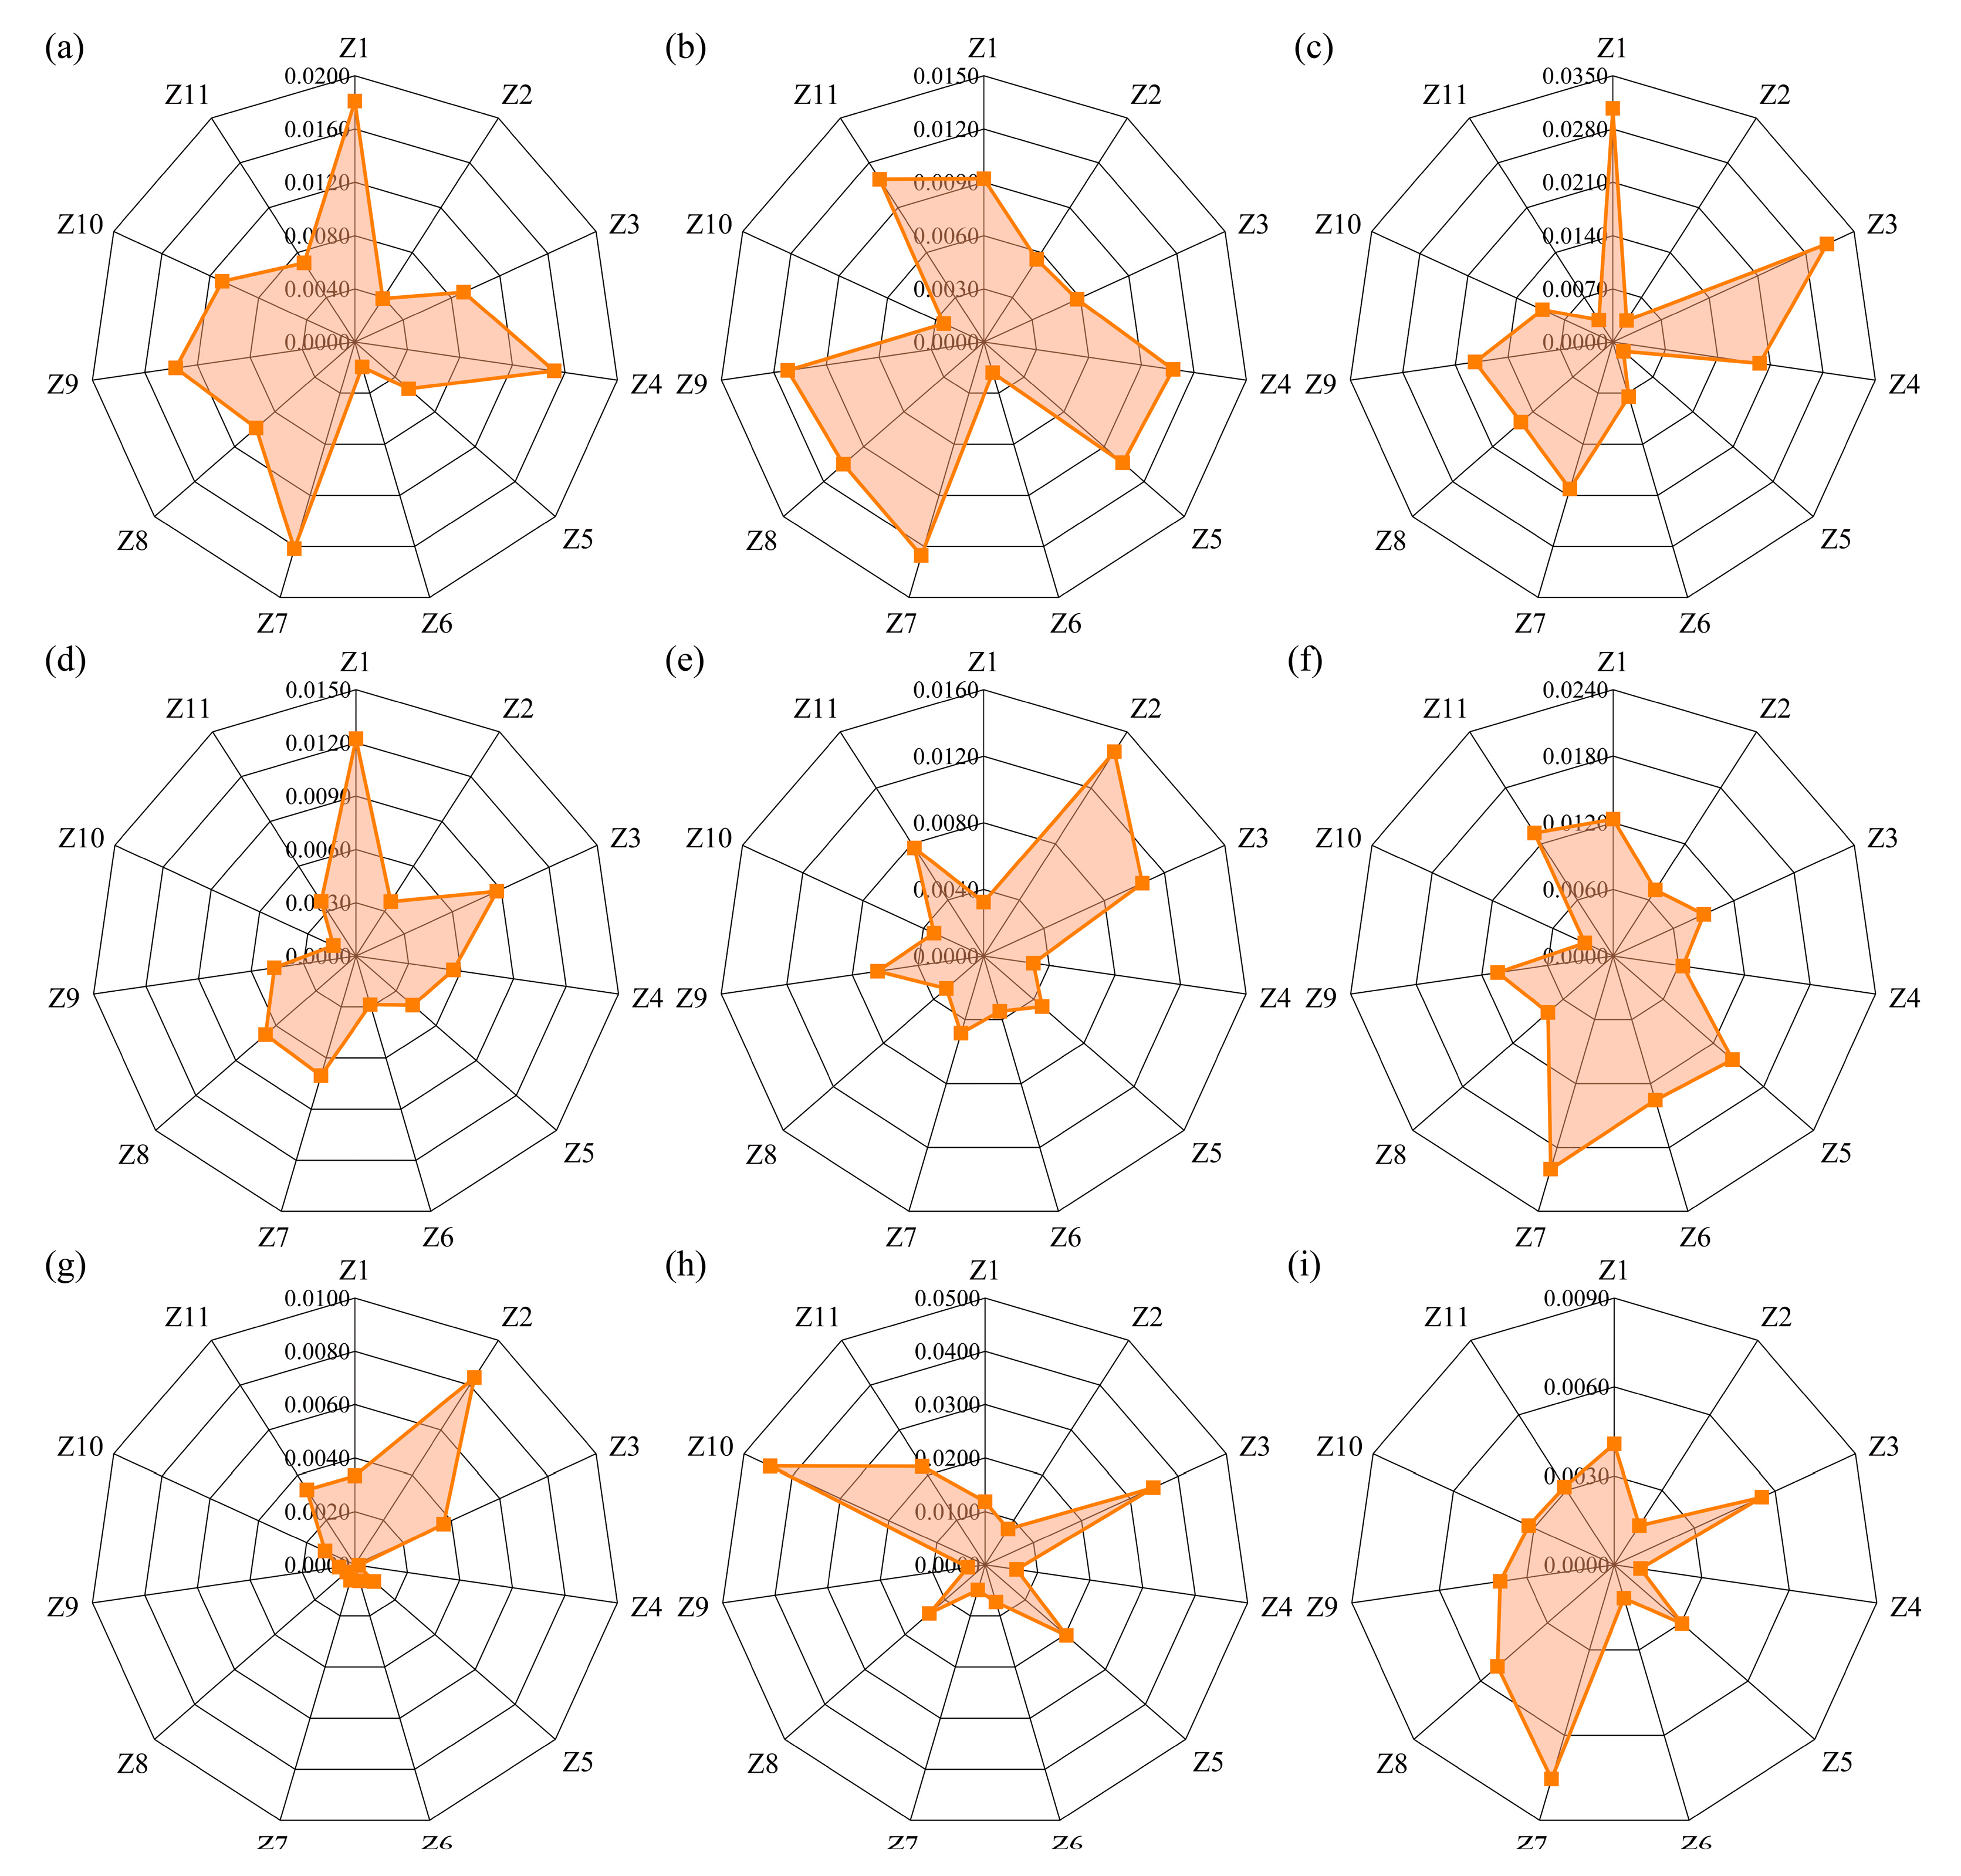
- Driving Forces behind the Main LULC Changes in the SRB
- 2.
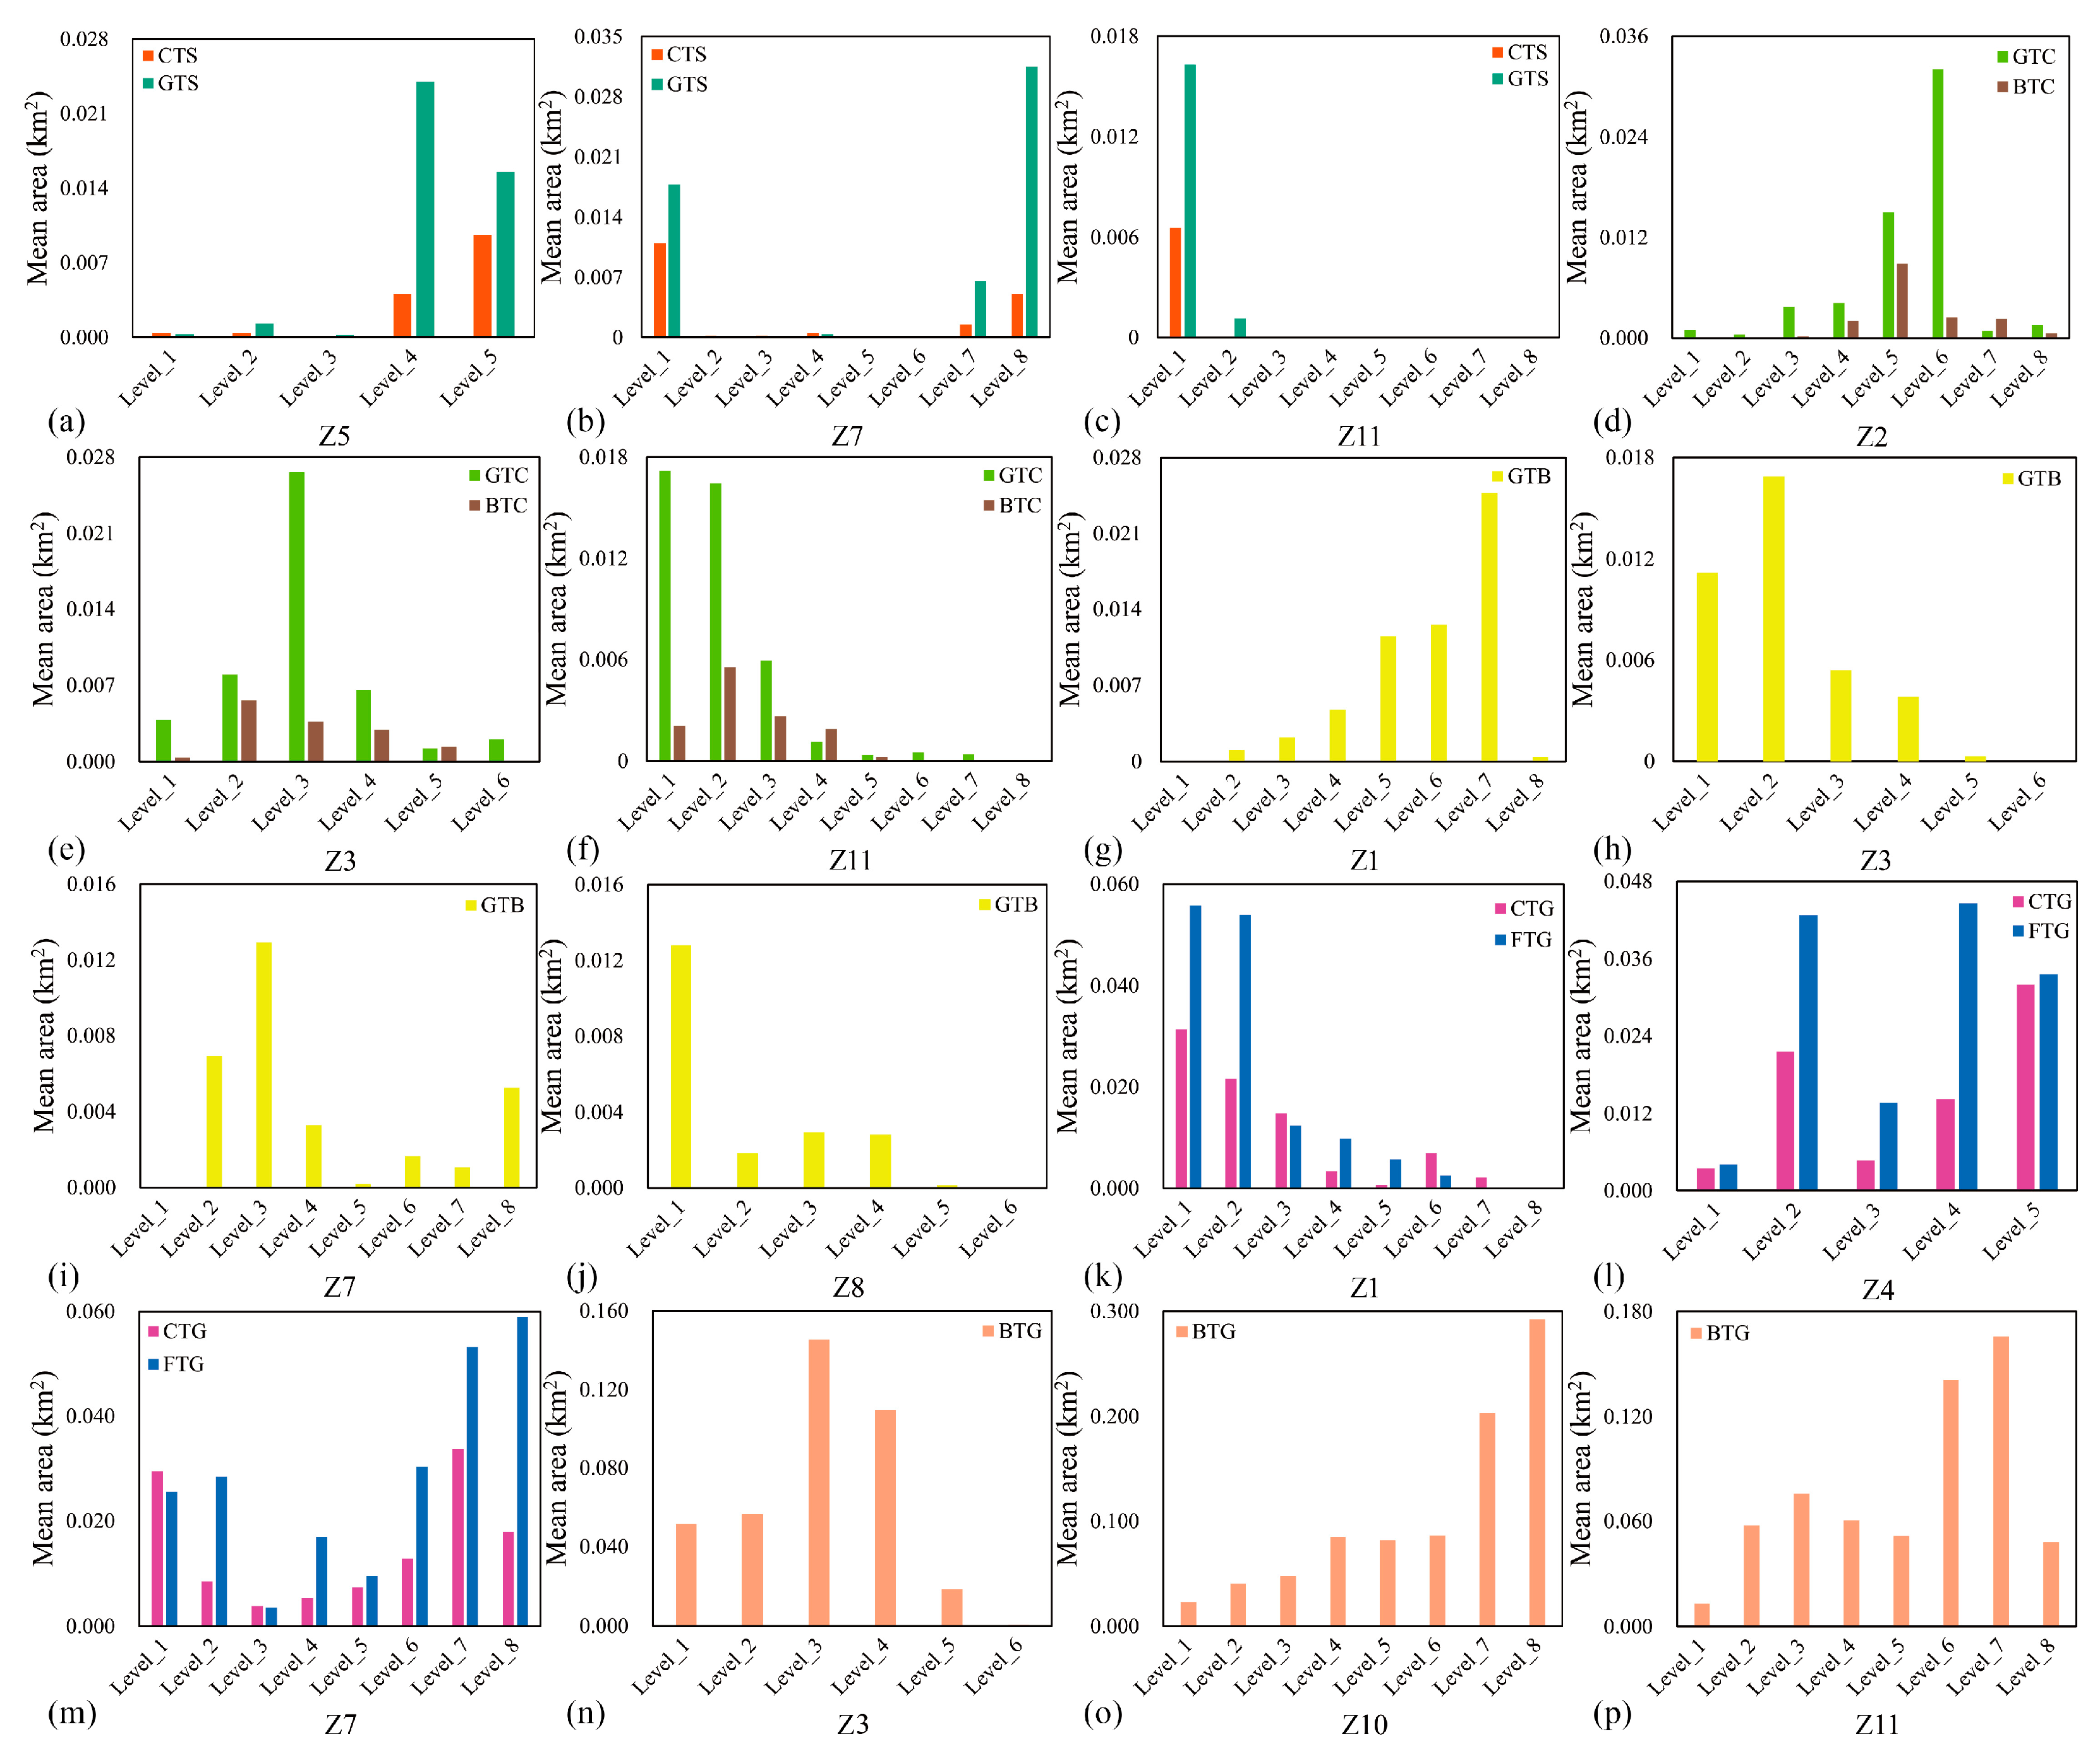
- Differences in Driving Factor Influences on LULC Change at their Levels
5. Discussion
5.1. Driving Mechanisms behind the Formation of and Changes in LULC Patterns
5.1.1. Driving Mechanisms behind the Formation of LULC Patterns
5.1.2. Driving Mechanisms behind LULC Changes
5.2. Suggestions for LULC Planning in the SRB
- (1)
- Promoting urbanization appropriately. “People-oriented” is the prerequisite for human social development. Therefore, appropriate and necessary urbanization benefits socioeconomic development, ecosystem service protection, and the improvement of people’s living standards [21]. However, the scale and rate of settlement growth should be controlled, and locals should pay attention to the efficiency of urban space utilization. Meanwhile, sufficient urban ecological land should be reserved, which could be considered ecological compensation for the destruction of surrounding natural green space caused by urban expansion. In summary, ecological damage should be minimized during urbanization.
- (2)
- Protecting elemental cropland and improving production efficiency. With the development of urbanization and the operation of ecological restoration schemes, cropland has reduced in the SRB over the past few decades. Excessive reductions in cropland may threaten regional food security to some extent. Consequently, the quantity of elemental cropland should be fully guaranteed to ensure essential ecological environment health and meet appropriate and necessary urbanization construction. In addition, the cropland’s spatial pattern should be optimized, considering the ecological functions of different regions. For instance, agricultural activities should be avoided as much as possible in the upper reaches, which are crucial water conservation areas of the SRB. Instead, they can be appropriately shifted to the middle and lower reaches. In addition, it is necessary to continuously improve the structure of the agricultural industry and promote water-saving irrigation, which is suitable for local regions. However, people should focus on ecological problems, such as the degradation of natural shelterbelts around cropland caused by the change in irrigation means. Relevant investigations, assessments, and remedial plans should be developed before water-saving irrigation techniques are used, which could avoid secondary damage to the local ecological environment in the short term.
- (3)
- Protecting ecological land. Vegetation is a significant natural barrier to ensure regional ecological security and prevent desertification in arid inland regions. Hence, people should continue to increase forests and grassland in the basin under the guidance of relevant ecological environment protection policies. Additionally, relevant laws and regulations should be established to prevent the recurrence of severe ecological damage. For example, given forest degradation upstream, artificial planting could be adopted to accelerate forest recovery, and corresponding nature reserves should be established. Nevertheless, blind planting must be restricted, and the government should plan the planting area, layout, and varieties scientifically and rationally to avoid the unnecessary consumption of water resources.
5.3. Limitations and Future Work
6. Conclusions
Author Contributions
Funding
Institutional Review Board Statement
Informed Consent Statement
Data Availability Statement
Conflicts of Interest
Appendix A

Appendix B

| Factor | Method | Level Numbers | Unit |
|---|---|---|---|
| X1, Z1 | Natural Breaks | 8 | °C |
| X2, Z2 | Natural Breaks | 8 | mm |
| X3, Z3 | Quantile | 6 | m |
| X4, Z4 | Natural Breaks | 5 | persons/km2 |
| X5, Z5 | Natural Breaks | 5 | 104 CNY/ km2 |
| X6, Z6 | Natural Breaks | 5 | 104 CNY/ km2 |
| X7, Z7 | Natural Breaks | 8 | 108 m3/ km2 |
| X8, Z8 | Natural Breaks | 6 | 108 m3/ km2 |
| X9, Z9 | Natural Breaks | 6 | 108 m3/ km2 |
| X10, Z10 | Natural Breaks | 8 | km |
| X11, Z11 | Natural Breaks | 8 | km |
Appendix C
| 2005 | ||||||||
| Land Use Types | Cropland | Forest | Grassland | Settlement | Bare Land | Others | Total Area | |
| 2000 | Cropland | 5142.78 | 0.09 | 12.51 | 2.97 | 0.00 | 0.00 | 5158.35 |
| Forest | 0.00 | 2110.23 | 105.39 | 0.81 | 0.45 | 0.00 | 2216.88 | |
| Grassland | 98.82 | 21.60 | 21,780.00 | 17.55 | 14.76 | 2.25 | 21,934.98 | |
| Settlement | 0.00 | 0.00 | 0.00 | 12.60 | 0.00 | 0.00 | 12.60 | |
| Bare Land | 35.91 | 0.27 | 619.47 | 1.08 | 9476.19 | 0.00 | 10,132.92 | |
| Others | 0.00 | 0.00 | 0.00 | 0.00 | 0.00 | 36.27 | 36.27 | |
| Total Area | 5277.51 | 2132.19 | 22,517.37 | 35.01 | 9491.40 | 38.52 | 39,492.00 | |
| 2010 | ||||||||
| Land Use Types | Cropland | Forest | Grassland | Settlement | Bare Land | Others | Total Area | |
| 2005 | Cropland | 5241.51 | 0.00 | 32.85 | 3.15 | 0.00 | 0.00 | 5277.51 |
| Forest | 0.00 | 2058.39 | 71.73 | 1.80 | 0.27 | 0.00 | 2132.19 | |
| Grassland | 21.24 | 0.99 | 22,424.58 | 16.11 | 52.02 | 2.43 | 22,517.37 | |
| Settlement | 0.00 | 0.00 | 0.00 | 35.01 | 0.00 | 0.00 | 35.01 | |
| Bare Land | 2.16 | 0.00 | 106.83 | 0.36 | 9382.05 | 0.00 | 9491.40 | |
| Others | 0.00 | 0.00 | 0.00 | 0.00 | 0.00 | 38.52 | 38.52 | |
| Total Area | 5264.91 | 2059.38 | 22,635.99 | 56.43 | 9434.34 | 40.95 | 39,492.00 | |
| 2015 | ||||||||
| Land Use Types | Cropland | Forest | Grassland | Settlement | Bare Land | Others | Total Area | |
| 2010 | Cropland | 5167.08 | 0.09 | 90.27 | 7.38 | 0.09 | 0.00 | 5264.91 |
| Forest | 0.00 | 1934.82 | 123.66 | 0.90 | 0.00 | 0.00 | 2059.38 | |
| Grassland | 0.09 | 1.80 | 22,599.90 | 16.92 | 16.20 | 1.08 | 22,635.99 | |
| Settlement | 0.00 | 0.00 | 0.00 | 56.43 | 0.00 | 0.00 | 56.43 | |
| Bare Land | 0.00 | 0.00 | 369.27 | 0.00 | 9065.07 | 0.00 | 9434.34 | |
| Others | 0.00 | 0.00 | 0.00 | 0.00 | 0.00 | 40.95 | 40.95 | |
| Total Area | 5167.17 | 1936.71 | 23,183.10 | 81.63 | 9081.36 | 42.03 | 39,492.00 | |
| 2018 | ||||||||
| Land Use Types | Cropland | Forest | Grassland | Settlement | Bare Land | Others | Total Area | |
| 2015 | Cropland | 5104.53 | 0.27 | 57.87 | 4.41 | 0.09 | 0.00 | 5167.17 |
| Forest | 0.00 | 1903.50 | 32.85 | 0.36 | 0.00 | 0.00 | 1936.71 | |
| Grassland | 21.87 | 4.41 | 23,104.08 | 16.83 | 35.73 | 0.18 | 23,183.10 | |
| Settlement | 0.00 | 0.00 | 0.00 | 81.63 | 0.00 | 0.00 | 81.63 | |
| Bare Land | 4.59 | 0.00 | 31.50 | 0.81 | 9044.46 | 0.00 | 9081.36 | |
| Others | 0.00 | 0.00 | 0.00 | 0.00 | 0.00 | 42.03 | 42.03 | |
| Total Area | 5130.99 | 1908.18 | 23,226.30 | 104.04 | 9080.28 | 42.21 | 39,492.00 | |
Appendix D

Appendix E
| LULC Change Type | Z1 | Z2 | Z3 | Z4 | Z5 | Z6 | Z7 | Z8 | Z9 | Z10 | Z11 |
|---|---|---|---|---|---|---|---|---|---|---|---|
| CTG | 0.0181 | 0.0039 | 0.0090 | 0.0152 | 0.0054 | 0.0019 | 0.0162 | 0.0099 | 0.0136 | 0.0110 | 0.0071 |
| CTS | 0.0092 | 0.0055 | 0.0058 | 0.0108 | 0.0104 | 0.0018 | 0.0125 | 0.0105 | 0.0112 | 0.0025 | 0.0109 |
| FTG | 0.0307 | 0.0034 | 0.0311 | 0.0196 | 0.0019 | 0.0075 | 0.0201 | 0.0161 | 0.0183 | 0.0102 | 0.0035 |
| GTB | 0.0122 | 0.0036 | 0.0088 | 0.0056 | 0.0042 | 0.0029 | 0.0070 | 0.0068 | 0.0047 | 0.0014 | 0.0037 |
| GTC | 0.0032 | 0.0146 | 0.0105 | 0.0030 | 0.0047 | 0.0035 | 0.0048 | 0.0030 | 0.0065 | 0.0033 | 0.0077 |
| GTS | 0.0123 | 0.0071 | 0.0090 | 0.0064 | 0.0143 | 0.0136 | 0.0200 | 0.0078 | 0.0105 | 0.0028 | 0.0132 |
| BTC | 0.0033 | 0.0083 | 0.0037 | 0.0001 | 0.0010 | 0.0006 | 0.0006 | 0.0004 | 0.0006 | 0.0012 | 0.0033 |
| BTG | 0.0119 | 0.0080 | 0.0349 | 0.0060 | 0.0203 | 0.0073 | 0.0049 | 0.0139 | 0.0033 | 0.0445 | 0.0219 |
| OTS | 0.0041 | 0.0016 | 0.0055 | 0.0009 | 0.0030 | 0.0012 | 0.0075 | 0.0052 | 0.0039 | 0.0032 | 0.0031 |
Appendix F
| Factor | Level_1 | Level_2 | Level_3 | Level_4 | Level_5 | Level_6 | Level_7 | Level_8 | Method |
|---|---|---|---|---|---|---|---|---|---|
| Z1 (°C) | [−0.01, 0.09] | (0.09, 0.16] | (0.16, 0.23] | (0.23, 0.29] | (0.29, 0.36] | (0.36, 0.45] | (0.45, 0.55] | (0.55, 0.67] | Natural Breaks |
| Z2 (mm) | [−53.32, −9.92] | (−9.92, 9.21] | (9.21, 23.92] | (23.92, 39.37] | (39.37, 57.76] | (57.76, 79.09] | (79.09, 101.90] | (101.90, 135.00] | Natural Breaks |
| Z3 (m) | [1228, 1350] | (1350, 1439] | (1439, 1579] | (1579, 1940] | (1940, 2633] | (2633, 4795] | Quantile | ||
| Z4 (persons/km2) | [−2.68, −0.78] | (−0.78, 2.38] | (2.38, 7.77] | (7.77, 14.84] | (14.84, 24.34] | Natural Breaks | |||
| Z5 (104 CNY/ km2) | [3.03, 52.56] | (52.56, 83.89] | (83.89, 128.36] | (128.36, 198.11] | (198.11, 261.79] | Natural Breaks | |||
| Z6 (104 CNY/ km2) | [1.03, 2.01] | (2.01, 3.22] | (3.22, 4.27] | (4.27, 5.46] | (5.46, 7.13] | Natural Breaks | |||
| Z7 (108 m3/ km2) | [−2.39, −2.00] | (−2.00, −1.61] | (−1.61, −1.20] | (−1.20, −0.80] | (−0.80, −0.42] | (−0.42, 0.01] | (0.01, 0.327] | (0.33, 0.79] | Natural Breaks |
| Z8 (108 m3/ km2) | [−0.42, −0.28] | (−0.28, −0.15] | (−0.15, 0.01] | (0.01, 0.17] | (0.17, 0.31] | (0.31, 0.45] | Natural Breaks | ||
| Z9 (108 m3/ km2) | [−3.35, −2.72] | (−2.72, −2.04] | (−2.04, −1.48] | (−1.48, −0.89] | (−0.89, −0.16] | (−0.16, 0.54] | Natural Breaks | ||
| Z10 (km) | [0, 6.38] | (6.38, 14.15] | (14.15, 23.26] | (23.26, 32.90] | (32.90, 43.72] | (43.72, 56.96] | (56.96, 73.50] | (73.50, 98.22] | Natural Breaks |
| Z11 (km) | [0, 5.82] | (5.82, 10.36] | (10.36, 15.21] | (15.21, 20.44] | (20.44, 26.65] | (26.65, 34.35] | (34.35, 44.26] | (44.26, 63.51] | Natural Breaks |
References
- Li, X.; Cheng, G.; Ge, Y.; Li, H.; Han, F.; Hu, X.; Tian, Y.; Pan, X.; Nian, Y. Hydrological cycle in the Heihe River Basin and its implication for water resource management in endorheic basins. J. Geophys. Res. Atmos. 2018, 123, 890–914. [Google Scholar] [CrossRef]
- Yu, Y.; Pi, Y.; Yu, X.; Ta, Z.; Sun, L.; Disse, M.; Zeng, F.; Li, Y.; Chen, X.; Yu, R. Climate change, water resources and sustainable development in the arid and semi-arid lands of Central Asia in the past 30 years. J. Arid Land 2019, 11, 1–14. [Google Scholar] [CrossRef]
- Montenegro, S.; Ragab, R. Impact of possible climate and land use changes in the semi arid regions: A case study from North Eastern Brazil. J. Hydrol. 2012, 434, 55–68. [Google Scholar] [CrossRef]
- Bie, Q.; Xie, Y. The constraints and driving forces of oasis development in arid region: A case study of the Hexi Corridor in northwest China. Sci. Rep. 2020, 10, 17708. [Google Scholar] [CrossRef] [PubMed]
- Ketema, H.; Wei, W.; Legesse, A.; Wolde, Z.; Temesgen, H.; Yimer, F.; Mamo, A. Quantifying smallholder farmers’ managed land use/land cover dynamics and its drivers in contrasting agro-ecological zones of the East African Rift. Global Ecol. Conserv. 2020, 21, e898. [Google Scholar] [CrossRef]
- Xi, X.; Sokolik, I.N. Quantifying the anthropogenic dust emission from agricultural land use and desiccation of the Aral Sea in Central Asia. J. Geophys. Res. Atmos. 2016, 121, 12270–12281. [Google Scholar] [CrossRef]
- El-Tantawi, A.M.; Bao, A.; Chang, C.; Liu, Y. Monitoring and predicting land use/cover changes in the Aksu-Tarim River Basin, Xinjiang-China (1990–2030). Environ. Monit. Assess. 2019, 191, 480. [Google Scholar] [CrossRef]
- Zhang, L.; Nan, Z.; Xu, Y.; Li, S. Hydrological impacts of land use change and climate variability in the headwater region of the Heihe River Basin, Northwest China. PLoS ONE 2016, 11, e158394. [Google Scholar] [CrossRef]
- Kleemann, J.; Baysal, G.; Bulley, H.N.; Fürst, C. Assessing driving forces of land use and land cover change by a mixed-method approach in north-eastern Ghana, West Africa. J. Environ. Manag. 2017, 196, 411–442. [Google Scholar] [CrossRef]
- Zhou, J.; Li, Q.; Wang, L.; Lei, L.; Zhu, G. Impact of climate change and land-use on the propagation from meteorological drought to hydrological drought in the eastern Qilian Mountains. Water 2019, 11, 1602. [Google Scholar] [CrossRef]
- Wei, W.; Xie, Y.; Shi, P.; Zhou, J.; Li, C. Spatial temporal analysis of land use change in the Shiyang River Basin in arid China, 1986–2015. Pol. J. Environ. Stud. 2017, 26, 1789–1796. [Google Scholar] [CrossRef] [PubMed]
- Wei, W.; Li, Z.; Xie, B.; Zhou, J.; Li, C. Spatio-temporal change and driving force of oasis for desert reservoir from 1988 to 2016 in northwestern China. Pol. J. Environ. Stud. 2019, 29, 871–884. [Google Scholar] [CrossRef] [PubMed]
- Lu, H.; Nie, Z.; Liu, M.; Feng, B.; Cheng, X.; Wang, J.; Wang, Q.; Cui, H.; Fan, F. Research on land cover changes in Shiyang River Basin in recent 50 years based on RS and GIS. Geol. Resour. 2020, 29, 165–171, 179. [Google Scholar]
- Hailu, A.; Mammo, S.; Kidane, M. Dynamics of land use, land cover change trend and its drivers in Jimma Geneti District, Western Ethiopia. Land Use Policy 2020, 99, 105011. [Google Scholar] [CrossRef]
- Jia, Y.; Yan, L.; Fan, Y.; Cao, L. Land use change and landscape pattern of typical semi-arid and arid watershed of western China: A case study on Shiyang River Basin. Remote Sens. Inf. 2016, 31, 66–73. [Google Scholar]
- Zhang, Y.; Wang, T.; Cai, C.; Li, C.; Liu, Y.; Bao, Y.; Guan, W. Landscape pattern and transition under natural and anthropogenic disturbance in an arid region of northwestern China. Int. J. Appl. Earth Obs. Geoinf. 2016, 44, 1–10. [Google Scholar] [CrossRef]
- Guan, H.; Zhang, G. Landscape pattern and its driving forces of Shiyang River Basin. J. Lanzhou Jiaotong Univ. 2017, 36, 93–99. [Google Scholar]
- Liu, C.; Zhang, F.; Johnson, V.C.; Duan, P. Spatio-temporal variation of oasis landscape pattern in arid area: Human or natural driving? Ecol. Indic. 2021, 125, 107495. [Google Scholar] [CrossRef]
- Wei, W.; Xie, Y.; Wei, X.; Xie, B.; Zhang, Q.; Hao, Y. Land use optimization based on CLUE-S model and ecological security scenario in Shiyang River Basin. Geomat. Inf. Sci. Wuhan Univ. 2017, 46, 1306–1315. [Google Scholar]
- Yaghobi, S.; Faramarzi, M.; Karimi, H.; Sarvarian, J. Simulation of land-use changes in relation to changes of groundwater level in arid rangeland in western Iran. Int. J. Environ. Sci. Technol. 2019, 16, 1637–1648. [Google Scholar] [CrossRef]
- Wang, Q.; Guan, Q.; Lin, J.; Luo, H.; Tan, Z.; Ma, Y. Simulating land use/land cover change in an arid region with the coupling models. Ecol. Indic. 2021, 122, 107231. [Google Scholar] [CrossRef]
- Su, F.; Shang, H.; Zhang, Z. The change and analysis on the ecological service of Shiyang River basin from 1980 to 2010. J. Glaciol. Geocryol. 2017, 39, 917–925. [Google Scholar]
- Wang, Y.; Zhao, J.; Fu, J.; Wei, W. Effects of the Grain for Green Program on the water ecosystem services in an arid area of China-Using the Shiyang River Basin as an example. Ecol. Indic. 2019, 104, 659–668. [Google Scholar] [CrossRef]
- Yang, L.; Sun, Z.; Li, J.; Shi, L.; Kong, H.; Yang, Y.; Li, T. Spatiotemporal patterns and driving forces of land-use and land-cover change in the Mu Us Sandy Land, China from 1980 to 2018. Arid Land Res. Manag. 2021, 36, 109–124. [Google Scholar] [CrossRef]
- Maimaitiaili, A.; Aji, X.; Matniyaz, A.; Kondoh, A. Monitoring and analysing land use/cover changes in an arid region based on multi-satellite data: The Kashgar Region, Northwest China. Land 2018, 7, 6. [Google Scholar] [CrossRef]
- Zhao, R.; Chen, Y.; Shi, P.; Zhang, L.; Pan, J.; Zhao, H. Land use and land cover change and driving mechanism in the arid inland river basin: A case study of Tarim River, Xinjiang, China. Environ. Earth Sci. 2013, 68, 591–604. [Google Scholar] [CrossRef]
- Zewdie, M.; Worku, H.; Bantider, A. Temporal dynamics of the driving factors of urban landscape change of Addis Ababa during the past three decades. Environ. Manag. 2018, 61, 132–146. [Google Scholar] [CrossRef] [PubMed]
- Wu, D.; Feng, X.; Wen, Q. The research of evaluation for growth suitability of Carya Cathayensis Sarg. based on PCA and AHP. Procedia Eng. 2011, 15, 1879–1883. [Google Scholar] [CrossRef]
- Kurek, K.A.; Heijman, W.; van Ophem, J.; Gędek, S.; Strojny, J. Measuring local competitiveness: Comparing and integrating two methods PCA and AHP. Qual. Quant. 2022, 56, 1371–1389. [Google Scholar] [CrossRef]
- Kang, S.; Su, X.; Tong, L.; Shi, P.; Yang, X.; Abe, Y.; Du, T.; Shen, Q.; Zhang, J. The impacts of human activities on the water–land environment of the Shiyang River Basin, an arid region in northwest China. Hydrol. Sci. J. 2004, 49, 413–427. [Google Scholar] [CrossRef]
- Zhou, Y.; Li, X.; Liu, Y. Land use change and driving factors in rural China during the period 1995–2015. Land Use Policy 2020, 99, 105048. [Google Scholar] [CrossRef]
- Huang, H.; Zhou, Y.; Qian, M.; Zeng, Z. Land use transition and driving forces in Chinese Loess Plateau: A case study from Pu County, Shanxi Province. Land 2021, 10, 67. [Google Scholar] [CrossRef]
- Wang, J.; Xu, C. Geodetector: Principle and prospective. Acta Geogr. Sin. 2017, 72, 116–134. [Google Scholar]
- Huang, F.; Ochoa, C.G.; Chen, X.; Zhang, D. Modeling oasis dynamics driven by ecological water diversion and implications for oasis restoration in arid endorheic basins. J. Hydrol. 2021, 593, 125774. [Google Scholar] [CrossRef]
- Xue, D.; Zhou, J.; Zhao, X.; Liu, C.; Wei, W.; Yang, X.; Li, Q.; Zhao, Y. Impacts of climate change and human activities on runoff change in a typical arid watershed, NW China. Ecol. Indic. 2021, 121, 107013. [Google Scholar] [CrossRef]
- Liu, M.; Li, L.; Shi, Z.; Qin, S. Distribution characteristics of runoff in Shiyang River Basin and its responses to climate change-The case study of Xiying River. Agric. Res. Arid Areas 2013, 31, 193–198. [Google Scholar]
- Li, Y.; Ge, J.; Hou, M.; Gao, H.; Liu, J.; Bao, X.; Yin, J.; Gao, J.; Feng, Q.; Liang, T. A study of the spatiotemporal dynamic of land cover types and the driving forces of grassland area change in Gannan Prefecture and Northwest Sichuan based on CCI-LC data. Acta Prataculturae Sin. 2020, 29, 1–15. [Google Scholar]
- Wang, H.; Wen, X.; Wang, Y.; Cai, L.; Peng, D.; Liu, Y. China’s land cover fraction change during 2001–2015 based on remote sensed data fusion between MCD12 and CCI-LC. Remote Sens. 2021, 13, 341. [Google Scholar] [CrossRef]
- Yang, Y.; Xiao, P.; Feng, X.; Li, H. Accuracy assessment of seven global land cover datasets over China. ISPRS J. Photogramm. Remote Sens. 2017, 125, 156–173. [Google Scholar] [CrossRef]
- Sun, W.; Ding, X.; Su, J.; Mu, X.; Zhang, Y.; Gao, P.; Zhao, G. Land use and cover changes on the Loess Plateau: A comparison of six global or national land use and cover datasets. Land Use Policy 2022, 119, 106165. [Google Scholar] [CrossRef]
- Hua, T.; Zhao, W.; Liu, Y.; Wang, S.; Yang, S. Spatial consistency assessments for global land-cover datasets: A comparison among GLC2000, CCI LC, MCD12, GLOBCOVER and GLCNMO. Remote Sens. 2018, 10, 1846. [Google Scholar] [CrossRef]
- Liu, Q.; Zhang, Y.; Liu, L.; Li, L.; Qi, W. The spatial local accuracy of land cover datasets over the Qiangtang Plateau, High Asia. J. Geogr. Sci. 2019, 29, 1841–1858. [Google Scholar] [CrossRef]
- Liu, Z.; Li, L.; Tim, R.M.; van Niel, T.G.; Yang, Q.; Li, R. Introduction of the professional interpolation software for meteorology data: ANUSPLINN. Meteorol. Mon. 2008, 34, 92–100. [Google Scholar]
- Qian, Y.; Lv, H.; Zhang, Y. Application and assessment of spatial interpolation method on daily meteorological elements based on ANUSPLIN software. J. Meteorol. Environ. 2010, 26, 7–15. [Google Scholar]
- Ma, H.; Zhang, L.; Wei, X.; Shi, T.; Chen, T. Spatial and temporal variations of land use and vegetation cover in Southwest China from 2000 to 2015. Chin. J. Appl. Ecol. 2021, 32, 618–628. [Google Scholar]
- Zhu, L.; Meng, J.; Zhu, L. Applying Geodetector to disentangle the contributions of natural and anthropogenic factors to NDVI variations in the middle reaches of the Heihe River Basin. Ecol. Indic. 2020, 117, 106545. [Google Scholar] [CrossRef]
- Wei, W.; Guo, Z.; Xie, B.; Zhou, J.; Li, C. Spatiotemporal evolution of environment based on integrated remote sensing indexes in arid inland river basin in Northwest China. Environ. Sci. Pollut. Res. 2019, 26, 13062–13084. [Google Scholar] [CrossRef]
- Khoshnava, S.M.; Rostami, R.; Zin, R.M.; Kamyab, H.; Abd Majid, M.Z.; Yousefpour, A.; Mardani, A. Green efforts to link the economy and infrastructure strategies in the context of sustainable development. Energy 2020, 193, 1297–1309. [Google Scholar] [CrossRef]
- Shi, P.; Wang, Z.; Liu, C. Spatial evolution process, pattern and mechanism of land cover change in Shiyang River Basin. Acta Ecol. Sin. 2014, 34, 4361–4371. [Google Scholar]
- Guan, Q.; Yang, L.; Pan, N.; Lin, J.; Xu, C.; Wang, F.; Liu, Z. Greening and browning of the Hexi Corridor in northwest China: Spatial patterns and responses to climatic variability and anthropogenic drivers. Remote Sens. 2018, 10, 1270. [Google Scholar] [CrossRef]
- Li, L.; Wang, D.; Han, T. Spatial-temporal dynamics of vegetation coverage and responding to climate change in Shiyang River Basin during 2000–2015. J. Desert Res. 2018, 38, 1108–1118. [Google Scholar]
- Eamus, D.; Froend, R.; Loomes, R.; Hose, G.; Murray, B. A functional methodology for determining the groundwater regime needed to maintain the health of groundwater-dependent vegetation. Aust. J. Bot. 2006, 54, 97–114. [Google Scholar] [CrossRef]
- Glazer, A.N.; Likens, G.E. The water table: The shifting foundation of life on land. Ambio 2012, 41, 657–669. [Google Scholar] [CrossRef] [PubMed]
- Huang, F.; Chunyu, X.; Zhang, D.; Chen, X.; Ochoa, C.G. A framework to assess the impact of ecological water conveyance on groundwater-dependent terrestrial ecosystems in arid inland river basins. Sci. Total Environ. 2020, 709, 136155. [Google Scholar] [CrossRef] [PubMed]
- Ren, L.; Ran, Y.; Ren, L.; Tan, M. Temporal-spatial characteristics of vegetation change in Shiyang River basin from 2001 to 2018 and its implication for integrated watershed management. J. Glaciol. Geocryol. 2019, 41, 1244–1253. [Google Scholar]
- Zhang, S.; An, F.; Guo, Y. Research on land use change of Shiyang River Basin based on TM image. Environ. Prot. Xinjiang 2012, 34, 40–46. [Google Scholar]
- Chen, Y.; Li, Z.; Fan, Y.; Wang, H.; Fang, G. Research progress on the impact of climate change on water resources in the arid region of Northwest China. Acta Geogr. Sin. 2014, 69, 1295–1304. [Google Scholar]
- Zhang, Y.; Yang, Z.; Wang, L.; Kang, Y. Response of vegetation coverage to climatic factors in the middle reaches of the Shiyang River in growing season. Arid Zone Res. 2018, 35, 662–668. [Google Scholar]
- Li, K.; Feng, M.; Biswas, A.; Su, H.; Niu, Y.; Cao, J. Driving factors and future prediction of land use and cover change based on satellite remote sensing data by the LCM model: A case study from Gansu province, China. Sensors 2020, 20, 2757. [Google Scholar] [CrossRef]
- Cao, L.; Nie, Z.; Liu, M.; Lu, H.; Wang, L. Changes in natural vegetation growth and groundwater depth and their relationship in the Minqin oasis in the Shiyang River Basin. Hydrogeol. Eng. Geol. 2020, 47, 25–33. [Google Scholar]
- Jiang, Y.; Yang, J.; Zhao, F.; Hong, K.; Liu, X.; Hao, Y. Effect evaluation on the comprehensive management for Shiyang River Basin from the perspective of temporal and spatial changes of vegetation coverage in Minqin Basin. J. Yunnan Agric. Univ. Nat. Sci. 2020, 35, 726–735. [Google Scholar]
- Wang, J.; Wang, X. Dynamic change characteristics of vegetation coverage in the northern basin of Shiyang River from 2000 to 2016. Geospat. Inf. 2019, 17, 46–49. [Google Scholar]
- Zhang, Y.; Chen, J.; Han, Y.; Qian, M.; Guo, X.; Chen, R.; Xu, D.; Chen, Y. The contribution of Fintech to sustainable development in the digital age: Ant forest and land restoration in China. Land Use Policy 2021, 103, 105306. [Google Scholar] [CrossRef]
- Kuang, W. 70 years of urban expansion across China: Trajectory, pattern, and national policies. Sci. Bull. 2020, 65, 1970–1974. [Google Scholar] [CrossRef]
- Ding, W.; Liu, Y.; Tian, X.; Zhang, H. A research on innovative management mechanism of Qilian Mountain National Nature Reserve. Environ. Prot. 2018, 46, 41–46. [Google Scholar]
- Xue, X.; Liao, J.; Hsing, Y.; Huang, C.; Liu, F. Policies, land Use, and water resource management in an arid oasis ecosystem. Environ. Manag. 2015, 55, 1036–1051. [Google Scholar] [CrossRef]
- Yang, H.; Li, Y.; Feng, Q.; Chen, L.; Zhao, Y. Environmental policy evaluation from the perspective of farmers’ perception in arid oasis ecosystem: Experiences of Minqin, Northwest China. Glob. NEST J. 2017, 19, 289–299. [Google Scholar]
- Sun, Q.; Zhang, P.; Sun, D. Analysis of policy effects on land deterioration control in Minqin County, Gansu, Northwest China. J. Soil Sci. 2018, 49, 1060–1065. [Google Scholar]
- Yue, W.; Liu, X.; Wang, T.; Chen, X. Impacts of water saving on groundwater balance in a large-scale arid irrigation district, Northwest China. Irrig. Sci. 2016, 34, 297–312. [Google Scholar] [CrossRef]
- Shi, L.; Zhang, R.; Dong, P.; Shi, P.; Cheng, Z. Research on measures for sustainable and efficient utilization of water resources in Minqin County in arid area with water shortage. Water Resour. Prot. 2017, 33, 20–25. [Google Scholar]
- Jiang, G.; Wang, Z. Scale effects of ecological safety of water-saving irrigation: A case study in the arid inland river basin of Northwest China. Water 2019, 11, 1886. [Google Scholar] [CrossRef]
- Cao, L.; Nie, Z.; Liu, M.; Wang, L.; Wang, J.; Wang, Q. The ecological relationship of groundwater–soil–vegetation in the oasis–desert transition zone of the Shiyang River Basin. Water 2021, 13, 1642. [Google Scholar] [CrossRef]
- Lei, B.; Liu, Y.; Du, L.; Wang, L.; Peng, Z. Primary research on integrated evaluation of environment impacts by water-saving improvement in irrigation districts. J. Irrig. Drain 2011, 30, 100–103. [Google Scholar]
- Li, W.; Yang, L. China’s 13th and 14th Five-Year Plans: Review and advice. China Econ. 2020, 15, 2–36. [Google Scholar]


| Variable | Code | Description |
|---|---|---|
| Dependent variable | CLA | The area of cropland in a grid cell. |
| FSA | The area of forest in a grid cell. | |
| GLA | The area of grassland in a grid cell. | |
| SLA | The area of settlement in a grid cell. | |
| BLA | The area of bare land in a grid cell. | |
| Independent variable | X1 | The annual mean temperature in a grid cell. |
| X2 | The annual accumulated precipitation in a grid cell. | |
| X3 | The altitude in a grid cell. | |
| X4 | The population in a grid cell. | |
| X5 | The GDP in a grid cell. | |
| X6 | The GDP per capita in a grid cell. | |
| X7 | The total water consumption in grid cell. | |
| X8 | The surface water supply in a grid cell. | |
| X9 | The groundwater supply in a grid cell. | |
| X10 | The distance to the rivers in a grid cell. | |
| X11 | The distance to urban and township centers in a grid cell. |
| Variable | Code | Description |
|---|---|---|
| Dependent variable | CTG | The area of conversion of cropland to grassland in a grid cell. |
| CTS | The area of conversion of cropland to settlement in a grid cell. | |
| FTG | The area of conversion of forest to grassland in a grid cell. | |
| GTB | The area of conversion of grassland to bare land in a grid cell. | |
| GTC | The area of conversion of grassland to cropland in a grid cell. | |
| GTS | The area of conversion of grassland to settlement in a grid cell. | |
| BTC | The area of conversion of bare land to cropland in a grid cell. | |
| BTG | The area of conversion of bare land to grassland in a grid cell. | |
| OTS | The area of conversions of other land use types. | |
| CTG | The area of conversion of cropland to grassland in a grid cell. | |
| Independent variable | Z1 | The change in annual mean temperature in a grid cell. |
| Z2 | The change in annual accumulated precipitation in a grid cell. | |
| Z3 | The altitude in a grid cell. | |
| Z4 | The change in population in a grid cell. | |
| Z5 | The change in GDP in a grid cell. | |
| Z6 | The change in GDP per capita in a grid cell. | |
| Z7 | The change in total water consumption in grid cell. | |
| Z8 | The change in surface water supply in a grid cell. | |
| Z9 | The change in groundwater supply in a grid cell. | |
| Z10 | The distance to the rivers in a grid cell. | |
| Z11 | The distance to urban and township centers in a grid cell. |
Disclaimer/Publisher’s Note: The statements, opinions and data contained in all publications are solely those of the individual author(s) and contributor(s) and not of MDPI and/or the editor(s). MDPI and/or the editor(s) disclaim responsibility for any injury to people or property resulting from any ideas, methods, instructions or products referred to in the content. |
© 2022 by the authors. Licensee MDPI, Basel, Switzerland. This article is an open access article distributed under the terms and conditions of the Creative Commons Attribution (CC BY) license (https://creativecommons.org/licenses/by/4.0/).
Share and Cite
Li, J.; Chunyu, X.; Huang, F. Land Use Pattern Changes and the Driving Forces in the Shiyang River Basin from 2000 to 2018. Sustainability 2023, 15, 154. https://doi.org/10.3390/su15010154
Li J, Chunyu X, Huang F. Land Use Pattern Changes and the Driving Forces in the Shiyang River Basin from 2000 to 2018. Sustainability. 2023; 15(1):154. https://doi.org/10.3390/su15010154
Chicago/Turabian StyleLi, Juan, Xunzhou Chunyu, and Feng Huang. 2023. "Land Use Pattern Changes and the Driving Forces in the Shiyang River Basin from 2000 to 2018" Sustainability 15, no. 1: 154. https://doi.org/10.3390/su15010154
APA StyleLi, J., Chunyu, X., & Huang, F. (2023). Land Use Pattern Changes and the Driving Forces in the Shiyang River Basin from 2000 to 2018. Sustainability, 15(1), 154. https://doi.org/10.3390/su15010154