1. Introduction
Machining processes such as milling, drilling, and turning, are major components of the manufacturing and have greatly impacted the history and growth of the industry [
1]. Since manufacturing began developing with the growth of industrialization it has been one of the largest contributors to negative environmental impacts such as greenhouse gas emissions [
2]. Machining processes are highly complex and multi-faceted, requiring in-depth analysis of interrelated factors such as technical settings, cost, quality, environmental impacts, and human components [
3,
4]. In past studies of these factors, research has been focused on individual separate factors such as the quantification or reduction of the environmental impact of machining processes through specific avenues of change [
5,
6]. The adjustment of cutting conditions might make the process time faster but quality lower, or the use of copious amounts of cutting fluids may increase product quality but also increase manufacturing cost and environmental impact [
7]. These factors are dynamic and overlapping by nature, static individual analysis results in inefficiency and negative environmental impacts [
3,
8]. In order to fully understand the complexities and repercussions of any decision related to manufacturing processes, it is essential to take multiple factors into account to generate a more holistic visualization and understanding of the feedbacks of the machining system. Because these key technical, human, and environmental factors have not been fully recognized, the complexity is not yet understood [
9,
10].
2. Literature Review
This section presents a literature review on understanding interconnections among environmental impact, cost, quality, time, and technical settings of machining processes.
2.1. Environmental Impact and Cost
Sustainability and cost reduction are often seen as inverse efforts that cannot happen simultaneously, when in actuality, businesses that strive for excellence in both fields often see long-term benefits overall. Today, raw materials and energy consumption average up to or over 50% of the manufactured products’ total cost; as such, reducing these costs through sustainable efforts result in lower overall product manufacturing costs [
11]. The electrical energy requirement of machining processes is inversely proportional to the process rate, because the power allotted to the equipment decreased as process rate increased due to large tare power. The material removing rate (MRR) can be increased through toolpath modification and using better suited tools such as carbide end or coated end mills. In addition to higher cutting speeds, these more durable tools extend tool life which reduces tool costs [
12]. Reducing energy consumed in machining operations reduces the manufacturers’ carbon dioxide footprint. Machine selection is highly important, as a micro milling facility uses 800 times less energy than a conventional machine, making it a sound option when a micro machine will do the job [
13]. It is possible to increase tool utilization by using worn tools in secondary machining operations, decreasing environmental impact, production cycle time, cost of tools, and energy consumption. After the major cutting edge wears out after significant machining, changing the tool setup would allow the lightly worn minor cutting edge to serve as a ‘new’ major cutting edge [
6].
Ways to improve environmental impact include reducing energy consumption, minimizing and eliminating material use (especially cutting fluids and coolants) and reusing old tools. New coolant technologies and strategies, such as dry or cryogenic machining, have advantages in improved tool wear and reduced chip-disposal costs because the machining chips are not contaminated [
5]. Reducing consumption of cutting fluids has been shown to be beneficial to the environment, as the cutting fluid wastewater contains harmful substances that must be treated which can become costly. Recycling the fluids by removing contaminants to maximize fluid life minimizes waste while reducing disposal and material costs [
14]. Cutting fluids are used to cool and lubricate work surfaces to reduce friction and heat generation, which is needed to increase tool life by protecting the tools from abrasion and diffusion. Current cooling technologies are costly; it is estimated they cost four times the cost of cutting tools used in the process when considering supply, use, and washing. Alternative plant-based or gaseous lubricoolants are being shown as effective, sustainable, and less costly [
15]. Cutting fluids are important to increase production rate, surface quality, and lower heat generation, all of which lower costs in various ways. However, cutting fluids can be 15–30% of total costs, and cost 2-4 times that to dispose of them in America. Finding an alternative such as dry machining, improved tool coating, and coolants with increased biodegradability and reduced toxicity often prove to be the optimal decision [
16].
2.2. Environmental Impacts and Quality
Throughout numerous studies, environmentally advantageous techniques and technologies have been shown to be more advantageous for manufacturers because of cost decrease with equal or improved levels of quality. These technologies include vibration or laser assisted machining, high pressure waterjet cooling, and variations of cutting parameters. With those alternative types of machining, surface quality can be increased, leading to more effective subsequent layers of protection, increased tool life, and more efficient machine performance resulting in lower energy expenditure.
When considering the issues that reduce the use of dry machining in standard operations, there are many technologies that are beneficial in closing the gap between dry and lubricated machining. These include various tool changes in geometry or coating and assisted machining such as vibration assisted machining and laser assisted machining which reduce tool contact and chip adhesion, ultimately resulting in reduced cutting forced, smaller chips, and improved surface finish and tool life [
17]. Surface integrity is defined as the “inherent or enhanced condition of a surface produced by machining processes or other surface generation operations”. Typical surface alterations that affect overall product quality include plastic deformation, micro-cracking, phase transformations, hardness variations, tears and laps, and residual stress distribution. These qualities can become unacceptable, as determined by the American National Standard for surface integrity [
18]. Surface roughness influences the effectiveness and quality of added coatings, decreasing protection against corrosion and resistance in the product, making good surface finish essential for quality measurements. The key parameters for surface quality and tool wear to consider are cutting speed, feed rate, and axial and radial cut depth. This study shows the radial cutting depth has the greatest influence on quality with higher machining performance with higher levels of radial sheer penetration [
19].
In a study specifically focused on milling, high pressure waterjet cooling techniques were shown to be much more advantageous than commonly used flood cooling, which is a costlier and less sustainable option. The high pressure waterjet injection method was shown to reduce cutting force and improve tool life, surface finish, and metal removal rate, making it a more efficient method of machining for cost, quality, and reduction of environmentally harmful materials [
7]. Operational efficiency is reduced when surface quality is degraded, which in turn decreases tool life and increases energy expenditure. Decreased surface quality of a finished part decreases market value, making manufacturing costs more significant and monetary gain lower [
20].
2.3. Environmental Impact and Time
A sizable amount of global energy consumption is due to machining operations. To make the manufacturing industry more sustainable it is essential to reduce energy consumption through reduction in machining time. Increasing machine tool efficiency can be achieved through new technologies and better planning of cutting parameters, especially feed rate, prior to the operation. Machining time is important to the efficiency and cost of manufacturing, meaning any alternatives to current operations must meet or exceed machine efficiency. Comparable rates were found in research done on multiple environmentally conscious technologies such as cold compressed air.
To reduce global energy consumption and make manufacturing a more sustainable industry by reducing energy-related environmental pollution, feature-sequencing can effectively cut down on machining time. This study examined the trade-offs between machining time, deviation, and energy consumption as calculated through feature sequencing. Because these are multi-objective problems, there are multiple approaches to an optimal solution, but all proposed solutions are beneficial because of large reductions in some if not all categories, creating a more efficient and environmentally friendly solution overall [
1]. Feed rate optimization is prioritized in researching machining efficiency because of its importance when trying to shorten machining time. Autonomous systems are becoming more used because of their ability to find optimal strategies and parameters efficiently, improving machining performance and cycle time and reducing planning time. Because machining operations such as milling are flexible, parameters can be highly specified to best fit the workpiece making it important to be able to know the optimal values for each new process quickly [
3]. Mathematical models are more favorable than the currently and commonly used method of trial and error, past experience of the process planners, and machining handbooks. They reduce time spent on the planning needed to find optimal machining parameters. A mathematical model developed for surface roughness prediction used Particle Swarm Optimization and was found very useful in optimizing machining and reducing time spent on planning [
21].
New lubrication/cooling systems include dry machining, minimum quantity lubrication, cryogenic refrigeration, solid lubricants, and gaseous refrigeration. Cold compressed air, a form of gaseous refrigeration, uses air, water vapor, carbon dioxide, oxygen, or nitrogen to reduce heat through adiabatic expansion or cooling the air with a vortex tube. This addition to traditional dry machining significantly reduces heat generation because of air’s convection coefficient, but because the specific heat of water is about four times the specific heat of air the heat removal capabilities of cold compressed air system is still slightly less when compared to cooling by flood. However, the system can extend the life of the cutting tool, has a high environmental efficiency, reduces costs, and improves surface roughness values. When testing the cooling system on specific materials, all showed the process to be a good alternative to traditional techniques for high-speed machining [
22].
2.4. Environmental Impacts and Cutting Conditions
Milling parameters cannot be static across processes as they will create long and inefficient machining times; each new workpiece demands adjustments to reach optimal efficiency to reduce tool chatter and breakage and energy and material consumption. These reductions can lead to significant machining cost savings and environmental conservation. Manufacturers find the optimal parameters for each workpiece, such as cutting force which can be determined through MRR values, factoring in cutting time, segmental length, and feedrate. Torque can be found through another equation with cutting speed values. Reduction in material waste can also be increased through technologies such as dry machining. Machining without fluid, though environmentally and cost-wise beneficial, limits the machine to lower cutting speeds which reduces process rate. Finding a balance between efficiency and fluid amount is essential.
Cutting parameters need to be adjusted based on the workpiece and material. If optimal parameters are not used the tools will frequently chatter and break, and the force of the machine will be quite different because of radial cuts and chip thickness. Consistent, unchanging feedrates are also not optimal, as they lead to inefficient and long machining times. Through optimal settings energy consumption and waste can be reduced, leading to monetary and environmental benefits. Multiple equations, commonly included in optimization programs, are used to find the optimal cutting settings. Cutting force can be determined through MRR values, factoring in cutting time, segmental length, and feedrate [
3].
Because of high costs associated with the purchase and disposal of cutting fluids, and the environmental impact of fluid waste, dry or near dry machining is a very attractive alternative technique. A study showed that 7–17% of total manufacturing costs were linked to cutting fluids, while tool costs only made up 2–4% of total costs. Machining with no fluids limit machining to lower cutting speeds, reducing production rate. Finding a balance between efficiency and fluid amount is a cost-effective way to maintain quality and efficiency while reducing negative environmental impacts and fluid costs. Process cost can be found with the machine cost rate, the tooling cost per cutting edge, the process cutting time, the process auxiliary time, the tool change time, the tool durability time, the cutting length of the workpiece, the diameter of the workpiece, and the machining allowance. The total amount of cutting fluid is calculated as both reusable cutting fluid consumption and non-reusable cutting fluid consumption. The workpiece characteristics have a great deal of impact of the amount of cutting fluid used and the technical settings needed for the most efficient manufacturing [
4].
The Taguchi method, combined with the grey rational analysis to make the grey-Taguchi method, has been used to optimize milling process parameters. The goal of this method is to reduce flank wear, effectively increasing tool life and reducing manufacturing waste, and reducing surface roughness. Variable parameters included coating type of the tool used, helix angle, primary relief angle, cutter diameter depth of cutting, width of cutting, feed rate, and spindle speed. This study found the most significant changes to the flank wear were dependent on the cutter diameter (40.8% contribution), coating type (18.4%), helix angle (10.3%), primary relief angle (9.5%), depth of cutting (6.5%), and width of cutting (6.3%). When considering surface roughness, the feed rate had the largest impact (41.5%) followed by cutting diameter (28.2%) and so on [
23].
2.5. Environmental Impact and Human Components
Collectives must make decisions that affect the environment constantly, so analyzing what factors tie into the human decision-making process is important in understanding what changes are necessary to sway decisions pro-environment. These factors include social value orientations, situational variables, and psychological variables, all of which influence the decision making of individuals and collectives and affect the gap between individual values and actions taken. Perceptions and awareness are major components of changes in behavior towards eco-friendly actions. Technologies and decisions must minimize losses of quality, price, and convenience for those making the decisions to be viable.
Human decisions and activities, from individual consumers choosing lightbulbs to complex multistakeholder decisions about land use, have significant impacts on the environment. A decision is defined as pro-environment by the extent that it “positively impacts the availability of materials or energy from the environment or alters the structure and dynamics of the ecosystems or the biosphere.” When approaching a decision, manufacturers may use a decision-analytic framework, which divides the world into acts (the options to decide between), states (the possible ways the world might be altered as a result), and outcomes (the consequences of each act given to each state). Environmental impact can only be reduced, and positive actions can only be enacted by assessing factors that lead to individual and collective understanding of environmental problems and commitment to mitigating the issues. These can include psychological predispositions including personal values, ideologies, and prior experiences, and environmental values (especially biospheric values concerned with the welfare of the environment). Pro-environmental decisions often involve personal sacrifice such as increased cost, effort, and inconvenience, so these psychological factors that increase an individual or collective recognition that there is long-term collective good that is valued by those concerned [
24].
Psychology is an important field of study when considering people’s attitude and actions towards environmental issues such as climate change. Individual’s perceptions of global warming risks are highly influential, as stress, anxiety, apathy, or guilt can all impact or encourage responses to environmental issues resulting in behavior changes. When there is lack of information, or lack of evidence of risk or benefit of change, people become fixed in existing patterns and decisions. Lack of knowledge of how decisions will impact the environment can cause people to believe their actions are not damaging when they are, that their actions have less weight than they do, or that the problem and solutions lie outside of human control [
25]. A study linked worker’s safety perceptions to quality outcomes using the psychological term cognitive dissonance. Efficiently run management systems rely on employees that are able to work well on teams, recognize problems as they come about, and strive for continuous improvement. In order for employees to work at their highest potential they must be motivated, which safety measure have been shown to promote or decrease. In this way, ensuring the safety of workers has a significantly beneficial effect on production efficiency and quality [
26].
In the past, academics have researched assessing and minimizing environmental impact and investigated the relationships between manufacturing factors such as time, cost, quality, and technical settings. However, there is a gap in the research of this topic in terms of understanding how environmentally conscious actions create feedback, affecting the other manufacturing factors in machining processes [
8]. This missing knowledge is essential to the research community and the manufacturing industry; without the information designers lack the means to understand the problems holistically, resulting in an incomplete view of environmental practices and machining process control [
27,
28]. Negative consequences of this lack of knowledge include design inefficiency, unnecessary manufacturing expenditure, and detrimental environmental impacts. Therefore, the objective of this study is to develop a dynamic modeling method to map the interconnections within a machining operation and use the dynamic model to understand the feedbacks among key factors for sustainability improvement.
3. Methodology
Systems dynamics models are simulation models that use data inputs to create hypothesized relationships between multiple variables. It was developed by Jay Forrester in the mid-1950s. [
29]. The goal of systems dynamic modeling is to aid in making informed decisions when analyzing complex, dynamic systems. It can be applied to social, managerial, economic, ecological, and physiological systems [
30]. It was designed to examine feedbacks of a system, using information in forms of stocks and flows (accumulations), time delays, feedbacks, and non-linear relationships between variables [
31].
In the model, all variables relevant to the scope of the problem are identified then connected through a network of relationships that capture the feedback complexity of the system. The mathematical relationships are made explicit, the model is simulated, output is compared to historical data, and different policies are tested. The purpose of this is to generate knowledge and insights on various policies.
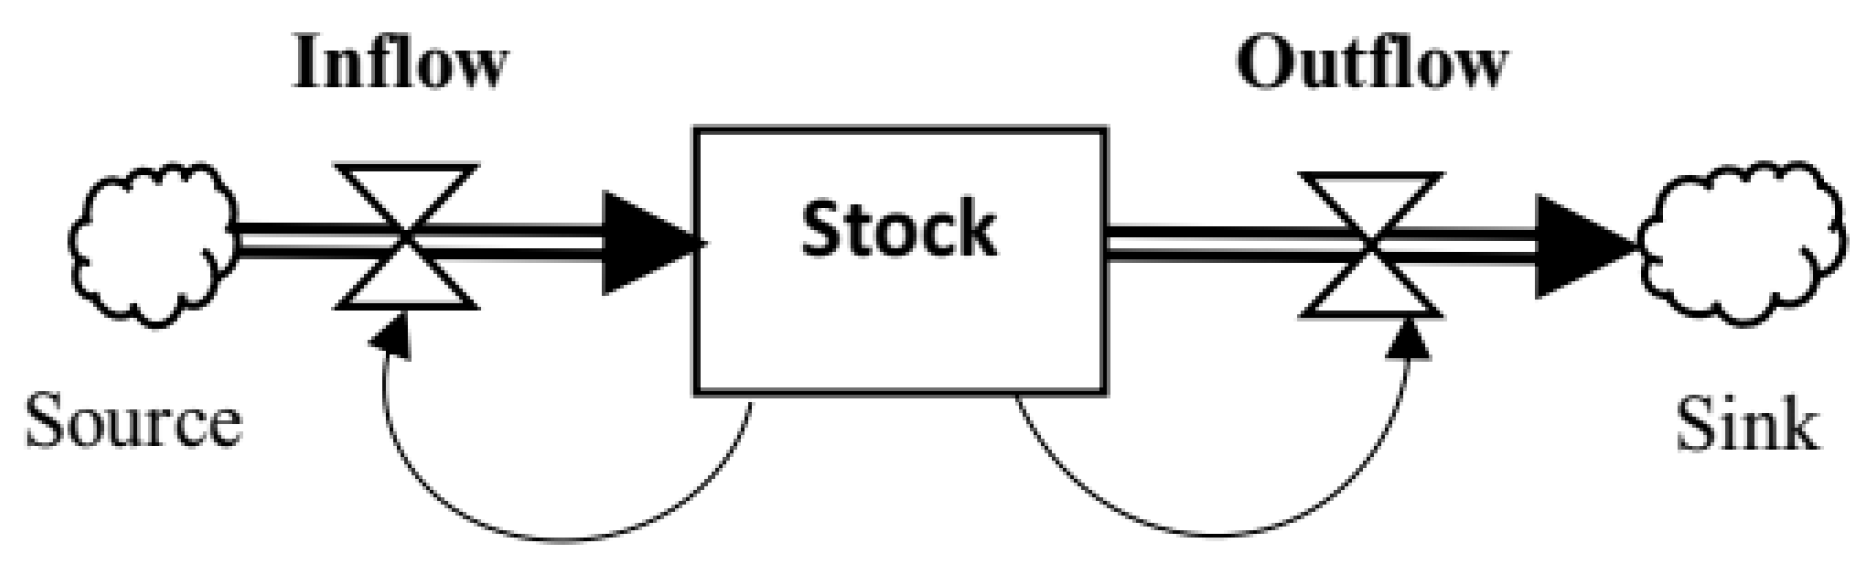
As shown in
Figure 1 the basic elements of a diagram show how information flows through a stock. It has an inflow where data enters the system, and an outflow where the data exits the system, each function as rates (data over time). The stock accumulates data if the inflow is larger than the outflow. This is often compared to a bathtub, where a facet rate and drain rate control how much water is in the bathtub at any time. Additional variables not part of the stock and flow structure may affect the rate of inflow and outflow instantaneously. Through these computer programs, modelers are able to represent and see the behaviors of the model overtime, and better understand the complexity of the system.
The mathematical formula for a basic stock and flow action is shown in Equation (1) below, where the left side of the equation is the accumulation in the stock,
F(
a) is the inflow, and
F(
b) is the outflow.
The stock and flow diagram created through this project quantified and analyzed the linkages and associated behaviors of various manufacturing factors as they pertain to the environmental impact of machining. These key variables included cost, quality, environmental impacts, and tool life.
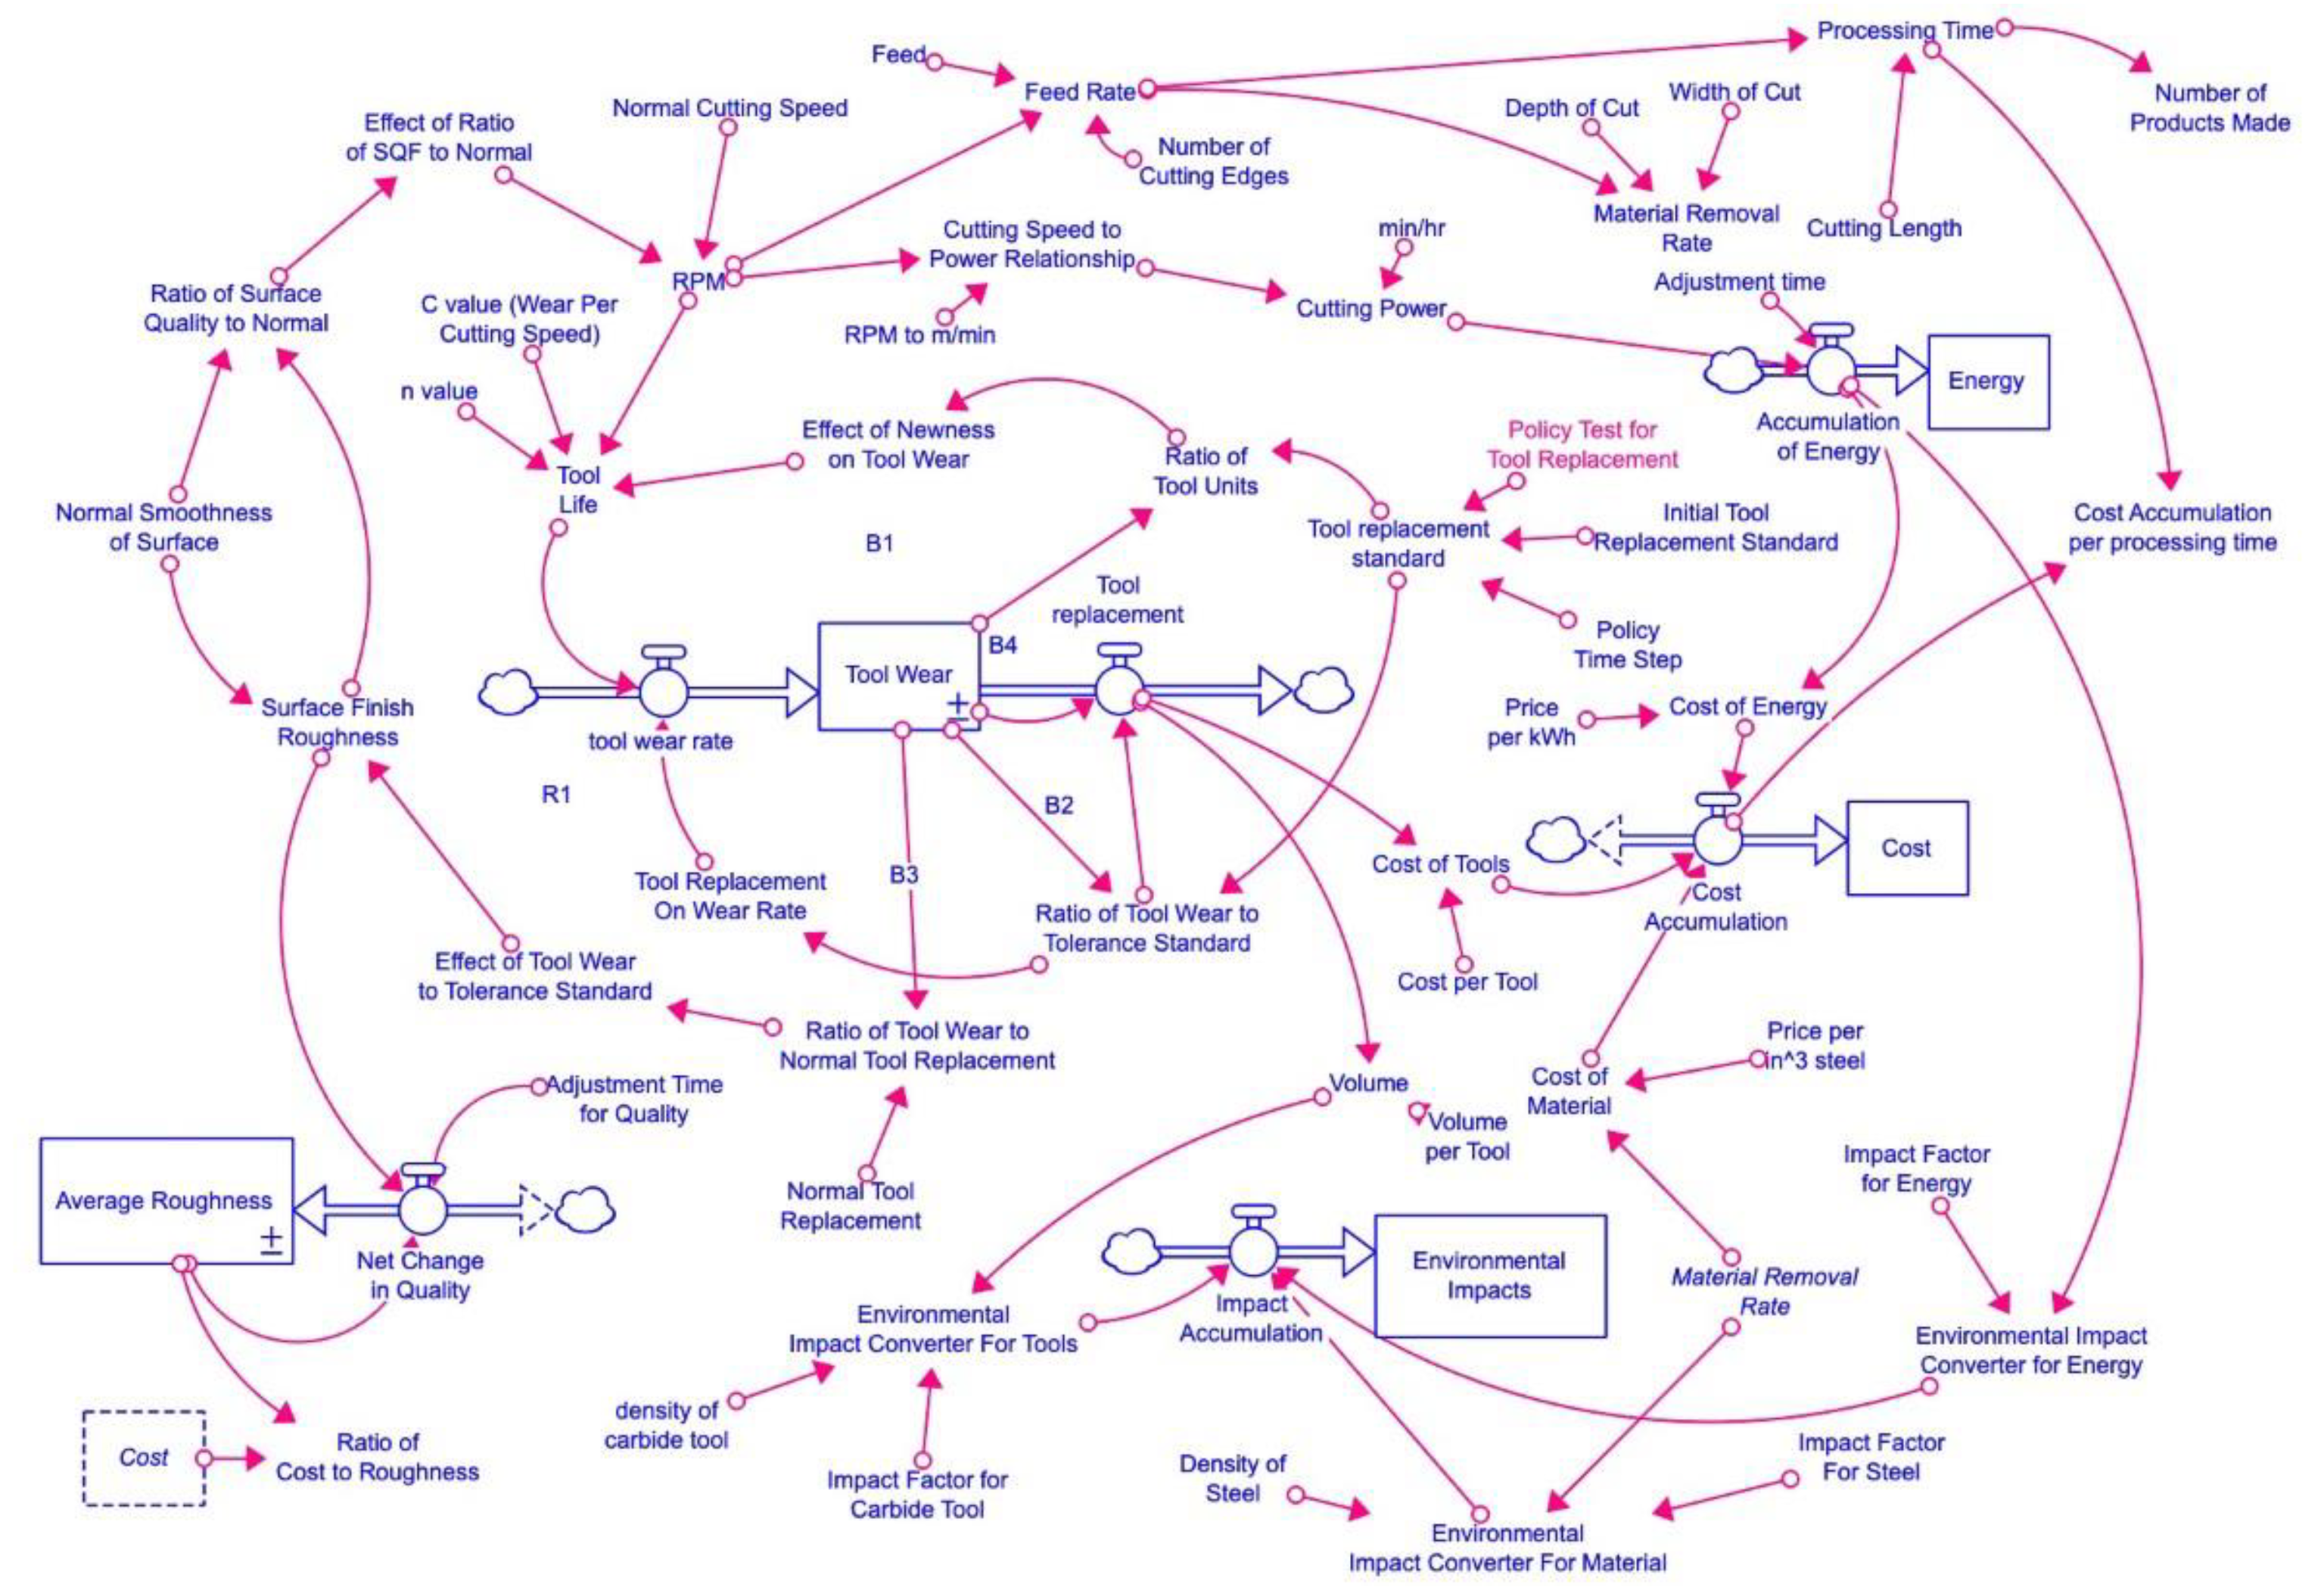
The overall system is shown in
Figure 2, in the following sections the important behaviors will be highlighted and further explained and analyzed. Details of variable definitions and mathematical equations in the model can be found in the
Supplementary Materials document.
3.1. Tool Wear and Surface Quality
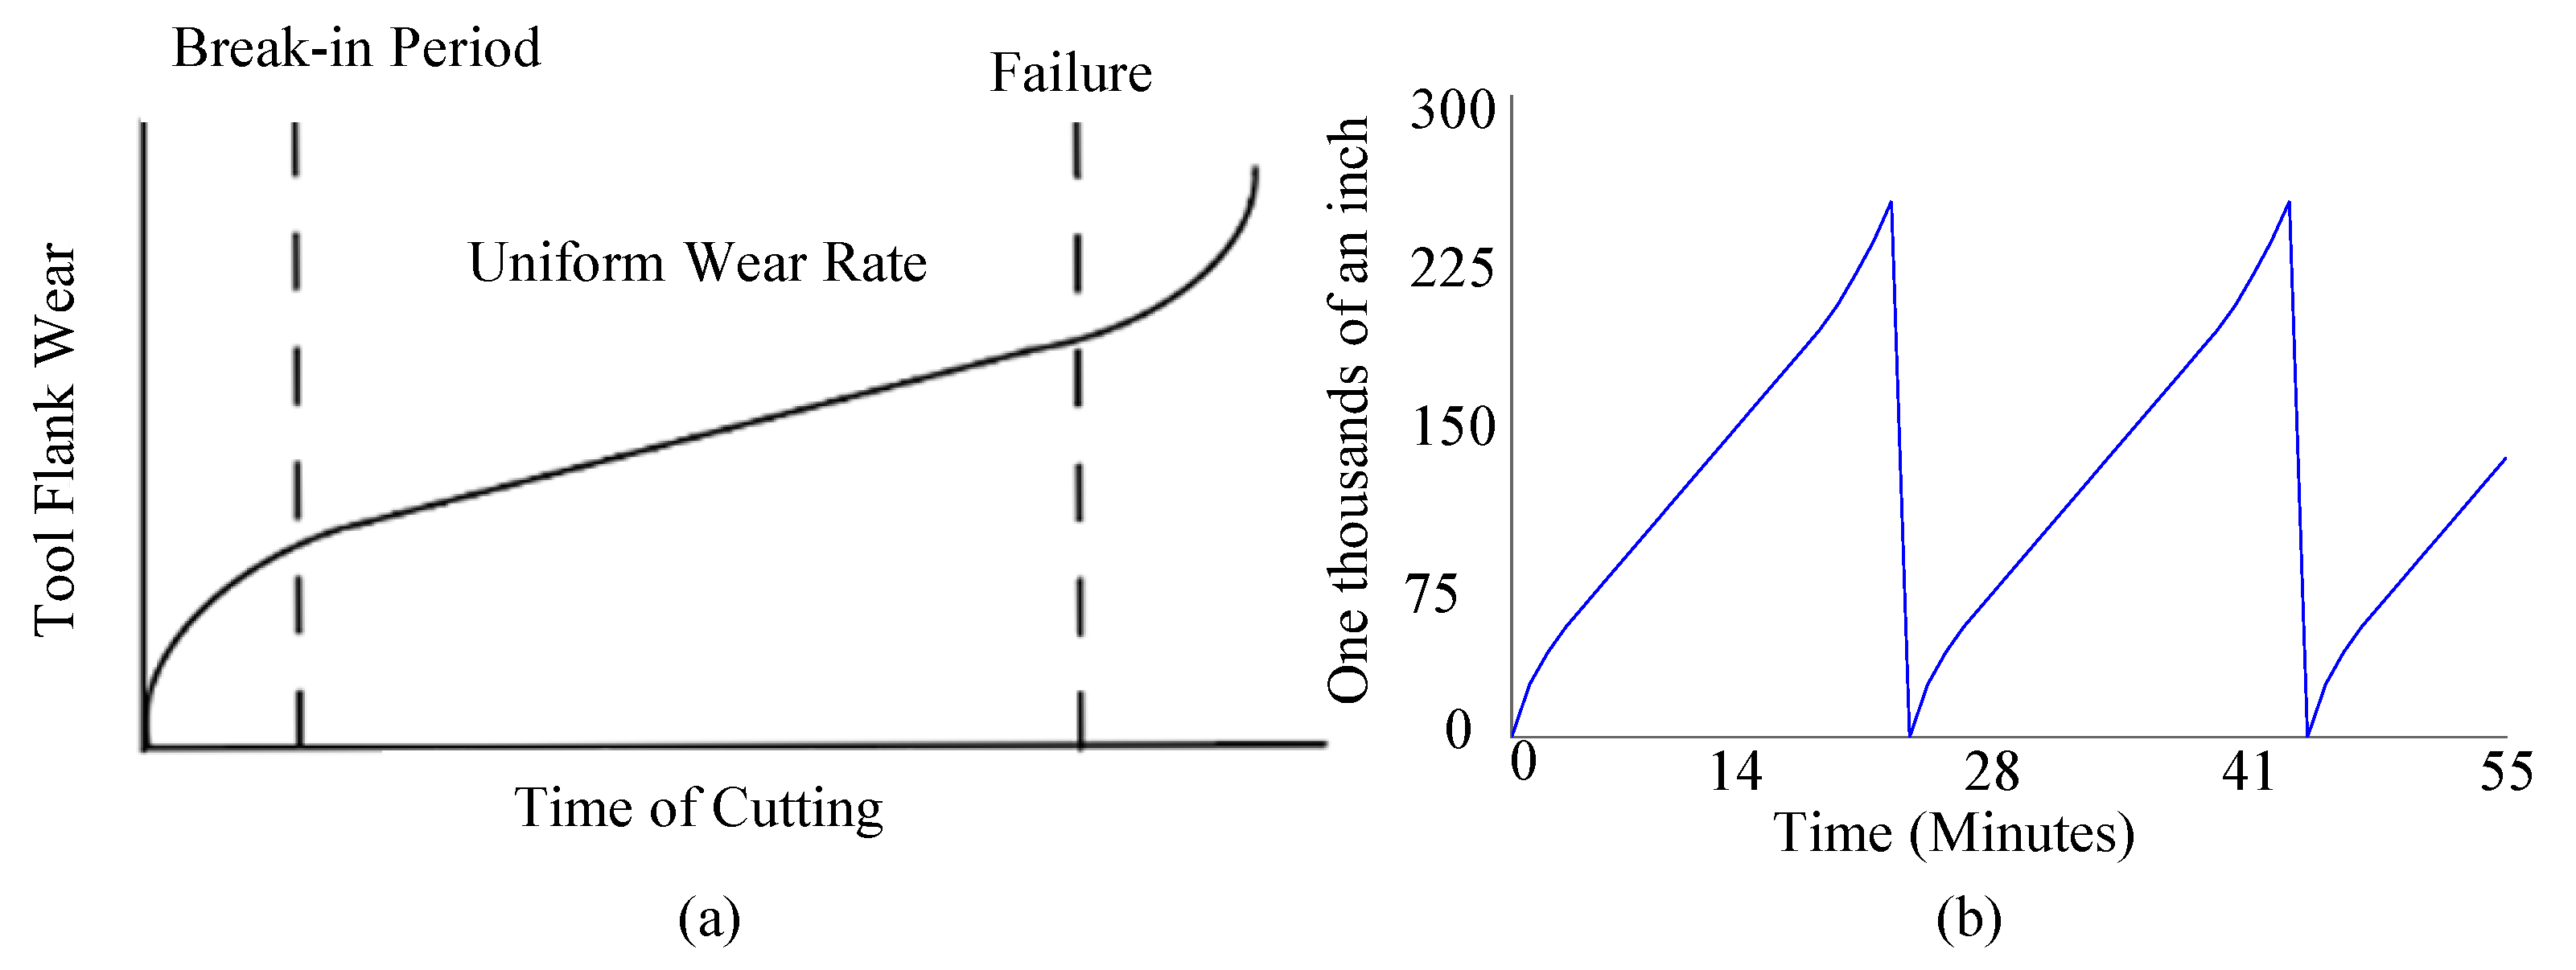
Tool wear is modeled through the inclusion of multiple auxiliary variables, and the use of logic statements in the equation of the flow rates. This was done to mimic the typical behavior of tool wear in a standard tool, shown in Taylor’s tool life equation [
32] in Equation (2) below, while the behavior is shown in
Figure 3a and the generated behavior is shown in
Figure 3b which is based on a Tungsten Carbide cutter machining 1045 Steel.
where
V is the cutting speed,
T is the tool life,
n is the slope of the relationship plot between cutting speed and tool life and it depends on the tool material, and
C is the intercept on the speed axis at one-minute tool life.
The similarity between the curve generated and the anticipated curve gives confidence and validity to the model’s functionality and accuracy.
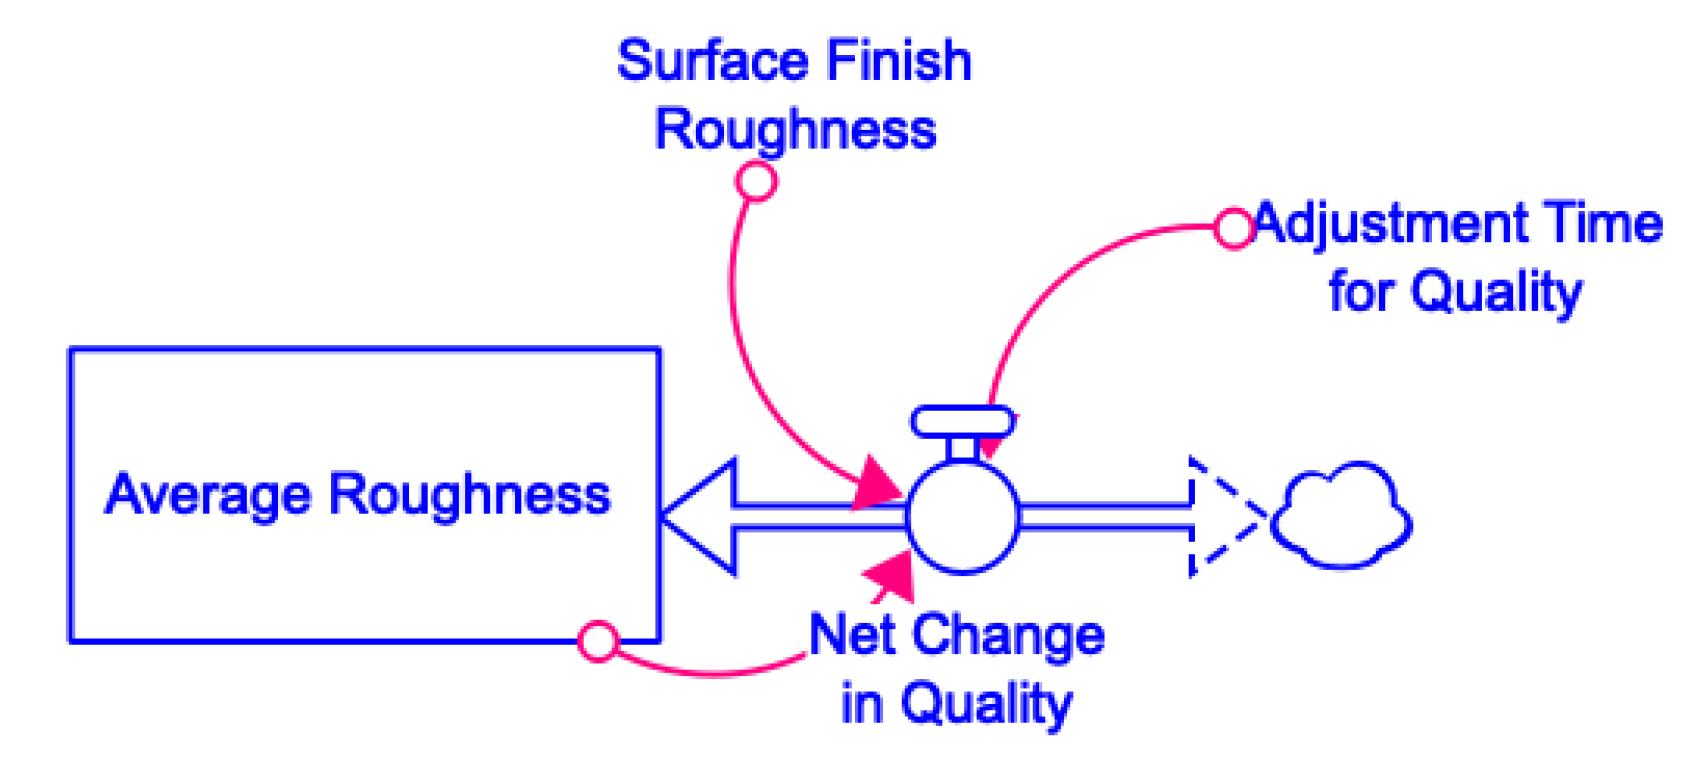
The quality of the product, measured through the surface roughness, is measured through the comparison of the normal smoothness of the surface occurring at the start of the use of a new tool, to the effect of the tool wear determined by the time of the system run. The stock and flow diagram of this relationship is shown in
Figure 4. This relationship is shown in Equation (3) below.
This equation can be defined as Average Roughness (), Surface Roughness (), and Adjustment time (). Average Roughness is the current roughness of the tool in operation, determined by Surface Roughness that is determined by an integral of the Normal Smoothness, which is a set optimal starting smoothness of a new tool and the Effect of Tool Wear, which is the current wear of the tool in operation determined the length of use at that moment and the speed at which it is being used, compared to the current Average Roughness at that moment. The Adjustment Time is the time it takes for the system to recognize changes in quality.
The Average Roughness stock is a weighted average [
29] intended to show a smoothed curve, giving more weight to the most recent information to inform action.
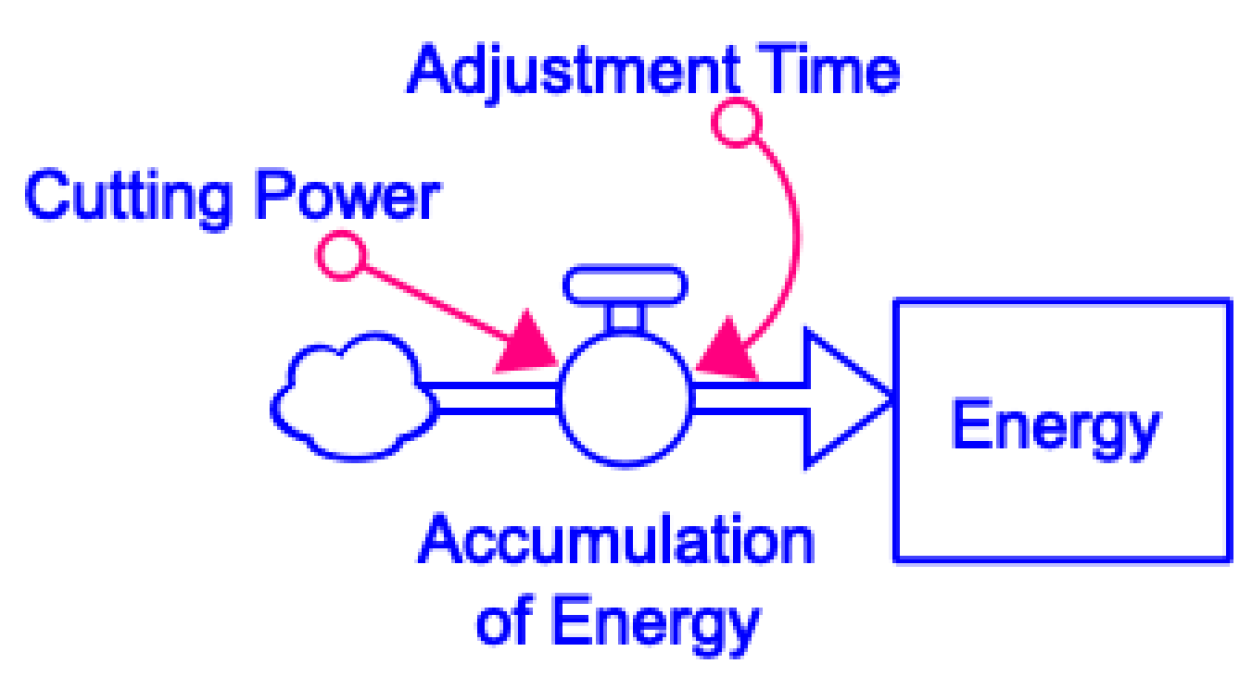
3.2. Energy
The energy of the system accumulated in a stock, determined using linear equation that translates the cutting speed, in rotations per minute, to energy expenditure. The stock and flow diagram is shown in
Figure 5. This input relationship is shown in Equation (4) below.
This equation is defined by Energy (E), Cutting Energy (), and Adjustment Time (). Accumulation of energy is the input into the energy stock, which instantaneously accumulates that value over time. Cutting Energy is a value determined by cutting power calculated based on depth of cut, feed per revolution, cutting speed, specific cutting force, and machine coefficient. Adjustment time allows for the conversion of minutes per hour to minutes to match the units of the system running time.
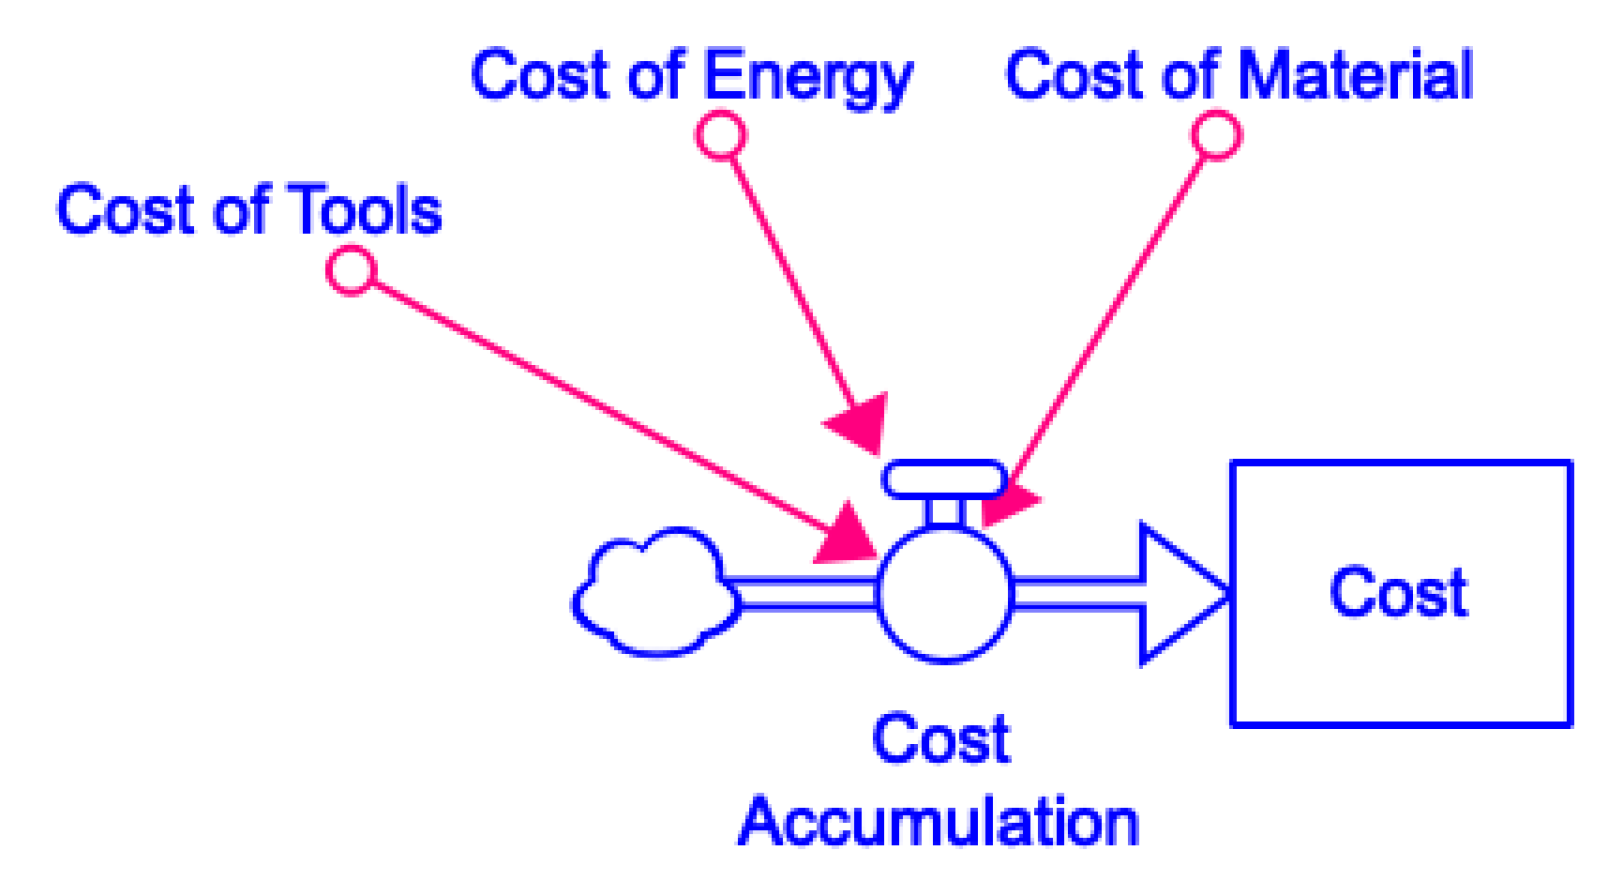
3.3. Cost
The Cost of the production is calculated as a sum of the following cost variables. The Cost of Tools, generated by keeping a count of the amount of times the tool replacement flow out of the tool wear stock goes to one, signifying the replacement of a tool, then this count is multiplied by the average price of a carbide tool. The Cost of Energy is calculated from the accumulation of energy flow into the energy stock, multiplied by the cost of industrial energy in Virginia. The last variable, the Cost of Material, is calculated from the material removal rate, found through the multiplication of current feedrate, depth of cut, and width of cut. As this study focuses solely on the cutting behavior, labor cost for setup is not included in the model. The stock and flow diagram is shown in
Figure 6. This relationship is shown in Equation (5) below.
This equation is defined by the following terms: Total Cost (), Cost of Tools (), Cost of Energy (), and Cost of Material (). The Total Cost of the production is found through an integral of a sum of the following costs: Cost of Tools is the amount of tools used in the system multiplied by the price of a tool, the Cost of Energy is the current energy usage multiplied by the price per kilowatt hour, and the Cost of Material is the material removal rate multiplied by the price per cubic inch of steel, added to the current Total Cost of the system.
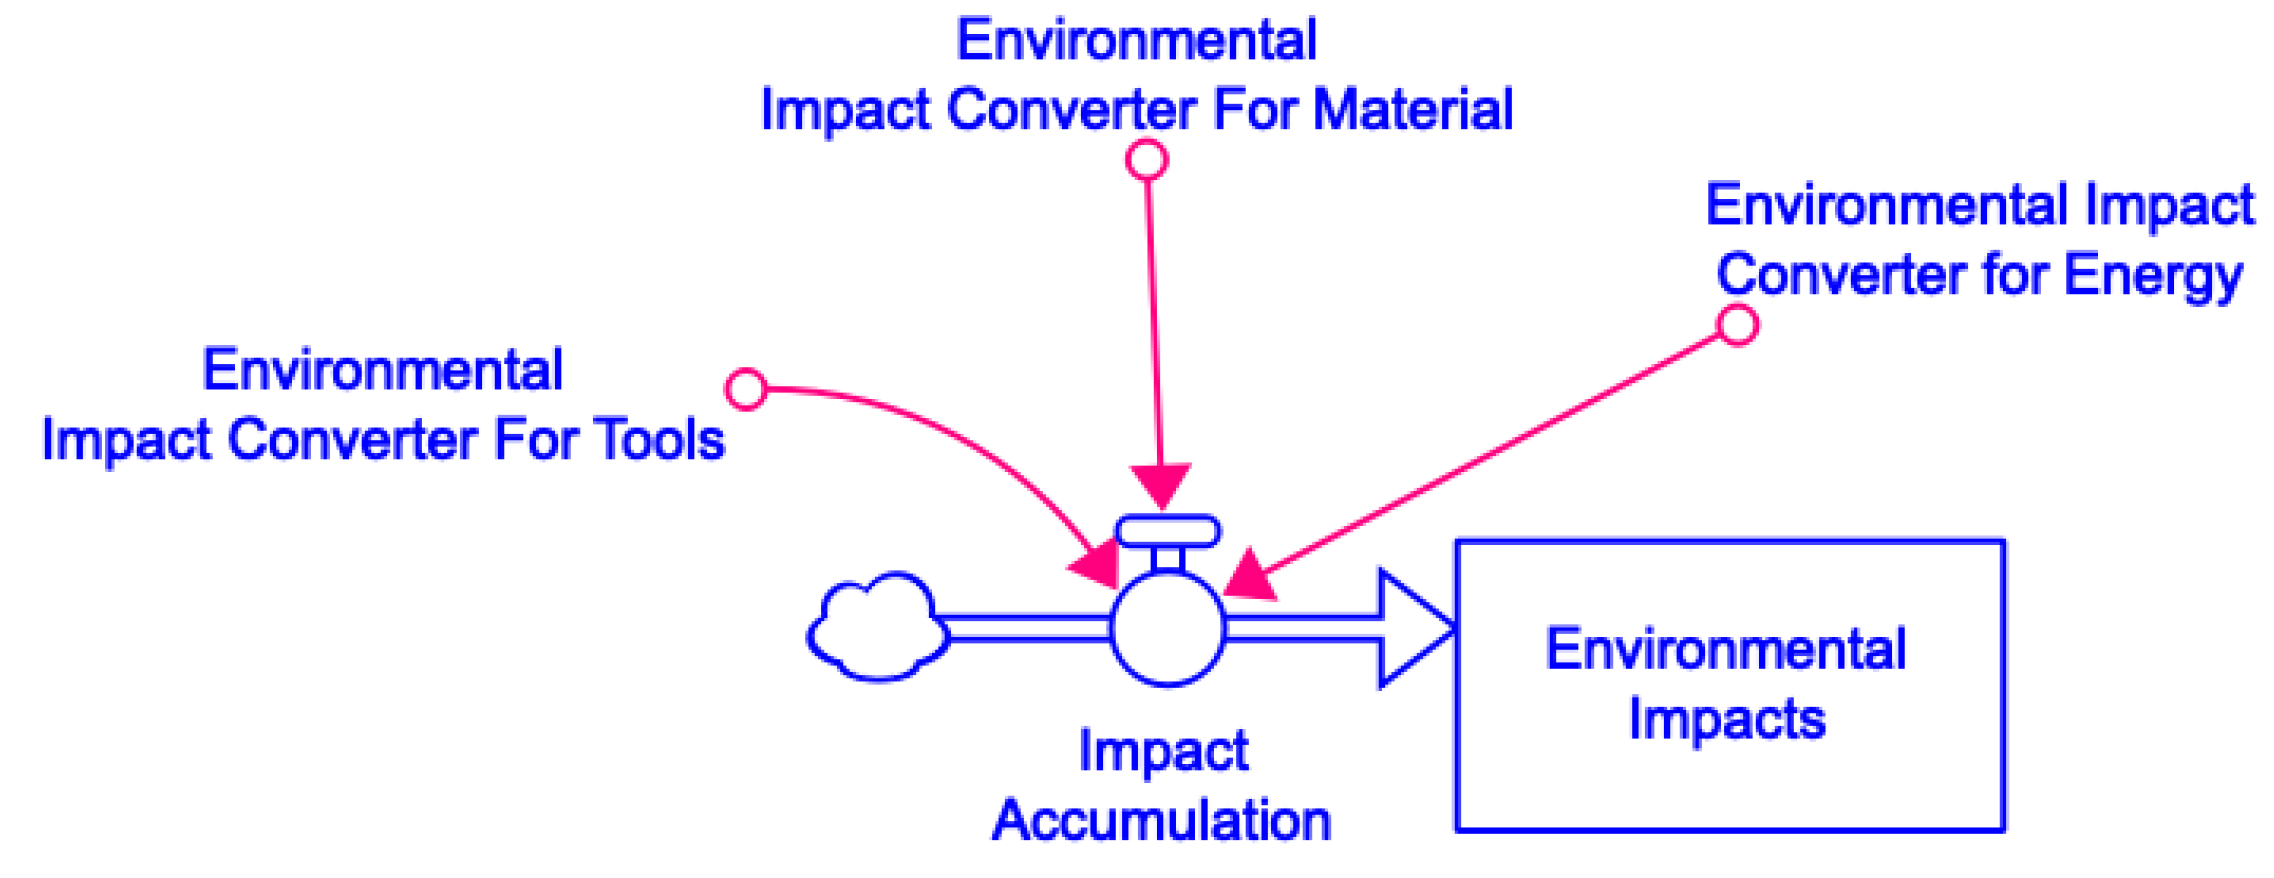
3.4. Environmental Impacts
The Environmental Impact is a sum of multiple impact variables. The Impact of Tools is found by the impact factor of tungsten carbide tool, multiplied by amount by density as found from the volume of tools used. The Impact of Material is found by the amount of material used multiplied by the impact factor for steel by the density. Finally, the Impact of Energy is from the energy accumulation flow, multiplied by the impact factor determined by the Environmental Protection Agency. The stock and flow for this system is shown in
Figure 7. The relationship for this behavior is shown in Equation (6) below.
This equation is defined by the following variables: Environmental Impact (), Environmental Impact Convertor for Tools (), Environmental Impact Convertor for Energy (), and Environmental Impact Convertor for Material (). The Environmental Impact of the system is determined by an integral of the sum of the following convertors: The Environmental Impact Convertor for Tools is found by the density of the carbide tool multiplied by the volume of tools used, multiplied by the impact factor for carbide tools. The Environmental Impact Convertor for Energy is found from the input of the accumulation of energy multiplied by the impact factor for energy. The Environmental Impact Convertor for Material is found by multiplying the material removal rate of the system by the density of steel, by the impact factor for steel. This sum is added to the current Environmental Impact of the system.
4. Simulation and Scenario Analysis
The developed model needs to be validated through both structure test and behavior pattern test [
33]. The structure confirmation test assesses the validity of a model’s structure. It can be carried out by comparing the equations and their form to existing relationships in the system modeled and to system information reported in the literature [
32,
33]. The sensitivity test (scenario analysis), a structure-oriented behavior testing method, indirectly assesses model structure validity [
34,
35]. Highly sensitive parameters in the system model are determined and investigated to ascertain whether the real system would exhibit similar sensitivity. In this section, three scenarios are tested, different workpiece materials, different surface roughness standards, and different cutting feeds.
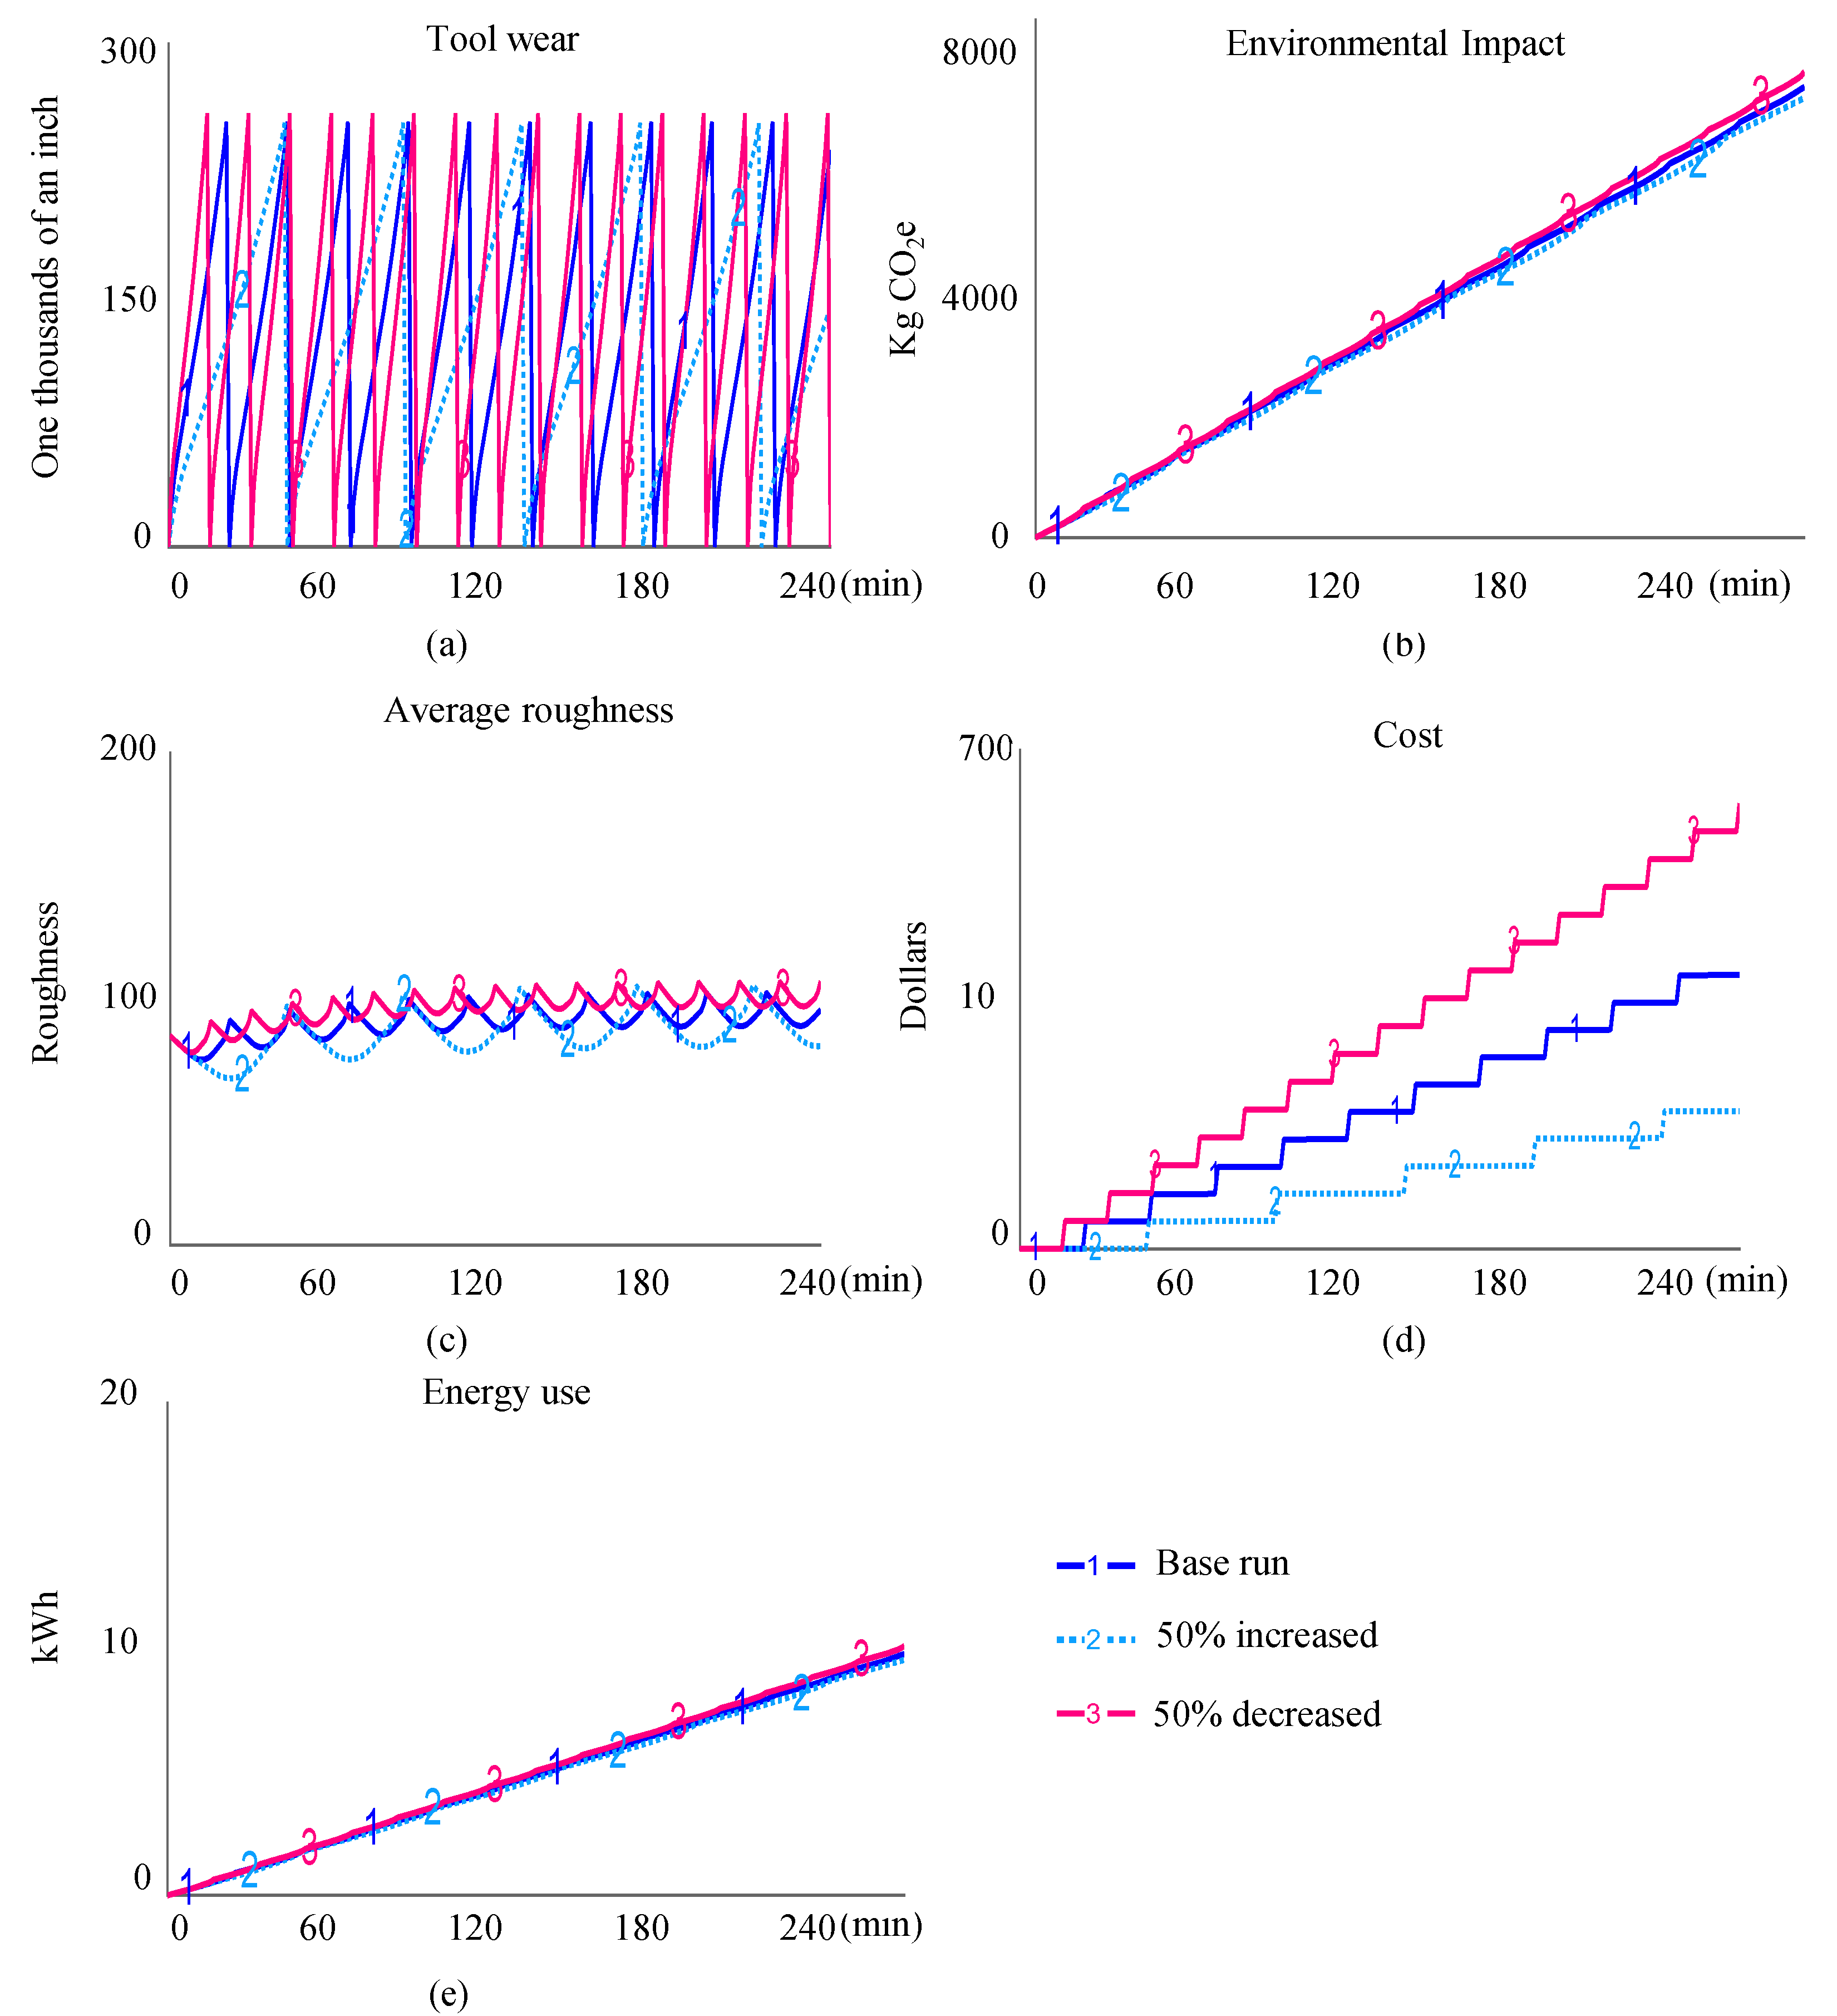
4.1. Scenario 1: Changing Cutting Material
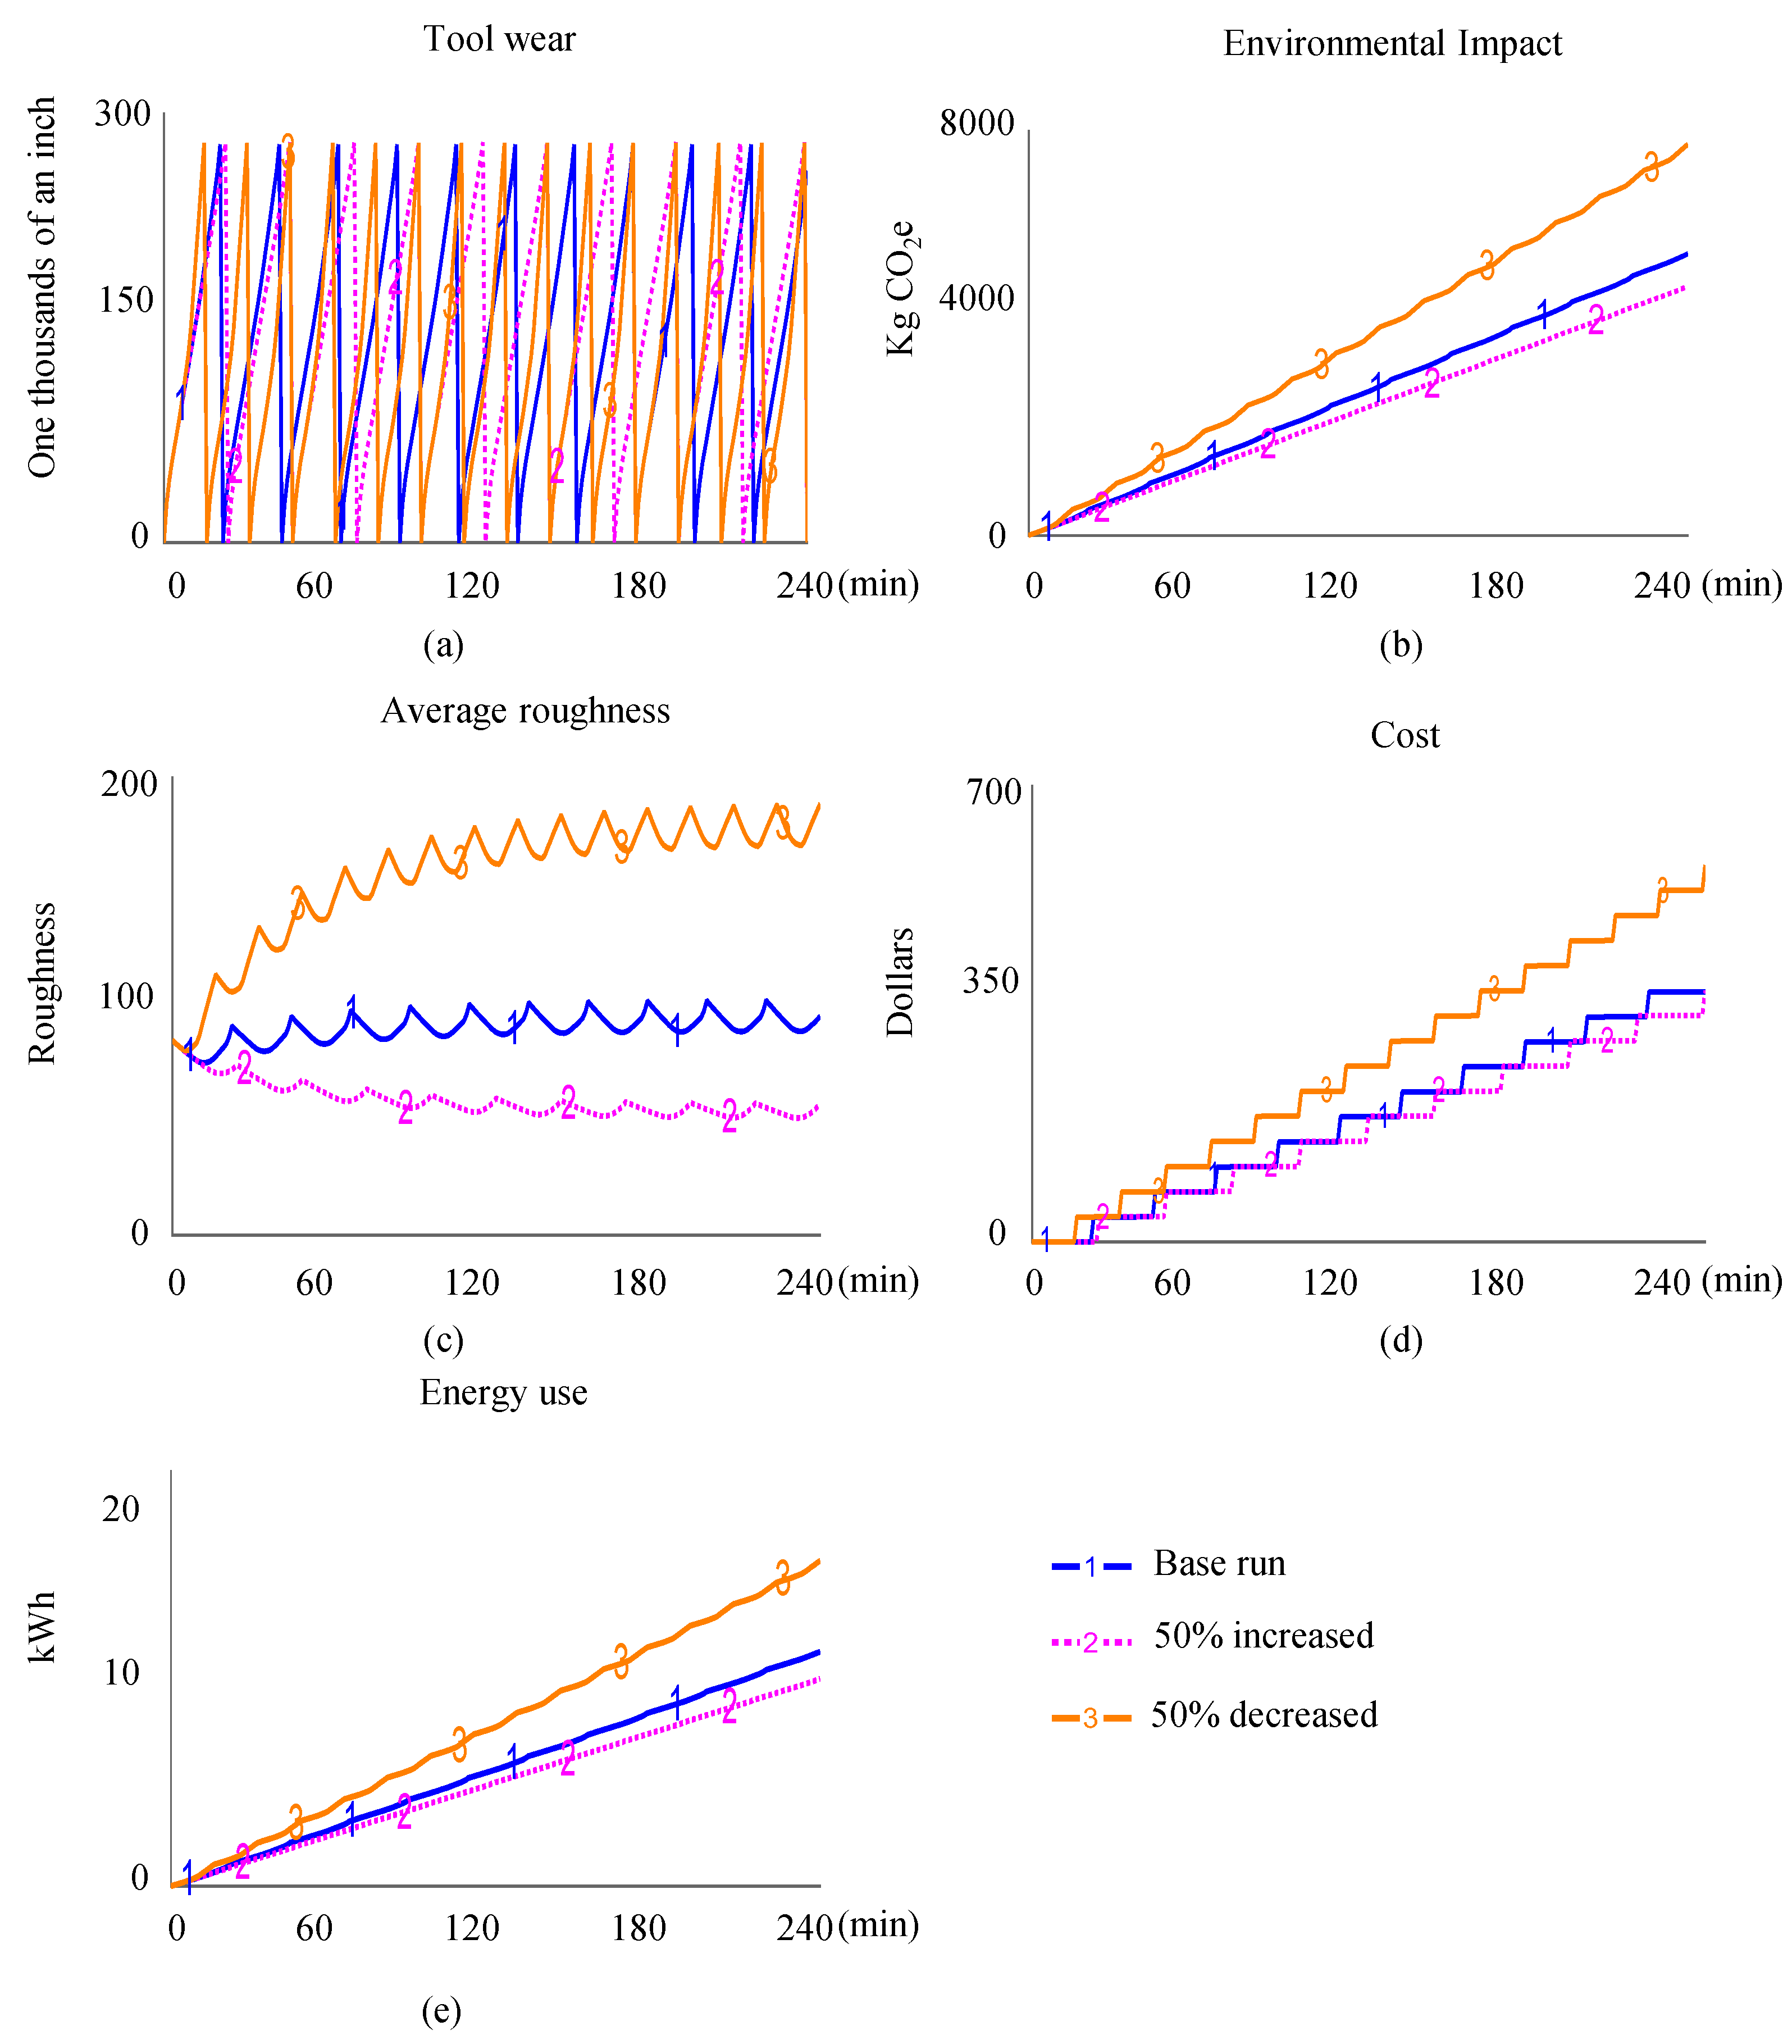
In this scenario, the C-value, a constant given based on machinability of material being cut, was changed by a 50% increase and a 50% decrease to see how the system reacts to different materials being milled. The model ran for 240 min. The model self-regulates the cutting speed changes, influencing cost and energy expenditures, as it recognizes the speed at which the tool is being worn. The base run C-value is 0.0033, 50% increase is 0.00495, and 50% decrease is 0.00165.
In
Figure 8a shown above, the tool wear for the base run, 50% increase in C-value, and 50% decrease in C-value are shown. The base run tool is replaced 10 times, with a high of 254 one thousandths of an inch wear to the tool. The increase scenario tool was replaced 16 times, with a high of 259 one thousandths of an inch wear to the tool. The decrease scenario tool was replaced 5 times, with a high of 253 one thousandths of an inch wear to the tool. This indicates the expected result; the harder it is to machine a material, the more quickly the tool with wear out, resulting in shorter tool life spans.
In
Figure 8b the environmental impacts of the various scenarios are shown. The base run final impact is 69,700 kg CO
2e, the 50% increase value is 72,000 kg CO
2e, and the 50% decrease value is 68,000 kg CO
2e. The trend is that the most difficult material to machine creates the most environmental impact.
In
Figure 8c the roughness of all scenarios is shown comparatively. The base run end value is 95.5 units roughness, the increase scenario end value is 107 units roughness, and the decrease scenario end value is 80.8 units roughness. There is a higher variability in the quality of product surface with less frequent tool replacements, seen in less difficult machining (lower c-value). Because the tool is replaced at a slower rate, the tool is working a longer time than other more frequently replaced tools. This results in a wider range of average produced roughness.
In
Figure 8d the accumulation of cost for each scenario is represented. The base run total is 385 dollars, the increase run total is 625 dollars, and the decrease run total is 194 dollars. This is due to the cost of energy and tools, but primarily it is due to the rate at which the machine goes through material. The cost of new material represents the speed at which products are being made. Therefore, if the system were to include an inflow of cost gained from products being sold, the cost might be closer together.
In
Figure 8e the comparative energy used in each scenario is shown. The base run energy use is 9.81 kWh, the increase scenario value is 10.1 kWh, and the decrease scenario value is 9.57 kWh. These values are so close because the system is self-regulating and speeds up when tool wear is high. The energy usage is higher the harder it is to machine the tool because the speed increases at the end of the tool’s life to increase quality of product. The harder it is to machine the material the quicker the tool generates wear, explaining this relationship.
This scenario testing shows that the higher the C-value, meaning the higher the difficulty to machine the material, the higher the cost and tool replacement rate by a significant ratio. These conclusions align with expected results and confirm the model represents this component accurately.
4.2. Scenario 2: Changing Tool Replacement Standard
In this scenario, the tool replacement standard is altered. The tool replacement standard determines the maximum amount of wear the tool is allowed to have before it is necessary to swap in a new cutting tool. Therefore, the higher the standard value the looser the requirement for roughness, or the lower the standard value the stricter the quality requirement. The base run standard is 250 one thousandths of an inch, the standard is changed by a 50% increase resulting in 375 one thousandths of an inch, and a 50% decrease resulting in 125 one thousandths of an inch.
In
Figure 9a the comparative tool wear for each scenario is shown. This graph shows how much more frequently the tool is replaced when the standard is stricter, 17 times, and how much less frequently it is replaced when the standard is looser, 9 times, compared to the base run replacement rate of 10, almost 11 times in the 240 min period. The highest amount of tool wear for each run is 254 one thousandths of an inch wear during the base run, 393 one thousandths of an inch wear during the increased scenario, and 134 one thousandths of an inch wear during the decreased scenario.
In
Figure 9b the accumulated environmental impacts are shown for all scenarios. The base run total is 69,700 kg CO
2e, the 50% increase total is 84,500 kg CO
2e, and the 50% decrease is 60,900 kg CO
2e. The simulation result shows that the looser the standard the higher the environmental impact, because when it is close to the end of the tool life the cutting parameter needs to be compensated to reach the same cutting dimension thus requires higher energy use. The cutters will be recycled after they are replaced.
In
Figure 9c the roughness of each scenario is shown. The base run end value is 95.5 units roughness, the 50% increase end value is 156 units roughness, and the 50% decrease is 40.1 units roughness. The strictest standard has the lowest roughness, and the looser standard allows the roughness to get the highest. The quality is smoothest, therefore least variable, in the decreased scenario. This is because of the graphical function of tool wear over time, as shown in Taylor’s Equation. Strict standard does not allow the tool wear to reach the final sharp increase, replacing the tool first, resulting in a smaller range of tool wear. All average roughness values eventually reach an equilibrium over long cutting period.
In
Figure 9d the cost of the scenarios is shown. The loosest standard has the highest cost at a total of 513 dollars per unit product, the base run has the lowest cost total at 385 dollars, and the strictest standard has a total cost of 362 dollars. The reason the stricter standard is not the highest cost, as would be expected, is because the tool never reaches the point in the process where cutting speed needs to increase to maintain quality of product while the tool reaches high amounts of wear. The cost of energy remains low in each cycle before tool replacement. Therefore, despite the increased cost of tools with more frequent replacements, it is least cost efficient to let the tools wear out completely. Therefore, it is not best to let the tools sustain large amounts of wear, nor is it best to reduce the limit of tool wear to be very low. The base run had the lowest cost, showing there is a balance to be found regarding the limit of tool wear’s effect on cost; it is not a linear relationship.
In
Figure 9e the energy use is shown for each scenario. The highest energy use run is the loose standard with a total of 11.9 kWh. The base run has a total of 9.81 kWh, and the strictest standard has the lowest energy use at 8.58 kWh. As discussed above, the energy is highest when the tool reaches higher wear, so the decreased standard being the lowest amount of energy usage follows the results above.
From these scenarios it can be concluded that the looser the tool replacement standard, shown through an increase in standard, the higher the environmental impacts, energy consumption, and the higher roughness (meaning the quality of product is lower). The cost is not a linear relationship and is lowest during the base run. The quality of the product is best and most consistent when the tool is replaced more frequently due to the stricter standard.
4.3. Scenario 3: Changing the Feed
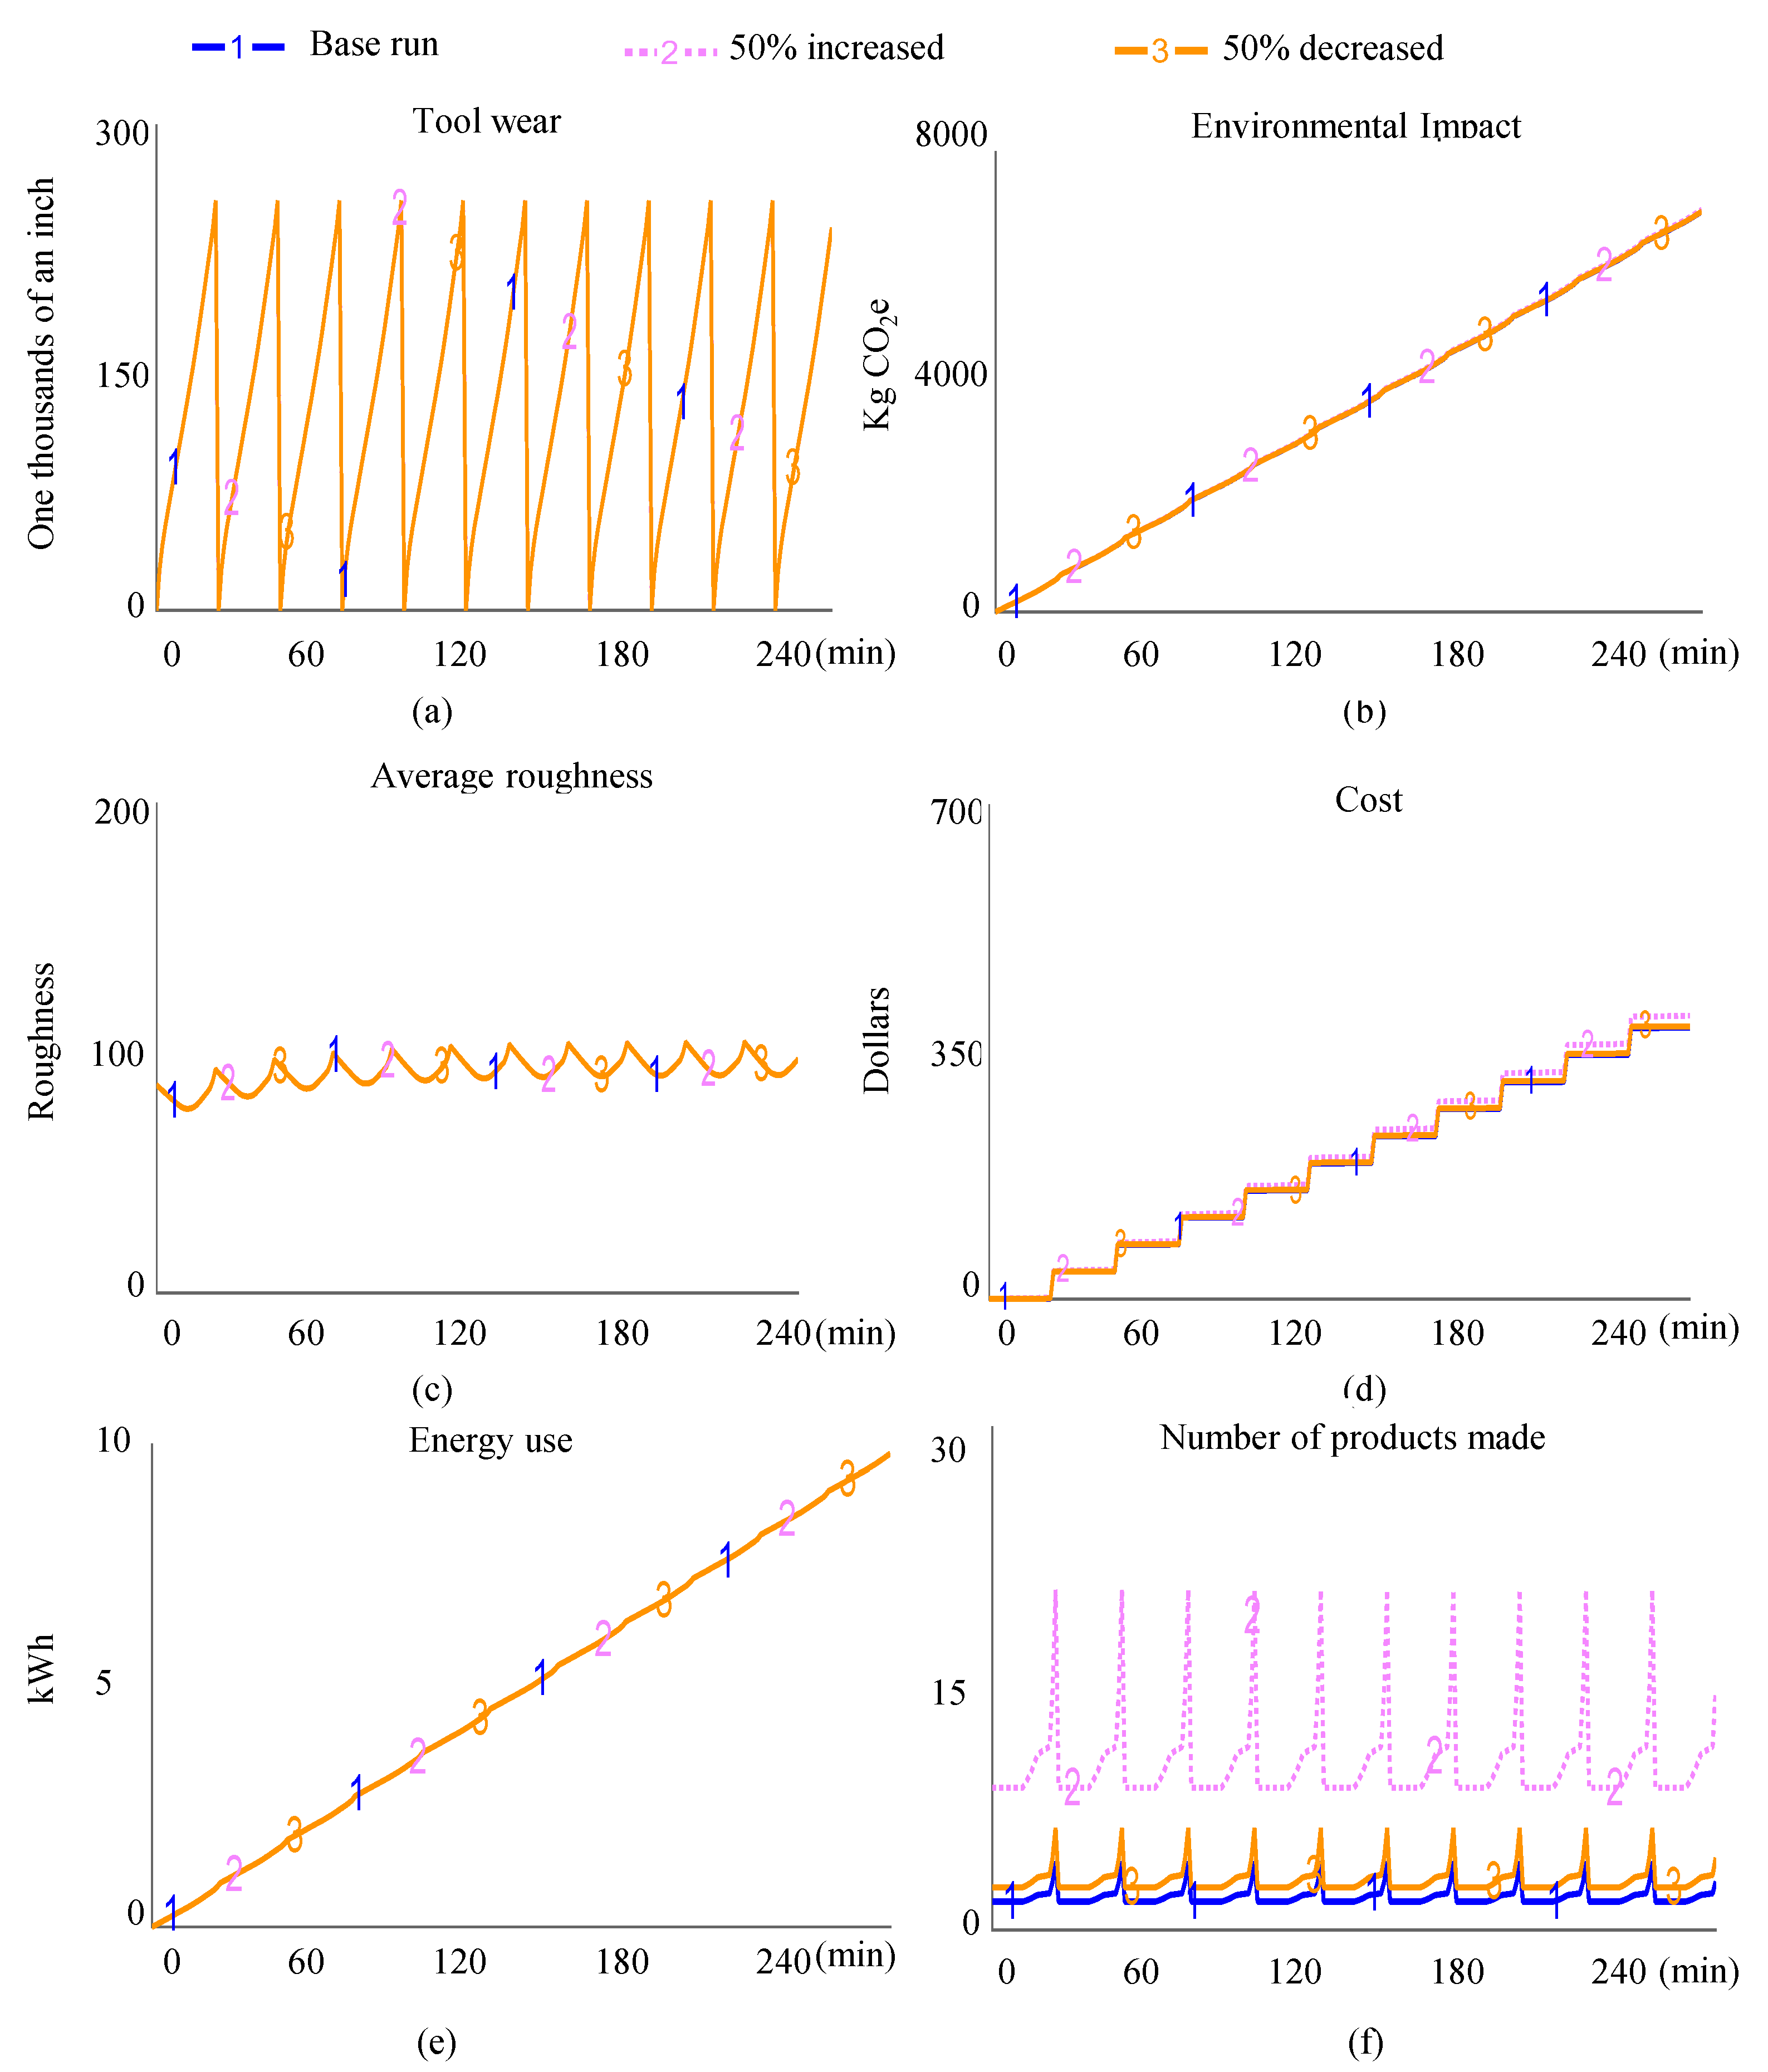
By changing the feed of the machining in these scenarios the human inputs’ effect on the system can be tested. The feed is the speed at which the machine runs the material through the milling process operation. The base run feed is 0.0017 inches per revolution, 50% increase is 0.00255 inches per revolution, and 50% decrease is 0.0085 inches per revolution.
As shown above in
Figure 10c, and
Figure 10e the Tool Wear, Environmental Impacts, Energy Use, and Roughness values do not change with the scenario testing. This is because the developed model is regulating itself to a sustained machining quality over long machining period by adjusting other machining parameters. For averaged values, they do not show clear difference. The only thing that changes in this scenario testing, is the cost and throughput. This model allows the machine to self-adjust cutting condition for quality control.
As shown in
Figure 10c the cost of the scenarios changed due to the material removal rate (MRR) increasing, and the number of products made increasing along with the MRR as shown in
Figure 10f. The unit of this cost is accumulated dollar which measures the cost of material cutting over time. This cost of the base run has a total of 385 dollars, the 50% increase in feed had a total of 387 dollars, and the 50% decrease in feed had a total of 382 dollars. However, as we know increased feed reduces cycle time, the cost per unit will decrease with higher feed value.
5. Discussion and Conclusions
This study investigates and quantifies the complex and dynamic relationships in a sustainable machining model, specifically between tool wear, environmental impacts, cost of machining, energy usage, and quality. This analysis was conducted using systems dynamic modeling to optimize key variables and determine how human decisions might interact with the system. The result of the systems dynamic model created in this study was a functioning, self-regulating system that can be used to inform complex machining decisions in automation.
The model was tested through three scenarios, changing various inputs to evaluate the optimized outputs. The scenarios demonstrated the outputs of human alterations of the material type simulated through change in cutting material, a change in desired tool wear limit, and change in feedrate of machining. As discussed in the scenario analysis, there are trade-offs that could be analyzed according to manufacturing priorities to find the optimal human inputs. The main outputs that were affected in this testing was the cost of machining, quality of product surface, and amount of tool wear.
Conclusions from this study were gleaned through scenario analysis. More frequent tool replacements due to more rapid wear from materials with lower machinability reduces the quality and variability of the quality of surface being milled. The Tool Wear Standard limits variability in quality; Manufacturers that prioritize consistency in product would be interested in the lower variability in roughness values that resulted from decreasing the acceptable amount of tool wear. Energy usage has the largest impact on Environmental Impacts, therefore reduction of tool wear, delaying the increase of the speed of machining and higher energy consumption, lowers both Energy Use and Environmental Impact. Lastly, allowing tools to reach a large amount of wear before replacing them is the least cost-effective option in the scenario tested, followed in effectiveness by the run that restricted tool wear to minimal amounts before replacement. There is a balance between the two extremes, closer to the base run, that is the most cost effective even without the factor of the quality of product being reflected in the price point achievable on the market. Loosing standard resulting into higher cost contradicts commonly perceived knowledge in production as the indirect consequences on energy and quality are not as clear as the direct benefit in tool use.
As seen in all three scenarios, the self-regulating system identifies trade-offs to optimize the system and reach desired goals. The model eliminates human operator decision-making, optimizing the quality of the product and tool wear amount depending on desired standards. The fact that in scenario 3 the only thing that changed was the cost, and in other scenarios the values maintained their roughness and acceptable tool wear amounts, exemplifies that the system is self-contained and balances all variables to reach desired goals.
This model is an affordable way for manufacturers to test different inputs and goals, and see how different quality, cost, environmental, energy, or tool wear goals result in varying effects on all other outputs in the machining system. Human inputs that can be modified include the type of material desired for machining and the goals of production such as quality in terms of acceptable surface finish, tool replacement standard, or others. The build of the model itself, which produces a functioning representation of tool wear in a typical machining operation, is valuable to the engineering and manufacturing research community.
One limitation in this study is that the results of the proposed model and the scenario analysis are based on theoretical calculations and literature data. More experiments need to be conducted to validate the results from an actual machining operation. Therefore, future research would include testing scenarios with different case studies of various other machining operations. Additional future research will be to evaluate the possibility of implementing this decision-making model into smart machine control of CNC operations.
Author Contributions
Conceptualization, H.Z. and R.M.; methodology, T.M., H.Z. and R.M.; software, R.M.; validation, T.M., H.Z. and R.M.; formal analysis, T.M., H.Z. and R.M., investigation, T.M., H.Z. and R.M.; resources, H.Z. and R.M.; data curation, T.M., H.Z. and R.M.; writing—original draft preparation, T.M.; writing—review and editing, H.Z. and R.M.; visualization, T.M., H.Z. and R.M.; supervision, H.Z. and R.M.; project administration, H.Z. and R.M. All authors have read and agreed to the published version of the manuscript.
Funding
This research received no external funding.
Institutional Review Board Statement
Not applicable.
Informed Consent Statement
Not applicable.
Data Availability Statement
Not applicable.
Acknowledgments
The authors would like to thank School of Integrated Sciences at James Madison University for the support of this research.
Conflicts of Interest
The authors declare no conflict of interest.
References
- Hu, L.; Tang, R.; Liu, Y.; Cao, Y.; Tiwari, A. Optimising the Machining Time, Deviation and Energy Consumption through a Multi-Objective Feature Sequencing Approach. Energy Convers. Manag. 2018, 160, 126–140. [Google Scholar] [CrossRef]
- Despeisse, M.; Ball, P.D.; Evans, S. Modelling and Tactics for Sustainable Manufacturing: An Improvement Methodology. In Sustainable Manufacturing: Shaping Global Value Creation; Seliger, G., Ed.; Springer: Berlin/Heidelberg, Germany, 2012; pp. 9–16. ISBN 978-3-642-27290-5. [Google Scholar]
- Park, H.; Qi, B.; Dang, D.-V.; Park, D.Y. Development of Smart Machining System for Optimizing Feedrates to Minimize Machining Time. J. Comput. Des. Eng. 2018, 5, 299–304. [Google Scholar] [CrossRef]
- Jiang, Z.; Zhou, F.; Zhang, H.; Wang, Y.; Sutherland, J.W. Optimization of Machining Parameters Considering Minimum Cutting Fluid Consumption. J. Clean. Prod. 2015, 108, 183–191. [Google Scholar] [CrossRef]
- de Souza Zanuto, R.; Hassui, A.; Lima, F.; Dornfeld, D.A. Environmental Impacts-Based Milling Process Planning Using a Life Cycle Assessment Tool. J. Clean. Prod. 2019, 206, 349–355. [Google Scholar] [CrossRef]
- Schultheiss, F.; Zhou, J.; Gröntoft, E.; Ståhl, J.-E. Sustainable Machining through Increasing the Cutting Tool Utilization. J. Clean. Prod. 2013, 59, 298–307. [Google Scholar] [CrossRef]
- Kovacevic, R.; Cherukuthota, C.; Mazurkiewicz, M. High Pressure Waterjet Cooling/Lubrication to Improve Machining Efficiency in Milling. Int. J. Mach. Tools Manuf. 1995, 35, 1459–1473. [Google Scholar] [CrossRef]
- Zhang, H.; Veltri, A.; Calvo-Amodio, J.; Haapala, K.R. Making the Business Case for Sustainable Manufacturing in Small and Medium-Sized Manufacturing Enterprises: A Systems Decision Making Approach. J. Clean. Prod. 2021, 287, 125038. [Google Scholar] [CrossRef]
- Petry, M.; Kohler, C.; Zhang, H. Interaction Analysis for Dynamic Sustainability Assessment of Manufacturing Systems. In Proceedings of the 27th CIRP Life Cycle Engineering (LCE) Conference, Grenoble, France, 13–15 May 2020. [Google Scholar]
- Zhang, H. Understanding the Linkages: A Dynamic Sustainability Assessment Method and Decision Making in Manufacturing Systems. Procedia CIRP 2019, 80, 233–238. [Google Scholar] [CrossRef]
- Nills, N. Cost and Environmental Impacts in Manufacturing: A Case Study Approach. Master’s Thesis, University of Rhode Island, Kingston, RI, USA, 2015. [Google Scholar]
- Diaz, N.; Ninomiya, K.; Noble, J.; Dornfeld, D. Environmental Impact Characterization of Milling and Implications for Potential Energy Savings in Industry. Procedia CIRP 2012, 1, 518–523. [Google Scholar] [CrossRef]
- Rajemi, M.F.; Mativenga, P.T.; Aramcharoen, A. Sustainable Machining: Selection of Optimum Turning Conditions Based on Minimum Energy Considerations. J. Clean. Prod. 2010, 18, 1059–1065. [Google Scholar] [CrossRef]
- Nicolaou, P.; Thurston, D.L.; Carnahan, J.V. Machining Quality and Cost: Estimation and Tradeoffs. J. Manuf. Sci. Eng. 2002, 124, 840–851. [Google Scholar] [CrossRef]
- Tebaldo, V.; di Confiengo, G.G.; Faga, M.G. Sustainability in Machining: “Eco-Friendly” Turning of Inconel 718. Surface Characterisation and Economic Analysis. J. Clean. Prod. 2017, 140, 1567–1577. [Google Scholar] [CrossRef]
- Sharif, M.N.; Pervaiz, S.; Deiab, I. Potential of Alternative Lubrication Strategies for Metal Cutting Processes: A Review. Int. J. Manuf. Technol. 2017, 89, 2447–2479. [Google Scholar] [CrossRef]
- Goindi, G.S.; Sarkar, P. Dry Machining: A Step towards Sustainable Machining—Challenges and Future Directions. J. Clean. Prod. 2017, 165, 1557–1571. [Google Scholar] [CrossRef]
- Jawahir, I.S.; Brinksmeier, E.; M’Saoubi, R.; Aspinwall, D.K.; Outeiro, J.C.; Meyer, D.; Umbrello, D.; Jayal, A.D. Surface Integrity in Material Removal Processes: Recent Advances. CIRP Ann. 2011, 60, 603–626. [Google Scholar] [CrossRef]
- Ribeiro, J.E.; César, M.B.; Lopes, H. Optimization of Machining Parameters to Improve the Surface Quality. Procedia Struct. Integr. 2017, 5, 355–362. [Google Scholar] [CrossRef]
- Helu, M.; Behmann, B.; Meier, H.; Dornfeld, D.; Lanza, G.; Schulze, V. Total Cost Analysis of Process Time Reduction as a Green Machining Strategy. In Leveraging Technology for a Sustainable World; Dornfeld, D.A., Linke, B.S., Eds.; Springer: Berlin/Heidelberg, Germany, 2012; pp. 299–304. [Google Scholar]
- Bharathi Raja, S.; Baskar, N. Application of Particle Swarm Optimization Technique for Achieving Desired Milled Surface Roughness in Minimum Machining Time. Expert Syst. Appl. 2012, 39, 5982–5989. [Google Scholar] [CrossRef]
- Rubio, E.M.; Agustina, B.; Marín, M.; Bericua, A. Cooling Systems Based on Cold Compressed Air: A Review of the Applications in Machining Processes. Procedia Eng. 2015, 132, 413–418. [Google Scholar] [CrossRef]
- Tsao, C.C. Grey–Taguchi Method to Optimize the Milling Parameters of Aluminum Alloy. Int. J. Adv. Manuf. Technol. 2009, 40, 41–48. [Google Scholar] [CrossRef]
- Newell, B.R.; McDonald, R.I.; Brewer, M.; Hayes, B.K. The Psychology of Environmental Decisions. Annu. Rev. Environ. Resour. 2014, 39, 443–467. [Google Scholar] [CrossRef]
- Swim, J.; Clayton, S.; Doherty, T.; Gifford, R.; Howard, G.; Reser, J.; Stern, P.; Weber, E. Psychology & Global Climate Change Addressing a Multifaceted Phenomenon and Set of Challenges; American Psychological Association: Washington, DC, USA, 2009. [Google Scholar]
- Das, A.; Pagell, M.; Behm, M.; Veltri, A. Toward a Theory of the Linkages between Safety and Quality. J. Oper. Manag. 2008, 26, 521–535. [Google Scholar] [CrossRef]
- Zhang, H.; Amodio-Calvo, J.; Haapala, K. A Systems Thinking Approach for Modeling Sustainable Manufacturing Problems in Enterprises. In Proceedings of the International Annual Conference (IAC) of the American Society for Engineering Management (ASEM), Minneapolis, MI, USA, 3–5 October 2013. [Google Scholar]
- Zhang, H.; Haapala, K.R. Integrating Sustainable Manufacturing Assessment into Decision Making for a Production Work Cell. J. Clean. Prod. 2015, 105, 52–63. [Google Scholar] [CrossRef]
- Forrrester, J. Industrial Dynamics; MIT Press: Cambridge, MA, USA, 1961. [Google Scholar]
- Rich, E.; Anderson, D.; MacDonald, R. System Dynamics Applications to Public Policy. In System Dynamics: Theory and Applications; Encyclopedia of Complexity and Systems Science Series; Springer: New York, NY, USA, 2009; pp. 7051–7061. ISBN 978-1-4939-8790-0. [Google Scholar]
- Sterman, J. Business Dynamics: Systems Thinking and Modeling for a Complex World; Irwin/McGraw-Hill: Boston, MA, USA, 2000; ISBN 978-0-07-231135-8. [Google Scholar]
- Taylor, F.W. On the Art of Cutting Metals, 3rd ed.; The American Society of Mechanical Engineers: New York, NY, USA, 1906. [Google Scholar]
- Barlas, Y. Formal Aspects of Model Validity and Validation in System Dynamics. Syst. Dyn. Rev. 1996, 12, 183–210. [Google Scholar] [CrossRef]
- Forrester, J.; Senge, P. Test for Building Confidence in System Dynamics Models. TIMS Stud. Manag. Sci. 1980, 14, 209–228. [Google Scholar]
- Barlas, Y. Tests of Model Behavior That Can Detect Structural Flaws: Demonstration With Simulation Experiments. In Proceedings of the Computer-Based Mangement of Complex Systems: International System Dynamics Conference, Stuttgart, Germany, 10–14 July 1989; Springer: Berlin, Germany, 1989. [Google Scholar]
| Disclaimer/Publisher’s Note: The statements, opinions and data contained in all publications are solely those of the individual author(s) and contributor(s) and not of MDPI and/or the editor(s). MDPI and/or the editor(s) disclaim responsibility for any injury to people or property resulting from any ideas, methods, instructions or products referred to in the content. |
© 2022 by the authors. Licensee MDPI, Basel, Switzerland. This article is an open access article distributed under the terms and conditions of the Creative Commons Attribution (CC BY) license (https://creativecommons.org/licenses/by/4.0/).


