Article

The Path of Housing Prices in Promoting the Upgrading of Industrial Structure: Bank Credit Funds, Land Finance, and Consumer Demand

1
College of Economics and Trade, Hunan University of Technology and Business, Changsha 410205, China
2
The School of Finance, Hunan University of Technology and Business, Changsha 410205, China
3
School of Economics and Management, Huzhou University, Huzhou 313000, China
*
Author to whom correspondence should be addressed.
Sustainability 2022, 14(9), 5731; https://doi.org/10.3390/su14095731
Submission received: 17 April 2022 / Revised: 5 May 2022 / Accepted: 5 May 2022 / Published: 9 May 2022

Abstract

:
The impact path of housing prices on the upgrading of the industrial structure is an important part of realizing the high-quality operation of the national economy in China. In order to discuss the mechanism of different influencing paths to upgrading industrial structure, this paper introduces three different intermediary variables from the levels of supply, demand, and government, and further subdivides and compares them to empirically test the specific impact path of housing prices on industrial structure upgrading by constructing multi-dimensional industrial structure upgrading indicators. It obtains some meaningful results. Firstly, there is a significant U-shaped relationship between housing prices and industrial structure upgrading; secondly, rising house prices will exacerbate the real estate industry’s occupation of bank credit funds, hindering the upgrading of the whole industrial structure; thirdly, the negative impact of the land’s financial dependence on the upgrading of the industrial structure was underestimated; and, finally, the rise in housing prices can improve the consumption level and promote the upgrading of regional industrial structures. By studying the impact path of house prices on the upgrading of different industrial structures, it will help local governments regulate house prices and give full play to the role of house prices in promoting the upgrading of industrial structure through multiple channels.

1. Introduction

1.1. Problems Propose

The upgrading of the industrial structure refers to the proportional relationship between various industries, and is the central task of economic restructuring and a key measure to accelerate the transformation of the economic development mode in China. To realize the upgrading of the industrial structure, it is inevitable to accelerate and optimize the allocation of resource elements (Xu et al. [1]). However, the persistently rising housing prices have not only driven the development of real estate, but also affect the allocation of resources between regional industries in recent years in China. Therefore, it is necessary to comprehensively identify the impact path of housing prices on the upgrading of industrial structures and formulate housing price control policies for local governments in China.
There is no consensus on the impact of housing prices on the upgrading of the industrial structure, especially after the development of the real estate industry since the 1980s in China. Cao and Li [2] believed that the orderly development of the real estate industry is not only conducive to the transformation of the industrial structure, but also occupies an important strategic position in economic development. Xia [3] studied the impact of real estate development on different industries from the perspective of input and output and found that the development of the real estate industry had a significant driving effect on manufacturing, financial services, etc. Lu and Ji [4] found that the rise in urban housing prices has a significant positive effect on the adjustment of the industrial structure.
However, with the rapid rise in housing prices and more problems being exposed in the past decade, some scholars have begun to worry about whether the rapid growth of housing prices will inhibit the upgrading of industrial structure. Gu et al. [5] used a dynamic panel data model and found an inverted “U” shape in the impact of rising real estate prices on industrial structure upgrading in 257 cities in China. Lin and Lv [6] concluded that high housing prices will become a source of resistance to the development of the industrial structure. Guo and Li [7] found that the rapid rise in housing prices will directly inhibit the upgrading of the industrial structure after using the double-panel threshold model to divide different housing price regions.
The impact of housing prices on the upgrading of industrial structure has gradually attracted the attention of more scholars, but there are still many conclusions that have not yet reached a unified view, such as: Do rising housing prices promote or inhibit the upgrading of regional industrial structure? How does housing price affect the upgrading of regional industrial structure? What are the specific paths and impact mechanisms? In order to answer the above questions, this paper selects financial resource crowding, land financial dependence, and household consumption upgrades as intermediary variables from the levels of supply, government and demand, and discusses the mechanism of different influence paths on the upgrading of industrial structure.
Compared with the existing research, the marginal contribution of this paper may lie in two aspects. Firstly, it is not limited to the simple linear relationship between housing prices and industrial structure upgrading, and it selected supply, government, and demand as intermediary variables to more comprehensively and systematically analyze the specific impact path of housing price on the upgrading of industrial structure. Secondly, on the basis of examining the impact of housing prices on the upgrading of the industrial structure through the three paths of financial resources crowding, land and fiscal dependence, and residents’ consumption upgrade, this paper explores the specific mechanism of different impact paths on the upgrading of the industrial structure and analyzes the internal effects of specific paths’ differences.

1.2. Theoretical Hypotheses

Although the impact of housing prices on industrial structure upgrading has not reached a consistent conclusion in the academic sense, it is clear that housing prices will indeed affect industrial structure upgrading. Among the many factors that affect the upgrading of industrial structure, capital investment, land finance, and consumption factors will all have an impact on the upgrading of regional industrial structure in the case of changes in housing prices.

1.2.1. Hypotheses 1: Bank Credit Funds

On the one hand, the development of the real estate industry requires the support of a large amount of funds, and it relies too much on indirect financing, especially bank loans (Zhang and Zhang [8]). Under certain circumstances, it will exacerbate the financing constraints of non-real estate industries (Chen et al. [9]). In the 1970s of the 20th century, the American housing finance system provides a good example. Not only was the commercial mortgage market developed, but by offering a variety of housing mortgage loan to consumers, such as variable rate mortgages and shared appreciation mortgages, mortgage payments, etc., through the process of securitization of housing loans to the real estate market flow, it also included a powerful policy-based financial system, which helps residents solve their housing problems by providing rent subsidies, guaranteed loans, tax breaks, and other measures. At the same time, private developers were encouraged to build public housing for low-income people by providing tax revenue and low-priced land, thus strongly promoting the development of the US housing market. The EU also attaches importance to the development of the real estate industry. It not only stipulates that member states can purchase open-ended real estate funds, but also relaxes mortgage loan standards in many cases, making the overall housing price in the eurozone rise rapidly. On the other hand, the continuous rise in housing prices will increase the return on investment in the real estate industry. Driven by the “capital pursuit of profit”, enterprises will shift their investment focus to the real estate industry). Investment in other industries has a crowding effect in the real estate industry, resulting in a mismatch of capital among industries, which in turn inhibits the upgrading of regional industrial structures (Chen, [10]; Liu and Wang [11]). The rise in housing prices will inhibit the upgrading of the industrial structure by crowding out financial resources, but there is still a lack of systematic research on what types of financial resources will be crowded out and how different types of financial resource crowding will affect the upgrading of the industrial structure. Based on this, this paper divides the path of financial resource squeeze into three categories: fixed investment fund squeeze, bank credit fund squeeze, and foreign investment fund squeeze, and proposes:
Hypothesis 1 (H1).
Rising housing prices will crowd out fixed investment funds, bank credit funds, and foreign investment funds at the same time, resulting in insufficient funds for the development of other industries, thereby reducing the scale and hindering the adjustment and upgrading of the industrial structure.

1.2.2. Hypotheses 2: Land Finance

As one of the important means for the government to regulate the local economy, land finance also affects the industrial structure of the region to a large extent (Lin et al. [12]). Housing prices and land finance have a positive impact on each other. If the real estate market develops too fast, it can increase local land revenue through land transfer income channels (Wang and Wu [13]). When the land’s fiscal revenue increases with the rise in housing prices, more funds are used to repay local debts and invest in infrastructure construction, and good infrastructure can not only effectively reduce the cost of enterprises (Song and Tao [14]) but also accelerate the flow of production factors such as capital and technology. However, the rising housing prices have brought about the continuous increase in land transfer fees and will increase the cost of land investment in long-term losses (Jiang et al. [15]). Moreover, while expanding the scale of local fiscal revenue, it will also lead to the drive in local government performance competition (Yang et al. [16]), which is not conducive to the upgrading of industrial structure.
At present, how the housing prices through land finance influence industrial structure upgrading has not yet been determined, and most scholars only consider, when measuring land finance, the value of the land as the major consideration. There are still some differences with European and American countries (see Table 1 for comparison of real estate tax in different countries). However, as an important source of financial revenue for local governments, real estate tax will gradually receive more attention. There is reason to believe that the establishment and improvement of a real estate tax system in China is not far away. Based on this, this paper incorporates real estate tax factors into the index of land financial dependence and divides regions according to differences in housing prices, and proposes:
Hypothesis 2 (H2).
Taking into account both land transfer fees and real estate taxes, this can more truly reflect the impact of local land financial dependence on the upgrading of the industrial structure, and the rise in housing prices will increase the government’s land financial dependence, which, through the distorting investment wrongly guides the development direction of the industry and hinders the upgrading of the industrial structure. The higher the housing price, the stronger the dependence on land finance and the greater the damage to the industrial structure.

1.2.3. Hypotheses 3: Consumer Demand

The negative inhibitory effect and positive promotion effect of housing prices’ rise on residents’ consumption almost simultaneously exist. On the one hand, rising house prices will suppress residents’ consumption through the severe liquidity constraints imposed on households repaying housing loans, directly crowding out consumption and its diversity (Li [17]; Tabuchi [18]; Xu et al. [19]). On the other hand, rising house prices will have a positive impact on household consumption expenditure through wealth-added effect (Aoki et al. [20]; Iacoviello and Neri [21]) and desperate consumption effect (Du and Luo [22]; Wang and Pang [23]). In additional, the consumption structure of residents is also changing, and they are pursuing more diversity and novelty of goods and services (Zhang [24]), reducing the proportion of traditional low-end backward industries, increasing the proportion of high-end emerging services, and gradually optimizing the original industrial structure. At present, most scholars tend to study the impact of housing price on residents’ consumption level, but pay little attention to the impact of consumption structure. Therefore, on the basis of studying the impact of housing price on residents’ consumption level, this paper further analyzes the influence mechanism of upgrading consumption structures on industrial structure upgrading. Therefore, this paper proposes:
Hypothesis 3 (H3)
. Rising house prices can effectively improve the level of residents’ consumption and optimize the residents’ consumption structure by increasing residents’ development-oriented consumption and enjoyment-oriented consumption. Enterprises continue to improve production efficiency and product structure in the process of meeting consumers’ needs and, eventually, gradually promote regional development. The industrial structure was optimized and upgraded.

2. Materials and Methods

2.1. Variable Measure

2.1.1. Explained Variable

There are many indicators to measure the upgrading of industrial structure (Str). Some scholars directly use the ratio of the output value of the tertiary industry to the output value of the secondary industry as a measurement index, but this method is too simple, not only ignoring the existence of the primary industry, but also failing to reflect the the structural change process of the three major industries. Some scholars also use the Chenery standard and the Hoffman ratio, commonly used abroad to measure the upgrading of the industrial structure, but these two methods have higher requirements on the quality of industrial data, and the time span is longer. It is suitable for countries with a long process of industrial structure evolution, but not suitable for the study of Chinese cities. In order to measure the upgrading of industrial structure more comprehensively and effectively, this paper considers the horizontal layout of the industry and the vertical development of the industry and draws on the methods of Wu [25] and Fu [26], respectively, to construct the industrial structure level coefficient index and industrial structure. The structural optimization level indicator, used to measure the rationalization and evangelization of regional industrial structure, is as follows:
(1) Rationalization of industrial structure. It is measured by the industrial structure hierarchy coefficient (SRE), drawing on the methods of Wu [25], which are obtained by weighting the proportion of the output value of the three major industries, which are then weighted and summed. This indicator not only involves the three major industries, but also the weights assigned to them are consistent with the ranking of the three major industries.
Its calculation formula is:
S R E i t = i = 1 3 x i × i = x 1 + 2 x 2 + 3 x 3
Among them, x 1 ,     x 2 ,   and   x 3   respectively represent the proportion of the output value of the primary industry, the secondary industry, and the tertiary industry to the regional GDP; the value is between 1 and 3. The larger value of   S R E i t indicates the higher level of the industrial structure, and the more coordinated industries and more reasonable industrial structure.
(2) Advanced industrial structure. It is measured by the industrial structure optimization level (SUP) and calculated by Moore’s structure value, drawing on the methods of Fu [26]. This calculation method uses the space vector measurement method, which can measure the comprehensive transfer effect of the three major industries. The evolution situation has a strong scientific theoretical basis. The specific calculation method is based on the angle of the vector space; the three industries are divided into three departments, and the ratio of the industrial added value of each department to the GDP is regarded as a component in the space vector, thus forming a set of three-dimensional vectors. x 0 = ( x 1 , 0   , x 2 , 0   , x 3 , 0 ) , x i is represented as the industrial structure matrix of i region, and then the angles with x 1 = ( 1 ,   0 ,   0 ) , x 2 = ( 0 ,   1 ,   0 ) , x 3 = ( 0 ,   0 ,   1 ) , respectively, are calculated:
θ j = a r c c o s i = 1 3 ( x i , j · x i , 0 ) ( i = 1 3 x i , j 2 ) 1 2 · ( i = 1 3 x i , 0 2 ) 1 2
The angle between the two sets of vectors in the two periods is used as an indicator of the degree of change in the industrial structure. When one of the industries changes, the angle between it and other industries (variables) will change, and all the angle changes are accumulated. The structural changes of each industry in the entire economic system are represented by:
S U P = k = 1 3 j = 1 k θ j
The larger the SUP value, the higher the level of industrial structure optimization, that is, the stronger the advanced industrial structure.

2.1.2. Explanatory Variable: Housing Price Level (HP)

This paper focuses on the research on the impact of housing prices on the upgrading of the industrial structure and uses the average sales price of commercial housing, which can more intuitively display the level of housing prices in the region, to measure the level of housing prices. The calculation method is the ratio of the sales of commercial housing to the sales area of commercial housing.

2.1.3. Mediating Variable

This paper studies the impact of housing prices on the upgrading of industrial structure from the perspectives of supply, government, and demand, and mainly studies the three impact paths of financial resource crowding, land, and fiscal dependence as well as household consumption upgrading.
(1)
Congestion degree of financial resources (MON). Including the crowding out of three types of funds: in terms of investment, real estate development investment accounts for a large proportion of fixed asset investment in the whole society, and excessive investment in real estate will replace other non-real estate investments, thus affecting the upgrading of industrial structure; in terms of financing, China’s huge real estate market financing mainly relies on bank credit, followed by the use of foreign capital, self-raised funds, etc. More real estate development financing, under the condition of a certain amount of financial resources, will lead to a decrease in the financing funds of other industries, which in turn will reduce the amount of financing available for other industries. Industrial upgrading has an impact. In view of this, this paper adopts the ratio of real estate investment to the total social fixed asset investment (MFR), the ratio of real estate loans to the balance of loans of banking financial institutions (CRE), and the ratio of foreign investment in real estate investment to total foreign investment (FOR), respectively., as well as the real estate industry’s occupation of fixed investment funds, bank credit funds, and foreign investment funds.
(2)
Land financial dependence (FIN). Many scholars directly use the ratio of land transfer fee to general budgetary revenue to measure land financial revenue but, in fact, real estate tax also occupies a considerable proportion in land finance, which cannot be ignored. Therefore, this paper draws on Wu and Li [27] who use land transfer fees to measure land finance, taking real estate taxes into account. The constructed indicator is the ratio of the sum of land transfer fees and real estate taxes to general budgetary revenue, so as to measure a region’s land financial dependence. At the same time, the ratio of land transfer fee to general budget revenue is used as another indicator to measure land financial dependence (LAND) for comparative analysis.
(3)
Resident consumption upgrade (EXP). The analysis is carried out from two aspects: the upgrading of residents’ consumption level and the upgrading of residents’ consumption structure. With the development of China’s social economy, the per capita consumption expenditure of residents has gradually increased, which can be used to measure the upgrading of residents’ consumption level (CON). For the upgrading of consumption structure, some scholars directly measure the ratio of residents’ non-food consumption expenditure to total consumption expenditure, but nowadays people’s living standards are gradually improving, and they have already begun to pursue more diversified consumption. It is impossible to generalize consumption expenditures other than non-food items. In view of this, this article is based on the availability of data and according to the consumption to meet the living level of residents. The structure is divided into: subsistence consumption (including food consumption expenditure, clothing consumption expenditure, and housing consumption expenditure, etc.), development consumption (including transportation and communication consumption expenditure, medical care consumption expenditure, equipment consumption expenditure, etc.), enjoyment consumption (including cultural and entertainment consumption expenditure, other supplies and services consumption expenditure, etc.); the ratio of the three types of consumption to the per capita consumption expenditure of residents is used as the measurement index for the upgrading of the consumption structure of residents, which is expressed by SUR, DEV, and ENJ, respectively.

2.1.4. Control Variables
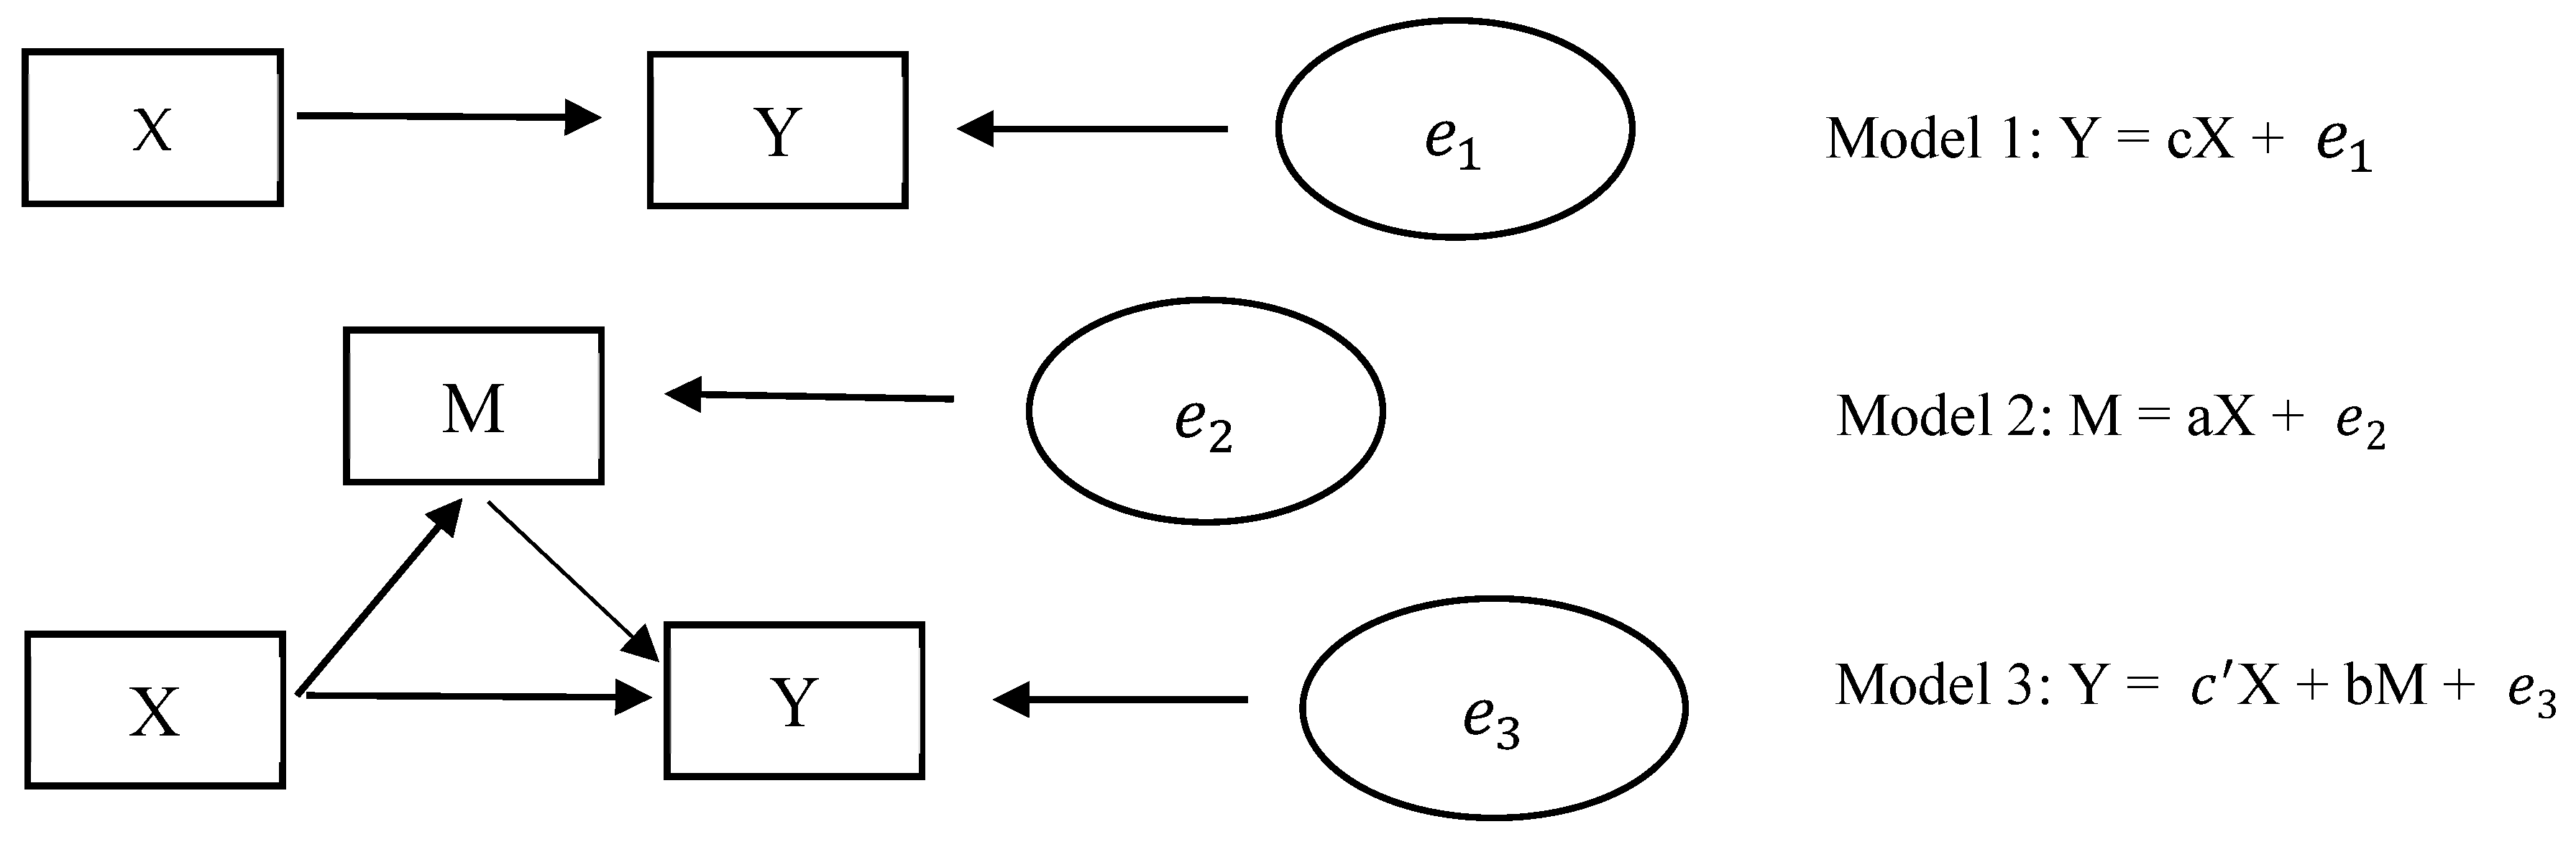
According to relevant economic theories, this paper selects five control variables: (1) technological innovation (TEC), which is expressed by the number of invention patent applications granted in the region, (2) level of opening to the outside world (TRA), which is expressed by the total import and export volume of the region, (3) fiscal expenditure (FIS), which is expressed by the government’s financial expenditure in each region, and (4) human capital (HC), which is expressed by the number of students in ordinary institutions of higher learning per 100,000 people. This indicator examines human capital from the perspective of education, which is more convincing than the perspective of occupation. First of all, education is the main means to improve human capital, and the human capital with higher education has a more direct relationship with the upgrading of regional industrial structure. Secondly, in terms of population mobility influenced by the employment matching rate and the popularity of schools in the region, college students are less willing to migrate to choose jobs than the general labor force. Finally, (5) urbanization rate (URB), is expressed as the ratio of urban population to total population. The description of each indicator is shown in Table 2.

2.2. Model Building

Based on the study of the impact of housing prices on the upgrading of industrial structure, this paper analyzes the mechanism of housing prices on the upgrading of industrial structure through other influence paths. First, establish the relationship model between housing prices and industrial structure upgrading:
S t r i t = α 0 + α 1 H p i t + j = 1 n λ j Z i j t + ε i t
Considering the possible non-linear relationship between housing prices and industrial structure upgrading, the quadratic term of housing prices is included in the model, and the other model is constructed as follows:
S t r i t = α 0 + α 1 H p i t + α 1 H p i t 2 + j = 1 n λ j Z i j t + ε i t
In addition to directly affecting the upgrading of the regional industrial structure, housing prices may also indirectly affect the upgrading of the industrial structure through the squeeze of financial resources, the dependence of land finance, and the upgrading of residents’ consumption. In order to test whether the intermediary effect exists, the mediation effect model is constructed as follows:
{ M O N i t = β 0 + β 1 H p i t + j = 1 n λ j Z i j t + μ i t   F I N i t = β 0 + β 1 H p i t + j = 1 n λ j Z i j t + μ i t   E X P i t = β 0 + β 1 H p i t + j = 1 n λ j Z i j t + μ i t  
{ S t r i t = γ 0 + γ 1 H p i t + γ 2 M O N i t + j = 1 n λ j Z i j t + ν i t   S t r i t = γ 0 + γ 1 H p i t + γ 2 F I N i t + j = 1 n λ j Z i j t + ν i t   S t r i t = γ 0 + γ 1 H p i t + γ 2 E X P i t + j = 1 n λ j Z i j t + ν i t  
In Equations (4)–(7), S t r i t represents the industrial structure upgrade of province i in year t; H p i t is the housing price level; M O N i t ,   F I N i t , and E X P i t represent the crowding out of financial resources, land financial dependence, and household consumption upgrades, respectively; Z represents each control variable; λ j is the parameter; ε i t ,   μ i t   , and ν i t represent the random disturbance term of the equation.
In this paper, the stepwise regression method is used to test the mediating effect of the three mediating variables. The simple model is as follows:
Sustainability 14 05731 i001
The test process of the stepwise regression method is mainly divided into three parts: (1) Model 1 tests the total effect of the explanatory variable X on the explained variable Y. If the total effect c is significant, it indicates that the total effect of housing prices affecting the industrial structure upgrade exists, which can be carried out in the next test. If it is not significant, the mediation effect test is terminated. (2) Model 2 tests whether the effect a of the explanatory variable on the mediating variable is significant; (3) The coefficient b is in Model 3, to test the effect of controlling the explanatory variable X. After the effect of the mediator variable M on the explanatory variable Y, the coefficient c’ tests the direct effect of the explanatory variable X on the explained variable Y after controlling the effect of the mediator variable M. If the coefficient b is significant but c′ is not significant, it is expressed as a complete mediation effect; if both are significant, it is expressed as a partial mediation effect, and the mediation effect is expressed by the coefficient product a * b. The descriptive statistical analysis of the variables is shown in Table 3.

2.3. Data Sources

This paper selects the data of 31 provinces and cities from 2005 to 2019 for modeling analysis. All data are annual data, mainly from the EPS database, “China Statistical Yearbook”, and financial operation reports of various provinces and cities, etc. Individual missing data are processed by the interpolation method. In order to reduce the volatility of variables and reduce the impact of the original number error on the final result, all variables are logarithmically processed in this paper.
In addition, when analyzing the differences of different housing prices between regions, with reference to Shanghai E-House Real Estate Research Institute in 2019, this paper divided China’s 31 provinces into 5 categories. (1) Areas of high housing prices (more than 20,000 yuan per square meter) include Beijing and Shanghai; (2) areas of moderate to high price (14,000–20,000 yuan/square meter) include Tianjin, Zhejiang, Guangdong, and Hainan; (3) areas of medium housing price (10,000–14,000 yuan/square meter) include Jiangsu and Fujian; (4) areas of moderately low price (8000–10000 yuan/square meter) include Liaoning, Shandong, Hubei, Chongqing, and Shaanxi, and (5) areas of low housing price (less than 8000 yuan/square meter) include Hebei, Shanxi, Inner Mongolia, Jilin, Heilongjiang, Anhui, Jiangxi, Henan, Hunan, Guangxi, Sichuan, Guizhou, Yunnan, Tibet, Gansu, Qinghai, and Ningxia.

3. Results

3.1. Unit Root and Cointegration Test

According to the definition of cointegration, the two variable sequences are single integral sequences of the same order, so that the next step of the cointegration relationship test can be carried out. Therefore, the stationarity test is performed on the panel data first to avoid problems such as spurious regression. The LLC test, IPS test, and HT test were performed on the explanatory variables and explained variables, respectively. After testing, it was found that lnSRE rejected the null hypothesis at the 5% significance level in the IPS test, and the data of the remaining variables were at the 1% significance level. The null hypothesis of the existence of a unit root is rejected, and the stationarity requirement is well satisfied.
The co-integration test can check whether there is a long-term stable equilibrium relationship between the variables. The variables that satisfy the co-integration relationship will not be separated too far from each other and will only deviate from the equilibrium position in the short term in the event of a shock and in the long term. Equilibrium can be restored automatically. This paper uses Kao test and Pedroni test to test the cointegration of explained variables, explanatory variables, and control variables. After the test, it is found that all panels are cointegrated. It can be seen that there is a long-term co-integration between housing prices and industrial structure upgrading in the region.

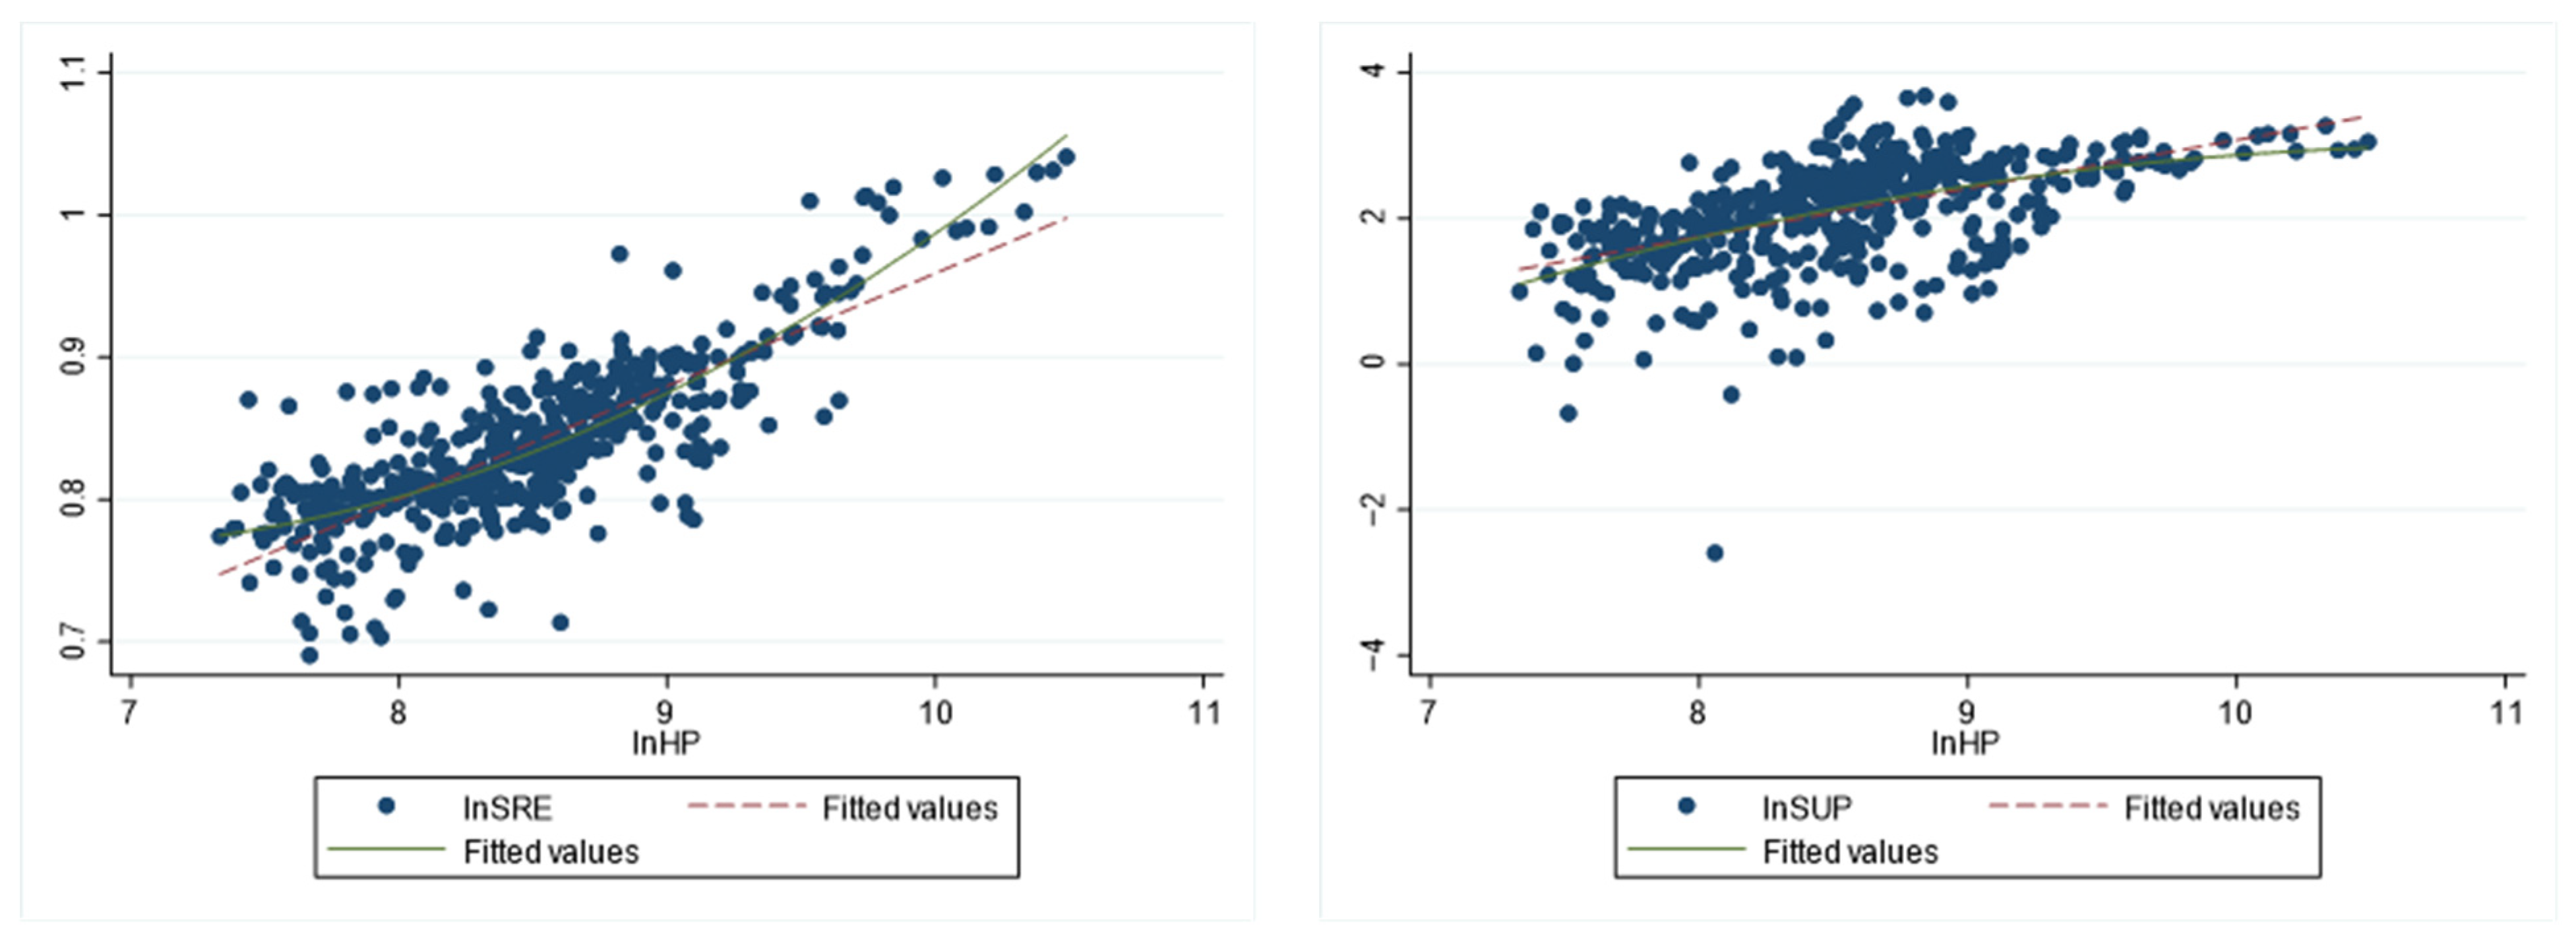
3.2. Direct Impact of Housing Prices on the Upgrading of Industrial Structure

Figure 1 is a scatter plot of the correlation between housing prices and industrial structure upgrading. It can be seen from the figure that, on the whole, housing prices have a quantitative correlation trend with the rationalization of industrial structure and the advanced industrial structure, and the correlation is non-linear. The dotted line in the figure represents the linear fitting between housing prices and industrial structure upgrading, and the solid line represents the nonlinear fitting between housing prices and industrial structure upgrading. The combined effect is better.
Before parameter estimation, the model needs to be tested for effects to determine the best estimated model. In this paper, a Hausman test to distinguish fixed effects and random effects is carried out. In the Hausman test of housing price to industrial structure rationalization and industrial structure advanced regression, the p values of the test are 0.0000 and 0.0028, respectively, both of which are significant at the 1% confidence level. Therefore, the null hypothesis H0: : H 0 : u i is not correlated with x i t ,   z i and is strongly rejected, and a fixed effect model should be used for estimation. Table 4 shows the regression results of the impact of housing prices on industrial structure upgrading. Fixed effect includes time fixed effect, individual fixed effect, and double fixed effect. Individual fixed effect can solve the problem of missing variables that do not change with time but vary with individuals, but there may also be the problem of missing variables that do not change with individuals but change with time. In most cases, the intercept term represents individual heterogeneity in a fixed model, which can be regarded as an individual fixation. In panel data, if time trend is required, time change cannot be controlled, but it is inevitable to ignore the factors of time variation.
From Columns (1), (2), (5) and (6), whether the industrial structure upgrade is measured by the rationalization of the industrial structure or the industrial upgrading, the housing price has a significant positive effect on the industrial structure upgrade. Among them, the estimated coefficient of the impact of housing prices on the rationalization of industrial structure is 0.0350, and it is significant at the 1% confidence level, indicating that housing prices have a significant role in promoting the rationalization of industrial structure. The regression coefficient shows that each unit increase in housing prices can significantly promote the rationalization of the industrial structure by 0.0350 units.
Further replacing the explanatory variable with the advanced industrial structure, the coefficient of housing prices is significantly positive at the 1% confidence level, indicating that housing prices have improved the advanced industrial structure. The regional industrial structure’s advanced index increased by 0.350 units. Considering that housing prices may have a non-linear impact on the upgrading of industrial structure, the square term of house price (lnHP 2) is added to the model, and the empirical test is carried out again. It can be seen from the regression results of Columns (3), (4), (7) and (8) in Table 4, whether adding control variables or not, the influence coefficient of housing prices on industrial structure upgrading is significantly negative, while the coefficients of the quadratic terms of housing prices are all significantly positive, indicating that there is a U-shaped nonlinear relationship between housing prices and industrial structure upgrading. The square term coefficient is statistically significant and cannot fully represent the U-shaped relationship between the two. However, it is found that the extreme value point is within the data range, and the null hypothesis is rejected.
Therefore, there is a U-shaped relationship between housing prices and industrial structure upgrading. Housing prices in different regions have different effects on the upgrading of the industrial structure. Relatively low housing prices are not conducive to the upgrading of the industrial structure. However, when the housing prices rise reasonably to a certain extent, the housing prices will promote the upgrading of the industrial structure.
From the regression results of control variables, it can be seen from columns (10) and (14) that technological innovation (lnTEC) has a negative influence on the rationalization of industrial structure, the level of openness (lnTRA) has a positive effect on the rationalization of industrial structure, and fiscal expenditure (lnFIS) has a significantly positive effect on the rationalization of industrial structure. Human capital (lnHC) plays a significant role in promoting the rationalization and upgrading of industrial structure, while urbanization rate (lnURB) hinders the rationalization of industrial structure. The level of urbanization in China lags behind the process of industrialization, resulting in a low correlation between the two and no positive linkage effect (Gao [28]).

3.3. Mediating Effect of the Impact of Housing Prices on the Upgrading of Industrial Structure

3.3.1. Crowding Out of Bank Credit Funds

Rising housing prices will accelerate capital accumulation in the real estate market, leading to financial resource congestion. Therefore, taking housing price as an independent variable, this section empirically analyzes the intermediary effect of three types of capital squeeze on industrial structure upgrading, including fixed investment capital squeeze at the investment level, bank credit capital squeeze at the financing level, and foreign investment fund squeeze. The estimated results are shown in Table 5.
From Columns (1), (4) and (7), it can be seen that housing prices have a significant promoting effect on the three intermediary variables, namely, the crowding out of fixed investment funds, the crowding out of bank credit funds, and the crowding out of foreign investment funds. Among them, the rising house price has the greatest effect on the crowding out of the fixed investment and the smallest effect on the crowding out of bank credit funds. Compared with ordinary enterprises, banks are more rational in real estate investment and lending (Chen [29]), and the macro-prudential policy has also restrained the credit expansion brought about by the growth of real estate prices to a certain extent.
Furthermore, housing prices have produced different mediating effects on industrial structure upgrading through three mediating variables. After adding the intermediary variable of crowding out fixed investment, housing prices are significant at the level of 1%, but their role in promoting the upgrading of the industrial structure becomes insignificant, indicating that housing prices can improve the industrial structure through the crowding out of fixed assets. A complete mediation effect was produced, and the influence coefficient was 0.2249. Housing prices have not suppressed the rationalization of the industrial structure by crowding out fixed investment funds. Rising housing prices have indeed improved investment efficiency and promote adjusting the industrial structure (Zhou and Liu [30]). Moreover, rising house prices will release some financing constraints, which will help enterprises to obtain more bank credit funds (Chaney et al. [31]), thereby having a driving effect on fixed assets in the non-real estate industry.
After the addition of the intermediate variable of bank credit capital crowding, the housing price has a significant impact on the bank credit capital crowding, industrial structure upgrading and rationalization, and upgrading at the level of 1%, while the bank credit capital crowding has a significant impact on the industrial structure rationalization and upgrading, with the influence coefficients of −0.0072 and −0.0815, respectively. It shows that rising housing prices will inhibit the upgrading of industrial structure by crowding out bank credit funds. Compared with the advanced industrial structure, the housing price has a significant partial intermediary effect on the rationalization of industrial structure through the crowding of foreign capital, with an influence coefficient of –0.0033, indicating that the housing price has a restraining effect on the rationalization of industrial structure through the crowding of foreign capital. It can be seen that housing price inhibits the upgrading of industrial structure through the crowding of bank credit capital and foreign capital, which is consistent with Hypothesis 1.

3.3.2. Land Financial Dependence

The dependence of local government on land finance will push up housing price, and the rise in housing price will further increase the dependence of local land finance through its economic benefits. This paper first examines the mediating effect of national housing price on industrial structure upgrading through land finance dependence and then explores the differences of housing price on industrial structure upgrading through land finance in different regions with different housing price levels.
  • National level
The sampling test results at the national level are shown in Table 6. With the addition of real estate tax, the dependence coefficient of housing price on land finance increases, and the negative mediating effect of land finance on the upgrading of industrial structure also increases.
When both land transfer fees and real estate taxes are taken into account, the influence coefficients between housing price and land fiscal dependence are significant at the level of 1%, indicating a strong positive feedback effect between the two. Among them, the influence coefficient of housing price on land finance dependence is 0.304, and that of land finance dependence on housing price is 0.0860, indicating that housing price has a stronger influence on land finance. The influence coefficient of housing price on land fiscal dependence is positive, indicating that the rise of housing price will indeed promote the increase in land fiscal dependence of local governments and increase the fiscal revenue of local governments through land transfer income and taxes related to real estate industry. Under the dual incentive of fiscal decentralization and promotion and assessment mechanism of local officials, the dependence on land finance is more obvious (Wang and Wu [13]).
After the addition of land fiscal dependence, housing price is still significant to the rationalization and upgrading of industrial structure. At the same time, land fiscal dependence is significant to both of the two indicators of industrial structure upgrading at the level of 1%, so it can be concluded that land fiscal dependence has a significant partial intermediary effect. Its effects on the rationalization of industrial structure and the upgrading of industrial structure are −0.0049 and −0.0727, respectively, indicating that the increase in housing price inhibits the upgrading of industrial structure by enhancing the dependence of land finance. A large amount of fiscal revenue becomes a chip in the competition of local political achievements, and the investment behavior with political color and bias hinders the diversification of industrial structure and inhibits the upgrading of industrial structure.
  • Areas with different house prices
The mediating effects of land finance on industrial structure are different in regions with different housing prices (as shown in Table 7).
First of all, there is no significant correlation between housing price and land fiscal dependence in areas with high housing price, medium housing price, and moderately low housing price, so the test of intermediary effect is terminated. Table 6 only shows the empirical results of areas with moderate to high price and low housing price where the intermediary effect is consistent. In both areas with moderate to high price and low housing price, housing price has a positive promoting effect on land fiscal dependence, and land fiscal dependence still has a negative intermediary effect on industrial structure upgrading, which is consistent with the empirical conclusion at the national level, indicating that this conclusion has a strong robustness.
Second, in areas with moderate to high price, the impact coefficient of housing price on land fiscal dependence is 1.106, much higher than 0.510 in areas with low housing price, indicating that the higher the housing price is, the more attractive it is for local governments to increase fiscal revenue through land transfer and land-related taxes. In addition, the higher the housing price is, the stronger the intermediary effect of land fiscal dependence on the upgrading of industrial structure. In the areas with moderate to high price, the housing price has a partial intermediary effect on the upgrading of industrial structure through land fiscal dependence, and the influence coefficient is −0.8339. In low housing price areas, land fiscal dependence degree has a partial mediating effect on the rationalization of industrial structure and has a complete mediating effect on the upgrading of industrial structure, with the influence coefficients of −0.0108 and −0.0811, respectively.
Therefore, the higher the house prices, the more obvious the inhibitory effect of land financial dependence on industrial structure upgrading. When adjusting the industrial structure layout, the upgrade has a stronger destructive effect (Shao et al., 2016). Housing prices rose under reasonable control and were reduced through the land financial dependency due to the negative influence on the industrial structure upgrade.

3.3.3. Consumption Upgrade

Although the government’s focus on real estate regulation has gradually shifted from the demand side to the supply side, this does not mean that the importance of demand-side reforms has diminished. The government is still committed to accelerating the introduction of long-term rental housing and affordable housing policies, while maintaining the basic stability of housing prices. At the same time, it will maximize the consumption capacity of residents and release their consumption potential and form a dynamic balance of “demand pulling supply, supply creating demand”, improving the overall efficiency of the national economic system and helping to optimize and upgrade the industrial structure. Therefore, it is particularly necessary to study the impact of housing prices on the industrial structure through the upgrading of residents’ consumption. The upgrade of residents’ consumption includes not only the improvement in the consumption level but also the improvement in the consumption structure. This paper studies the mediating effect of housing prices on the upgrading of industrial structure by affecting residents’ consumption from two aspects: the level of residents’ consumption and the structure of residents’ consumption.
It can be seen from Table 8 that rising house prices can improve the consumption level of residents. As the price of real estate continues to rise, it has higher mortgage value and transfer value, which improves the net asset wealth of the holder and increases current consumption, that is, the rise in housing prices has exerted a positive “wealth effect”. Some homeless people postponed or even gave up the idea of buying a house, so that they have greater spending power in the current period; that is, the rise in housing prices has played out a “desperate consumption effect”. Of course, the positive effect of the state’s position on “adhering to the fact that houses are for living in, not for speculation” and a series of related safeguard measures on residents’ consumption cannot be ignored. Housing prices can affect the upgrading of the industrial structure through the improvement in residents’ consumption level and, especially, have a significant mediating effect on the rationalization of the industrial structure. The guarantee has driven the upgrading of the industrial structure from the demand side. The improvement of residents’ consumption level is one of the manifestations of the expansion of residents’ consumption demand. The increase in consumption “volume” and the existence of consumption potential provide a strong impetus for the production of enterprises. In order to meet the needs of consumers, related industries will inevitably choose to increase production, and increased operational efficiency and resource utilization have further optimized the industrial structure (Jiang and Jiang [32]).
If the consumption level is representative of the “quantity” of the residents’ consumption, then the consumption structure is representative of the “quality” of the residents’ consumption. Housing prices have different effects on different types of consumption structures. From Table 9, it can be seen that rising housing prices inhibit subsistence consumption, but promote developmental consumption and enjoyment consumption, and the promotion effect on enjoyment consumption is greater than that on developmental consumption enhancement. With the development of China’s social economy and the increase in residents’ income, as well as the positive wealth effect and desperate consumption effect brought by housing prices on residents’ consumption, residents’ consumption capacity has been improved. The basic consumption of food, clothing, housing, and transportation has begun to focus on the improvement of the quality of life and pursues emerging service consumption. Therefore, the proportion of expenditure on survival consumption will be reduced, and the demand for development and enjoyment consumption materials will continue to increase (Wang et al. [33]).
Among the three types of consumption, enjoyment consumption, which can best represent the optimization of residents’ consumption structure, has a positive mediating effect on the rationalization of industrial structure, and its influence coefficient is 0.0023. The effect is not significant. It shows that the higher the degree of optimization and upgrading of the residents’ consumption structure, the stronger the guiding role of the adjustment of the industrial structure.

4. Discussion

4.1. Main Conclusions and Discussion

Based on the data of 31 provinces in China from 2005 to 2019, this paper analyzes the mediation effect by building a panel data model based on the multidimensional measurement of industrial structure upgrading. Some interesting results were found.
Firstly, there is a U-shaped relationship between housing prices and industrial structure upgrades from the national level. A reasonable increase in regional housing prices has a certain role in promoting industrial structure upgrading and can effectively promote the rationalization of regional industrial structures and the development of advanced industrial structures. Too low housing prices will inhibit industrial structure upgrading; housing prices will also exert different intermediary effects on the upgrading of the industrial structure through different influence paths.
Secondly, rising housing prices will exacerbate the real estate industry’s crowding out of financial resources and inhibit the upgrading of the industrial structure. However, since the rise in housing prices will increase the mortgage value of real estate, it can release some financing constraints to a certain extent and enhance the investment ability, even if the real estate industry will crowd out the original fixed investment of enterprises. It will also result in “re-transfusion” of the enterprise, which has a certain role in guaranteeing the fixed investment in the non-real estate industry.
Thirdly, the continuous rise in house prices will bring a lot of fiscal revenue to the local government through the land transfer fee income and real estate-related tax revenue. Under the dual incentives of fiscal decentralization, the local government’s increasing dependence on land finance has also provided a bargaining chip for intensifying their performance competition. To obtain high GDP, the old-fashioned industrialization investment is favored, thus hindering the industrial structure and diversified development. Moreover, in places with higher housing prices, the degree of financial dependence is stronger, and the inhibitory effect on the adjustment and upgrading of the industrial structure is more obvious.
Finally, the rise in housing prices will effectively improve the overall consumption level of residents and expand the scale of consumption through the wealth effect and consumption despair effect. It can optimize residents’ consumption structure by promoting development-oriented consumption and enjoyment-oriented consumption. At the same time, the double upgrade of residents’ consumption level and consumption structure has produced a positive intermediary effect on the upgrading of industrial structure and promote enterprises to improve operation efficiency and resource utilization. Expanding production to meet the growing consumer demand of residents and promoting the upgrading of products have driven the optimization and upgrading of the industrial structure.

4.2. Policy Implication

The above research conclusions have an important guiding role for local governments to regulate housing prices from different levels and upgrade the industrial structure.
Firstly, the reasonable rise in housing prices has a certain role in promoting the upgrading of the industrial structure. On the one hand, it is necessary to respect and make good use of this law to appropriately guide the housing prices to rise within a reasonable range according to the development level of the regional real estate market, so as to realize the coordination between housing prices and the upgrading of the industrial structure. On the other hand, it is necessary to comprehensively use various measures to strictly control the excessively rapid rise in housing prices in the region and strictly abide by the national keynote of “housing to live without speculation“. We need to adjust and control the economic levers, crack down on behaviors that disrupt the order of the real estate market, such as occupying land and driving up house prices, and control the rise in house prices within a reasonable range, so that it can continue to play a benign role in the upgrading of the industrial structure.
Secondly, the development and growth of the industry is inseparable from sufficient financial support. For the government, it is necessary to stick to the “three red lines” of real estate financing and reasonably control the rise in housing prices to avoid the real estate industry occupying too much financial resources and causing the real industry to hollow out. At the same time, this can be done by deepening the reform of factor market allocation, promoting the optimization and matching of financial resource factors, and guiding capital to flow into industries with higher efficiency and better growth; for banks, on the one hand, they should not blindly pursue profits, but also focus on real estate development. The loan adheres to the principles of “limit management” and “selecting the best among the best”. On the other hand, it must undertake more social responsibilities, improve the efficiency of bank credit funds to support the real economy, support rigid demand, curb speculative demand, and help regional industrial structure. Upgrading, for enterprises, before pursuing a high return on investment, they should give priority to ensuring sufficient fixed investment funds for their own development and increase investment in technological innovation and talent recruitment, so as to provide a strong backup force for enterprise development and transformation. The key to providing “soft power” information for further expansion of other non-bank financing channels such as foreign investment.
Thirdly, excessive dependence on land finance is detrimental to the diversified development of the regional industrial structure. It is required to make better use of the policy toolbox, improve the “three stability” working mechanism, optimize land transfer rules, and especially improve the real estate-related tax system. Housing enterprises participating in the reform of the rental market can be given certain tax reductions and tax exemptions to promote the development of rental housing and help achieve the goal of “housing to live without speculation“. It is necessary not only to strengthen the management of the source of land finance, but also to strengthen the supervision of its expenditure, to ensure high transparency from the collection to the use and try to prevent the local government from over-reliance on land finance and thus hinder the process of upgrading the local industrial structure. In addition, it is necessary to further optimize the performance evaluation standards of local government officials. It is not possible to “only rely on GDP”, but to comprehensively measure from various aspects, such as resource utilization efficiency, capital investment in infrastructure facilities, social welfare development level, etc., and effectively contribute to the regional industrial structure. Upgrading provides government support and, to a certain extent, relieves on the pressure of being forced to increase financial dependence on land due to excessive pursuit of high political achievements.
Finally, the improvement in consumption level and consumption structure play a leading role in the upgrading of industrial structure from the demand side. From a macro perspective, it is necessary to further deepen the reform of the demand side, so as to further expand consumption capacity and release consumption potential. Supply-side reforms also need to be carried out simultaneously, expanding the supply of domestic mid-to-high-end consumer goods industries through institutional innovation and increasing the proportion of independent technology industries through technological innovation, so as to provide reliable support for the domestic consumption demand pattern. From a micro perspective, it is required to improve the industrial integration, and the coordination of the industrial chain links can improve production efficiency while ensuring the matching degree of production supply and consumption demand. In order to continuously meet the people’s increasingly escalating multi-level, high-quality, and diversified consumption needs, build a high-quality supply system, realize the survival of the fittest in the industry, and promote industrial innovation and upgrading.
Combined with the positioning of “housing to live without speculation”, proposed many times by the state, it is of great practical significance to study how housing prices affect the upgrading of industrial structure, which is of great significance to respond to the call of “solving the existing industrial structure problems and optimizing the industrial structure” proposed by the 14th Five-Year Plan. However, this paper inevitably has some limitations: on the one hand, the sample size used in this paper is not specific enough. Although this article more comprehensively selects the related data of 31 provinces and cities nationwide, in terms of research contents, there should be more research within the scope of urban housing prices’ influence on industrial structure upgrade, but because most of the data, such as bank credit funds, land, finance, and consumer data for the provinces and cities across the country, is unified at the local level; therefore, provincial data has been generally selected for empirical research. On the other hand, the timeliness of the data is insufficient. Due to the impact of COVID-19, the statistical data of many databases have only been updated through 2019, which may lead to some deviation between empirical results and the current actual situation. Therefore, the future research direction can be based on the updated data to carry out further research in cities across the country, so as to more accurately analyze the influential mechanism of housing prices on the upgrading of industrial structure under three different paths.

Author Contributions

Conceptualization, X.X.; methodology, Y.P.; software, Y.P.; formal analysis, B.Y.; investigation, X.X.; resources, X.X.; data curation, B.Y.; writing—original draft preparation, B.Y.; writing—review and editing, X.X.; funding acquisition, B.Y. All authors have read and agreed to the published version of the manuscript.

Funding

This research was funded by the National Social Science Fund General Project: Collaborative Mechanism and Policy Research of “Double Upgrade” of Industry and Consumption (No. 20BJL112).

Institutional Review Board Statement

Not applicable.

Informed Consent Statement

Not applicable.

Data Availability Statement

Please request from the author if necessary.

Conflicts of Interest

The authors declare no conflict of interest.

References

  1. Xu, X.; Yang, H.; Li, C. Theoretical Model and Actual Characteristics of Air Pollution Affecting Health Cost: A Review. Int. J. Environ. Res. Public Health 2022, 19, 3532. [Google Scholar] [CrossRef] [PubMed]
  2. Cao, Z.; Li, S. On the Strategic Position of Real Estate Industry in China’s Industrial Structure Adjustment. Nankai Econ. Res. 1995, 6, 3–9. [Google Scholar]
  3. Xia, M. Looking at the impact of real estate development on China’s economy from input-output data. Econ. Dyn. 2009, 11, 11–15. [Google Scholar]
  4. Lu, W.; Ji, X. Urban housing prices, financial development and industrial structure upgrading: An empirical study based on panel data of prefecture-level cities in China. Sankei Rev. 2017, 8, 81–94. [Google Scholar]
  5. Gu, Q.; Shi, W.; Wang, H. An Empirical Study on the Impact of Industrial Structure on Real Estate Prices. Bus. Res. 2015, 2, 44–52. [Google Scholar]
  6. Lin, Y.; Lv, P. Research on the mechanism of housing price differences affecting the advanced industrial structure—Analysis framework based on the core-periphery model. Mod. Manag. Sci. 2017, 12, 24–26. [Google Scholar]
  7. Guo, W.; Li, J. Analysis on the mechanism and effect of housing price fluctuation on industrial structure upgrading. J. Guangdong Univ. Financ. Econ. 2019, 3, 14–25. [Google Scholar]
  8. Zhang, Y.; Zhang, W. Analysis of China’s real estate market from the perspective of resource allocation. Int. Financ. 2011, 8, 63–70. [Google Scholar]
  9. Chen, T.; Liu, L.; Zhou, L. The Crowding-Out Effects of Real Estate Shocks: Evidence from China. 2015. Available online: https://papers.ssrn.com/sol3/papers.cfm?abstract_id=2584302 (accessed on 8 May 2021).
  10. Chen, T.; He, Y.; Xie, J.; China Management Modernization Research Association. Simulative Study on Crowding-out Effect of Investment in City Real Estate Based on Systems Dynamics. In Proceedings of the 3rd (2008) Annual Conference of China Management Studies—Proceedings of Entrepreneurship and Small and Medium Enterprise Management, Changsha, China, 1–2 November 2008; Volume 7. Available online: https://www.aconf.cn/conf_5180.html (accessed on 16 November 2021).
  11. Liu, C.; Wang, R. Will rising housing prices inhibit the upgrading of regional industrial structure? Ind. Econ. Res. 2019, 2, 102–113. [Google Scholar]
  12. Lin, G.C.; Ho, S.P. The State, Land System, and Land Development Processes in Contemporary China. Ann. Am. Assoc. Geogr. 2008, 95, 411–436. [Google Scholar] [CrossRef]
  13. Wang, X.; Wu, L. Land finance, housing price rise and industrial structure upgrade: Analysis based on panel data simultaneous equation model. Econ. Probl. Explor. 2019, 3, 32–39. [Google Scholar]
  14. Song, D.; Tao, X. Does Land Finance Affect Industrial Upgrading: A Test Based on the Mediation Effect of Infrastructure and Housing Prices. Financ. Account. Mon. 2019, 20, 103–112. [Google Scholar]
  15. Jiang, S.; Liu, S.; Li, Q. Land System Reform and National Economic Growth. Manag. World 2007, 9, 1–9. [Google Scholar]
  16. Yang, W.; Kong, X.; Zhu, S. Research on the Influence of Land Finance on Industrial Structure Upgrade. Financ. Dev. Res. 2018, 5, 44–49. [Google Scholar]
  17. Li, J. Has the “house slave effect” led to a downturn in residents’ consumption? Econ. Q. 2018, 17, 405–430. [Google Scholar]
  18. Tabuchi, T. Urban Agglomeration and Dispersion: A Synthesis of Alonso and Krugman. J. Urban Econ. 1998, 44, 333–351. [Google Scholar] [CrossRef] [Green Version]
  19. Xu, X.; Wang, Q.; Li, C. The impact of dependency burden on urban household health expenditure and its regional heterogeneity in China: Based on quantile regression method. Front. Public Health 2022, 10, 876088. [Google Scholar] [CrossRef]
  20. Aoki, K.; Proudman, J.; Vlieghe, G. House prices, consumption, and monetary policy: A financial accelerator approach. J. Financ. Int. 2004, 13, 414–435. [Google Scholar] [CrossRef]
  21. Iacoviello, M.; Neri, S. Housing Market Spillovers: Evidence from an Estimated DSGE Model. Am. Econ. J. Macroecon. 2010, 2, 125–164. [Google Scholar] [CrossRef] [Green Version]
  22. Du, L.; Luo, J. How rising housing prices affect the consumption propensity of urban residents in China: A study based on the two-stage optimal consumption model of households. Financ. Trade Econ. 2017, 38, 67–82. [Google Scholar]
  23. Wang, K.; Pang, Z. The impact of rising house prices on household consumption in China: Wealth effect or crowding out effect? East China Econ. Manag. 2019, 33, 102–107. [Google Scholar]
  24. Zhang, Y. The overall and regional test of the impact of residents’ consumption capacity on the upgrading of China’s industrial structure. Bus. Econ. Res. 2021, 4, 48–51. [Google Scholar]
  25. Wu, X. Heterogeneity and influencing factors of inter-provincial industrial structure upgrading: Based on the spatial panel econometric analysis of 28 provinces from 1998 to 2010. Econ. Jingwei 2014, 31, 90–95. [Google Scholar]
  26. Fu, L. An Empirical Study on the Relationship between the Advanced Industrial Structure and Economic Growth in China. Stat. Res. 2010, 27, 79–81. [Google Scholar]
  27. Wu, Q.; Li, Y. Fiscal decentralization, local government competition and land finance. Financ. Trade Econ. 2010, 7, 51–59. [Google Scholar]
  28. Gao, G. Enhancing the comprehensive carrying capacity of urban agglomeration and fostering the growth pole and power source of high-quality development. Macroecon. Manag. 2021, 11, 15–20. [Google Scholar]
  29. Chen, X. Research on the Interaction path between Housing price and bank credit in China. Shanghai Commer. 2021, 1, 50–53. [Google Scholar]
  30. Zhou, Y.; Liu, C. Research on the Influence of China’s Virtual Economy Development on the Expansion Effect of Real Economy Investment. J. Shanxi Univ. Financ. Econ. 2014, 36, 21–32. [Google Scholar]
  31. Chaney, T.; Sraer, D.; Thesmar, D. The Collateral Channel: How Real Estate Shocks Affect Corporate Investment. Am. Econ. Rev. 2012, 102, 2381–2409. [Google Scholar] [CrossRef] [Green Version]
  32. Jiang, H.; Jiang, P. Research on the effect of digital inclusive finance on the improvement of household consumption level and structural optimization. Mod. Financ. Econ.—J. Tianjin Univ. Financ. Econ. 2020, 40, 18–32. [Google Scholar]
  33. Wang, W.; Liu, Z.; Gong, F. The impact of high housing prices on the upgrading of consumption structure: An empirical study based on 35 large and medium-sized cities. Acad. Res. 2017, 8, 87–94, 177–178. [Google Scholar]
Figure 1. Housing price–industrial structure rationalization, industrial structure advanced scatter plot. Source: Empirical results generation.
Sustainability 14 05731 g001
Table 1. Comparison of real estate taxes in different countries.
CountriesTaxThe Tax BaseRate
China
(naming only the five most common types)
Property tax(Holder) Original value of real Estate × (70~90%)1.2%
Lease rent4%
Urban land use tax2~20 YUAN/m2/year × actual occupied land area
Land value added taxIndividual sales of housing are exempt
Farmland occupation taxTax shall be calculated on the basis of the area of cultivated land actually occupied by the taxpayer and at the applicable fixed tax rate
Deed taxTransfer turnover1~3%
AmericaReal estate taxBased on a certain proportion of the assessed value of real estate, the nominal tax rate is 0.3–3%, and the actual tax rate is 0.27–2.4%
Rental income taxFederal tax rates range from 10% to 37%, and state top marginal tax rates range from 2.9% to 13.3%
Real estate transfer taxReal estate transfer tax: the transaction value of real estate is the tax base, and the state tax rate is 0.01~3%
Record taxes/fees: the transaction value of real estate is the tax base, and the state tax rate is 0.3~1.45%
Mortgage tax: The mortgage amount is the tax base, with state tax rates ranging from 0.02% to 1.05%
Capital gains taxTransfer after less than 1 year of ownership: federal tax rates from 10% to 37%, state top marginal tax rates from 2.9% to 13.3%
Transfer after more than 1 year of ownership: Federal tax rates 0 to 20%, the highest combined federal and state tax rates 20 to 40% for each state in 2018
BritainLand stamp dutyReal estate valueFirst house or change of house:0~12% (over progressive), the tax rate of the second house and above will be increased by 3 or 4 percentage points
Capital gains taxHousing value minus acquisition and transaction costsThe basic tax rate is 18%, and the high salary and additional tax rate is 28%
Inheritance taxGift and posthumous estate within 7 years prior to deathInheritance tax rate of 40%, 8~40% gift before death
Municipal tax8 classes by 1991 house prices (Wales: 9 classes by 2003 house prices)The tax multiplier is 6/9~21/9
Individual income taxRent Net income after maintenance, etc.Included in the scope of individual income tax collection, the implementation of four levels of excess progressive tax rates: 0, 20%, 40%, and 45%
SingaporeStamp dutyBuyer’s stamp dutyContract price or market price (higher)1~4% (grade 4 progressive)
Seller’s stamp duty0~16% (five progressive levels)
Additional stamp duty0~30% (subject by subject)
Stamp duty on leasingActual or market rent (higher)0.4%
Income taxSellProfitsInclude personal income, comprehensive tax (0~20%)
RentThe balance of rent after deducting mortgage, property taxes, maintenance, etc.
Property taxAnnual housing value (annual rent)0~20% (progressive, distinguish between owner-occupiers and non-owner-occupiers)
Source: Compiled by the authors through the internet.
Table 2. Indicator description.
Variable CategorySymbolVariable NameCalculation Method
Explained variableSRERationalization of industrial structureThe proportion of the output value of each industry is multiplied by its respective weight and then summed
SUPAdvanced industrial structureIt is derived from the Moore structure value calculation formula
Explanatory variablesHPHouse priceCommercial housing sales/Commercial housing sales area
Mediating variableMFRFixed investment capital squeezeReal estate investment/Fixed asset investment in the whole society
CREBank credit capital squeezeReal estate loan/Loan balance of banking financial institutions
FORCrowding of foreign investment fundsReal estate utilizes foreign capital/Total foreign investment
LANDLand financial dependence (1)Land transfer fee/General budget revenue
FINLand financial dependence (2)(land transfer fee + real estate tax)/General budget revenue
CONResident consumption levelPer capita consumption expenditure of local residents
SURProportion of subsistence consumption(Per capita food consumption expenditure + Per capita clothing consumption expenditure + Per capita housing consumption expenditure)/Total per capita consumption expenditure of residents
DEVProportion of developmental consumption(Per capita transportation and communication consumption expenditure + Health care consumption expenditure per capita + Consumption of equipment, supplies and services)/Total per capita consumption expenditure of residents
ENJThe proportion of enjoyment consumption(Per capita expenditure on education, culture and entertainment + Other Goods and Services Consumption Expenditure)/Total per capita consumption expenditure of residents
Control variableTECTechnological innovationNumber of granted invention patent applications
TRALevel of openingTotal import and export/Regional GDP
FISFinancial expenditurelocal government spending
HCHuman capitalNumber of students in regular institutions of higher learning per 100,000 people
URBUrbanization rateurban population/Total population
Source: compiled by the author.
Table 3. Descriptive statistics for variables.
Variable.MaxMinMeanStd.dev.Number
LnSRE1.04100.69050.84030.0577465
LnSUP3.6849−2.59352.08100.7164465
LnHP10.48867.33228.50130.5875465
LnMFR−0.5848−4.6108−1.83230.5730465
LnCRE−2.5737−8.2570−4.13680.7690465
LnFOR−1.4247−12.9914−5.54092.2256465
LnFIN17.22206.589014.04171.5381465
LnCON10.72787.93389.24970.5846465
LnSUR−0.2637−0.8534−0.52010.0755465
LnDEV−1.0675−1.8330−1.34830.1187465
LnENJ−1.5674−2.7592−1.97930.1770465
LnTEC10.99781.38637.26301.7993465
LnTRA−1.4088−6.2997−3.66310.9836465
LnFIS9.75835.01897.80800.9005465
LnHC5.5081−1.96011.46501.4233465
LnURB−0.1098−1.5678−0.66990.2798465
Source: Empirically based on software.
Table 4. Regression results of the impact of housing prices on industrial structure upgrading.
lnSRElnSUP
(1)(2)(3)(4)(5)(6)(7)(8)
lnHP0.0843 ***
(0.0035)
0.0637 ***
(0.0081)
−0.215 ***
(0.0608)
−0.237 ***
(0.0537)
0.131 **
(0.0537)
0.350 ***
(0.123)
−3.671 ***
(0.946)
−2.674 ***
(1.022)
lnHP 2 0.0169 ***
(0.0034)
0.0151 ***
(0.0030)
0.215 ***
(0.0534)
0.167 ***
(0.0562)
lnTEC −0.0466 ***
(0.0037)
−0.0462 ***
(0.0036)
−0.0795
(0.0698)
−0.0751
(0.0692)
lnTRA 0.0031
(0.0026)
0.0058 **
(0.0026)
−0.155 ***
(0.0482)
−0.126 **
(0.0488)
lnFIS 0.0538 ***
(0.0059)
0.0539 ***
(0.0058)
0.0706
(0.110)
0.0721
(0.110)
lnHC 0.0664 ***
(0.0044)
0.0642 ***
(0.0043)
0.138 *
(0.0828)
0.114
(0.0825)
lnURB −0.0436 ***
(0.0086)
−0.0343 ***
(0.0086)
−0.169
(0.161)
−0.0664
(0.163)
Constant0.123 ***
(0.0296)
0.346 ***
(0.0697)
1.440 ***
(0.268)
1.580 ***
(0.251)
0.967 **
(0.457)
−1.749
(1.302)
17.68 ***
(4.177)
11.96 **
(4.778)
Observations465465465465465465465465
R−squared0.5670.7160.5890.7310.0130.0500.0480.069
Number of id1531151515311515
Note: The numbers in brackets are t statistics; ***, **, and * represent rejection of the null hypothesis at the 1%, 5%, and 10% significance levels, respectively. Source: Empirical results generation.
Table 5. The results of the mediation effect test of the impact of housing prices on the industrial structure upgrading through the squeeze of financial resources.
VariableFixed Investment Capital SqueezeBank Credit Capital SqueezeCrowding of Foreign Investment Funds
lnMFR
(1)
lnSRE
(2)
lnSUP
(3)
lnCRE
(4)
lnSRE
(5)
lnSUP
(6)
lnFOR
(7)
lnSRE
(8)
lnSUP
(9)
lnHP1.027 ***
(0.0840)
0.0385 ***
(0.0076)
0.125
(0.141)
0.868 ***
(0.136)
0.0423 ***
(0.0068)
0.431 ***
(0.128)
0.916 **
(0.407)
0.0377 ***
(0.0066)
0.370 ***
(0.126)
lnMFR −0.0034
(0.0037)
0.219 ***
(0.0691)
lnCRE −0.0083 ***
(0.0023)
−0.0939 **
(0.0428)
lnFOR −0.0036 ***
(0.0008)
−0.0122
(0.0147)
lnTEC0.617 ***
(0.0475)
−0.0445 ***
(0.0044)
−0.214 ***
(0.0812)
0.979 ***
(0.0771)
−0.0385 ***
(0.0043)
0.0125
(0.0812)
1.962 ***
(0.234)
−0.0402 ***
(0.0040)
−0.0536
(0.0773)
lnTRA−0.113 ***
(0.0328)
0.0028
(0.0026)
−0.130 ***
(0.0484)
−0.0249
(0.0532)
0.0029
(0.0026)
−0.157 ***
(0.0480)
−0.627 ***
(0.163)
0.0014
(0.0027)
−0.169 ***
(0.0508)
lnFIS−0.748 ***
(0.0752)
0.0513 ***
(0.0065)
0.234 *
(0.121)
−1.216 ***
(0.122)
0.0436 ***
(0.0065)
−0.0436
(0.122)
−1.873 ***
(0.368)
0.0481 ***
(0.0061)
0.0507
(0.116)
lnHC−0.565 ***
(0.0563)
0.0645 ***
(0.0049)
0.262 ***
(0.0908)
−0.776 ***
(0.0913)
0.0599 ***
(0.0047)
0.0653
(0.0889)
−1.545 ***
(0.274)
0.0612 ***
(0.0046)
0.115
(0.0871)
lnURB0.688 ***
(0.110)
−0.0413 ***
(0.009)
−0.320 *
(0.166)
0.296 *
(0.178)
−0.0411 ***
(0.0085)
−0.142
(0.161)
2.286 ***
(0.547)
−0.0353 ***
(0.0089)
−0.121
(0.171)
Constant−8.329 ***
(0.886)
0.318 ***
(0.0763)
0.0712
(1.411)
−7.881 ***
(1.436)
0.281 ***
(0.0710)
−2.490 *
(1.339)
−11.48 ***
(4.310)
0.309 ***
(0.0696)
−2.011
(1.333)
Observations465465465465465465465465465
R_squared0.6720.7160.0710.4950.7240.0610.3060.7330.053
Note: The numbers in brackets are t statistics; ***, **, and * represent rejection of the null hypothesis at the 1%, 5%, and 10% significance levels, respectively. Source: Empirical results generation.
Table 6. Test results of the mediation effect of the national sample house price on the industrial structure upgrading through the dependence of land finance.
VariableLand Financial Dependence (1)
(Only the Land Transfer Fee is Considered)
Land Financial Dependence (2)
(Consider Both Land Transfer Fees and Real Estate Taxes)
lnLAND
(1)
lnSRE
(2)
lnSUP
(3)
lnHP
(4)
lnFIN
(5)
lnSRE
(6)
lnSUP
(7)
lnHP0.262 *
(0.144)
0.0362 ***
(0.0066)
0.396 ***
(0.121)
0.304 ***
(0.0880)
0.0400 ***
(0.0066)
0.422 ***
(0.123)
lnLAND −0.0044 **
(0.0022)
−0.178 ***
(0.0399)
lnFIN 0.0860 ***
(0.0249)
−0.0162 ***
(0.0035)
−0.239 ***
(0.0657)
lnTEC1.096 ***
(0.0813)
−0.0418 ***
(0.0044)
0.116
(0.0812)
−0.221 ***
(0.0336)
0.915 ***
(0.0498)
−0.0317 ***
(0.0049)
0.139
(0.0914)
lnTRA0.0064
(0.0562)
0.00316
(0.0026)
−0.154 ***
(0.0472)
0.208 ***
(0.0154)
−0.0272
(0.0344)
0.0027
(0.0025)
−0.162 ***
(0.0476)
lnFIS−1.289 ***
(0.129)
0.0481 ***
(0.0065)
−0.159
(0.120)
0.143 ***
(0.0482)
−0.982 ***
(0.0788)
0.0378 ***
(0.0067)
−0.164
(0.127)
lnHC−0.969 ***
(0.0964)
0.0621 ***
(0.0049)
−0.0343
(0.0898)
0.386 ***
(0.0354)
−0.971 ***
(0.0590)
0.0506 ***
(0.0055)
−0.0939
(0.104)
lnURB0.431 **
(0.188)
−0.0417 ***
(0.0086)
−0.0926
(0.159)
0.0176
(0.0670)
1.090 ***
(0.115)
−0.0259 ***
(0.0092)
0.0912
(0.174)
Constant−0.544
(1.516)
0.344 ***
(0.0694)
−1.846
(1.275)
9.315 ***
(0.221)
−0.852
(0.928)
0.332 ***
(0.0682)
−1.953
(1.285)
Observations465465465465465465465
R−squared0.3660.7180.0910.8210.5780.7290.078
Note: The numbers in brackets are t statistics; ***, **, and * represent rejection of the null hypothesis at the 1%, 5%, and 10% significance levels, respectively. Source: Empirical results generation.
Table 7. Test results of the mediating effect of housing prices in different regions on the impact of land finance dependence on industrial structure upgrading.
VariableHigh Housing PricesModerate to High PriceMedium Housing PriceModerately Low PriceLow Housing Price
LnFIN
(1)
lnFIN
(2)
lnSRE
(3)
lnSUP
(4)
lnFIN
(5)
lnFIN
(6)
lnFIN
(7)
lnSRE
(8)
lnSUP
(9)
lnHP1.261
(0.834)
1.106 ***
(0.332)
0.0651 **
(0.0283)
1.150 **
(0.467)
−1.999
(1.110)
0.449
(0.631)
0.510 **
(0.217)
0.0333 ***
(0.0134)
0.345
(0.251)
lnFIN 0.0136
(0.0120)
−0.754 ***
(0.199)
−0.0211 ***
(0.0039)
−0.159 **
(0.0725)
lnTEC1.007
(5.812)
−0.0640
(0.250)
−0.0080
(0.0188)
0.922 ***
(0.311)
3.835
(2.805)
0.179
(0.316)
0.802 ***
(0.0853)
0.0011
(0.0060)
0.202 *
(0.112)
lnTRA0.132
(1.057)
−0.161
(0.161)
−0.0305 **
(0.0122)
1.675 ***
(0.202)
1.512
(1.363)
0.133
(0.0859)
−0.101 **
(0.0483)
−0.00555 *
(0.0030)
−0.0607
(0.0558)
lnFIS0.262
(2.146)
−0.0348
(0.316)
0.0482 **
(0.0238)
−1.879 ***
(0.393)
−3.761 *
(2.020)
−0.361
(0.441)
−0.791 ***
(0.136)
−0.0150 *
(0.0089)
−0.287 *
(0.166)
lnHC−0.827
(5.231)
0.527 *
(0.271)
0.0011
(0.0213)
−0.985 ***
(0.353)
−4.425
(3.361)
−0.764 ***
(0.243)
−0.777 ***
(0.111)
0.0111
(0.0074)
−0.113
(0.139)
lnURB−7.689
(17.71)
−2.887 ***
(0.552)
0.224 ***
(0.0541)
−3.154 ***
(0.895)
3.620
(6.449)
1.887 ***
(0.574)
0.977 ***
(0.134)
−0.0196 **
(0.0090)
0.132
(0.169)
Constant−22.80
(42.76)
−13.26 ***
(2.799)
−0.0017
(0.264)
3.270
(4.367)
30.26
(16.91)
−0.401
(4.922)
−03.861 **
(1.824)
0.576 ***
(0.112)
−0.120
(2.106)
Observations306060603075270270270
R_squared0.7300.7100.9160.8200.8470.5640.6420.3800.039
Note: The numbers in brackets are t statistics; ***, **, and * represent rejection of the null hypothesis at the 1%, 5%, and 10% significance levels, respectively. Source: Empirical results generation.
Table 8. The results of the mediation effect test of the impact of housing prices on the upgrading of the industrial structure through the upgrading of household consumption levels.
VariablelnCON
(1)
lnSRE
(2)
lnSUP
(3)
lnHP0.327 ***
(0.0327)
0.0461 ***
(0.0110)
0.925 ***
(0.193)
lnCON 0.0533 ***
(0.0146)
0.0153
(0.257)
lnTEC0.241 **
(0.0956)
0.120 ***
(0.0292)
0.268
(0.512)
lnTRA−0.0877 ***
(0.0118)
0.00251
(0.0038)
−0.192 ***
(0.0664)
lnFIS0.244 ***
(0.0249)
−0.0471 ***
(0.0083)
−0.0897
(0.146)
lnHC−0.169 *
(0.0958)
−0.111 ***
(0.0291)
−0.0400
(0.511)
lnURB0.868 ***
(0.0770)
0.0425
(0.0266)
−0.360
(0.466)
Constant3.325 ***
(0.461)
−0.350 **
(0.148)
−8.060 ***
(2.592)
Observations465465465
R_squared0.9800.6890.680
Note: The numbers in brackets are t statistics; ***, **, and * represent rejection of the null hypothesis at the 1%, 5%, and 10% significance levels, respectively. Source: Empirical results generation.
Table 9. The results of the mediation effect test of the impact of housing prices on the upgrading of the industrial structure through the upgrading of household consumption structure.
VariableSubsistence ConsumptionDevelopmental ConsumptionEnjoyment Consumption
lnSUR
(1)
lnSRE
(2)
lnSUP
(3)
lnDEV
(4)
lnSRE
(5)
lnSUP
(6)
lnENJ
(7)
lnSRE
(8)
lnSUP
(9)
lnHP−0.0385 *
(0.0217)
0.0637 ***
(0.0101)
0.934 ***
(0.174)
0.0637 **
(0.0263)
0.0624 ***
(0.0101)
0.936 ***
(0.175)
0.108 ***
(0.0406)
0.0611 ***
(0.0101)
0.950 ***
(0.175)
lnSUR 0.00589
(0.0224)
0.0876
(0.387)
lnDEV 0.0175
(0.0184)
−0.0977
(0.319)
lnENJ 0.0215 *
(0.0119)
−0.179
(0.206)
lnTEC0.198 ***
(0.0635)
0.132 ***
(0.0298)
0.254
(0.514)
−0.480 ***
(0.0770)
0.142 ***
(0.0307)
0.225
(0.530)
−0.103
(0.119)
0.135 ***
(0.0293)
0.253
(0.508)
lnTRA−0.0003
(0.0078)
−0.0022
(0.0036)
−0.194 ***
(0.0624)
−0.0284 ***
(0.0095)
−0.0017
(0.0037)
−0.196 ***
(0.0631)
0.0097
(0.0146)
−0.0024
(0.0036)
−0.192 ***
(0.0624)
lnFIS0.0370 **
(0.0165)
−0.0343 ***
(0.0077)
−0.0892
(0.133)
−0.0049
(0.0200)
−0.0340 ***
(0.0077)
−0.0864
(0.132)
−0.223 ***
(0.0309)
−0.0293 ***
(0.0081)
−0.126
(0.140)
lnHC−0.187 ***
(0.0636)
−0.119 ***
(0.0298)
−0.0262
(0.514)
0.473 ***
(0.0772)
−0.128 ***
(0.0307)
0.0037
(0.531)
0.0884
(0.119)
−0.122 ***
(0.0294)
−0.0267
(0.509)
lnURB−0.422 ***
(0.0511)
0.0913 ***
(0.0255)
−0.310
(0.440)
0.565 ***
(0.0620)
0.0789 ***
(0.0259)
−0.292
(0.447)
0.833 ***
(0.0957)
0.0708 ***
(0.0256)
−0.198
(0.443)
Constant−1.932 ***
(0.306)
−0.162
(0.148)
0.0876
(0.387)
1.219 ***
(0.371)
−0.194
(0.143)
−7.890 ***
(2.478)
0.0521
(0.573)
−0.174
(0.141)
−8.000 ***
(2.445)
Observations465465465465465465465465465
R_squared0.3110.6790.6800.6350.6800.6800.3310.6810.681
Note: The numbers in brackets are t statistics; ***, **, and * represent rejection of the null hypothesis at the 1%, 5%, and 10% significance levels, respectively. Source: Empirical results generation.
Publisher’s Note: MDPI stays neutral with regard to jurisdictional claims in published maps and institutional affiliations.

