Abstract
With the continuous increase in the number of vehicles, the proportion of carbon emissions from road traffic in cities has significantly increased, putting pressure on the overall carbon emission reduction of cities The implementation of low-carbon transportation has, therefore, become crucial to urban emission reductions. Based on the situation of vehicles in Chengdu, this study uses the LEAP model to construct a road traffic development scenario in Chengdu from 2020 to 2025. The research focuses on common greenhouse gases that contribute to carbon emissions such as CO2, N2O, and CH4 from motor vehicles. With current policies being considered, we simulate and evaluate energy consumption and carbon emissions under two energy-saving and emission reduction scenarios: low carbon (LC) and strengthen low carbon (SLC). The results show that carbon emissions significantly improve under the LC scenario, and that the carbon emissions of the road traffic of Chengdu will peak before 2030 under the SLC scenario.
1. Introduction
Climate change is a common challenge that is currently being faced by human society [1]. Human activities since the Industrial Revolution, especially the cumulative emissions of CO2 due to the massive consumption of fossil energy in developed countries, have led to a significant increase in the concentration of greenhouse gases in the atmosphere and have aggravated global climate change; namely, global warming [1]. To actively respond to climate change, the China Economic Work Conference proposed to achieve carbon peaking and carbon neutrality in 2030 and 2060, respectively [2,3]. The Ministry of Ecology and Environment issued the “Guiding Opinions on Coordinating and Strengthening Work Related to Addressing Climate Change and Ecological Environmental Protection” and proposed to achieve the goal of peaking carbon dioxide emissions and carbon neutrality by optimizing the transportation structure [3]. As a central city in south-west China, Chengdu has maintained an average annual growth rate of more than 480,000 motor vehicles in the past six years [4,5]. In 2018, the number of motor vehicles in Chengdu reached more than 5.3 million [5,6,7]. Structurally, the proportion of new energy vehicles in public transportation, freight use, and civilian use has gradually increased and the contribution of new and old motor vehicles to carbon emissions has also attracted widespread attention [8].
The studies of the academic community have mainly concentrated on the impact of transportation carbon emissions using factor decomposition models, econometric models, and comprehensive models [9]. For example, Coutinho et al. [10] conducted a study on the transportation carbon emission path of The Netherlands in Amsterdam; the results showed that passenger flow had a significant impact on carbon emissions. Li et al., conducted a study on low-carbon fuels for vehicles in Sacramento, California, and the study showed that there was a negative correlation between fuel economy and vehicle carbon emissions from an urban perspective [11]. Guo et al. [10] used the LMDI method to analyze the driving factors of CO2 emissions from the transportation sector in the Beijing–Tianjin–Hebei region of China. Lv et al. [12] applied the STIRPAT model and the GWR model to analyze the driving factors of the freight carbon emissions of China as well as the impact of urbanization on freight carbon emissions. Jian et al. [13], applied the LEAP model to take the Xiamen city transportation department as an example; they constructed a Xiamen-2008 Tra traffic model using the LEAP model, studied the energy consumption from the base year of 2008 to 2030, and evaluated the consequences of various energy-saving reduction measures. Pan [14] and others used the LEAP model to analyze the energy conservation and emission reduction potential of the transportation sector in the Henan Province of China a using regression analysis and a scenario analysis. These works pointed out that the optimal effect of the comprehensive scenario came from four levels: social and economic development; government policy implementation; traffic structure optimization; and technological innovation. Social and economic development indicates that economic growth and population growth need to be taken into account in the model; government policy implementation suggests that the government is required to change existing standards and implement new policies; traffic structure optimization denotes the replacement of old models with new ones; and technical innovation refers to the development of new energy technologies [15,16,17,18,19,20].
Based on previous works from global researchers, in this current paper we study the road traffic of Chengdu through the LEAP model and adopt the scenario analysis method to construct an energy and environment model of the road traffic of Chengdu. With technological developments and the implementation of energy-saving policies being considered, we analyze and predict the energy demand and carbon emissions of urban transportation in Chengdu under three different scenarios with bottom-up data as well as from the perspective of end-use energy.
2. Methodology
2.1. Model Structure
The LEAP model (Long-Range Energy Alternatives Planning System) is a bottom-up economic–energy–environment modeling tool based on a scenario analysis [15,16], which was jointly developed by the Stockholm Environment Association and Boston University. The model is equipped with energy demand forecasting, environmental impact forecasting, and cost-benefit analysis modules, which can predict future energy demand over a long period time according to the actual local conditions of the forecast object, based on the assumption of key scenarios of economic, industrial, or technological developments [17,18,19]. Using the prepared environmental database, it can predict the environmental impact of a given energy scheme and calculate the cost from the perspectives of resources, transformation, and utilization [20].
As shown in Figure 1, by constructing a LEAP model, we comprehensively analyzed the ownership of four types of vehicles in Chengdu, the annual vehicle kilometers, the vehicle energy intensity, and the resident population of Chengdu. In the subsequent scenario simulation, the model simulation was performed by changing the population increment, the proportion of different types of vehicles, and the new energy policy. The power plant module was built from the China Statistical Yearbook Power Balance Sheet [21] and the Sichuan Provincial Statistical Yearbook [22]. At present, the power supply in Chengdu is mainly composed of thermal power generation and hydropower generation. The proportion of biomass power generation, photovoltaic generation, solar energy, and wind power generation is not obvious [23].
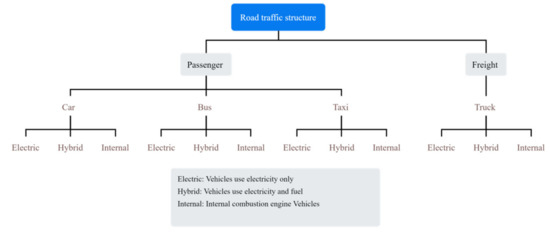
Figure 1.
Frame structure of Chengdu road traffic LEAP model.
Motor vehicles consume fuel—including diesel, gasoline, and electricity—during driving, which generates carbon emissions. This part of carbon emissions is called mobile source carbon emissions [24]. New energy vehicles use electricity as the main energy source and the carbon emissions generated by electricity are mainly carried out at the power plant [25]. As shown in Figure 2, in the carbon emission path of motor vehicles, indirect emissions refer to the combustion of coal blocks and fuel oil by thermal power plants to generate electricity (such as steam generators and oil-fired generators), which are transmitted to each vehicle through the urban power grid. In new energy vehicles, part of the electricity is lost in the process of transmission and storage. Clean energy power generation does not produce carbon emissions (biomass combustion power generation has carbon emissions). Direct emissions refer to internal combustion engine vehicles that mainly use fuel as a power source and are driven. During the journey, fuel is continuously burned and carbon emissions are generated [26,27].
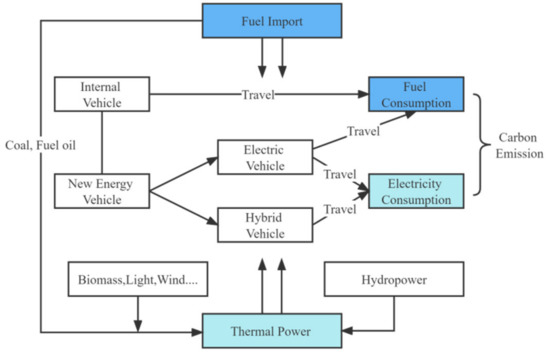
Figure 2.
Vehicle carbon emission path.
2.2. Equations
Through the data from the China Statistical Yearbook [20] and the Sichuan Provincial Air Quality Control Comprehensive Decision Support Platform, and based on Formula (1) [27], the number of passengers–kilometers corresponding with each vehicle per year was calculated. The load factor was 2.5 for domestic cars and taxis, 40 for buses, and 9.6 for freight cars. The energy intensity of each vehicle model in the LEAP model could be calculated based on Equation (2) [23,24,25,26,27,28].
where represents the different types of vehicles; is the product of passengers and the annual kilometers of vehicles (the unit is passenger·km); is the product of the vehicle ownership and the annual kilometers of the vehicles (the unit is billion vehicle·km); and is the energy intensity of the current vehicle, which represents the ability of the vehicle to consume energy (the unit is L/passenger·km). When calculating a model for new energy vehicles that use electricity as the power source, it measures in different units (kw·h/passenger·km); is the fuel economy of the vehicle and the unit is vehicle·km/L. When calculating a model for a new energy vehicle with electricity as the power source, it measures with different units (vehicle·km/kWh); is the loading factor and the unit is passenger·km/vehicle·km. When calculating a model for a freight car, it uses different measurement units for (tonne·km/vehicle·km).
Using Formulas (3) and (4) [23,24,25,26,27,28], we calculated the energy consumption and carbon emissions of different types of vehicles in Chengdu, where it adopts the IPCC international standard [29] for carbon emission factors and the China General Principles for the Calculation of Comprehensive Energy Consumption (GB/T 2589-2020) [30,31] for the fuel conversion factor.
where represents the different types of vehicles; represents the energy consumption; represents the carbon emissions; and represents the energy intensity with the unit of L/passenger·km. When calculating a model for new energy vehicles with electricity as the power source, it takes different units of measurement for (kWh/passenger·km); is the product of the passenger and the annual kilometers of the vehicle (the unit is passenger·km); is the coal-burning conversion factor of the vehicle; and is the carbon emission factor of the vehicle.
2.3. Model Configurations
The Ministry of Transport has put forward the goal of reducing the unit energy consumption of road transport, water transport, and civil aviation [3,22]. Therefore, the present study took 2020 as the research base year and focused on the purchase of new energy vehicles as well as the elimination and replacement of old vehicles from the main factors that affect greenhouse gas emissions such as fuel economy, mileage, and energy structure. First-level and second-level scenarios were constructed to assess the energy consumption and carbon emissions of road vehicles in Chengdu from 2020 to 2025. The model took the main vehicles of road traffic in Chengdu as the system boundary and integrated the power plants under the energy input with all fossil energy input outside the boundary. The specific settings are shown in Table 1.

Table 1.
Scenario description.
2.3.1. Baseline
The base year scenario was the “zero scenario”. In this scenario, the vehicle type and energy consumption structure were maintained at the level of 2020 and no energy conservation or emission reduction measures were taken until 2025.
2.3.2. Low Carbon (LC)
According to the analysis of the market prospect of new energy vehicles in Chengdu, following the natural growth of vehicles, the low carbon (LC) scenario was an integrated scenario of the two secondary scenarios of clean road traffic and the freezing of internal combustion engines in public transportation.
2.3.3. Strengthen Low Carbon (SLC)
On the basis of the planning and deployment of new energy vehicles in Chengdu and the analysis of the market prospects of energy vehicles, the feasibility policy of new energy was further proposed. The Strengthen Low Carbon (SLC) scenario was an integrated scenario of four secondary scenarios; these were: clean road traffic; the freezing of internal combustion engines in public transport; requirements for hybrid vehicles; and new energy exchange policies.
3. Results and Discussion
Based on 2020 Sichuan Provincial Comprehensive Decision Support Platform data, there were 56,347 electric private cars, 14,873 hybrid private cars, 5,046,880 internal combustion private cars, 16,221 electric taxis, 4120 hybrid taxis, 87,294 internal combustion taxis, 8245 electric buses, 2733 hybrid buses, 10,641 internal combustion buses, and 94,372 internal combustion trucks in Chengdu in 2020.
As shown in Figure 3, taking the baseline scenario as the standard, the road traffic energy of Chengdu was represented by a Sankey diagram through the LEAP model simulation analysis. The energy input of the road transportation of Chengdu came from hydroelectric power generation, coal-fired power generation, oil-fired power generation, externally transferred power, gasoline imports, and diesel imports. From the structure, we found that the electricity of the power plant was lost to a certain extent during the transmission process; most of the remaining power and externally transferred power entered the transportation energy. Gasoline energy input accounted for most of the energy sources; the rest were diesel, hydroelectric power, thermal power, and power transfer, in descending order.
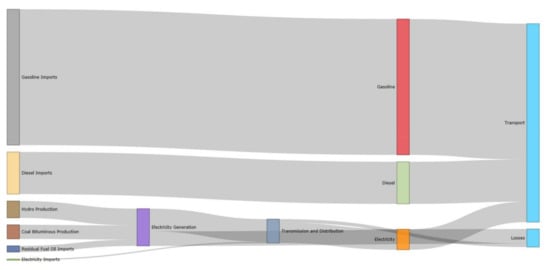
Figure 3.
Sankey diagram of road transportation energy in Chengdu.
3.1. Energy Consumption
The LC scenario was a forecast for the new energy development of Chengdu, aiming at low carbon to reduce air pollutants whilst controlling carbon emissions. The overall situation was to import new energy vehicles as the primary purpose. As shown in Table 2, due to the annual increase in the number of motor vehicles, the energy demand of the road traffic of Chengdu was predicted to increase year by year under the LC scenario from a total energy demand of 338.7 million GJ in 2020 to 471.0 million GJ in 2025; namely, an increase of 39%. Power production and supply rapidly rose 7.6 times and power transmission losses increased 12 times; fossil fuel consumption was predicted to increase by 169.3 million GJ or 49.17%.

Table 2.
Energy balance table under LC scenario.
The proportions of energy types are shown in Figure 4. As the proportion of new energy vehicles gradually increased, electricity demand gradually emerged in the overall energy structure. Under the LC scenario, the overall proportions of the energy sources, ranked from strong to weak, were gasoline, diesel, and electricity. By 2020, the proportion of electric energy gradually increased to 10.2%, the proportion of gasoline dropped to 70.3%, and the overall change of diesel was not significant.
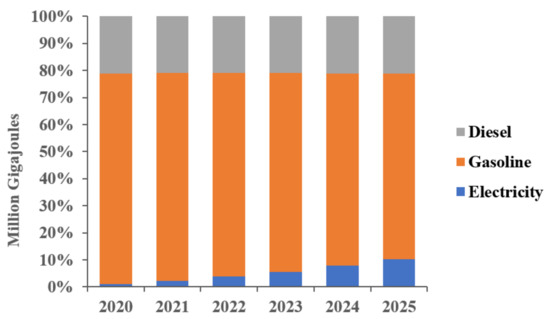
Figure 4.
The proportion of energy demand under the LC scenario.
The SLC scenario was to add a variety of carbon reduction measures on the basis of the natural development of the automobile market of Chengdu. It aimed to strongly reduce carbon emissions and achieve a carbon peak of road traffic carbon emissions as soon as possible under the premise of being realistic. As shown in Table 3, as the number of motor vehicles increased yearly, the overall energy consumption demand also increased. From 2020 to 2025, the energy demand for road transportation in Chengdu increased from 338.7 million GJ to 435.6 million GJ, or 28.6%; the electricity supply significantly increased from 8.5 million GJ to 98.7 million GJ, or about 10.6 times; fossil fuels increased by 157.4 million GJ, or 45%. Due to the substantial increase in new energy vehicles, the power load increased sharply over a short period of time and the power grid transferred out most of the non-clean power in a short period of time.

Table 3.
Energy balance table under SCL scenario.
The proportions of energy types are shown in Figure 5. Due to the strict emission reduction policy and the entry of energy vehicles into the automobile market, the proportion of fossil fuels was further reduced and electricity demand became the primary energy demand for road transportation in Chengdu. Under the SLC scenario, the overall energy proportions were gasoline, diesel, and electricity, in descending order. After 2024, the proportion of electric energy became more potent than that of diesel; several old internal combustion vehicles were eliminated and replaced with new energy vehicles. By 2020, the proportion of electricity and energy gradually increased to 24.7%. The proportion of gasoline dropped to 60.1%. The proportion of diesel increased 18.2% year by year after 2022. From the energy structure, it could be seen that the policy of clean transportation and new energy purchase had initial effects.
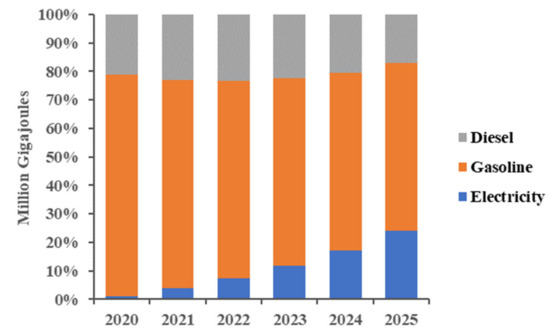
Figure 5.
The proportion of energy demand under the SLC scenario.
Due to the increase in the number of motor vehicles, the energy demand for small cars (integrating private cars and taxis) in the LC scenario gradually increased and gasoline and electricity linearly increased by a significant amount and whilst new energy vehicles were being developed, internal combustion vehicles were not restricted. As can be seen from Figure 6, from 2020 to 2025, the energy demand for gasoline increased from 223.6 million GJ to 253.1 million GJ (i.e., by 13.19%), and the energy demand for electricity increased from 0.6 million GJ to 3.7 million GJ (i.e., 5.1 times the initial value). The electricity demand of cars only accounted for a small part of the whole and the main energy demand was still from gasoline.
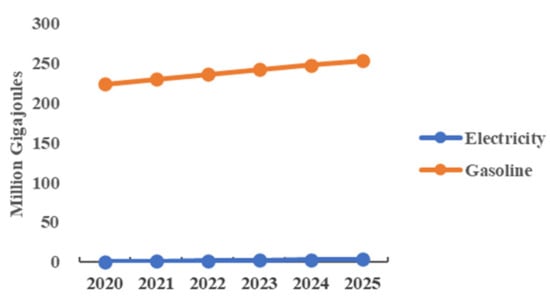
Figure 6.
Car energy demand under LC scenario.
Due to the elimination of diesel locomotives and the purchase of new energy vehicles, the energy demand for small cars (integrating private cars and taxis) under the SLC scenario decreased and increased again. The gasoline energy demand declined in a curve and the electricity energy demand rose. As shown in Figure 7, from 2020 to 2025, the gasoline energy demand decreased by 7.9% from 223.6 million GJ to 205.9 million GJ and the electricity energy demand increased from 0.6 million GJ to 11.9 million GJ; namely, 18.8 times the initial value. According to this trend of increase and decrease, it was expected that a balance could be achieved between fossil energy and clean energy around 2040.
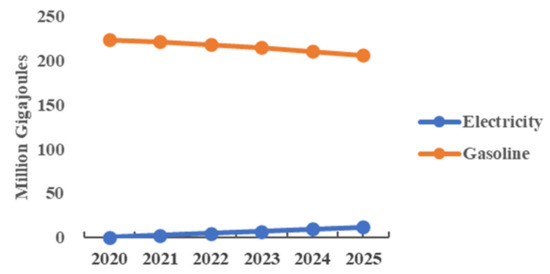
Figure 7.
Car energy demand under SLC scenario.
The LC scenario took the lead in the promotion of new energy for buses. In terms of energy demand for buses, the diesel energy demand peaked in 2024. The diesel demand fell after 2024 and the electricity demand rose. As shown in Figure 8, from 2020 to 2025, the diesel energy demand increased from 9.3 million GJ to 16.1 million GJ (in 2024). It then declined to 15.6 million GJ where the increase and decrease before and after were 1.8% and 3.1%, respectively. The electricity energy demand increased from 1.4 million GJ to 8.3 million GJ; i.e., 4.9 times the initial value. According to this trend, it was expected that a balance between fossil energy and clean energy would be to achieved by 2030.
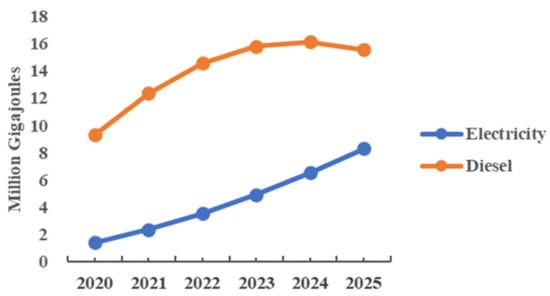
Figure 8.
Bus energy demand under LC scenario.
Under the SLC scenario, new energy vehicles were vigorously promoted due to the strengthening of the management of the bus energy structure and the premise of not increasing the number of internal combustion buses. The gasoline energy demand for buses peaked in 2023 then declined rapidly and the electrical energy demand increased in a curve. As shown in Figure 9, from 2020 to 2025, the bus gasoline energy demand increased from 9.3 million GJ to 36 million GJ (2023) and then decreased to 28.1 million GJ (2025). The increase and decrease before and after were 11.4% and 21%, respectively. The electricity energy demand increased from 1.4 million GJ to 30.4 million GJ, or 20.7 times the initial value. The model results showed that the energy demand of buses reached a balance between fossil energy and clean energy in 2024 and gradually took clean energy as the primary energy source to achieve the goal of overall clean energy use.
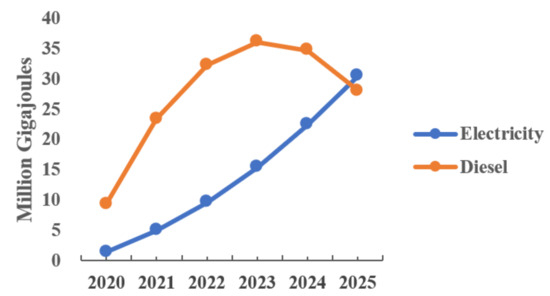
Figure 9.
Bus energy demand under SLC scenario.
The energy demand trend of trucks in the LC scenario was similar to that of cars because the proportion of new energy vehicles in the original structure was relatively small. The LC scenario was based on natural growth and did not impose mandatory measures on the energy structure of trucks and cars. As shown in Figure 10, from 2020 to 2025, the diesel energy demand increased from 62.3 million GJ to 84.2 million GJ, which was 35.1%; the electric energy started to emerge in 2021 and increased to 3.4 million GJ by 2025, an increase of 36% per year. According to the trend in Figure 10, trucks did not achieve a balance between fossil energy and clean energy under the LC scenario.
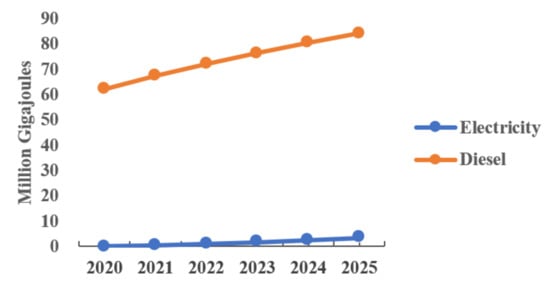
Figure 10.
Truck energy demand under LC scenario.
Due to the promotion of strong carbon emission reduction measures for the structure of trucks under the SLC scenario, new energy exchange purchases were required to reach one-third of the purchase amount. The diesel energy demand for trucks reached a peak in 2021 and decreased year by year whereas the electrical energy demand gradually increased every year. As shown in Figure 11, from 2020 to 2025, the diesel energy demand for trucks slightly increased to 65.7 million GJ in the second year. It then decreased to 45.8 million GJ, showing a decrease of 30.2%. The electricity energy demand slightly increased to 3.0 million GJ in the second year and then substantially increased to 25.2 million GJ, showing an increase of 7.4 times. The energy demand of trucks under the SLC scenario reached an energy balance by 2030 and gradually developed toward complete cleanliness.
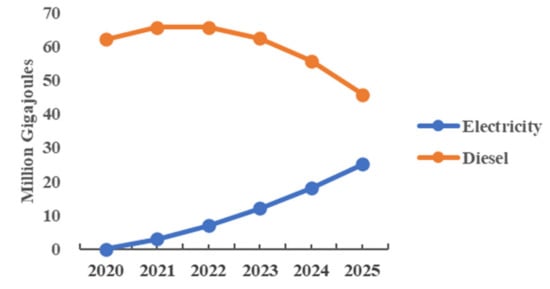
Figure 11.
Truck energy demand under SLC scenario.
3.2. Carbon Emission
Under the 100-year global warming potential, the vehicle situation of the road traffic of Chengdu was combined with various policies and simulated by the LEAP model. Greenhouse gas was converted into tCO2e and the following results were obtained. As can be seen in Figure 12, the amount of tCO2e for the three scenarios of baseline, LC, and SLC was represented by a line graph where LC was the low-carbon growth scenario based on the baseline and SLC was the enhanced carbon emission reduction scenario of LC.
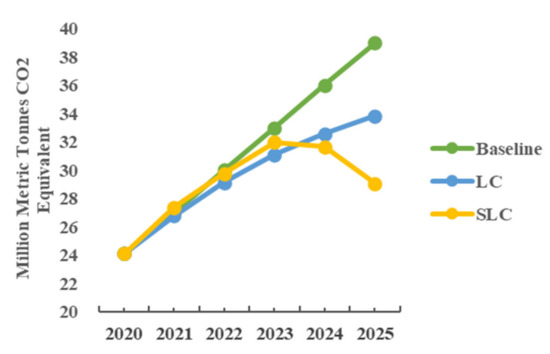
Figure 12.
A 100-year GWP: carbon emissions under three scenarios.
If the motor vehicle problem was not addressed, the baseline scenario reached 39 million tCO2e in 2025. This means that if Chengdu does not implement a five-year policy adjustment for motor vehicles, carbon emissions will not be able to be effectively controlled. Compared with the LC scenario, the SLC scenario exhibited significantly more carbon emissions than the LC scenario before 2024, reaching 32 million tCO2e in 2023 (the LC carbon emissions at this time were 31.1 million tonnes), but the emissions became significantly less than the LC scenario and decline rapidly after 2023, dropping to 29.1 million tCO2e by the end of the simulation (at this time, the LC carbon emissions were 33.8 million tonnes and continued to grow). The reason was that with a large-scale power exchange of motor vehicles in Chengdu, the power supply peaked in a short period of time and the carbon emissions rose due to the activation of the standby fuel-fired units of the power plant. The power plant would gradually return to normal after being dispatched by the State Grid. Although the carbon emissions of the LC scenario was less than that of the SCL scenario in the first 3 years of the simulation, the curve slowly rose and the carbon peak was not expected to be reached until around 2030. The SCL scenario reached the carbon peak in 2023 and showed a carbon-neutral trend at the end of the model with a decline rate of about 8%. If the SCL policy continued, carbon neutrality would be achieved by 2040.
Figure 13 shows the contributions of various types of vehicles to the carbon emissions of road traffic in Chengdu under the LC scenario. Private cars accounted for the main contribution followed by taxis, trucks, and buses. This was consistent with the number of motor vehicles; the advantage of quantity outweighed the individual differences (a single taxi has more carbon emissions than a single private car because of the large number of kilometers per year; a single bus has more carbon emissions than a single truck because of the large number of passengers). The carbon emissions of taxis were lower than trucks by 2022 whereas after 2022, it surpassed the carbon emissions of trucks and became the second largest contributor to the entire carbon emission structure. The rapid increase in the number of taxis led to this result. From 2020 to 2025, carbon emissions from private vehicles increased from 15.5 million tonnes to 17.8 million tonnes, or by 14.8%; taxi carbon emissions increased from 3.0 million tonnes to 7.7 million tonnes, or 1.5 times; the carbon emissions of buses increased from 0.9 million tonnes to 1.9 million tonnes, which was about 1.1 times. Due to insufficient control over the original internal combustion vehicles and no policy of replacing new energy with new cars, the carbon emissions of Chengdu would be severe in the next five years under the LC simulation.
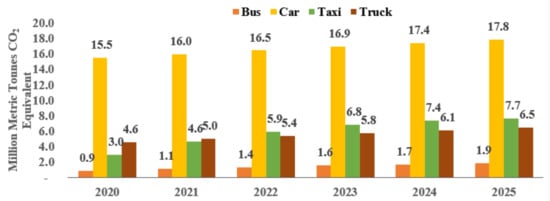
Figure 13.
A 100-year GWP: carbon emissions of various vehicle types under the LC scenario.
Figure 14 shows the contributions of various types of vehicles to the carbon emissions of road traffic in Chengdu under the SLC scenario. Private cars again accounted for the main contribution followed by trucks, taxis, and buses. As public transportation had stopped purchasing internal combustion vehicles, taxis were largely exchanged for new energy on the original basis. The SLC scenario produced a very different ranking of carbon emission contributions than the LC scenario. Carbon emissions from taxis were less than trucks by 2022. From 2022 to 2025, the carbon emissions of private cars were on a steady reduction trend and carbon emissions from private cars decreased from 15.5 million tonnes to 149,000 tonnes; namely, a decrease of 3.8%.
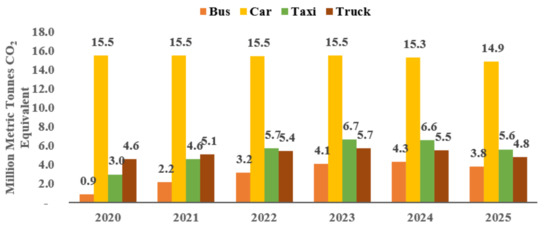
Figure 14.
A 100-year GWP: carbon emissions of various vehicle types under the SLC scenario.
Due to the electrical load, the carbon emission curves of many models showed a trend of increasing first and then decreasing. The carbon emissions of trucks followed a curve that firstly increased and then decreased. From 2020 to 2023, the carbon emissions of trucks increased from 4.6 million tonnes to 5.7 million tonnes, or 19.2%, whereas from 2023 to 2025, the carbon emissions of trucks reduced to 4.8 million tonnes; i.e., 15.7%. The carbon emissions of taxis also followed a curve that firstly increased and then decreased. From 2020 to 2023, the carbon emissions of taxis increased from 3.0 million tonnes to 6.7 million tonnes (about 1.2 times) and from 2023 to 2025, the carbon emissions of taxis reduced to 5.6 million tonnes, a decrease of 19.6%. The carbon emissions of buses continued to increase until 2024, from 0.9 million tonnes to 4.3 million tonnes, about 0.8 times the initial value. After 2024, the carbon emissions fell to 3.8 million tonnes at the end of the simulation, which was a reduction of about 11.6% of the initial value.
The road traffic carbon emissions of Chengdu could potentially be reduced. As shown in Figure 15, the carbon emissions from road traffic in Chengdu were mainly composed of N2O, CH4, and CO2. CO2 had the highest contribution and accounted for almost all carbon emissions. The emission levels of N2O and CH4 were similar and their contribution to the carbon emissions was limited. The characteristics of the energy used in motor vehicle engines determine the composition of the carbon emissions with both fossil fuels and unclean electricity contributing to the major contribution of CO2 to carbon emissions [7]. Comparing the three scenarios of SLC, LC and the baseline, we found that the SLC scenario could further reduce the carbon emissions by 0.9 million tonnes in 2024 and 4.8 million tonnes in 2025. Using the SLC scenario could achieve a carbon peak of the road traffic of Chengdu in 2023.
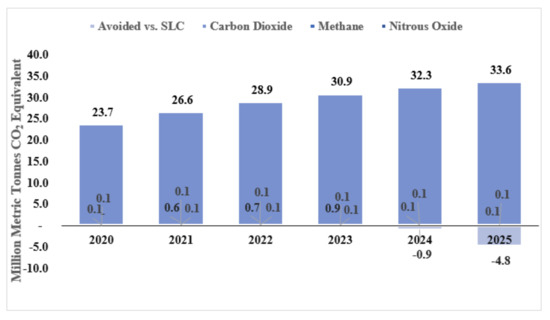
Figure 15.
GHG emission reduction potential of road traffic in Chengdu.
4. Conclusions
In Chengdu, which has a high density of permanent residents, the energy demand and greenhouse gas emissions of urban road traffic are particularly prominent. In this study, we established a LEAP model based on survey data of the per capita travel volume, travel structure, fuel structure, and energy consumption intensity of urban road vehicles in Chengdu. Two control scenarios were designed according to an analysis of the motor vehicle market in Chengdu, the mobile source emission inventory of the comprehensive decision-making support platform for air quality control in the Sichuan Province, and related planning and development policies. The analysis results showed that by strengthening low-carbon policies and optimizing the energy structure, the carbon emission reduction potential of road transportation in Chengdu was considerable. The main conclusions of this study are summarized as follows. The carbon emissions of road traffic in Chengdu increased with an increase in population and traveling vehicles. The carbon emissions from road traffic increased at an annual rate of 21% under the baseline scenario. Under the LC scenario, the growth in 2022 and 2025 was 20.7% and 40.2%, respectively, compared with 2020. Under the SLC scenario, the growth in 2022 and 2025 increased by 23.3% and 20.8%, respectively, compared with 2020. In Chengdu, where the proportion of hydropower is relatively high, the use of electricity as a clean energy source in the field of road transportation was beneficial for carbon emission reductions. Under the LC scenario, carbon emissions from road traffic increased by 2.7 million tonnes and 2.3 million tonnes from 2020 to 2022 and by 1.5 million tonnes and 1.2 million tonnes from 2023 to 2025, respectively. The overall increase was moderated, growing at an annual rate of 25%. Under the SLC scenario, the carbon emissions from road traffic increased by 3.3 million tonnes and 2.4 million tonnes from 2020 to 2022 and decreased by 0.3 million tonnes and 2.6 million tonnes from 2023 to 2025, respectively. The overall increase weakened and decreased year by year with an annual increase of about 50% in carbon reduction after 2023. The carbon emissions peaked in 2023 and became carbon-neutral before 2040. Vigorously promoting new energy policies could make the road traffic carbon emissions of Chengdu peak ahead of schedule. Under the SLC scenario, the total carbon emissions from road traffic in Chengdu peaked at 32 million tonnes of tCO2e in 2023 and decreased to 29.1 million tonnes of tCO2e in 2025. At the end of the simulation there was a trend toward carbon neutrality by 2040. If the pressure on carbon emission reduction was more urgent, in addition to the existing strong low-carbon measures, adding an energy-saving transformation of private cars, reducing the demand for fossil fuels, restricting the purchase of private cars, and expanding the capacity of public transportation were better choices. In this research, we carried out a corresponding analysis on limited vehicles in Chengdu. Using the data of other types of motor vehicles (such as motorcycles, tricycles, and self-modified vehicles) from transportation departments to provide a more accurate and detailed account of carbon emissions in the transportation field is a future research direction.
Author Contributions
Conceptualization, J.W. and Y.L.; methodology, J.W.; software, J.W.; validation, Y.Z.; formal analysis, J.W.; investigation, J.W and Y.Z.; resources, Y.L.; data curation, J.W.; writing—original draft preparation, J.W.; writing—review and editing, J.W. and Y.Z.; visualization, Y.L.; supervision, J.W.; project administration, Y.L.; funding acquisition, Y.Z. All authors have read and agreed to the published version of the manuscript.
Funding
This study was financially sponsored by the Science & Technology Projects of Sichuan Province, China (2022YFS0353) and the Science & Technology Project in Ecological Environmental Protection of Sichuan Province, China (HB202208).
Institutional Review Board Statement
Not applicable.
Informed Consent Statement
Not applicable.
Data Availability Statement
Not applicable.
Conflicts of Interest
The authors declare no conflict of interest.
References
- Yang, D.; Liu, D.; Huang, A.; Lin, J.; Xu, L. Critical transformation pathways and socio-environmental benefits of energy substitution using a LEAP scenario modeling. Renew. Sustain. Energy Rev. 2021, 135, 110–116. [Google Scholar] [CrossRef]
- Zou, X.; Wang, R.; Hu, G.; Rong, Z.; Li, J. CO2 Emissions Forecast and Emissions Peak Analysis in Shanxi Province, China: An Application of the LEAP Model. Sustainability 2022, 14, 637. [Google Scholar] [CrossRef]
- Luis, R.G.; David, B.; Luis, F.M.; Sebastián, N.S.; Kenny, E.S. Long-Term Forecast of Energy and Fuels Demand Towards a Sustainable Road Transport Sector in Ecuador (2016–2035): A LEAP Model Application. Sustainability 2020, 12, 472. [Google Scholar]
- Xie, S. The Environmental Impacts and Economic Benefits on Comprehensively Promoting Alternative Fuel Buses in China: Life-Cycle and Scenario Analysis Based on LEAP Model. J. Geosci. Environ. Prot. 2019, 7, 99–121. [Google Scholar] [CrossRef][Green Version]
- Fan, W.; Chen, J.; Ma, D.; Jin, C.; Tang, B.; Zhang, Y.; Jang, W.; Qian, J.; Liu, Z. Characteristics of emissions from vehicles in Chengdu from 2010 to 2019 and evaluation of effectiveness of prevention and control measures. Chin. J. Environ. Eng. 2021, 15, 657–668. (In Chinese) [Google Scholar]
- Hu, G.; Ma, X.; Ji, J. Scenarios and policies for sustainable urban energy development based on LEAP model-A case study of a postindustrial city: Shenzhen China. Appl. Energy 2019, 238, 876–886. [Google Scholar] [CrossRef]
- Fei, H.; Zhou, D.; Wang, Q.; Ye, H. Decomposition and attribution analysis of the transport sector’s carbon dioxide intensity change in China. Transp. Res. Part A Policy Pract. 2019, 119, 343–358. [Google Scholar]
- Nieves, J.A.; Aristizábal, A.J.; Dyner, I.; Báez, O.; Ospina, D.H. Energy demand and greenhouse gas emissions analysis in Colombia: A LEAP model application. Energy 2018, 169, 380–397. [Google Scholar] [CrossRef]
- Study Results from Department of Electrical Engineering Update Understanding of Energy. Long-term electricity demand forecast and supply side scenarios for Pakistan (2015–2050): A LEAP model application for policy analysis. Energy 2019, 165, 512–526. [Google Scholar] [CrossRef]
- Coutinho, F.M.; van Oort, N.; Christoforou, Z.; Alonso-González, M.J.; Cats, O.; Hoogendoorn, S. Impacts of replacing a fixed public transport line by a demand responsive transport system: Case study of a rural area in Amsterdam. Res. Transp. Econ. 2020, 83, 100910. [Google Scholar] [CrossRef]
- Li, Y.; Kumar, A.; Li, Y.; Kleeman, M.J. Adoption of low-carbon fuels reduces race/ethnicity disparities in air pollution exposure in California. Sci Total Environ. 2022, 834, 155230. [Google Scholar] [CrossRef] [PubMed]
- Wang, P.; Wang, C.; Hu, Y.; Liu, Z. Analysis of energy consumption in Hunan Province (China) using a LMDI method based LEAP model. Energy Procedia 2017, 142, 3160–3169. [Google Scholar] [CrossRef]
- Guo, M.; Meng, J. Exploring the driving factors of carbon dioxide emission from transport sector in Beijing-Tianjin-Hebei region. J. Clean. Prod. 2019, 226, 692–705. [Google Scholar] [CrossRef]
- Liu, L.Q.H.; Yang, D.; Liu, H. Effects of urbanization on freight transport carbon emissions in China: Common characteristics and regional disparity. J. Clean. Prod. 2019, 211, 481–489. [Google Scholar]
- Nnaemeka, V.E.; Chinenye, C.E.; Girish, P.M.; Adaeze, S.A. Energy policy for low carbon development in Nigeria: A LEAP model application. Renew. Sustain. Energy Rev. 2017, 68, 247–261. [Google Scholar]
- Azam, M.; Othman, J.; Begum, R.A.; Abdullah, S. NGM Nor Energy consumption and emission projection for the road transport sector in Malaysia: An application of the LEAP model. Environ. Dev. Sustain. 2016, 18, 1027–1047. [Google Scholar] [CrossRef]
- Hong, S.; Chung, Y.; Kim, J.; Chun, D. Analysis on the level of contribution to the national greenhouse gas reduction target in Korean transportation sector using LEAP model. Renew. Sustain. Energy Rev. 2016, 60, 549–559. [Google Scholar] [CrossRef]
- Zheng, H.W.; Zhang, Y.Y. Energy Consumption from Conventional Gasoline Sedans in Beijing Based on the LEAP Model. Proceedings of International Conference on Industrial Technology and Management Science (ITMS 2015), Tianjin City, China, 27 March 2015; pp. 1226–1229. [Google Scholar]
- Madeleine, M.; Bryan, K. Long-term scenario alternatives and their implications: LEAP model application of Panama’s electricity sector. Energy Policy 2014, 68, 146–157. [Google Scholar]
- Reza, I.; Ji, Z.; Aijie, W.; Fenglin, Y.; Xinyong, L. Study on the Passenger Transportation Energy Demand and Carbon Emission of Jilin Province Based on LEAP Model. Adv. Mater. Res. 2012, 1793, 2243–2246. [Google Scholar]
- Liu, Y.Y.; Wang, Y.F.; Yang, J.Q.; Zhou, Y. Scenario Analysis of Carbon Emissions in Jiangxi Transportation Industry Based on LEAP Model. Appl. Mech. Mater. 2011, 1326, 637–642. [Google Scholar] [CrossRef]
- CSY. China Statistical Yearbook; China Statistical Publishing House: Beijing, China, 2020. [Google Scholar]
- NBSC (National Bureau of Statistics of China). China Energy Statistical Yearbook; China Statistics Press: Beijing, China, 2020. [Google Scholar]
- Tao, Z.; Zhao, L.; Changxin, Z. Research on the prospects of low-carbon economic development in China based on LEAP model. Energy Procedia 2011, 5, 695–699. [Google Scholar] [CrossRef]
- Solaymani, S. CO2 emissions patterns in 7 top carbon emitter economies: The case of transport sector. Energy 2019, 168, 989–1001. [Google Scholar] [CrossRef]
- Rabia, S.; Sheikh, S. Ahmad. Monitoring urban transport air pollution and energy demand in Rawalpindi and Islamabad using leap model. Energy 2010, 35, 2323–2332. [Google Scholar]
- Subhash, K. Assessment of renewables for energy security and carbon mitigation in Southeast Asia: The case of Indonesia and Thailand. Appl. Energy 2016, 163, 63–70. [Google Scholar]
- Lim, J.; Kang, M.; Jung, C. Effect of national-level spatial distribution of cities on national transport CO2 emissions. Environ. Impact Assess. Rev. 2019, 77, 162–173. [Google Scholar] [CrossRef]
- IPCC. IPCC—Intergovernmental Panel on Climate Change. 2019. Available online: https://www.ipcc.ch (accessed on 12 February 2022).
- NDRC (National Development and Reform Commission). Provincial Guidelines for Greenhouse Gas Inventories; National Development and Reform Commission: Beijing, China, 2010. [Google Scholar]
- Li, Y.; Du, Q.; Lu, X.; Wu, J.; Han, X. Relationship between the development and CO2 emissions of transport sector in China. Transp. Res. 2019, 74, 1–14. [Google Scholar] [CrossRef]
Publisher’s Note: MDPI stays neutral with regard to jurisdictional claims in published maps and institutional affiliations. |
© 2022 by the authors. Licensee MDPI, Basel, Switzerland. This article is an open access article distributed under the terms and conditions of the Creative Commons Attribution (CC BY) license (https://creativecommons.org/licenses/by/4.0/).