Communication

Analysis of the COVID-19 Lockdown’s Impact on Air Quality in the Larger Cities of Spain

by
Edgar Lorenzo-Sáez
1,*,
Eloína Coll-Aliaga
1,
Jose-Vicente Oliver-Villanueva
1,
Fernando Prieto del Campo
2 and
Victoria Lerma-Arce
1
1
ITACA Research Institute, Universitat Politècnica de València, Camí de Vera s/n, 46022 Valencia, Spain
2
Observatorio de la Sostenibilidad, 28801 Madrid, Spain
*
Author to whom correspondence should be addressed.
Sustainability 2022, 14(9), 5613; https://doi.org/10.3390/su14095613
Submission received: 8 April 2022 / Revised: 29 April 2022 / Accepted: 5 May 2022 / Published: 6 May 2022
(This article belongs to the Special Issue Air Quality Change in Association with COVID-19 Pandemic)

Abstract

:
During the period of the COVID-19 pandemic, the air quality reached the best levels to be recorded in large cities in Spain. To analyze and demonstrate this improvement in air quality levels, the evolution of the average nitrogen dioxide (NO2) levels in 78 Spanish cities with more than 50,000 inhabitants during the pre-COVID-19 years (2017–2019), the period of the COVID-19 lockdown, and the post-COVID-19 year (2021) was analyzed. The results show an improvement in the air quality in most of the cities analyzed for 2020 due to the COVID-19 restrictions. In addition, in 2021, without the COVID-19 restrictions, the air quality levels of the largest cities in Spain showed important improvements in terms of NO2 concentration compared to the levels in the pre-COVID-19 years (2017–2019). Nevertheless, in 2021, only 11 cities were below the average annual limit of 10 µg/m3 NO2 established by the World Health Organization (WHO). In addition, no cities with more than 500,000 inhabitants achieved NO2 levels below the WHO limit. Finally, a detailed monthly analysis indicated that the pre-COVID-19 levels were reached again during the last months of the monitored period.

1. Introduction

Despite the considerable progress in recent decades, air pollution remains the leading environmental cause of premature death in the European Union (EU), with around 659,000 deaths annually [1]. In addition, air pollution has a negative impact on the health of citizens by, for example, increasing the incidence of oncological diseases, increasing the frequency of asthmatic attacks, or increasing the incidence of lower respiratory tract infections [2]. Additionally, air pollution damages ecosystems, since more than half of the EU territory is exposed to excess concentrations of nitrogen oxides (NOx) and ozone (O3) [3].
Among the existing air pollutants, the two main outdoor air pollutants present in cities worldwide are nitrogen dioxide (NO2) and fine particulate matter (PM2.5) [4,5]. In fact, the exceedances of the current limit values in the air quality regulations of the World Health Organization (WHO) guideline and the 2008/50/EC Directive [6] remain important political challenges [7] for most EU cities.
Exposure to elevated concentrations of NO2 in the air is linked to a range of respiratory diseases, such as bronchoconstriction, increased bronchial reactivity, and airway inflammation, as well as decreases in immune defenses, leading to an increased susceptibility to respiratory infection [8]. Therefore, recently, the limit value for NO2 in the WHO guidelines on outdoor air quality was revised and reduced from 40 to 10 µg/m3 [9].
On the other hand, the impact of COVID-19 restrictions on air quality has been extensively studied [10,11,12]. However, the analysis of the evolution of air quality after the end of the restrictions and the recovery of productive activities at the urban level has not been studied in depth.
Thus, in this work, an analysis of the average NO2 levels in 78 Spanish cities with more than 50,000 inhabitants during the pre-COVID-19 years (2017–2019), the period of the COVID-19 lockdown, and the post-COVID-19 year (2021) was carried out to determine the evolution and patterns of the air quality in these years.

2. Materials and Methods

2.1. Air Quality Monitoring Network

Monitoring of NO2 concentrations was carried out through a network of official air quality stations with the methods and requirements described in EU Directive 2008/50/EC.
The air quality stations considered for the study belong to the regional and local air quality networks of the Ministry for the Ecological Transition and the Demographic Challenge. The following link contains all of the information for each individual station (coordinates, altitude, environment, measured pollutants, etc.): https://www.miteco.gob.es/en/calidad-y-evaluacion-ambiental/temas/atmosfera-y-calidad-del-aire/calidad-del-aire/evaluacion-datos/redes/ (accessed on 7 April 2022).
The daily averages calculated for each calendar week of the years 2017, 2018, 2019, 2020, and 2021 were used to perform the analysis. In addition, in each city, the average of all the stations located within the geographic area of the city was calculated. The NO2 data calculated by city and week can be consulted in the Supplementary Materials. The measurement method used by the official air quality stations is the reference method for the measurement of nitrogen dioxide and nitrogen oxides. The reference method is described in the EN 14211:2012 standard “Ambient air—Standard method for the measurement of the concentration of nitrogen dioxide and nitrogen monoxide by chemiluminescence”.

2.2. Spanish COVID-19 Restrictions Per Period

The Spanish government followed a strategy that was divided into different measures and phases to limit people’s movement. The limitations to people’s mobility led to a drastic reduction in urban mobility, transport, and industrial activity. Table 1 shows a summary of the different measures, phases, and durations.
The restrictions to industry, services, and transport under the different measures are described below:
  • The “total lockdown” measure affected all movement of people, except in critical or specific situations, such as those involving emergency vehicles (ambulances, police, firefighters, etc.), public services (public transportation, postal mail, etc.), and other minimal services that were highly necessary (hospitals, medicine manufacturing, etc.).
  • The “flexible lockdown” measure had similar restrictions in terms of mobility, but allowed activity in further sectors and services (public administration services, cleaning services, etc.).
  • “Phases 0 to 3” involved the progressive reincorporation of the service and productive sectors of society that were not considered highly necessary (education, leisure, technology centers, etc.).
  • “New normality” is the situation representing the absence of such severe and generalized limitations. However, economic restrictions in different activity sectors (the activity of restaurants and bars was limited; depending on the number of infections, a night curfew was established) or the so called “perimetral locks” in certain municipalities led to eventual disruptions in normal activity and mobility.

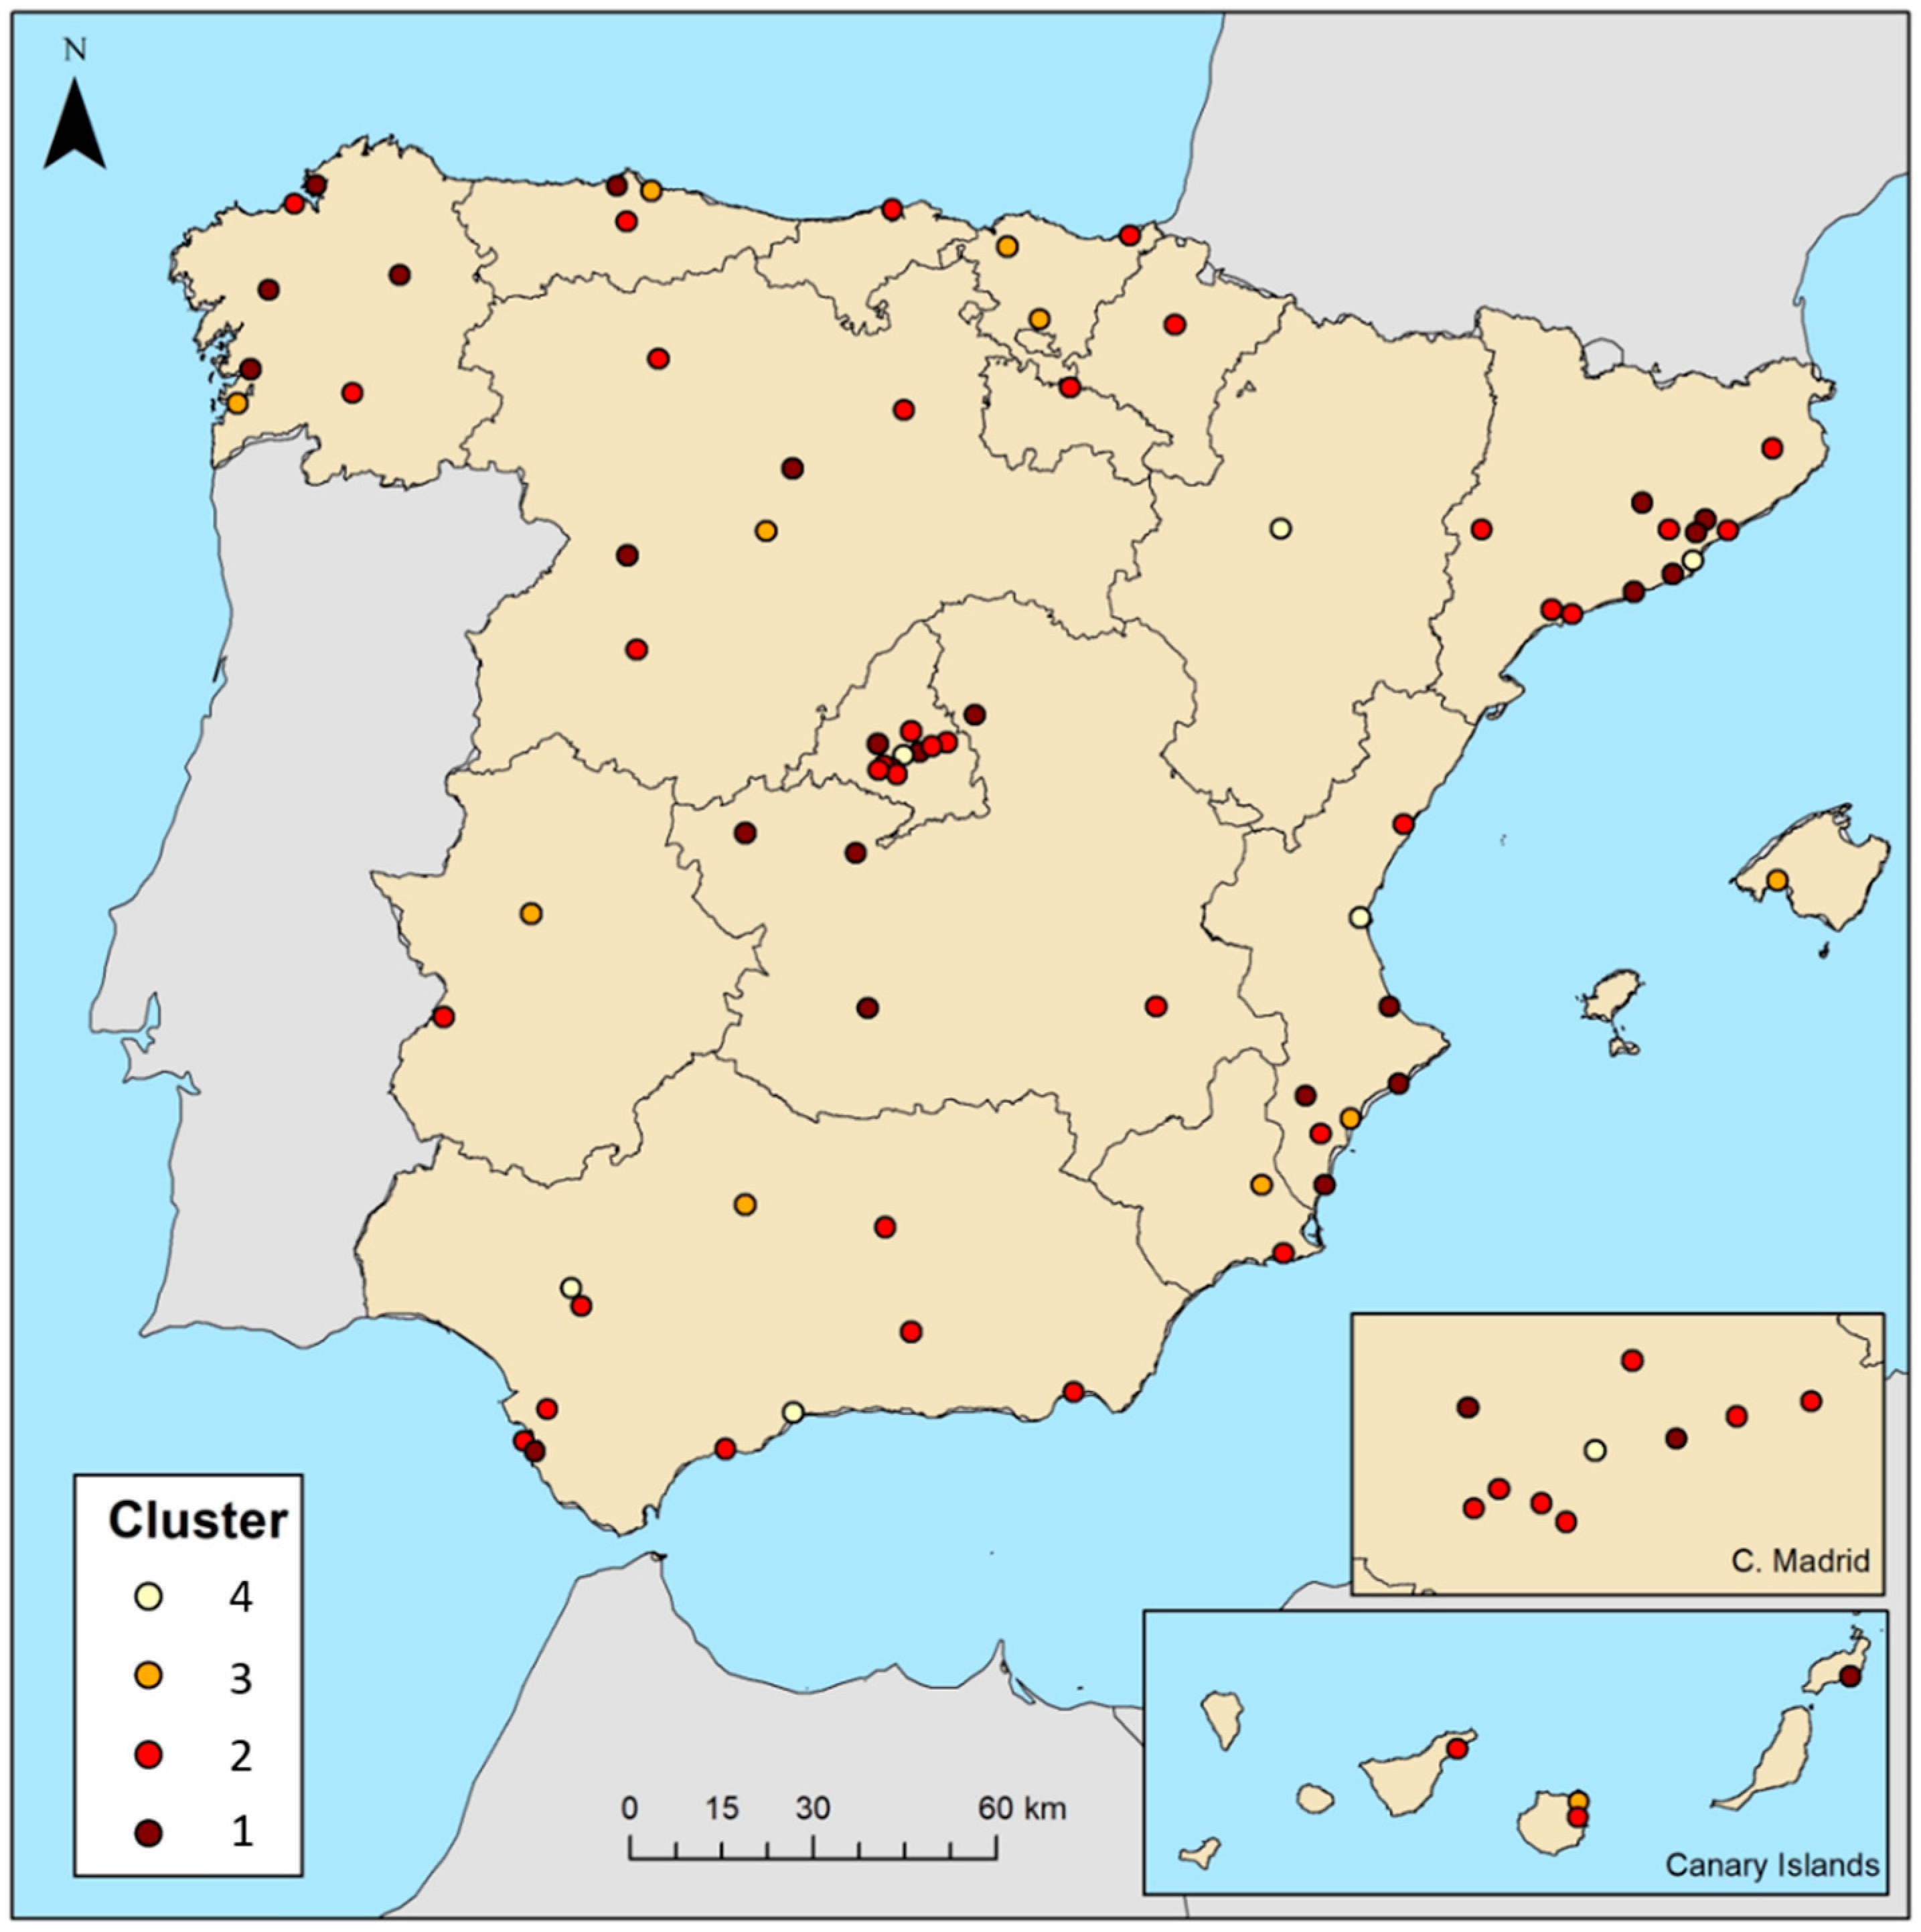
2.3. Monitored Cities

A total of 78 cities in Spain with more than 50,000 inhabitants were monitored (Figure 1). Thus, the population of the monitored cities was about 19 million inhabitants, making up more than 40% of the total population of the national territory.
In addition, a clustering of the 78 cities based on their population was carried out to improve the level of detail of the analysis:
  • Cluster 1 (between 50,000 and 100,000 inhabitants): 25 cities;
  • Cluster 2 (between 100,000 and 250,000 inhabitants): 37 cities;
  • Cluster 3 (between 250,000 and 500,000 inhabitants): 10 cities;
  • Cluster 4: (more than 500,000 inhabitants): 6 cities.
The names, altitudes, and air quality data of the cities that were monitored and analyzed can be consulted in the Supplementary Materials. In addition, the general weather conditions of cities can be consulted in the Supplementary Materials (adapted from [13]).

2.4. Analysis of Impact

The analysis of the impact of the COVID-19 lockdown and the post-COVID-19 recovery on the air quality in the cities was carried out by using the analysis of variance test (ANOVA). Thus, this analysis allowed the identification of significant differences among the different periods that were monitored and among the sizes of the cities. ANOVA tests were performed between:
  • The pre-COVID-19 years (2017–2019), pandemic year (2020), and post-COVID-19 year (2021).
  • The different clusters in the different periods analyzed. This allowed the evaluation of the differences in the impact of the COVID-19 restrictions on the air quality according to city size, as well as the identification of differences in recovery during the post-COVID-19 period.
  • The months of the different monitored periods. This allowed a detailed evaluation of which months had significant differences between the periods analyzed.

3. Results and Discussion

3.1. Air Quality Analysis

Table 2 shows the average NO2 concentrations of the 78 analyzed cities classified by cluster from 2017 to 2021—during the pre-COVID-19 period and during the COVID-19 lockdown. The average concentration of NO2 in the 78 cities during the 2017–2021 period was 19.8 µg/m3 NO2. However, the average NO2 concentration was reduced from 24.0 µg/m3 NO2 in 2017 to 16.3 µg/m3 NO2 in 2021. In addition, a clear relationship was observed between the amount of population (cluster) and the concentration of pollution. An average concentration of NO2 that was 61.6% higher was observed in cities with more than 500,000 inhabitants compared to cities with between 50,000 and 100,000 inhabitants.
The general evolution of the NO2 concentration levels from 2017 to 2021 can be seen in Figure 2. The figure demonstrates that the pre-COVID-19 years showed a very similar sequence with a very marked seasonality, displaying a higher concentration in winter (redder cells) and a lower concentration in summer (greener cells). This seasonality was due to the influence of meteorological conditions that could significantly change the concentrations of NO2 in situ [14]. Specifically, the meteorological variables that primarily influence the concentration of NO2 are wind speed [14] and temperature, as high temperatures cause the oxidation of atmospheric N2 into NO and then into NO2 [15,16]. Thus, the ANOVA tests carried out in the following sections were conducted between periods of time where these conditions were normally equivalent to avoid biases caused by these factors.
However, the period of the COVID-19 lockdown reflected a clear improvement in air quality, showing a greater number of green cells in all cities. Then, the year 2021 recovered the seasonality, but maintained a marked improvement with a greater weight of green tones.
Finally, Figure 2 shows some records with missing data (white cells); the total data recorded were 98.9%. The amount of missing data does not affect the results of the study. Only two cities (of the 78) had less than 90% of the recordable data, and 70 cities had more than 98%. The data missing for each city can be consulted in the Supplementary Materials.
The impact of restrictions for curbing COVID-19 infections on air quality was reflected independently of the cluster (Table 2). The air quality in the COVID-19 lockdown period improved by 58% compared to that in the pre-COVID-19 period. In addition, the return to consolidated normality during the year 2021 increased the concentration of NO2 in the air, but did not result in a return to the levels of the pre-COVID-19 period (Table 2). Specifically, the air quality improved in all clusters by between 20% and 27% during 2021 compared to the year before the pandemic (2019) and by between 25% and 31% compared to the average of the pre-COVID-19 period (2017–2019).
The analysis of the results shows that, in 2021, only 11 cities (nine from cluster 1 and two from cluster 2) were below the average annual limit of 10 µg/m3 NO2 established by the WHO, which is intended to protect the population from the harmful health effects of NO2. However, the trend was positive, since in 2017, there were only three (from cluster 1), in 2018 and 2019, there were eight (six from cluster 1 and two from cluster 2), and in 2020, there were 13 (10 from cluster 1 and three from cluster 2). Finally, during the COVID-19 lockdown period, 46 cities (19 from cluster 1, 20 from cluster 2, and seven from cluster 3) achieved a reduction in their NO2 concentrations below 10 µg/m3 NO2. However, no cities belonging to cluster 4 (>500,000 inhabitants) achieved NO2 concentration levels below the WHO limit. These results imply that, during the year 2021, 18 million inhabitants were living in cities that were above the NO2 concentration level recommended by the WHO for the protection of human health.

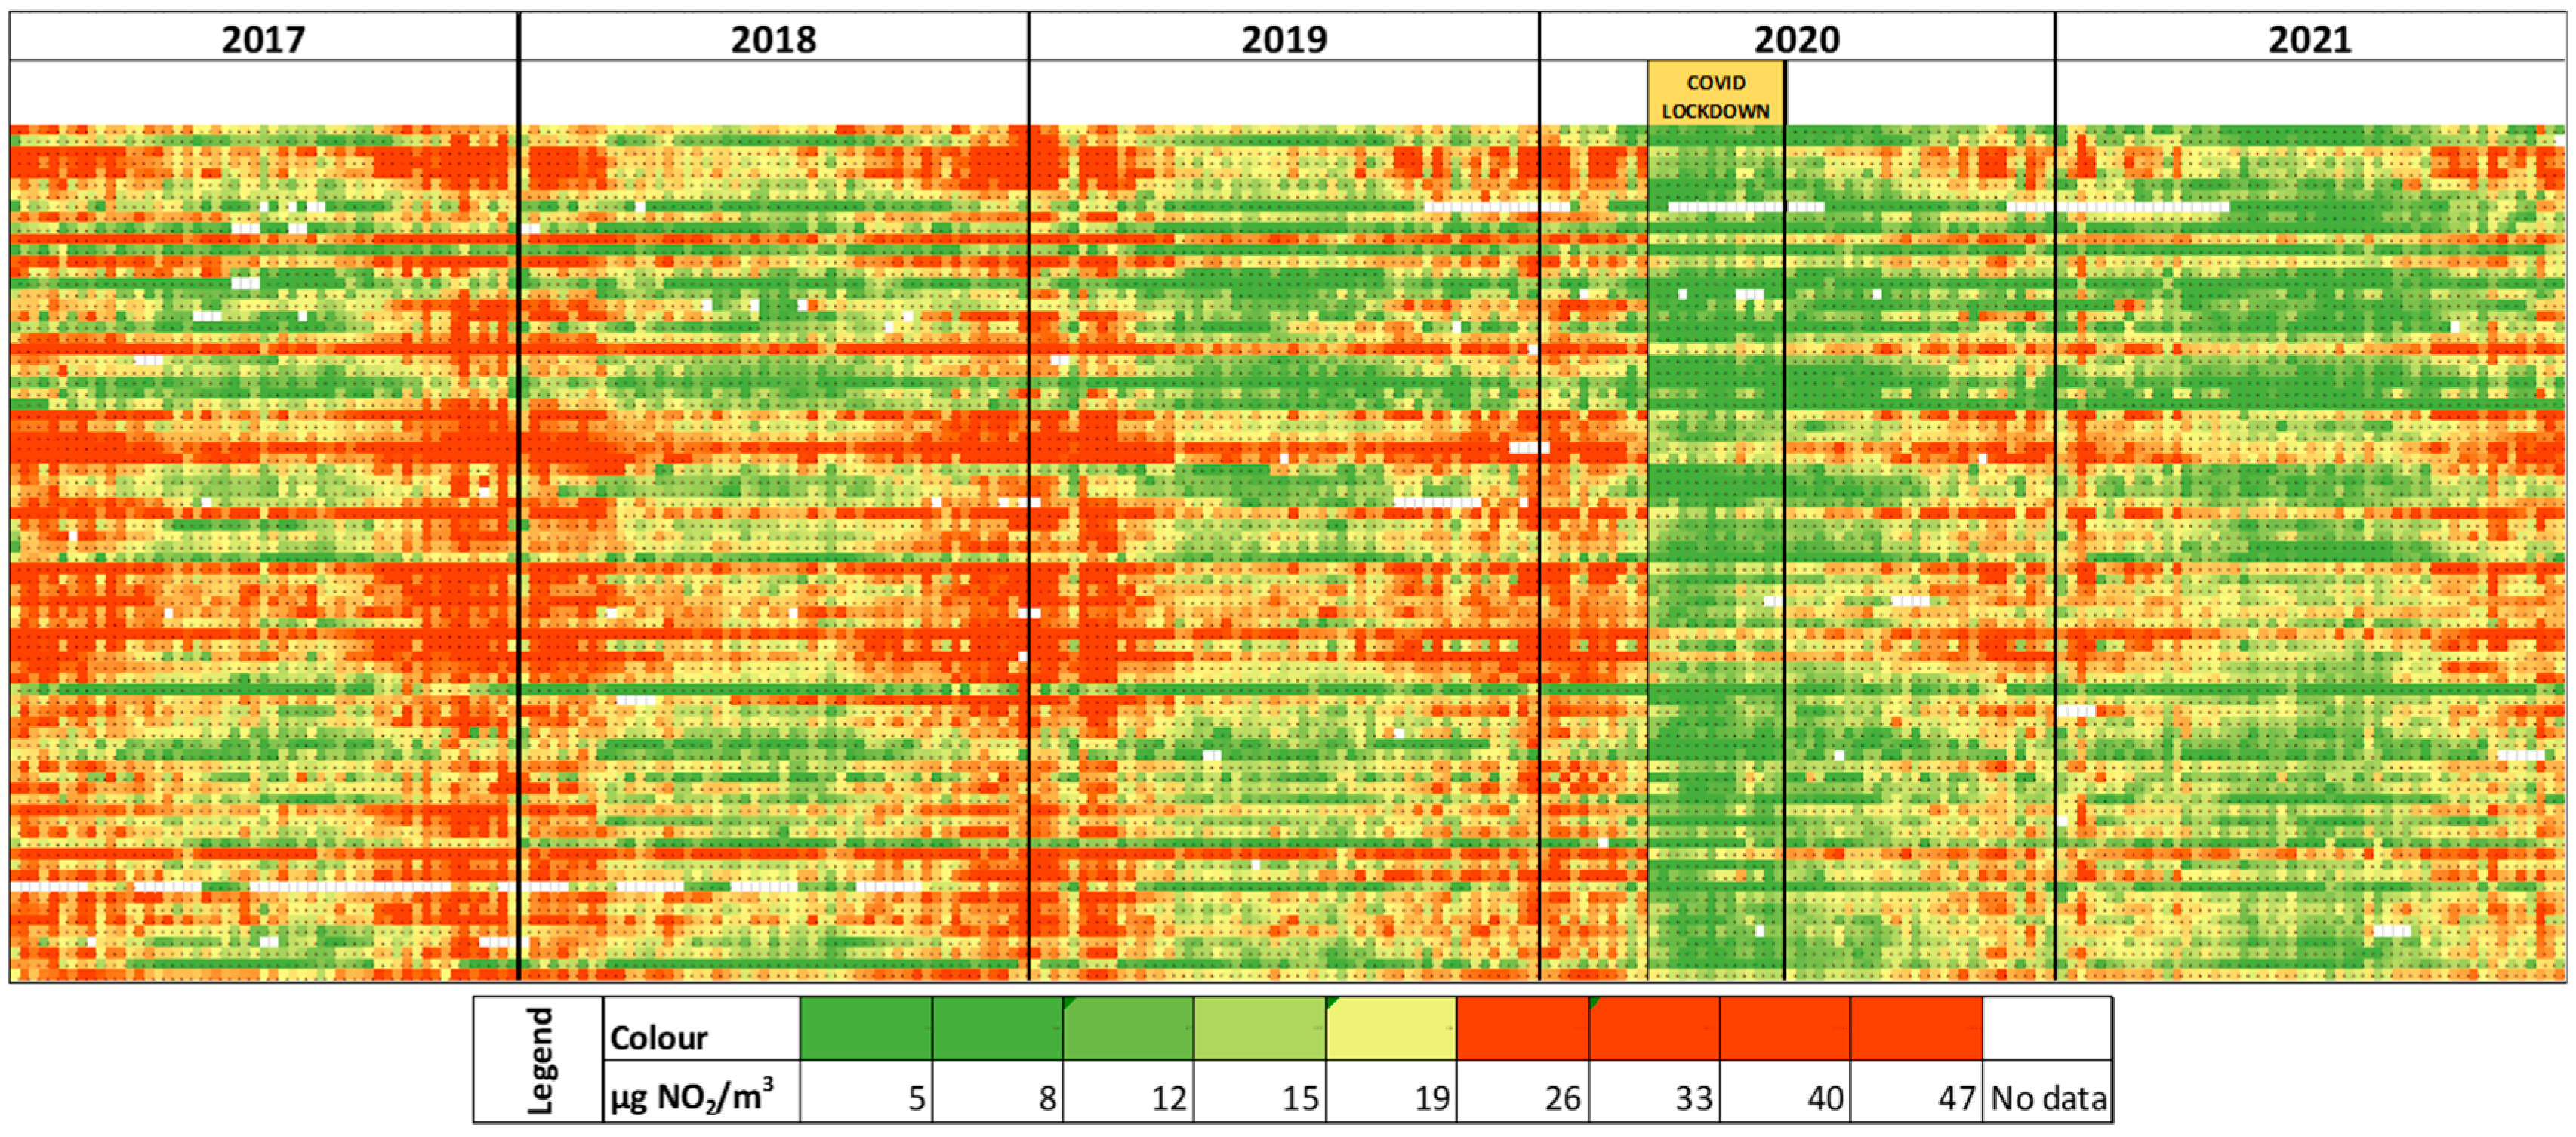
3.2. Impact of the COVID-19 Lockdown

The ANOVA tests between the different periods made it possible to identify the existence of significant differences or the lack thereof in order to statistically demonstrate the real impact of the COVID-19 lockdown, as well as that of the return to normality in productive and social activities. Thus, the periods analyzed were the years 2017, 2018, 2019, 2020, and 2021, the average of the pre-COVID-19 period, and the average of the COVID-19 lockdown months.

3.2.1. Variations in Air Quality Levels between Different Monitored Periods

The results of the ANOVA tests between the different periods analyzed can be seen in Table 3. There were significant differences between the different periods analyzed. However, there are no significant differences in the air quality for the years 2017, 2018, and 2019 (corresponding to the pre-COVID-19 years). In addition, significant differences were found in the ANOVA between 2019 and 2020, between 2019 and 2021, between 2020 and the COVID-19 lockdown average, and between 2021 and the COVID-19 lockdown average. Finally, it was found that there were no significant differences in the monitored air quality between 2020 and 2021. These results indicate that the concentration levels of NO2 during the pre-COVID-19 years did not vary significantly. However, in 2020, with the COVID-19 lockdown restrictions, the concentration levels of the pollutants were significantly reduced, and despite the return to normality, the concentration levels in 2021 were still significantly lower than the pre-pandemic levels. This indicates that, despite the absence of restrictions, which affected the emission of pollutants, new habits were acquired in society that led to fewer emissions of pollutants (for example, teleworking).

3.2.2. Variations in Air Quality Levels between the Clusters and Monitored Periods

Firstly, in all of the periods analyzed, there were always significant differences between the clusters. In addition, in all clusters, significant differences were obtained between 2017, 2018, 2019, 2020, 2021, pre-COVID-19 average, and COVID-19 lockdown average. However, it was found that, between 2020 and 2021, there were no significant differences in any of the clusters. Finally, significant differences were obtained between 2019 and 2020 and between 2019 and 2021 in all clusters. This statistically demonstrates that the impact of COVID-19 restrictions led to statistically significant reductions in NO2 concentration regardless of the size of the city, and this further confirms that, in 2021, the improvements in NO2 concentration that were recorded in 2020 were maintained, despite the restrictions not being active.

3.2.3. Variations in Air Quality Levels between Months

The ANOVA between months that was applied to the 78 cities demonstrated the non-existence of significant differences in most months during the 2017–2019 period. However, starting in March 2020 (the starting month of the COVID-19 lockdown), practically every month showed significant differences compared to the same month in 2019, evidencing the impact of the COVID-19 lockdown restrictions (Table 4). Furthermore, the ANOVA between 2020 and 2021 offered interesting results. First, January and February showed significant differences because they were pre-COVID-19 months. Then, practically every month of the COVID-19 lockdown also presented significant differences because of the impact of the restrictions on air quality. In addition, from the end of the COVID-19 lockdown restrictions, there are no significant differences in any month, except in December, which coincided with another period of restrictions that were implemented for the Christmas holidays. Finally, the ANOVA between 2019 and 2021 showed that, from January to September, significant differences were found due to a reduction in the concentration of NO2. However, from October to the end of the year, there were no significant differences (Table 4). This more detailed monthly analysis seems to indicate that the end of the restrictions and the recovery of production imply that the pre-COVID-19 concentration levels of pollutants were gradually being reached again, despite the fact that the analysis of the average annual values (Section 3.2.1) indicated the opposite.

4. Conclusions

In this work, an analysis of the evolution of the average NO2 levels in 78 Spanish cities with more than 50,000 inhabitants during the pre-COVID-19 years (2017–2019), the period of the COVID-19 lockdown, and the post-COVID-19 year (2021) was presented. First, the air quality improved by 58% compared to that in the pre-COVID-19 period due to the impact of the restrictions caused by COVID-19. In addition, the return to economic normality and the end of COVID-19 restrictions caused NO2 concentration levels to rise again, though they still showed an improvement over the last pre-COVID-19 records by 27%. Thus, improvements in air quality affected the large cities of the four clusters analyzed. However, it was observed that the average value for cities with more than 500,000 inhabitants was 60% higher than the average value for cities with between 50,000 and 100,000 inhabitants in all of the years monitored. In addition, the results obtained in 2021 show that 67 of the 78 large cities analyzed (where 18 million inhabitants live) are above the NO2 limit value recommended by the World Health Organization (WHO) for human protection.
Finally, the significant differences between the annual averages of the different monitored periods were statistically evaluated. The results indicate that there really were significant differences between the pre-COVID-19 period and the post-COVID-19 period, as well as between the different sizes of the cities analyzed. These analyses also statistically demonstrate that the year 2021 maintained part of the improvement in air quality achieved by the COVID-19 lockdown. However, a more detailed monthly analysis indicates that the pre-COVID-19 levels were reached again during the last months of the monitored period.

Supplementary Materials

The following supporting information can be downloaded at: https://www.mdpi.com/article/10.3390/su14095613/s1, Supplementary Material File S1: Weather and altitude maps. Supplementary Material File S2: Data.

Author Contributions

E.L.-S.: Conceptualization, Formal analysis, Methodology, Investigation, Writing—Original draft; J.-V.O.-V.: Conceptualization, Supervision, Writing—Review and editing; E.C.-A.: Supervision, Data curation, Writing—Review and editing; F.P.d.C.: Data gathering, Conceptualization, Formal analysis, Methodology; V.L.-A.: Data curation, Writing—Review and editing, Validation. All authors have read and agreed to the published version of the manuscript.

Funding

This research received no external funding.

Data Availability Statement

The data presented in this study are available in the Supplementary Materials.

Acknowledgments

We would like to thank the Observatorio de la Sostenibilidad team for all of the work done, and especially for the data acquisition and purification work.

Conflicts of Interest

The authors declare no conflict of interest.

References

  1. Lelieveld, J.; Klingmüller, K.; Pozzer, A.; Pöschl, U.; Fnais, M.; Daiber, A.; Münzel, T. Cardiovascular disease burden from ambient air pollution in Europe reassessed using novel hazard ratio functions. Eur. Heart J. 2019, 40, 1590–1596. [Google Scholar] [CrossRef] [PubMed] [Green Version]
  2. American Thoracic Society (ATC). What constitutes an adverse health effect of air pollution? Official statement of the American Thoracic Society. Am. J. Respir. Crit. Care Med. 2000, 161, 665–673. [Google Scholar] [CrossRef] [Green Version]
  3. European Environmental Agency. Air Quality in Europe—2019 Report. Report Nº 10/2019. Available online: https://www.eea.europa.eu/publications/air-quality-in-europe-2019 (accessed on 7 April 2022).
  4. Guttikunda, S.K.; Nishadh, K.A.; Jawahar, P. Air pollution knowledge assessments (APnA) for 20 Indian cities. Urban Clim. 2019, 27, 124–141. [Google Scholar] [CrossRef]
  5. Costa, S.; Ferreira, J.; Silveira, C.; Costa, C.; Lopes, D.; Relvas, H.; Borrego, C.; Roebeling, P.; Miranda, A.I.; Teixeira, J.P. Integrating Health on Air Quality Assessment—Review Report on Health Risks of Two Major European Outdoor Air Pollutants: PM and NO2. J. Toxicol. Environ. Health 2014, 17, 307–340. [Google Scholar] [CrossRef] [PubMed]
  6. European Commission. Directive 2008/50/EC on Ambient Air Quality and Cleaner Air for Europe. European Parliament and of the Council. 21 May 2008. Available online: https://www.eea.europa.eu/policy-documents/directive-2008-50-ec-of (accessed on 7 April 2022).
  7. Carnell, E.; Vieno, M.; Vardoulakis, S.; Beck, R.; Heaviside, C.; Tomlinson, S.; Dragosits, U.; Heal, M.R.; Reis, S. Modelling public health improvements as a result of air pollution control policies in the UK over four decades—1970 to 2010. Environ. Res. Lett. 2019, 14, 074001. [Google Scholar] [CrossRef]
  8. Committee on the Medical Effects of Air Pollutants (COMEAP). Review of the UK Air Quality Index: A Report by the Committee on the Medical Effects of Air Pollutants. Didcot: Health Protection Agency. 2011. Available online: www.hpa.org.uk/webc/HPAwebFile/HPAweb_C/1317137023144 (accessed on 22 March 2014).
  9. World Health Organization. WHO Global Air Quality Guidelines. Particulate Matter (PM2.5 and PM10), Ozone, Nitrogen Dioxide, Sulphur Dioxide and Carbon Monoxide; World Health Organization: Geneva, Switzerland, 2021; Available online: https://www.who.int/publications/i/item/9789240034228 (accessed on 7 April 2022).
  10. Ching, J.; Kajino, M. Rethinking Air Quality and Climate Change after COVID-19. Int. J. Environ. Res. Public Health 2020, 17, 5167. [Google Scholar] [CrossRef] [PubMed]
  11. Hu, M.; Chen, Z.; Cui, H.; Wang, T.; Zhang, C.; Yun, K. Air pollution and critical air pollutant assessment during and after COVID-19 lockdowns: Evidence from pandemic hotspots in China, the Republic of Korea, Japan, and India. Atmos. Pollut. Res. 2020, 12, 316–329. [Google Scholar] [CrossRef] [PubMed]
  12. Rossi, R.; Ceccato, R.; Gastaldi, M. Effect of road traffic on air pollution. Experimental evidence from COVID-19 lockdown. Sustainability 2020, 12, 8984. [Google Scholar] [CrossRef]
  13. Meteorology Statal Agency (AEMET). Available online: http://www.aemet.es/en/serviciosclimaticos/datosclimatologicos/valoresclimatologicos (accessed on 7 April 2022).
  14. Roberts–Semple, D.; Song, F.; Gao, Y. Seasonal characteristics of ambient nitrogen oxides and ground–level ozone in metropolitan northeastern New Jersey. Atmos. Pollut. Res. 2012, 3, 247–257. [Google Scholar] [CrossRef] [Green Version]
  15. Sadanaga, Y.; Shibata, S.; Hamana, M.; Takenaka, N.; Bandow, H. Weekday/weekend difference of ozone and its precursors in urban areas of Japan, focusing on nitrogen oxides and hydrocarbons. Atmos. Environ. 2008, 42, 4708–4723. [Google Scholar] [CrossRef]
  16. Geddes, J.A.; Murphy, J.G.; Wang, D.K. Long term changes in nitrogen oxides and volatile organic compounds in Toronto and the challenges facing local ozone control. Atmos. Environ. 2009, 43, 3407–3415. [Google Scholar] [CrossRef]
Figure 1. Location of the Spanish cities by cluster.
Sustainability 14 05613 g001
Figure 2. Evolution of the NO2 concentration from 2017 to 2021 in 78 large cities in Spain.
Sustainability 14 05613 g002
Table 1. Spanish and regional government strategies against COVID-19.
Strategy StageMeasurePeriod
COVID-19 LOCKDOWNResilienceTotal lockdown15 March–26 April 2020
Flexible lockdown27 April–3 May 2020
RecoveryPhase 04–17 May 2020
Phase 118–31 May 2020
Phase 21–14 June 2020
Phase 315–21 June 2020
New normality22 June 2020–present
Table 2. Average NO2 concentrations in µg/m3 NO2 in the 78 analyzed cities classified by cluster and period.
Annual AveragePeriod Average (2017–2021)Pre-COVID-19 Period (2017–2020)COVID-19 Lockdown (March–May 2020)
Cluster20172018201920202021
120.217.817.113.313.716.418.47.4
224.522.121.416.917.020.422.79.6
326.125.523.617.917.122.025.110.8
433.129.327.821.821.426.730.112.8
Total Average24.021.720.816.316.319.822.29.3
Table 3. The results obtained in the ANOVA of the NO2 concentrations in the different monitored periods.
Are There Significant Differences?
Period AnalyzedYesNo
2017, 2018, 2019, 2020, 2021, pre-COVID-19 average, and COVID-19 lockdown averageX
2017, 2018, 2019, and pre-COVID-19 average X
2017, 2018, and 2019 X
2019 and 2020X
2019 and 2021X
2020 and COVID-19 lockdown averageX
2020 and 2021 X
2021 and COVID-19 lockdown averageX
Table 4. Results obtained with the ANOVA tests between the NO2 concentrations of each month and those of the same month in the different monitored periods.
Are There Significant Differences between the Same Months of These Periods?
2017, 2018, 2019, 2020, and 20212019 and 20202020 and 20212019 and 2021
JanuaryYesNoYesYes
FebruaryYesNoYesYes
March 1YesYesYesYes
April 1YesYesYesYes
May 1YesYesYesYes
June 1YesYesNoYes
JulyYesYesNoYes
AugustYesYesNoYes
SeptemberYesYesNoYes
OctoberYesYesNoNo
NovemberYesNoNoNo
December 2YesYesYesNo
1 COVID-19 lockdown months during 2020. 2 COVID-19 restrictions for Christmas in December 2020.
Publisher’s Note: MDPI stays neutral with regard to jurisdictional claims in published maps and institutional affiliations.

