
A Combined IO-DEMATEL Analysis for Evaluating Sustainable Effects of the Sharing Related Industries Development


Abstract
:1. Introduction
- RQ1.
- How to evaluate the impact of sharing activities on the production of relevant upstream and downstream industries?
- RQ2.
- What benefits does the implementation of sharing activities bring to other departments and the industrial structure?
- RQ3.
- How prominent are sharing activities in the economic system, and how should they superiorly develop?
2. Sharing Economy, Sustainable Production, and Consumption
2.1. Theoretical Mechanism
2.1.1. Supply Side: Improve the Quality of Supply
2.1.2. Demand Side: Stimulate Market Demand
2.1.3. Market Entities: Increase Interaction
2.2. Literature Review
2.2.1. The Debates on Sustainable Effects of the SE
2.2.2. The Challenges of Methodology and Data Acquisition
3. Methods
3.1. IO Method and Correlation Indicator
3.1.1. A Brief Introduction to the IO Method
3.1.2. Adopted Indicator
3.2. Improved DEMATEL Approach and Correlation Indicators
3.2.1. A Brief Introduction to the DEMATEL Approach
3.2.2. The Improved DEMATEL Approach Embedding IOT
3.2.3. Correlation Indicators
- (I)
- Define the direct influence matrix
- (II)
- Define the total influence matrix
- (III)
- Measure the industry’s inputs- and outputs-oriented influence strength
- (IV)
- Identify the outstanding industries
4. Materials and Data
5. Results
5.1. Calculation of Upstream and Downstream Industry Connections
5.2. Calculation and Results on Industry’s Influence Power
5.2.1. Results of Influencing Power Based on Outputs
5.2.2. Results of Influencing Power Based on Inputs
5.2.3. Results of Influencing Power Combined Inputs and Outputs
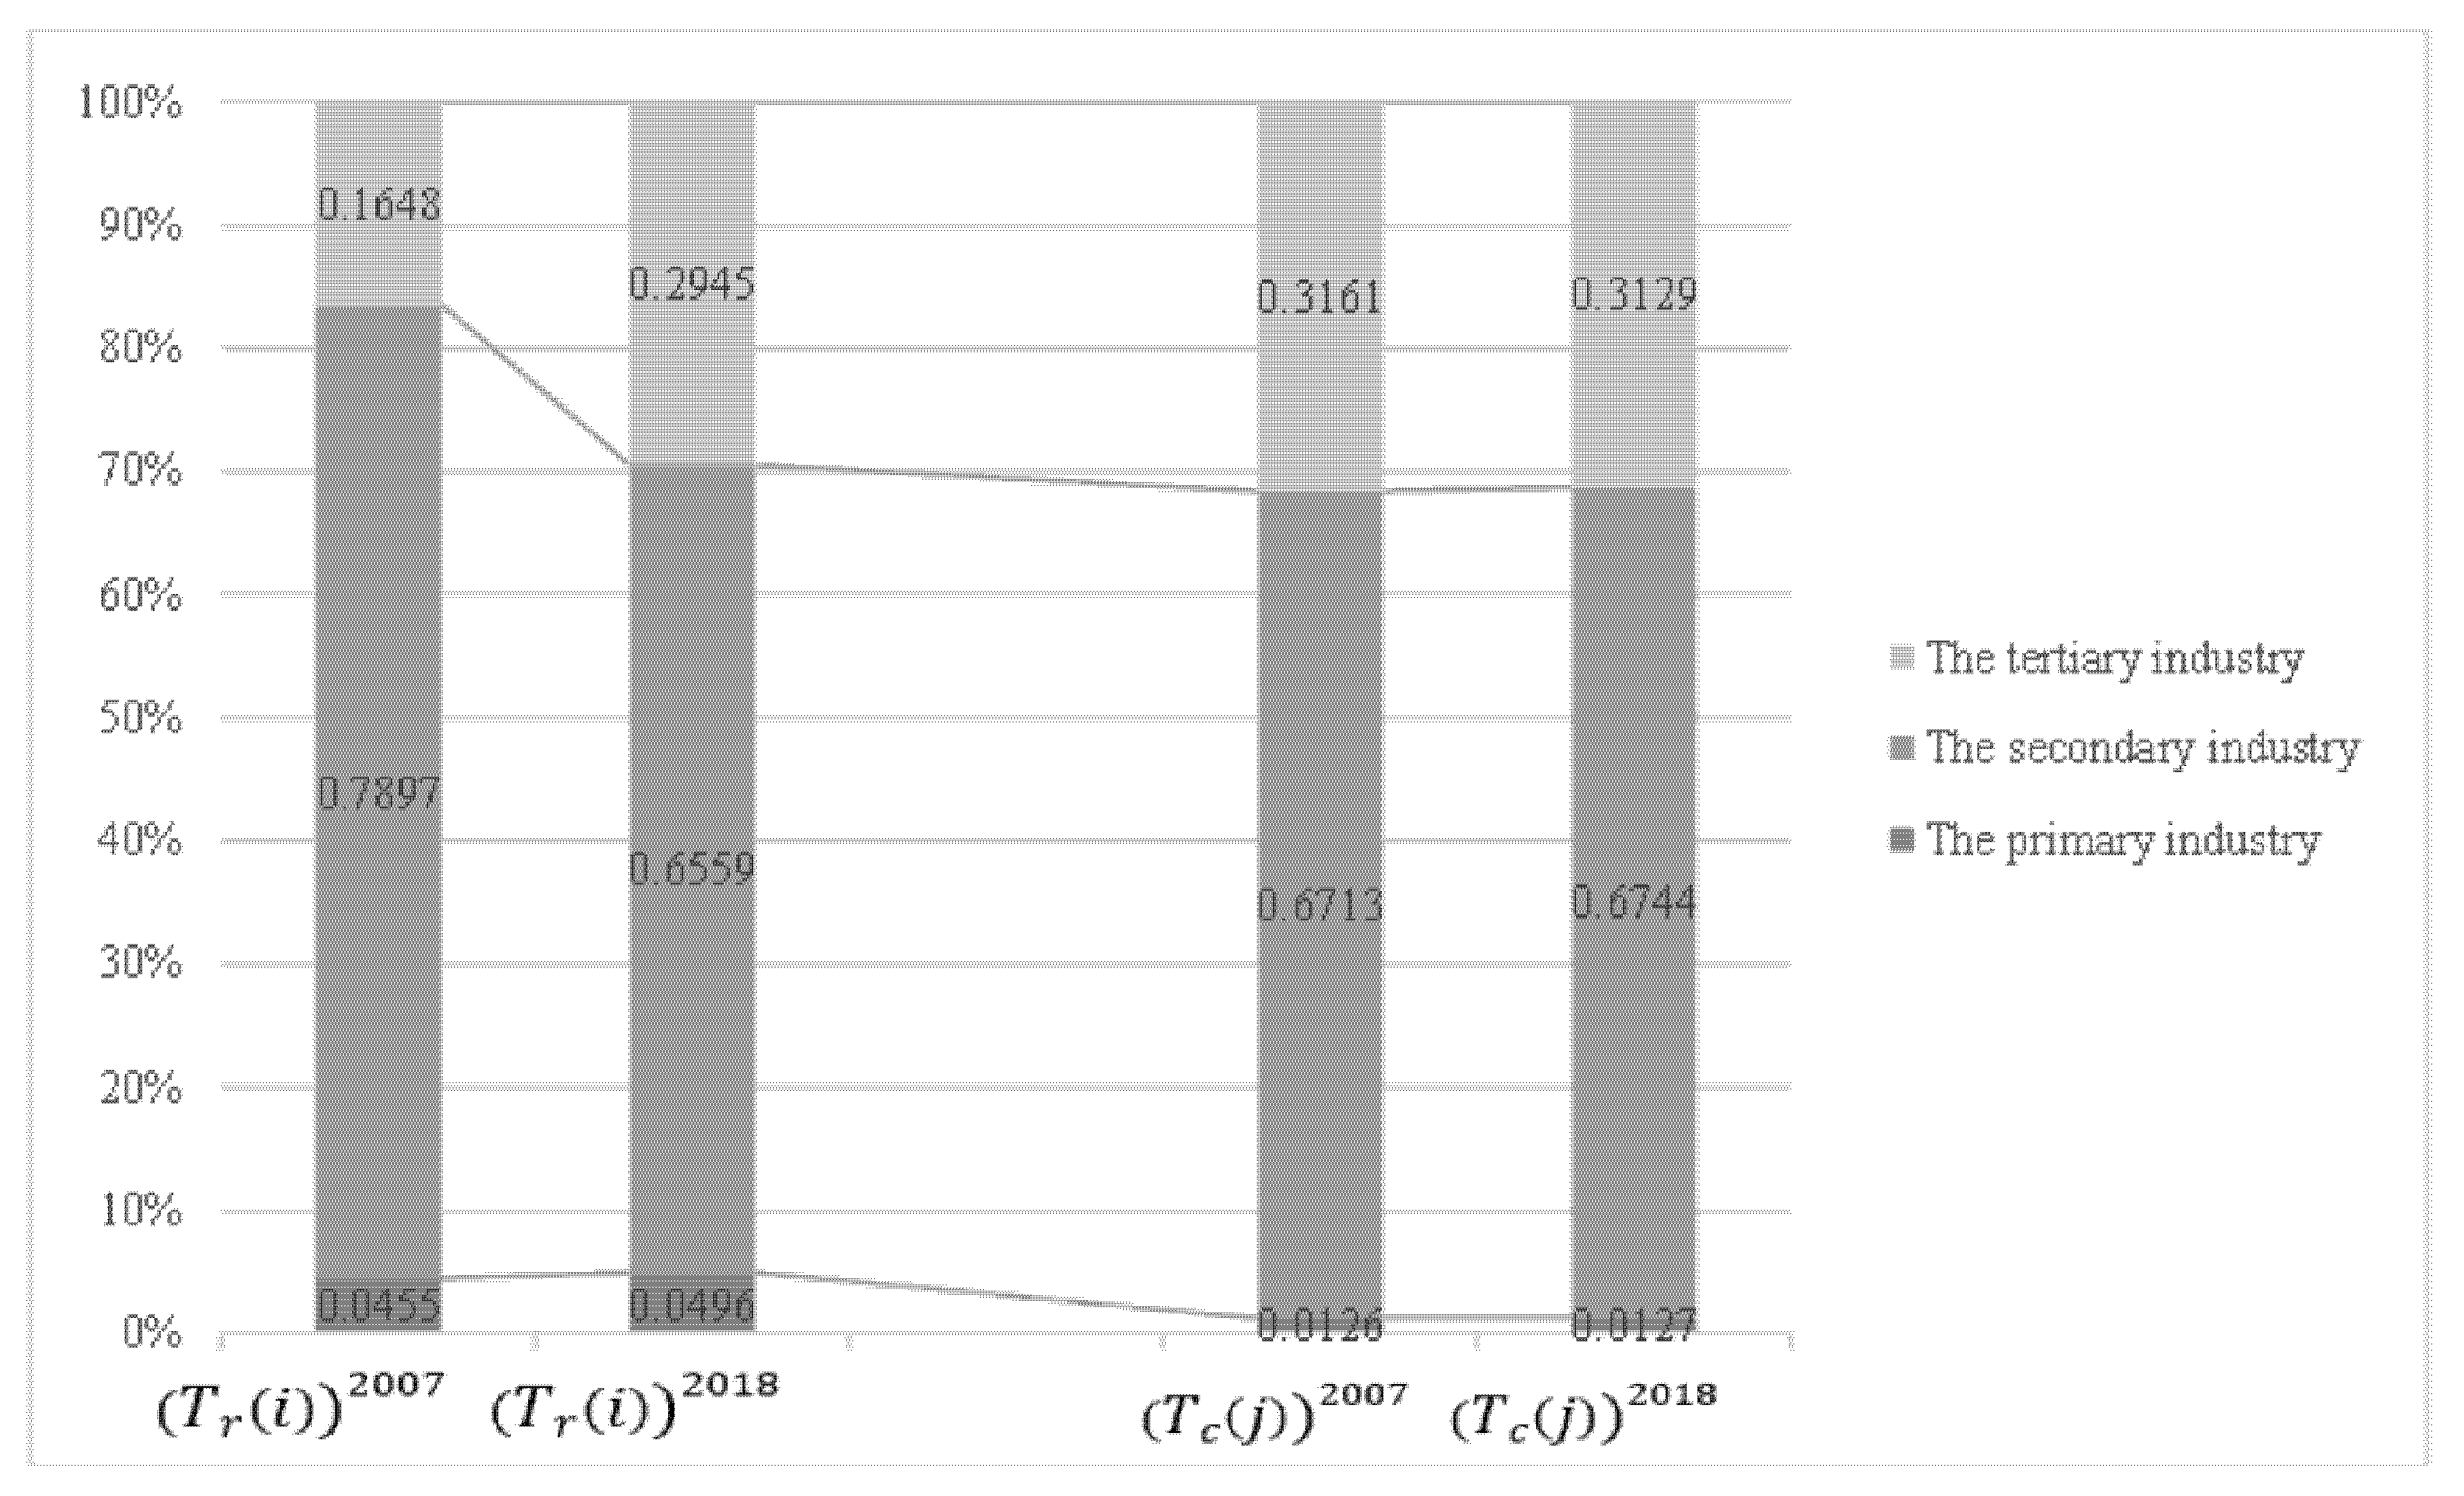
5.3. Calculation and Results of Industrial Structure
6. Discussions and Policy Implications
6.1. Discussions
6.2. Identification of Prominent Industries and Corresponding Policy Suggestions
6.2.1. Static Identification and Suggestions
6.2.2. Dynamic Identification and Suggestions
6.2.3. Identification and Suggestions for the Sharing Related Industries
7. Conclusions and Future Research Directions
7.1. Conclusions
7.2. Future Research Directions
Author Contributions
Funding
Institutional Review Board Statement
Informed Consent Statement
Data Availability Statement
Conflicts of Interest
Abbreviations
| Abbreviations | Un-Abbreviations |
| SE | Sharing economy |
| GDP | Gross Domestic Product |
| IO | Input–Output |
| DEMATEL | Decision-Making and Trial Evaluation Laboratory |
| TVA | Total Value Added |
| VA001 | Compensation of Employees |
| VA002 | Net Taxer on Production |
| VA003 | Depreciation of Fixed Assets |
| VA004 | Operating Surplus |
| TFU | Total Final Use |
| TC | Total Final Consumption Expenditure |
| GCF | Gross Fixed Capital Formation |
| EX | Exports |
| TII | Total Intermediate Inputs |
| TIU | Total Intermediate Use |
| TI | Total Inputs |
| GO | Gross Output |
| U | Use/Output |
| I | Input |
| NBS | The National Bureau of Statistics of China |
| SERC | Sharing Economy Research Center of the State Information Center |
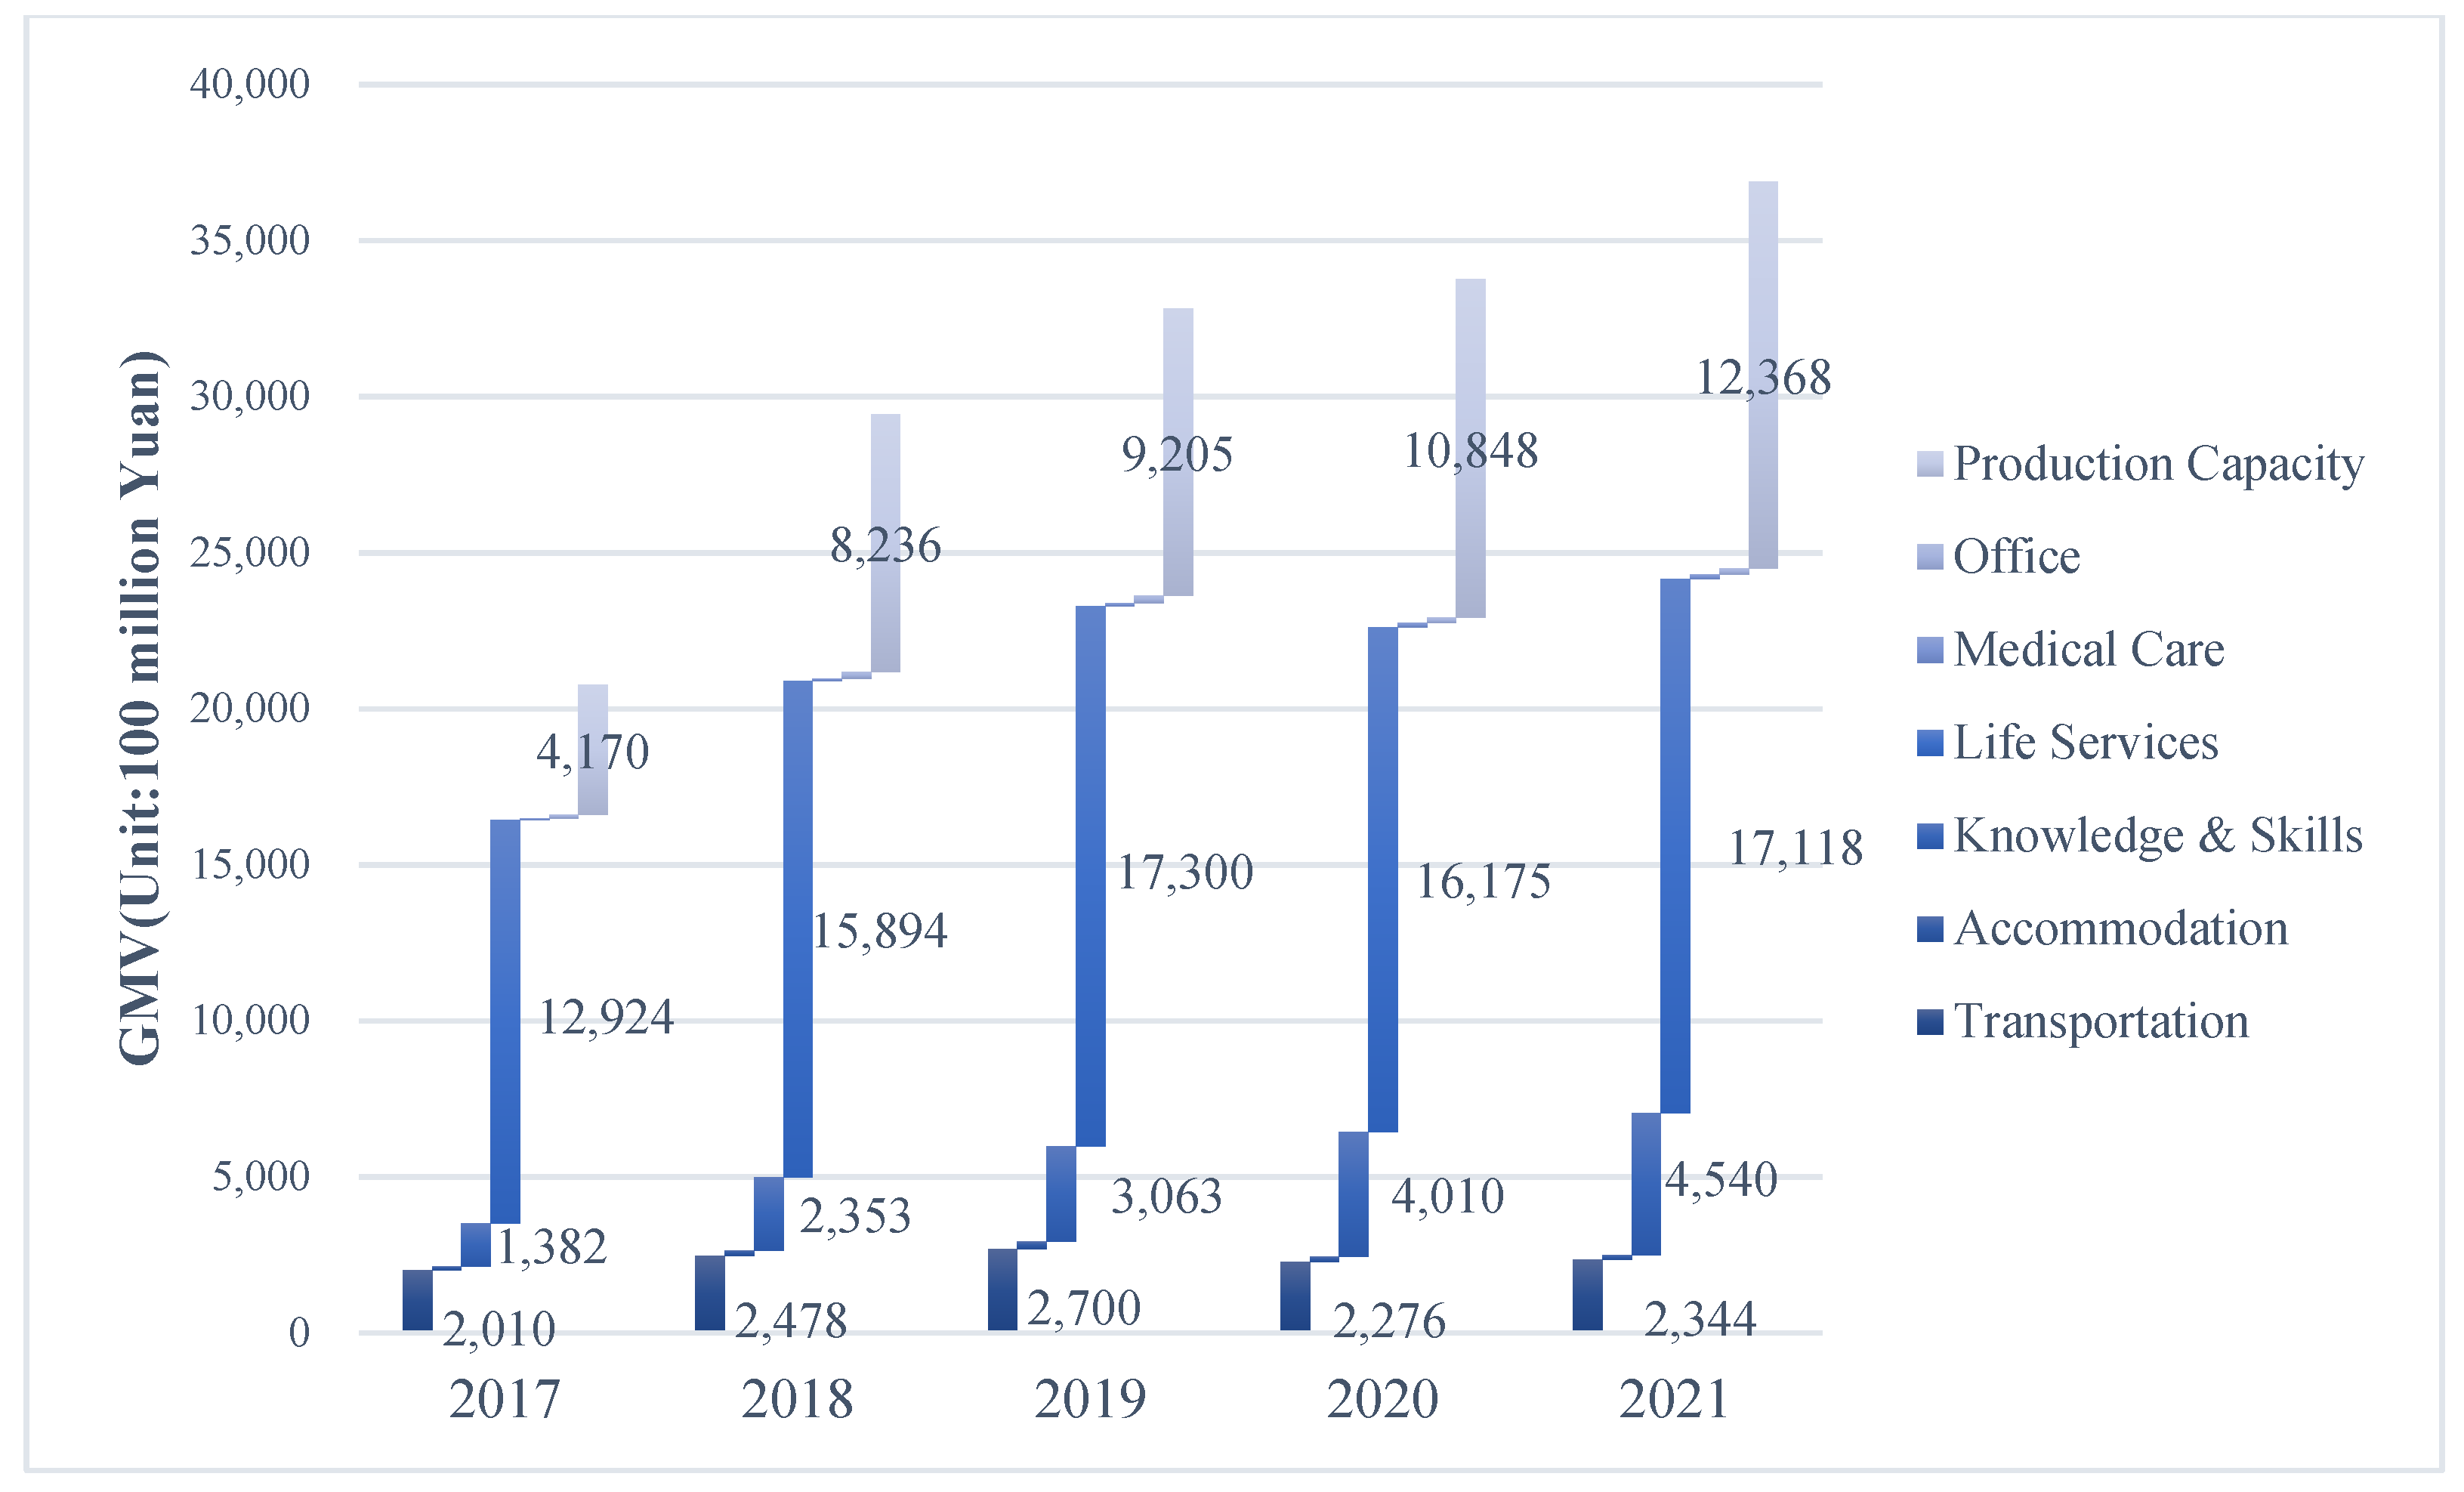
| GMV | Gross Merchandise Volume |
Appendix A
| Code | Sector |
|---|---|
| 01 | Farming, Forestry, Animal Production and Fishery |
| 02 | Mining |
| 03 | Manufacture of Food and Tobacco |
| 04 | Manufacture of Textiles |
| 05 | Manufacture of Textiles Wearing Apparel, Leather, Fur, Feather and Its Products and Footwear |
| 06 | Manufacture of Wood and Furniture |
| 07 | Papermaking, Printing, Stationeries, Musical Instruments, Sports Goods, Game and Toys |
| 08 | Manufacture of Refined Petroleum, Coke Products, Processing of Other Fuel |
| 09 | Chemical industry |
| 10 | Manufacture of Nonmetallic Mineral |
| 11 | Manufacture and Processing of Ferrous Metals |
| 12 | Manufacture and Processing of non-Ferrous Metals |
| 13 | Manufacture of Fabricated Metals Products |
| 14 | Manufacture of General- and Special-Purpose Machinery |
| 15 | Manufacture of Motor Vehicle |
| 16 | Manufacture of Railway Transport Equipment, Boats |
| 17 | Manufacture of Aircraft and Spacecraft and Other Transport Equipment |
| 18 | Manufacture of Electrical Machinery and Apparatus |
| 19 | Manufacture of Computer, Communication Equipment, and Other Electronic Equipment |
| 20 | Manufacture of Measuring Instruments, Arts and Crafts, Other |
| 21 | Utilization of Waste Resources |
| 22 | Production and Supply of Electricity and Steam |
| 23 | Production and Distribution of Gas |
| 24 | Production and Distribution of Water |
| 25 | Construction |
| 26 | Wholesale Trade and Retail Trade |
| 27 | Transport via Road |
| 28 | Railway, Water, Air, Other Transport and Storage |
| 29 | Post |
| 30 | Accommodation |
| 31 | Food and Beverage Services |
| 32 | Transmission, Software and Information Technology Services |
| 33 | Finance |
| 34 | Real Estate |
| 35 | Renting and Leasing |
| 36 | Business Services |
| 37 | Research and Development, Technical Services |
| 38 | Management of Water Conservancy, Environment and Public Facilities |
| 39 | Services to Households, Repair, and Other Services |
| 40 | Education |
| 41 | Health Care and Social Work Activities |
| 42 | Culture, Sports and Entertainment |
| 43 | Public Management, Social Security and Social Organizations |
References
- UN 17 Goals to Transform Our World. Available online: https://www.un.org/sustainabledevelopment/ (accessed on 20 March 2022).
- Boar, A.; Bastida, R.; Marimon, F. A Systematic Literature Review. Relationships between the Sharing Economy, Sustainability and Sustainable Development Goals. Sustainability 2020, 12, 6744. [Google Scholar] [CrossRef]
- Zaccaï, E. Sustainable Consumption, Ecology and Fair Trade; Routledge: London, UK, 2007; Volume 156. [Google Scholar]
- Pradhan, P.; Costa, L.; Rybski, D.; Lucht, W.; Kropp, J.P. A Systematic Study of Sustainable Development Goal (SDG) Interactions. Earth Future 2017, 5, 1169–1179. [Google Scholar] [CrossRef] [Green Version]
- Wei, L.Y.; Li, M.Y.; Zuo, J.; Wang, X.; Wang, Z.; Wang, J.; Yan, H.; Liu, S.N.; Peng, S.; Hong, S.; et al. Carbon spillover and feedback effects of the middle class in China. J. Clean. Prod. 2021, 329, 129738. [Google Scholar] [CrossRef]
- Mont, O.; Palgan, Y.V.; Bradley, K.; Zvolska, L. A decade of the sharing economy: Concepts, users, business and governance perspectives. J. Clean. Prod. 2020, 269, 9. [Google Scholar] [CrossRef]
- Cohen, B.; Munoz, P. Sharing cities and sustainable consumption and production: Towards an integrated framework. J. Clean. Prod. 2016, 134, 87–97. [Google Scholar] [CrossRef]
- Cherry, C.E.; Pidgeon, N.F. Is sharing the solution? Exploring public acceptability of the sharing economy. J. Clean. Prod. 2018, 195, 939–948. [Google Scholar] [CrossRef]
- Heinrichs, H. Sharing Economy: A Potential New Pathway to Sustainability. Gaia 2013, 22, 228–231. [Google Scholar] [CrossRef]
- Hamari, J.; Sjoklint, M.; Ukkonen, A. The sharing economy: Why people participate in collaborative consumption. J. Assoc. Inf. Sci. Technol. 2016, 67, 2047–2059. [Google Scholar] [CrossRef]
- Hossain, M. Sharing economy: A comprehensive literature review. Int. J. Hosp. Manag. 2020, 134, 87–97. [Google Scholar] [CrossRef]
- Zhang, G.L.; Wang, L.Y.; Shi, P.F. Research on Sharing Intention Formation Mechanism Based on the Burden of Ownership and Fashion Consciousness. Sustainability 2019, 11, 992. [Google Scholar] [CrossRef] [Green Version]
- The State Council. China Government Work Report 2021; The State Council: Beijing, China, 2021. Available online: http://www.gov.cn/gongbao/content/2021/content5593438.htm (accessed on 3 May 2022).
- The State Information Center. China Sharing Economy Development Report 2022; The State Information Center: Beijing, China, 2022.
- Schor, J.B.; Fitzmaurice, C.; Carfagna, L.B.; Attwood-Charles, W. Paradoxes of openness and distinction in the sharing economy. Poetics 2016, 54, 66–81. [Google Scholar] [CrossRef]
- Martin, C.J. The sharing economy: A pathway to sustainability or a nightmarish form of neoliberal capitalism? Ecol. Econ. 2016, 121, 149–159. [Google Scholar] [CrossRef]
- Ye, F.; Ni, D.B.; Li, K.W. Competition between manufacturers and sharing economy platforms: An owner base and sharing utility perspective. Int. J. Prod. Econ. 2021, 234, 16. [Google Scholar] [CrossRef]
- Ghisellini, P.; Cialani, C.; Ulgiati, S. A review on circular economy: The expected transition to a balanced interplay of environmental and economic systems. J. Clean. Prod. 2016, 114, 11–32. [Google Scholar] [CrossRef]
- De Lange, D.; Valliere, D. Investor preferences between the sharing economy and incumbent firms. J. Bus. Res. 2020, 116, 37–47. [Google Scholar] [CrossRef]
- Jiang, B.J.; Tian, L. Collaborative Consumption: Strategic and Economic Implications of Product Sharing. Manag. Sci. 2018, 64, 1171–1188. [Google Scholar] [CrossRef]
- Martin, M.; Lazarevic, D.; Gullstrom, C. Assessing the Environmental Potential of Collaborative Consumption: Peer-to-Peer Product Sharing in Hammarby Sjostad, Sweden. Sustainability 2019, 11, 190. [Google Scholar] [CrossRef] [Green Version]
- Melo, S.; Macedo, J.; Baptista, P. Capacity-sharing in logistics solutions: A new pathway towards sustainability. Transp. Policy 2019, 73, 143–151. [Google Scholar] [CrossRef]
- Paundra, J.; van Dalen, J.; Rook, L.; Ketter, W. Ridesharing platform entry effects on ownership -based consumption in Indonesia. J. Clean. Prod. 2020, 265, 11. [Google Scholar] [CrossRef]
- Enochsson, L.; Palgan, Y.V.; Plepys, A.; Mont, O. Impacts of the Sharing Economy on Urban Sustainability: The Perceptions of Municipal Governments and Sharing Organisations. Sustainability 2021, 13, 4213. [Google Scholar] [CrossRef]
- Ma, Y.G.; Rong, K.; Mangalagiu, D.; Thornton, T.F.; Zhu, D. Co-evolution between urban sustainability and business ecosystem innovation: Evidence from the sharing mobility sector in Shanghai. J. Clean. Prod. 2018, 188, 942–953. [Google Scholar] [CrossRef]
- Curtis, S.K.; Mont, O. Sharing economy business models for sustainability. J. Clean. Prod. 2020, 266, 15. [Google Scholar] [CrossRef] [PubMed]
- Plepys, A.; Singh, J. Evaluating the sustainability impacts of the sharing economy using input-output analysis. In A Research Agenda for Sustainable Consumption Governance; Edward Elgar Publishing: Cheltenham, UK, 2019. [Google Scholar]
- Wang, D.; Yan, L.; Ruan, F.L.; Zeng, X.H. An Abductive Analysis of Debates on the Impact of the Sharing Economy: A Systematic Review in a Sustainable Framework. Sustainability 2022, 14, 3996. [Google Scholar] [CrossRef]
- Mair, J.; Reischauer, G. Capturing the dynamics of the sharing economy: Institutional research on the plural forms and practices of sharing economy organizations. Technol. Forecast. Soc. Chang. 2017, 125, 11–20. [Google Scholar] [CrossRef]
- Zvolska, L.; Palgan, Y.V.; Mont, O. How do sharing organisations create and disrupt institutions? Towards a framework for institutional work in the sharing economy. J. Clean. Prod. 2019, 219, 667–676. [Google Scholar] [CrossRef]
- Harris, S.; Mata, E.; Plepys, A.; Katzeff, C. Sharing is daring, but is it sustainable? An assessment of sharing cars, electric tools and offices in Sweden. Resour. Conserv. Recycl. 2021, 170, 13. [Google Scholar] [CrossRef]
- Pouri, M.J.; Hilty, L.M. The digital sharing economy: A confluence of technical and social sharing. Environ. Innov. Soc. Trans. 2021, 38, 127–139. [Google Scholar] [CrossRef]
- Choi, T.M.; Guo, S.; Liu, N.; Shi, X.T. Values of food leftover sharing platforms in the sharing economy. Int. J. Prod. Econ. 2019, 213, 23–31. [Google Scholar] [CrossRef]
- Hu, J.Y.; Liu, Y.L.; Yuen, T.W.W.; Lim, M.K.; Hu, J.L. Do green practices really attract customers? The sharing economy from the sustainable supply chain management perspective. Resour. Conserv. Recycl. 2019, 149, 177–187. [Google Scholar] [CrossRef]
- Schneider, P.; Folkens, L.; Meyer, A.; Fauk, T. Sustainability and Dimensions of a Nexus Approach in a Sharing Economy. Sustainability 2019, 11, 909. [Google Scholar] [CrossRef] [Green Version]
- Benjaafar, S.; Kong, G.W.; Li, X.; Courcoubetis, C. Peer-to-Peer Product Sharing: Implications for Ownership, Usage, and Social Welfare in the Sharing Economy. Manag. Sci. 2019, 65, 477–493. [Google Scholar] [CrossRef] [Green Version]
- Pies, I.; Hielscher, S.; Everding, S. Do hybrids impede sustainability? How semantic reorientations and governance reforms can produce and preserve sustainability in sharing business models. J. Bus. Res. 2020, 115, 174–185. [Google Scholar] [CrossRef]
- Ferrell, O.C.; Ferrell, L.; Huggins, K. Seismic shifts in the sharing economy: Shaking up marketing channels and supply chains. J. Mark. Channels 2017, 24, 3–12. [Google Scholar] [CrossRef]
- Etter, M.; Fieseler, C.; Whelan, G. Sharing Economy, Sharing Responsibility? Corporate Social Responsibility in the Digital Age. J. Bus. Ethics 2019, 159, 935–942. [Google Scholar] [CrossRef]
- Davlembayeva, D.; Papagiannidis, S.; Alamanos, E. Sharing economy platforms: An equity theory perspective on reciprocity and commitment. J. Bus. Res. 2021, 127, 151–166. [Google Scholar] [CrossRef]
- Tirachini, A. Ride-hailing, travel behaviour and sustainable mobility: An international review. Transportation 2020, 47, 2011–2047. [Google Scholar] [CrossRef]
- Wise, N. Outlining triple bottom line contexts in urban tourism regeneration. Cities 2016, 53, 30–34. [Google Scholar] [CrossRef]
- Sun, S.H.; Ertz, M. Environmental impact of mutualized mobility: Evidence from a life cycle perspective. Sci. Total Environ. 2021, 772, 13. [Google Scholar] [CrossRef]
- Wang, X.; Wang, S.; Wang, L.; Fan, F. Has ridesourcing reduced haze? An analysis using the Didi app. Environ. Sci. Pollut. Res. 2021, 28, 45571–45585. [Google Scholar] [CrossRef]
- Chen, J.R.; Zhou, D.; Zhao, Y.; Wu, B.H.; Wu, T. Life cycle carbon dioxide emissions of bike sharing in China: Production, operation, and recycling. Resour. Conserv. Recycl. 2020, 162, 12. [Google Scholar] [CrossRef]
- Kou, Z.Y.; Wang, X.; Chiu, S.F.; Cai, H. Quantifying greenhouse gas emissions reduction from bike share systems: A model considering real-world trips and transportation mode choice patterns. Resour. Conserv. Recycl. 2020, 153, 17. [Google Scholar] [CrossRef]
- Cheng, M.M.; Chen, G.W.; Wiedmann, T.; Hadjikakou, M.; Xu, L.X.; Wang, Y.F. The sharing economy and sustainability—Assessing Airbnb’s direct, indirect and induced carbon footprint in Sydney. J. Sustain. Tour. 2020, 28, 1083–1099. [Google Scholar] [CrossRef]
- DiNatale, S.; Lewis, R.; Parker, R. Short-term rentals in small cities in Oregon: Impacts and regulations. Land Use Pol. 2018, 79, 407–423. [Google Scholar] [CrossRef]
- Alvarez-Herranz, A.; Macedo-Ruiz, E. An Evaluation of the Three Pillars of Sustainability in Cities with High Airbnb Presence: A Case Study of the City of Madrid. Sustainability 2021, 13, 3220. [Google Scholar] [CrossRef]
- Martin, J.M.M.; Martinez, J.M.G.; Fernandez, J.A.S. An Analysis of the Factors behind the Citizen’s Attitude of Rejection towards Tourism in a Context of Overtourism and Economic Dependence on This Activity. Sustainability 2018, 10, 2851. [Google Scholar] [CrossRef] [Green Version]
- Aznar, J.P.; Sayeras, J.M.; Galiana, J.; Rocafort, A. Sustainability Commitment, New Competitors’ Presence, and Hotel Performance: The Hotel Industry in Barcelona. Sustainability 2016, 8, 755. [Google Scholar] [CrossRef] [Green Version]
- Schor, J. Debating the sharing economy. J. Self-Gov. Manag. Econ. 2016, 4, 7–22. [Google Scholar]
- Song, H.Y.; Xie, K.R.; Park, J.; Chen, W. Impact of accommodation sharing on tourist attractions. Ann. Touris. Res. 2020, 80, 16. [Google Scholar] [CrossRef]
- Underwood, A.; Fremstad, A. Does sharing backfire? A decomposition of household and urban economies in CO2 emissions. Energy Policy 2018, 123, 404–413. [Google Scholar] [CrossRef]
- Pouri, M.J.; Hilty, L.M. Conceptualizing the Digital Sharing Economy in the Context of Sustainability. Sustainability 2018, 10, 4453. [Google Scholar] [CrossRef] [Green Version]
- Moon, D.; Amasawa, E.; Hirao, M. Consumer Motivation and Environmental Impact of Laundry Machine-Sharing: Analysis of Surveys in Tokyo and Bangkok. Sustainability 2020, 12, 9756. [Google Scholar] [CrossRef]
- Sarkar, A.; Koohikamali, M.; Pick, J.B. Spatial and socioeconomic analysis of host participation in the sharing economy Airbnb in New York City. Inf. Technol. People 2020, 33, 983–1009. [Google Scholar] [CrossRef]
- Dreyer, B.; Ludeke-Freund, F.; Hamann, R.; Faccer, K. Upsides and downsides of the sharing economy: Collaborative consumption business models’ stakeholder value impacts and their relationship to context. Technol. Forecast. Soc. Chang. 2017, 125, 87–104. [Google Scholar] [CrossRef]
- Makov, T.; Shepon, A.; Krones, J.; Gupta, C.; Chertow, M. Social and environmental analysis of food waste abatement via the peer-to-peer sharing economy. Nat. Commun. 2020, 11, 8. [Google Scholar] [CrossRef] [PubMed]
- Fremstad, A. Does Craigslist Reduce Waste? Evidence from California and Florida. Ecol. Econ. 2017, 132, 135–143. [Google Scholar] [CrossRef]
- Szymańska, A.I. The Importance of the Sharing Economy in Improving the Quality of Life and Social Integration of Local Communities on the Example of Virtual Groups. Land 2021, 10, 754. [Google Scholar] [CrossRef]
- Ottelin, J.; Cetinay, H.; Behrens, P. Rebound effects may jeopardize the resource savings of circular consumption: Evidence from household material footprints. Environ. Res. Lett. 2020, 15, 27. [Google Scholar] [CrossRef]
- Gil, J.; Sequera, J. The professionalization of Airbnb in Madrid: Far from a collaborative economy. Curr. Issues Tour. 2020, 1–20. [Google Scholar] [CrossRef]
- Carrigan, M.; Magrizos, S.; Lazell, J.; Kostopoulos, I. Fostering sustainability through technology-mediated interactions Conviviality and reciprocity in the sharing economy. Inf. Technol. People 2020, 33, 919–943. [Google Scholar] [CrossRef]
- Wernet, G.; Bauer, C.; Steubing, B.; Reinhard, J.; Moreno-Ruiz, E.; Weidema, B. The ecoinvent database version 3 (part I): Overview and methodology. Int. J. Life Cycle Assess. 2016, 21, 1218–1230. [Google Scholar] [CrossRef]
- EC European Platform on Life Cycle Assessment. Available online: https://eplca.jrc.ec.europa.eu/ELCD3/ (accessed on 20 March 2022).
- Kjaer, L.L.; Pigosso, D.C.A.; McAloone, T.C.; Birkved, M. Guidelines for evaluating the environmental performance of Product/Service-Systems through life cycle assessment. J. Clean. Prod. 2018, 190, 666–678. [Google Scholar] [CrossRef] [Green Version]
- Pomponi, F.; Lenzen, M. Hybrid life cycle assessment (LCA) will likely yield more accurate results than process-based LCA. J. Clean. Prod. 2018, 176, 210–215. [Google Scholar] [CrossRef] [Green Version]
- Vita, G.; Lundström, J.R.; Hertwich, E.G.; Quist, J.; Ivanova, D.; Stadler, K.; Wood, R. The Environmental Impact of Green Consumption and Sufficiency Lifestyles Scenarios in Europe: Connecting Local Sustainability Visions to Global Consequences. Ecol. Econ. 2019, 164, 106322. [Google Scholar] [CrossRef]
- Leontief, W. Input-Output Economics, 2nd ed.; Oxford University Press: New York, NY, USA, 1986. [Google Scholar]
- WIOD World Input-Output Database. Available online: https://www.rug.nl/ggdc/valuechain/wiod (accessed on 20 March 2022).
- Miller, R.E.; Blair, P.D. Input-Output Analysis: Foundations and Extensions; Cambridge University Press: New York, NY, USA, 2009. [Google Scholar]
- Garfield, E. Leontief, Wassily—Pioneer of Input-Output-Analysis. Curr. Contents 1986, 37, 3–12. [Google Scholar]
- Fontela, E.; Gabus, A. World Crisis-Decision-Making-Trial-And-Evaluation-Laboratory Inquiry. Futuribles 1978, 14, 211–221. [Google Scholar]
- Feng, Y.T.; Tian, Y.H.; Zhu, Q.H. A combined input-output/decision making trial and evaluation laboratory method for evaluating effect of the remanufacturing sector development. J. Clean. Prod. 2016, 114, 103–113. [Google Scholar] [CrossRef]
- Zhou, Q.; Huang, W.L.; Zhang, Y. Identifying critical success factors in emergency management using a fuzzy DEMATEL method. Saf. Sci. 2011, 49, 243–252. [Google Scholar] [CrossRef]
- Bozdag, E.; Asan, U.; Soyer, A.; Serdarasan, S. Risk prioritization in Failure Mode and Effects Analysis using interval type-2 fuzzy sets. Expert Syst. Appl. 2015, 42, 4000–4015. [Google Scholar] [CrossRef]
- Li, Y.; Hu, Y.; Zhang, X.G.; Deng, Y.; Mahadevan, S. An evidential DEMATEL method to identify critical success factors in emergency management. Appl. Soft Comput. 2014, 22, 504–510. [Google Scholar] [CrossRef]
- Michnik, J. Weighted Influence Non-linear Gauge System (WINGS)—An analysis method for the systems of interrelated components. Eur. J. Oper. Res. 2013, 228, 536–544. [Google Scholar] [CrossRef]
- Tamura, H.; Akazawa, K. Stochastic DEMATEL for structural modeling of a complex problematique for realizing safe, secure and reliable society. J. Telecommun. Inf. Technol. 2005, 4, 139–146. [Google Scholar]
- Acuna-Carvajal, F.; Pinto-Tarazona, L.; Lopez-Ospina, H.; Barros-Castro, R.; Quezada, L.; Palacio, K. An integrated method to plan, structure and validate a business strategy using fuzzy DEMATEL and the balanced scorecard. Expert Syst. Appl. 2019, 122, 351–368. [Google Scholar] [CrossRef]
- Wu, H.H.; Chang, S.Y. A case study of using DEMATEL method to identify critical factors in green supply chain management. Appl. Math. Comput. 2015, 256, 394–403. [Google Scholar] [CrossRef]
- Kumar, A.; Dixit, G. An analysis of barriers affecting the implementation of e-waste management practices in India: A novel ISM-DEMATEL approach. Sustain. Prod. Consum. 2018, 14, 36–52. [Google Scholar] [CrossRef]
- Yazdi, M.; Nedjati, A.; Zarei, E.; Abbassi, R. A novel extension of DEMATEL approach for probabilistic safety analysis in process systems. Saf. Sci. 2020, 121, 119–136. [Google Scholar] [CrossRef]
- Wu, Y.N.; Wu, C.H.; Zhou, J.L.; Zhang, B.Y.; Xu, C.B.; Yan, Y.D.; Liu, F.T. A DEMATEL-TODIM based decision framework for PV power generation project in expressway service area under an intuitionistic fuzzy environment. J. Clean. Prod. 2020, 247, 119099. [Google Scholar] [CrossRef]
- Asan, U.; Kadaifci, C.; Bozdag, E.; Soyer, A.; Serdarasan, S. A new approach to DEMATEL based on interval-valued hesitant fuzzy sets. Appl. Soft Comput. 2018, 66, 34–49. [Google Scholar] [CrossRef]
- Liu, Z.W.; Ming, X.G.; Song, W.Y. A framework integrating interval-valued hesitant fuzzy DEMATEL method to capture and evaluate co-creative value propositions for smart PSS. J. Clean. Prod. 2019, 215, 611–625. [Google Scholar] [CrossRef]
- Wu, K.J.; Liao, C.J.; Tseng, M.L.; Chiu, A.S.F. Exploring decisive factors in green supply chain practices under uncertainty. Int. J. Prod. Econ. 2015, 159, 147–157. [Google Scholar] [CrossRef]
- Mahmoudi, S.; Jalali, A.; Ahmadi, M.; Abasi, P.; Salari, N. Identifying critical success factors in Heart Failure Self-Care using fuzzy DEMATEL method. Appl. Soft Comput. 2019, 84, 105729. [Google Scholar] [CrossRef]
- Zhang, X.F.; Su, J.F. A combined fuzzy DEMATEL and TOPSIS approach for estimating participants in knowledge-intensive crowdsourcing. Comput. Ind. Eng. 2019, 137, 106085. [Google Scholar] [CrossRef]
- Han, W.; Sun, Y.H.; Xie, H.; Che, Z.M. Hesitant Fuzzy Linguistic Group DEMATEL Method with Multi-granular Evaluation Scales. Int. J. Fuzzy Syst. 2018, 20, 2187–2201. [Google Scholar] [CrossRef]


| Unit: Ten Thousand Yuan (RMB) | |||||||
|---|---|---|---|---|---|---|---|
| U | TIU | TFU | IM | GO | |||
| I | TC | GCF | EX | ||||
| TII | (i) | (ii) | |||||
| TVA | VA001 | (iii) | |||||
| VA002 | |||||||
| VA003 | |||||||
| VA004 | |||||||
| TI | |||||||
| Original Sector | Changes | Code |
|---|---|---|
| Urban Public Transport & Highway Passenger Transport | Add and emphasize public bicycle services, tourist passenger transport | 27 |
| Accommodation | Add homestay services, campground services, other accommodation Include short-term rental apartments, timeshare accommodation, and other new forms | 30 |
| Food and Beverage Services | New catering delivery and take-out delivery services | 31 |
| Renting and Leasing | Subdivide the daily necessities rental, including fixed stalls operating bicycles, furniture & household appliances, linen & textile, clothing & footwear, manual equipment rental services, etc. | 35 |
| Services to Households | Revise to include employing domestic workers and self-employment activities of domestic households | 39 |
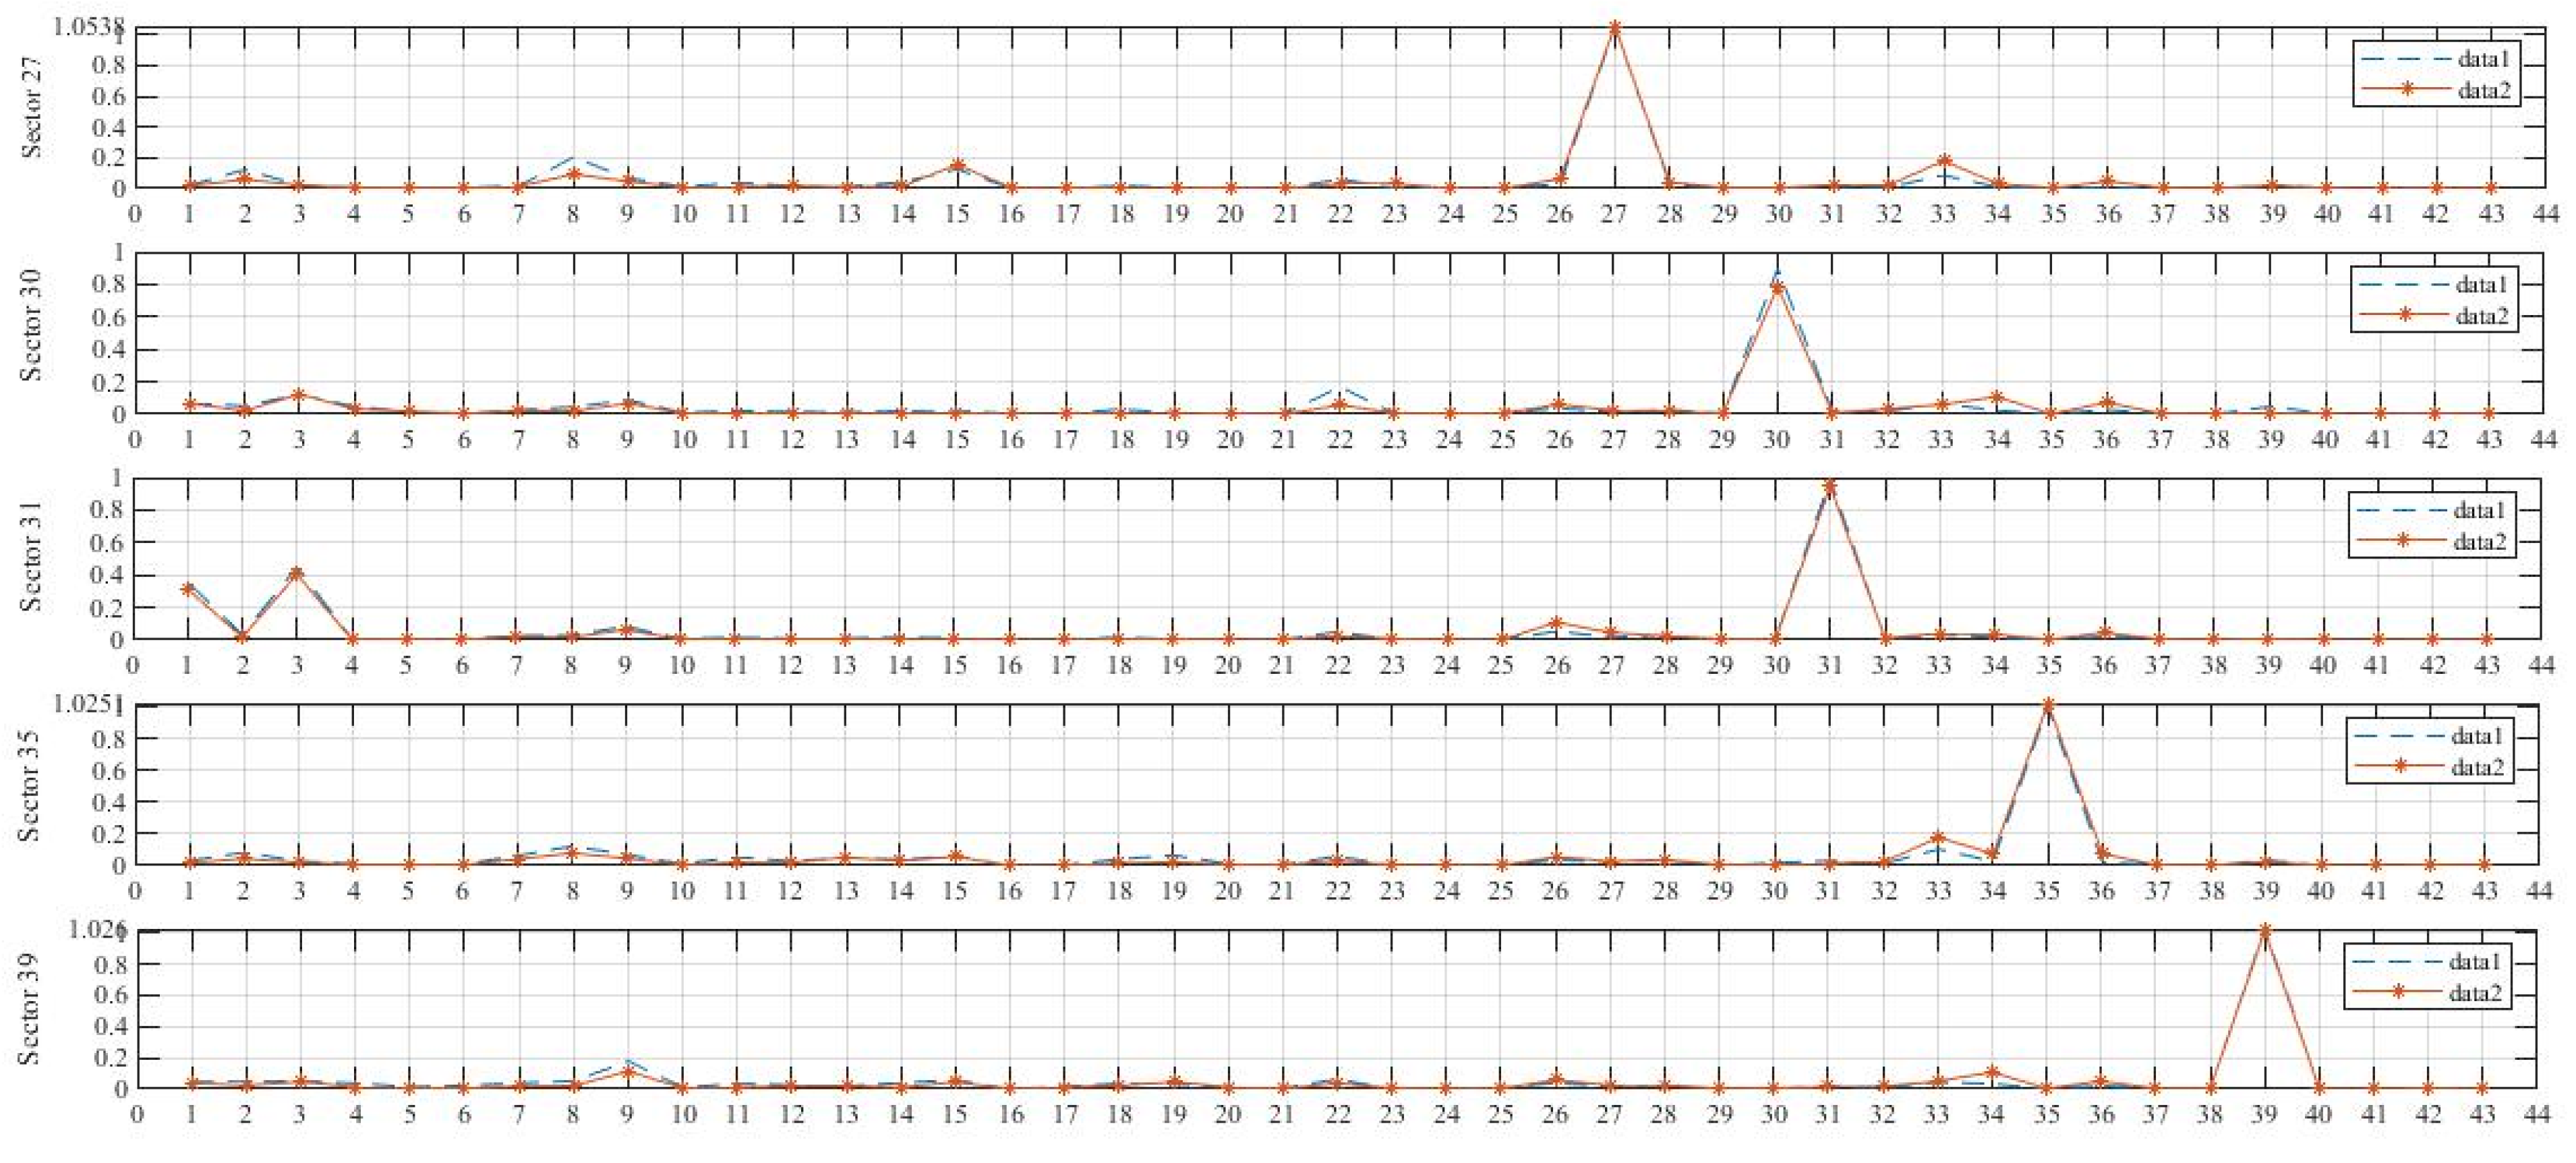
| Ranking | Sector 27 | Sector 30 | Sector 31 | Sector 35 | Sector 39 |
|---|---|---|---|---|---|
| 1 | 8 (−) | 30 (−) | 26 (+) | 33 (+) | 34 (+) |
| 2 | 33 (+) | 22 (−) | 31 (−) | 36 (+) | 9 (−) |
| 3 | 2 (−) | 34 (+) | 1 (−) | 34 (+) | 8 (−) |
| 4 | 36 (+) | 36 (+) | 3 (−) | 8 (−) | 36 (+) |
| 5 | 26 (+) | 39 (−) | 27 (+) | 19 (−) | 2 (−) |
| 6 | 15 (+) | 2 (−) | 22 (−) | 2 (−) | 14 (−) |
| 7 | 23 (+) | 8 (−) | 36 (+) | 11 (−) | 22 (−) |
| 8 | 22 (−) | 26 (+) | 9 (−) | 22 (−) | 11 (−) |
| 9 | 14 (−) | 9 (−) | 34 (+) | 18 (−) | 4 (−) |
| 10 | 11 (−) | 18 (−) | 2 (−) | 9 (−) | 7 (−) |
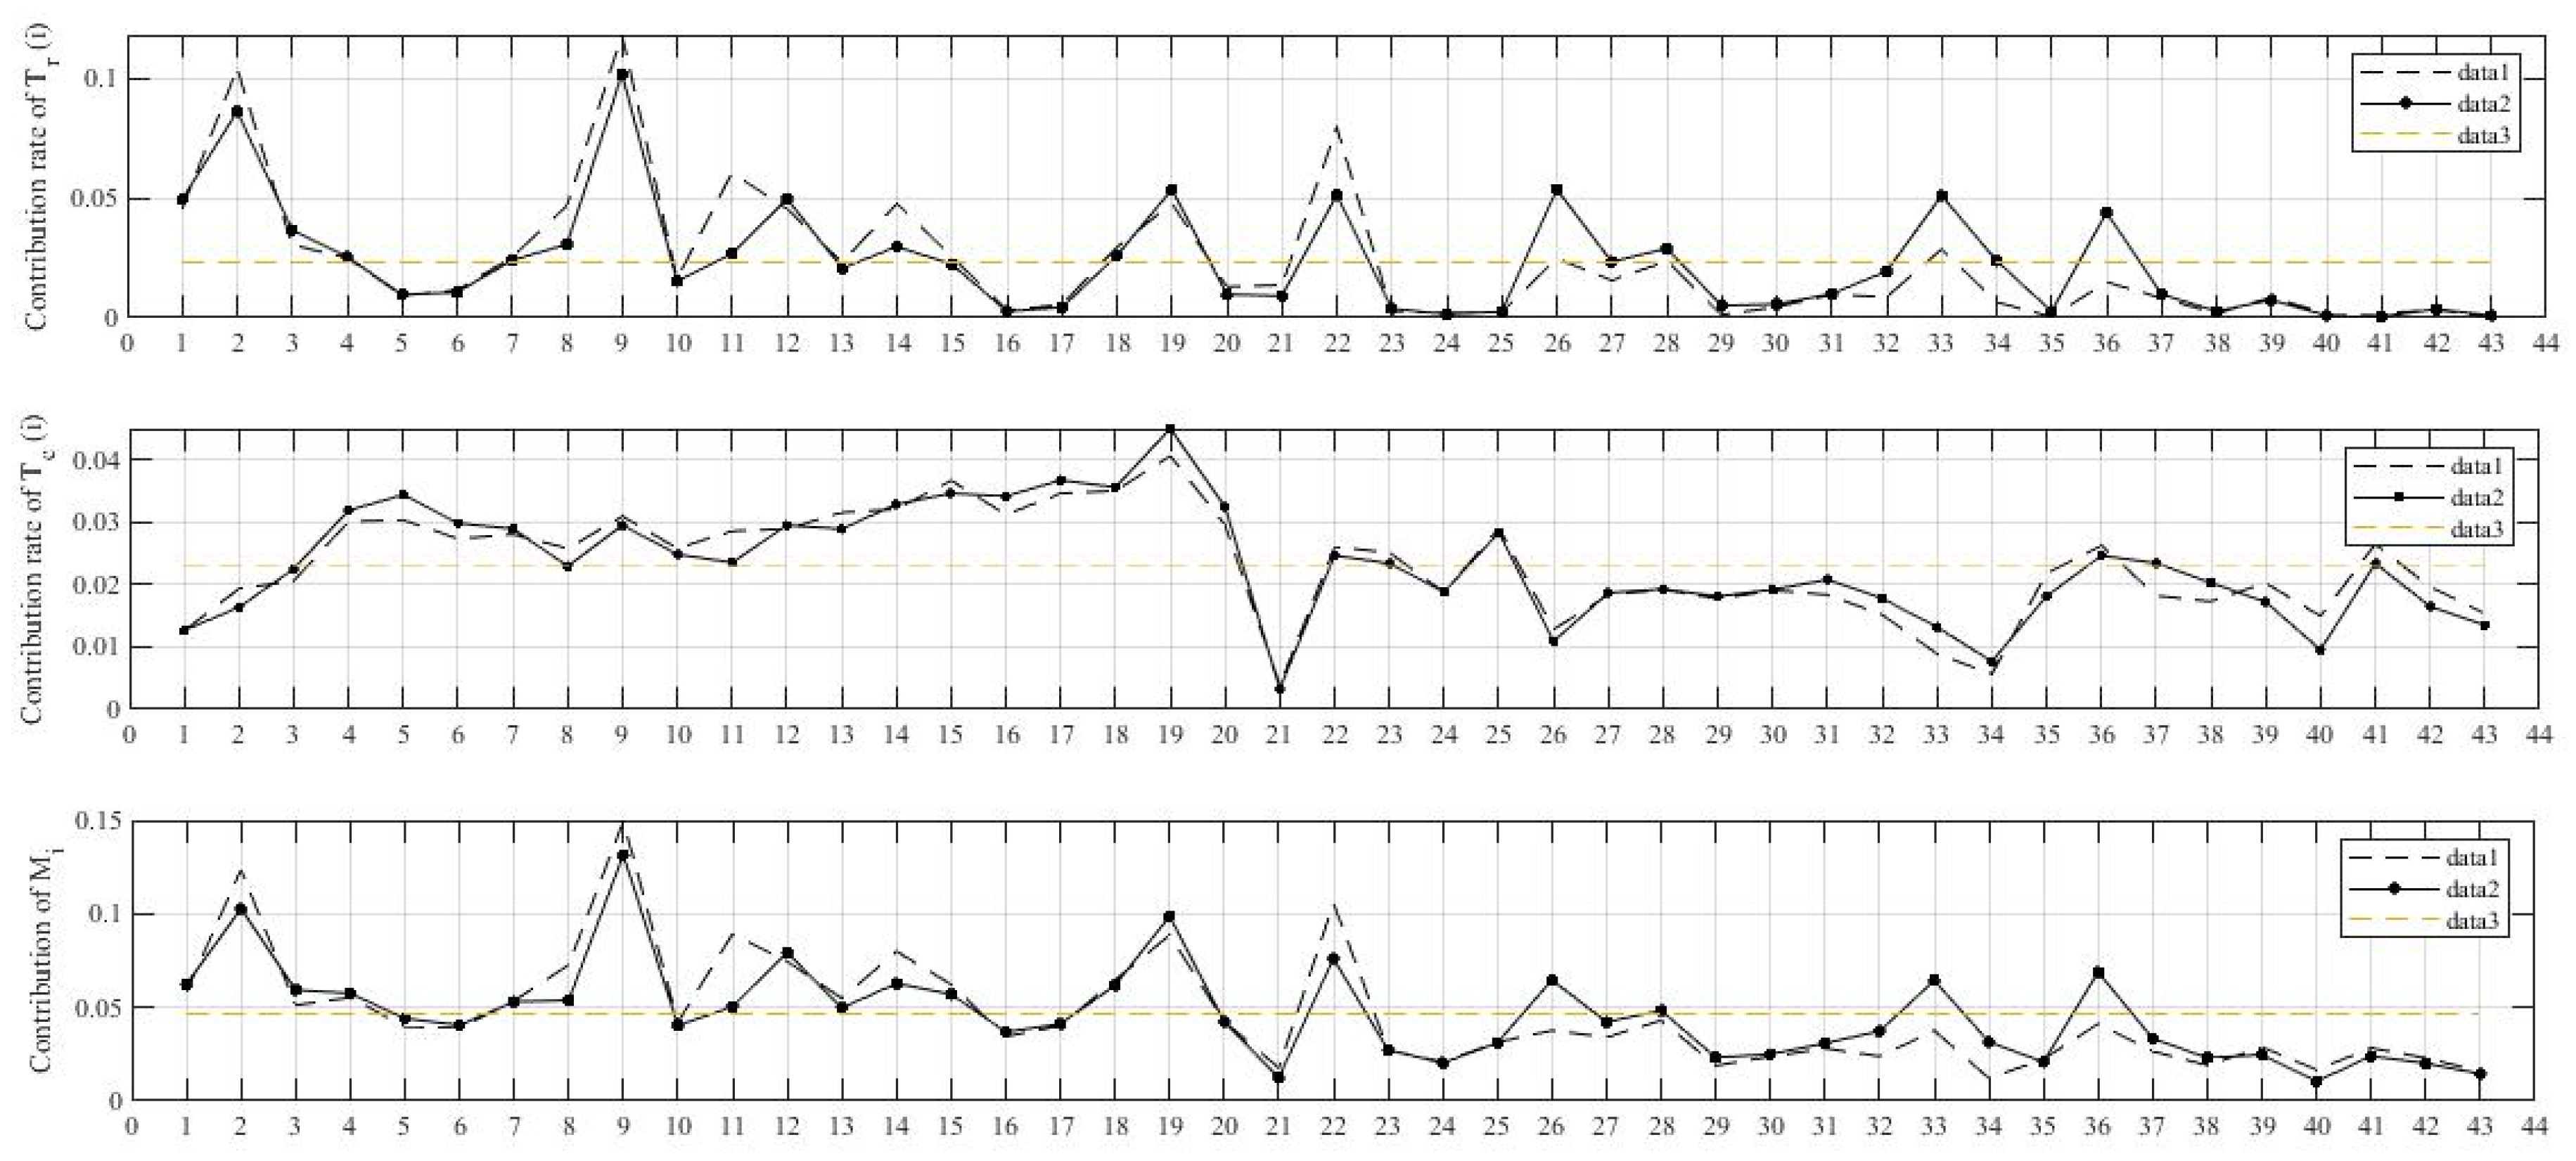
| Prominent Role | Sorting Formula | Prominent Sectors | |
|---|---|---|---|
| Static (displayed in 2018) | Leading sector | 9/2 | |
| Supplier-oriented | 9/2/26/19/22/33/12/1/36/3 | ||
| Demander-oriented | 19/17/18/15/5/16/14/20/4/6 | ||
| Dynamic (compared with 2007) | Promoting cleaner production and sustainable consumption | ||
| 11/2/22 | |||
| 33/34/36 | |||
| ) | 38/33/32/31 | ||
| Promoting industrial structure upgrading | & | 14/3/8 |
Publisher’s Note: MDPI stays neutral with regard to jurisdictional claims in published maps and institutional affiliations. |
© 2022 by the authors. Licensee MDPI, Basel, Switzerland. This article is an open access article distributed under the terms and conditions of the Creative Commons Attribution (CC BY) license (https://creativecommons.org/licenses/by/4.0/).
Share and Cite
Wang, D.; Yan, L.; Ruan, F. A Combined IO-DEMATEL Analysis for Evaluating Sustainable Effects of the Sharing Related Industries Development. Sustainability 2022, 14, 5592. https://doi.org/10.3390/su14095592
Wang D, Yan L, Ruan F. A Combined IO-DEMATEL Analysis for Evaluating Sustainable Effects of the Sharing Related Industries Development. Sustainability. 2022; 14(9):5592. https://doi.org/10.3390/su14095592
Chicago/Turabian StyleWang, Dan, Liang Yan, and Fangli Ruan. 2022. "A Combined IO-DEMATEL Analysis for Evaluating Sustainable Effects of the Sharing Related Industries Development" Sustainability 14, no. 9: 5592. https://doi.org/10.3390/su14095592
APA StyleWang, D., Yan, L., & Ruan, F. (2022). A Combined IO-DEMATEL Analysis for Evaluating Sustainable Effects of the Sharing Related Industries Development. Sustainability, 14(9), 5592. https://doi.org/10.3390/su14095592