Article

Multi-Agent Evolutionary Game Model: Corporate Low-Carbon Manufacturing, Chinese Government Supervision, and Public Media Investigation

1
Management College, Jiangsu University, Zhenjiang 212013, China
2
Business College, Jiangsu University of Technology, Changzhou 213001, China
3
Department of Statistics, Pennsylvania State University, State College, PA 16802, USA
4
Nari Group Corporation, Nari Research Institute, Nanjing 211106, China
*
Author to whom correspondence should be addressed.
Sustainability 2022, 14(9), 5587; https://doi.org/10.3390/su14095587
Submission received: 20 April 2022 / Revised: 28 April 2022 / Accepted: 30 April 2022 / Published: 6 May 2022

Abstract

:
Government supervision and media investigation play an important role in regulating manufacturing produce mode and reducing carbon emissions. In terms of theoretical implications, this study uses the tripartite evolutionary game model to investigate the dynamic decision-making process of stable strategies among three participating stakeholders: manufacturing enterprises, government regulatory departments, and media survey agencies. The payoff matrix and replicator dynamic functions of three parties are specifically calculated based on the evolutionary game theory. From a lower-carbon economy perspective, the main factors (revenue, subsidy, cost, and loss) that affect the stable strategies of three stakeholders are included in the sensitivity analysis. In terms of practical implications, this paper describes the evolutionary dynamic process of the stability condition using numerical simulation tests, and it proposes the promotion mechanism of four different supervision stages of manufacturing production mode. In the beginning and early stage, strengthened government supervision and active media investigation have a positive effect on reducing the heavy-polluting manufacturer proportion in China. Under this circumstance, the lower cost, in-creased revenue, and added subsidies all motivate firms to adopt the lower-carbon production mode. With the maturity of the supervision platform, public media will gradually reduce their investigations and interventions to the manufacturing business, and finally engage in no-investigation. This paper also demonstrates that lower penalties and subsidies are not related to the optimal strategy among three stakeholders, and the extravagant survey cost will reduce the enthusiasm of public media to investigate manufacturing firms.

1. Introduction

Based on the concept of low energy consumption, low pollution, and low carbon emissions, the low-carbon economy has gradually become an important part of sustainable global economy development [1,2,3]. In the context of a low-carbon economy, governments are actively searching for solutions to reduce greenhouse gas emissions [4,5]. As the world’s largest emitter of carbon dioxide, the Chinese government has pledged to reduce GDP carbon emissions by 60% to 65% by 2030, compared to 2005 [6,7]. According to statistics released by the International Energy Agency, currently, more than 30% of the world’s carbon emissions are from manufacturing companies [8,9,10]. More specifically, Chinese manufacturing companies, such as steel, electricity, and building material industries, account for 90% of the total industrial carbon emissions [11,12]. There are also significant differences in the effects of Chinese local governments on the corporate environmental performance. For example, the regulatory authorities in the Yangtze River Delta region have stricter requirements for corporate environmental management and the regulatory impact of corporate carbon emission in this region is better [3,8]. Therefore, reasonable strategy of corporate production modes plays an important role in achieving lower carbon emission targets.
Previous studies have shown that government supervises and manages enterprise carbon reduction [4,8]. However, this external supervision with high cost may not have an ideal binding effect on heavy-polluting firms. Sometimes, manufacturing firms pay more attention to maximizing profit, and ignore the quality of environmental performance [13,14]. Moreover, enterprises are required to invest a lot of money in equipment research and development, production design, and certificated evaluation of low-carbon products, so the shortage of technology and insufficient funds will directly result in the loss of motivation among low-carbon enterprises [15,16]. Thus, the low-carbon supervision from the government and behavioral strategy from manufacturing companies are in a dynamic game process; the effect of government regulation as a single external supervision has less effect on regulating the environmental performance of industrial firms.
Recent studies have investigated the public media act as a third-party regulator to conduct in-depth investigations into the environmental issues of heavy-polluting enterprises [17,18,19]. With the rapid development of online media platforms, the Internet effect and public opinion trend will have a significant impact on restricting enterprise carbon emission [5,6]. At the same time, online exposure of environmental pollution issues also attract the attention of government regulatory authorities, and contribute to more strengthened penalties for highly polluting enterprises [5,14]. In China, the governmental technology department and new media platforms have cooperated to establish an online monitoring database of corporate public opinion, including environmental performance, carbon emission and production behavior [11,17]. In the supervision process of corporate carbon emission, the trend of public opinion promptly affects the environmental strategy selection of government and industries.
From the economic perspective, some studies focus primarily on economic policies impacting on the accounting method of corporate carbon emissions [15,18]. Some scholars concentrate on researching the factors of regulatory strategy from two aspects, namely governmental tax policy and subsidy policy [6,9]. First, researchers theoretically propose a price competition model for low-carbon supply chains and study the significant impact of tax intervention on corporate green supply chains [9,10]. Then, a study based on the theory of incentives found that subsidy policy has a positive effect on motivating the low-carbon manufacturing enterprises [3,4,5]. Later research [3,4] conducted the empirical analysis of the relationship between the carbon taxes and the innovation of low-carbon products. To sum up, the existing literature mainly explores the impact of the feasibility of government tax or subsidy policy on the strategy of low-carbon supply chains. However, there is little research on how manufacturing companies pursue the profit maximization under the different regulatory policies [20,21], so this paper further investigates the impact of different degrees of government regulation on corporate production strategy.
The implementation of the government’s low-carbon policy, the enterprise behavior in low-carbon production, and media investigation are all dynamic evolutionary processes [22,23]. On the basis of evolutionary game theory, part of the existing literature is about the evolutionary relationship between government decision-making and low-carbon behavior of enterprises. To begin with, the scholars [23,24] established a game strategy evolution model for low-carbon behavior between governments and enterprises to evaluate the diffusion and application of low-carbon strategies of enterprises. Then, scholars [12,13] found that government subsidies and tax incentives have a positive impact on the implementation of carbon reduction plans in the air-conditioning industry. In addition, the evolutionary game relationship between oil price changes and corporate carbon emission reduction has been discovered [6,7]. Additionally, other studies introduce the government’s compensation strategy and dynamic punishment strategy into the model and then analyze the interaction mechanism between the government and enterprises [21,22]. Further research provides a theoretical basis for the government to regulate the decision-making of upstream enterprises in the rare earth industry and thus helps regulate the order of the rare earth market [3,4,5].
Other literature focuses on the dynamic evolutionary process of the decision-making behavior of third-party regulatory authorities and relevant stakeholders. First, previous studies found that third-party surveyors reduce business costs through energy demand management and sustainable supply [25,26]. Second, some scholars look into the strategic choice of government and third parties in the regulatory process and provide the suggestions for the third-party investigation mechanism [15,16]. Third, three-party investigation agencies have a certain supervisory role in government departments and strengthen the government supervision on enterprises [16,17]. In addition, some other studies concentrate on the evolutionary game of low-carbon decision-making behavior of business. For example, some researchers explored the evolutionary equilibrium between manufacturing business and ecological balance from the perspective of environmental management [19,20]. Other researchers comprehensively analyzed the strategic choices of manufacturing enterprises based on the management of green supply chain, thereby reducing carbon emissions and environmental pollution [13,14]. Later, Chinese scholars analyzed the synergy of environmental and business interests and constructed a game model between producers and retailers [23,24,25]. Moreover, some studies constructed an evolutionary game model of carbon emission reduction behavior between producers and suppliers and verified the evolutionary stability strategy through the numerical simulation experiments [26,27].
However, it can be concluded that these previous studies only focused on discussing the evolutionary interaction between two stakeholders such as government regulator and corporate, third-party investigation agencies and manufacturing business, or government and investigation departments [28,29,30]. In practice, these three participants all play a significant role in regulating the corporate carbon emission. In the relevant research on low-carbon strategies of enterprises and environmental regulation of governments, there are certain drawbacks in analyzing the factors of a single entity. Additionally, a few studies support that the media investigation significantly affects the environmental performance of corporate and government department [23,24]. Therefore, it is necessary to collaboratively study the equilibrium strategies of three participants involved in carbon emission supervision.
On the foundation of the above studies, this paper concentrates on the evolutionary decision-making process of stable strategies for three stakeholders, namely manufacturing enterprises, government regulatory department, and investigative agencies of public media. Based on the evolutionary game theory, this paper constructs the payoff matrix of a tripartite asymmetric dynamic evolutionary game using bounded rationality hypothesis. A three-way replication dynamic equation is calculated, and the equilibrium point of the model is obtained from the Jacobian matrix solution. Then, numerical simulation tests demonstrate the sensitive analysis of the main parameters such as revenue, cost, subsidy, and loss, and explain the effect of the relevant factors on the evolution of equilibrium points. Finally, this paper proposes a promotion mechanism of carbon emission regulatory system. This paper provides suggestions on a theoretical basis for government regulatory departments and public media to make long-term decisions and is of practical significance for manufacturing firms to promote lower-carbon production and improve their environmental performance. The main contributions of this paper are further emphasized as follows:
A multi-agent evolutionary game model involving the manufacturing companies, government regulatory departments, and public media is advised. Comparing with the traditional two-way evolutionary game, this paper describes the main factors and interaction effect of three participants in detail.
From the perspective of a low-carbon economy, the impact of the main parameters (revenue, subsidy, cost, and penalty) on the stability strategy is investigated with the numerical simulation tests.
Based on the principles of sustainable development, the diversified promotion mechanism is available for reference to regulate the corporate environmental performance and improve the government supervision and media investigation.
The remainder of this paper is constructed as follows: Section 2 provides the hypothesis and symbol descriptions of evolutionary game model, the construction of payoff matrix, replicator dynamic functions, and stability analysis of equilibrium points. Section 3 shows the sensitive analysis of the main parameters of three participants by using numerical simulation tests. The promotion mechanism of four different circumstances is explained in Section 4. The main conclusion, discussion of this paper, and the limitations are summarized in Section 5.

2. The Tripartite Evolutionary Game Model

Evolutionary game theory takes the dynamic process of bounded rationality as a systematic framework, and stakeholders in each group achieve dynamic balance through the transformed processes such as imitation, learning, and mutation [24,25]. Today, evolutionary game theory is widely used in the field of economic management [30,31]. In this paper, the evolutionary game model for three parties, namely manufacturing enterprise, government regulator, and public media, is constructed. Then, the payoff matrix of three parties’ different strategies is specifically calculated. Based on the principle of Malthusian dynamic equation [24,25,26], the replicator dynamics functions of manufacturers, government, and public media are derived. Finally, according to the Lyapunov stability theory [31], the stable conditions of equilibrium points are evaluated from the Jacobian matrix.

2.1. Model Hypothesis and Description

2.1.1. Model Hypothesis

According to the evolutionary game theory, this research proposes the following hypotheses.
Hypothesis 1:
The manufacturing enterprise, government regulator, and public media are bounded rationally in this tripartite evolutionary game model. They all have a significant impact on promoting lower carbon production of the manufacturing enterprise, so their corresponding strategies are supposed to be discussed in the following payoff matrix.
Hypothesis 2:
Manufacturing firms have two production strategies, namely “lower carbon production” strategy and “high-polluting production” strategy. Manufacturing companies are subject to external scrutiny from the government regulator and public media. Enterprises should consider the cost, benefit, and penalty of different production strategies.
Hypothesis 3:
The government regulatory agency implements two different supervision strategies, respectively strengthened supervision and weakened regulation. Under the government’s strong supervision, the penalties for high-polluting enterprises will be strengthened. The government’s supervision will also affect the enthusiasm of the public media to investigate.
Hypothesis 4:
Public media serves as a third-party regulator in this research. In the investigation of manufacturing companies, public media has the ability to adjust the active strategy or inactive strategy. A comprehensive investigation of the public media has a binding effect on high-polluting enterprises, which also positively influences government supervision.
Hypothesis 5:
Manufacturing enterprises, government, and public media all behave to maximize their interests. Effective monitoring by the government and the public media has been shown to motivate companies to carry out low-carbon production.

2.1.2. Description of Symbols

The manufacturing enterprise, government regulator, and public media are the major participants in the supervision of carbon emission. The objective of government regulation and public media is to increase the proportion of lower-carbon production enterprises and consequently, to promote the sustainable development and cultivate the lower-carbon awareness. For manufacturing enterprises, the main purpose is to maximize the profits [13,14,15]. If government supervision is weakened and public media does not take the active investigation, the manufacturing enterprises are more likely to ignore regulation which leads to ecological environment pollution and increase in supervision cost for the government agency [20,21]. Increased regulatory difficulties can also have a negative impact on in-depth media investigation. Therefore, the strategy selections of government and public media directly affect the production system of manufacturing enterprises. More active investigation and strengthened supervision will restrict the high-polluting enterprises and motivate manufacturing companies to adopt the lower-carbon production. Aiming at sustainable development and carbon emission reduction, this work examines the behavior investigations of three parties, namely manufacturing enterprises, government regulator, and public media. The symbols in the tripartite evolutionary game model are shown in Table 1.

2.1.3. Payoff Matrix

Based on the above hypotheses and descriptions, the payoff matrix of tripartite evolutionary game model is calculated in Table 2. For example, if a manufacturing enterprise adopts lower carbon production and both the government and public media enforce the strong supervision of carbon emission, the expected payoffs are R 1 C 1 + F 1 + F 2 , W + E 1 , and S 1 C 3 , namely for the manufacturing enterprise, government regulator, and public media.
Now, this evolutionary game model denotes x as the probability that manufacturing enterprise chooses the lower-carbon production, y as the strengthened supervision of government regulator, and z as the active investigation of public media. The payoff matrix of the three-dimensional evolutionary game model is created as follows.

2.1.4. Replicator Dynamics Function

(1)
Manufacturing enterprise
In this study, it is assumed that the expected benefits of manufacturing enterprises choosing “lower carbon production” strategy are U 11 , expected benefits of “high-polluting production” strategy are U 12 , and the average expected return is U x . Based on the principle of Malthusian dynamic equation, the replicator dynamics function of manufacturing enterprise is constructed as follows:
U 11 = y z R 1 C 1 + F 1 + F 2 + y 1 z R 1 C 1 + F 1 + 1 y z R 1 C 1 + F 2 + 1 y 1 z R 1 C 1
U 12 = y z R 2 C 2 G H + y 1 z R 2 C 2 G + 1 y z R 2 C 2 H + 1 y 1 z R 2 C 2
U x = x U 11 + 1 x U 12
F x = d x d t = x U 11 U x = x U 11 + 1 x U 12 = x 1 x [ C 2 C 1 + R 1 R 2 + y F 1 + G + z F 1 + H + y z F 2 F 1 ]
(2)
Government regulator
The expected benefits of government regulator adopting “strengthened supervision” strategy are defined as U 21 , expected benefits of “weakened supervision” strategy are U 22 , and the average expected return is U y . The replicator dynamics function of government regulatory agency is composed as follows:
U 21 = x z W + E 1 + x 1 z W + E 2 + 1 x z W + 1 x 1 z W
U 22 = 1 x z L 1 1 x 1 z L 2
U y = y U 21 + 1 y U 22
F y = d y d t = y U 21 U y = y U 21 + 1 y U 22 = y 1 y L 2 + W + x E 2 L 2 + z L 1 L 2 + x z E 1 E 2 + L 2 L 1
(3)
Public media
The expected benefits of public accepting “active investigation” strategy are assumed as U 31 , expected benefits of “inactive investigation” strategy are U 32 , and the average expected return is U z . The replicator dynamics function of public media is defined as follows:
U 31 = x y S 1 C 3 + x 1 y S 1 C 3 + 1 x y S 2 C 4 + 1 x ( 1 y ) S 2 C 4 ,
U 32 = 1 x y M
U z = z U 31 + 1 z U 32 ,
F z = z U 31 U z = z U 31 + 1 z U 32 = z 1 z S 2 C 4 + x C 4 C 3 + S 1 S 2 + M y M x y

2.2. Stability Analysis of Equilibrium Points

The stability condition is evaluated in this section based on the hypothesis and analysis of replicator dynamics function. From the Lyapvnov stability theory [31], the real negative eigenvalues of the Jacobian matrix means that the equilibrium points of the repeated evolutionary system is stable. By constructing the replicator dynamics functions of three parties, the Jacobian matrix of the study can be attained as follows:
= F x x F x y F x z F y x F y y F y z F z x F z y F z z = n 11 n 12 n 13 n 21 n 22 n 23 n 31 n 32 n 33
n 11 = 1 2 x C 2 C 1 + R 1 R 2 + y F 1 + G + z F 1 + H y z F 2 F 1
n 12 = x 1 x F 1 + G + z F 2 F 1
n 13 = x 1 x F 1 + H + y F 2 F 1
n 21 = y y 1 L 2 E 2 + z E 2 E 1 + L 1 L 2
n 22 = 1 2 y W + L 2 + x E 2 L 2 + z L 1 L 2 + x z E 1 E 2 + L 2 L 1
n 23 = y 1 y L 1 L 2 + x E 1 E 2 + L 2 L 1
n 31 = z 1 z C 4 C 3 + S 1 S 2 M y
n 32 = M z 1 x 1 z
n 33 = 1 2 z S 2 C 4 + x C 4 C 3 + S 1 S 2 + M y M x y
After combing the above replicator dynamics functions of manufacturing enterprise, government regulator and public media, 13 equilibrium points of system can be calculated. According to the stability principle of differential equations proposed by Weinstein [31], if F(x) = F(y) = F(z) = 0, all equilibrium solutions of the three-dimensional replica dynamic system can be obtained, among which there are 8 groups of pure strategy solutions, and the rest are impure strategy solutions.
F x = d x d t = F y = d y d t = F z = d z d t = 0 ,
The equilibrium points of system are E 1 0 , 0 , 0 , E 2 0 , 0 , 1 , E 3 0 , 1 , 0 , E 4 0 , 1 , 1 , E 5 1 , 0 , 0 , E 6 1 , 0 , 1 , E 7 1 , 1 , 0 , E 8 1 , 1 , 1 , E 9 C 4 S 2 C 4 C 3 + S 1 S 2 , 1 ,   C 1 C 2 + R 2 R 1 F 1 G F 2 + H , E 10 W + L 1 L 1 E 1 ,   C 1 C 2 + R 2 R 1 F 1 H G + F 2 , 1 , E 11 0 ,   C 4 S 2 M ,   L 2 + W L 2 L 1 , E 12 S 2 C 4 C 3 C 4 + S 2 S 1 , 0 ,   C 1 C 2 + R 2 R 1 F 1 + H , E 13 W + L 2 L 2 E 2 ,   C 1 C 2 + R 2 R 1 F 1 + G ,   0 .
According to evolutionary game theory, the equilibrium point that satisfies all negative eigenvalues of the Jacobian matrix is the evolutionary stable point (ESS) [32]. The strategy combination (equilibrium point) of an asymmetric evolutionary game is the evolutionary stable equilibrium point, which must meet the principle of strict Nash equilibrium [33]. A pure strategy equilibrium is also called the strict Nash equilibrium, indicating that stable equilibrium points can be directly generated in pure strategies [32,33]. Therefore, only the stability of 8 pure strategy equilibrium points needs to be discussed.
By replacing with the eight equilibrium points accordingly into the above Jacobian matrix, the eigenvalues of each equilibrium points can be estimated. Based on the Lyapvnov stability theory, if the eigenvalue is negative, the equilibrium point is progressively stable and is defined as the convergence [31,32]. In contrast, the equilibrium point is unstable when the eigenvalue is more than zero, which is stated as the source. Moreover, if there are both positive and negative eigenvalues, the equilibrium point is defined as the saddle point. The eight different strategy equilibrium points of Jacobian matrix system and their eigenvalues are both shown in Table 3.
In the process of the evolutionary game, we gradually evaluate the stability conditions from the perspective of reducing the carbon emission based on the punishment mechanism theory. The regulatory system of carbon emission denotes a three-party evolution process involving firms, the government, and public media. This regulatory system of manufacturing carbon emission is divided into four stages: beginning supervision stage, early supervision and investigation stage, middle supervision stage, and mature investigation stage.
In the beginning governance of corporate carbon emission, government regulators do not have enough experience and public media has not attached the importance of exposing the high-polluting enterprises. Only a few manufacturing enterprises pay attention to the potential profits of low-carbon production. At this stage, manufacturers still maintain high-polluting production and public media considering the supervision costs did not take active investigation; therefore, this stage corresponds to E3 (0,1,0). At this point, the inequality S 2 + M < C 4 has been shown in Table 3. If the benefits that public media choose the active investigation are less than cost, public media are not willing to accept the investigation strategy. When the public media does not implement the investigation and the inequality R 1 C 1 + F 1 + G < R 2 C 2 , the potential profits of heavy-polluting production exceed those of lower-carbon production, the manufacturing enterprises are not willing to adopt the lower-carbon emission strategy.
With the increased government supervision and environmental awareness, public media becomes aware that active investigation can have a positive publicity effect. If the government regulatory agencies carry out the strengthened supervision and demand the media to assist with investigations, public media are more inclined to perform their investigation function. The potential benefits of public media also outweigh its costs, so public media will take the initiative to investigate and this stage corresponds to E4 (0,1,1). It can be shown that the inequality S 2 + M > C 4 reflects the potential benefits for active investigation, while the inequality R 1 C 1 + F 1 + F 2 + G + H < R 2 C 2 means that the revenue of cleaner production is relatively lower than traditional mode. The dual supervision of the government and public media will consistently promote enterprises to transform from traditional high-polluting production mode.
When the government regulator continues to improve the carbon emission supervision system (mainly aiming at increasing the rewards and punishment for lower-carbon production and heavy-polluting production), manufacturing enterprises will enter the transformation stage. The proportion of manufacturers with lower-carbon production will increase, thus this stage corresponds to E8 (1,1,1). It describes the inequality S 1 > C 3 and R 1 C 1 + F 1 + F 2 + G + H > R 2 C 2 from Table 3. The government has increased the penalties for high-polluting enterprises. In addition, the revenue of cleaner production gradually exceeds its costs. Considering the dual pressure of media investigation and government regulation, companies are willing to switch from the traditional high-polluting production model to a clean and lower-carbon production model.
As the increasing proportion of lower-carbon manufacturing enterprises forms a relatively comprehensive supervision system, public media no longer needs to pay significant attention to investigation, and the regulatory system has reached the mature stage. This stage corresponds to E7 (1,1,0). When the inequality R 1 C 1 + F 1 + G > R 2 C 2 reflected in Table 3, it means the mature supervision stage is in effect and there is an increasing proportion of lower-carbon manufacturing enterprises. The public media are not required to pay much attention to investigation. Since the research aim of this paper is to promote the sustainable and clean production mode for manufacturing enterprises, three evolutionary pure strategies corresponding to the above four supervision stages are analyzed in detail.

3. Numerical Simulation

To intuitively explain the dynamic evolutionary game process of three parties at different stages of the supervision system for corporate production, the above four evolutionary strategies were arithmetically evaluated. Section 3.1 clarifies the evolutionary path diagrams of three parties in the beginning, early, middle, and mature supervision stages of corporate production mode. Section 3.2 focuses on estimating the revenues, subsidy, cost, and loss parameters of three participants, including revenues R1, R2, E1, E2, S1, S2, and W, subsidies F1 and F2, costs C1, C2, C3, C4, and H, penalties G and M, and losses L1 and L2. Section 3.3 concludes the sensitivity analysis of numerical simulation tests and provides the phase diagram of the equalization points.

3.1. Dynamic Evolutionary Analysis of Four Different Stages

Based on the above construction of the three-parties evolutionary game model, this section separately denotes the values of all symbols in the simulation test using the Matlab statistics software. The probability of x, y, and z are all set from 0.1 to 1 with a step size of 0.2 in the following 50 simulation tests.
(1)
The numerical simulation tests of dynamic evolution in the beginning stage
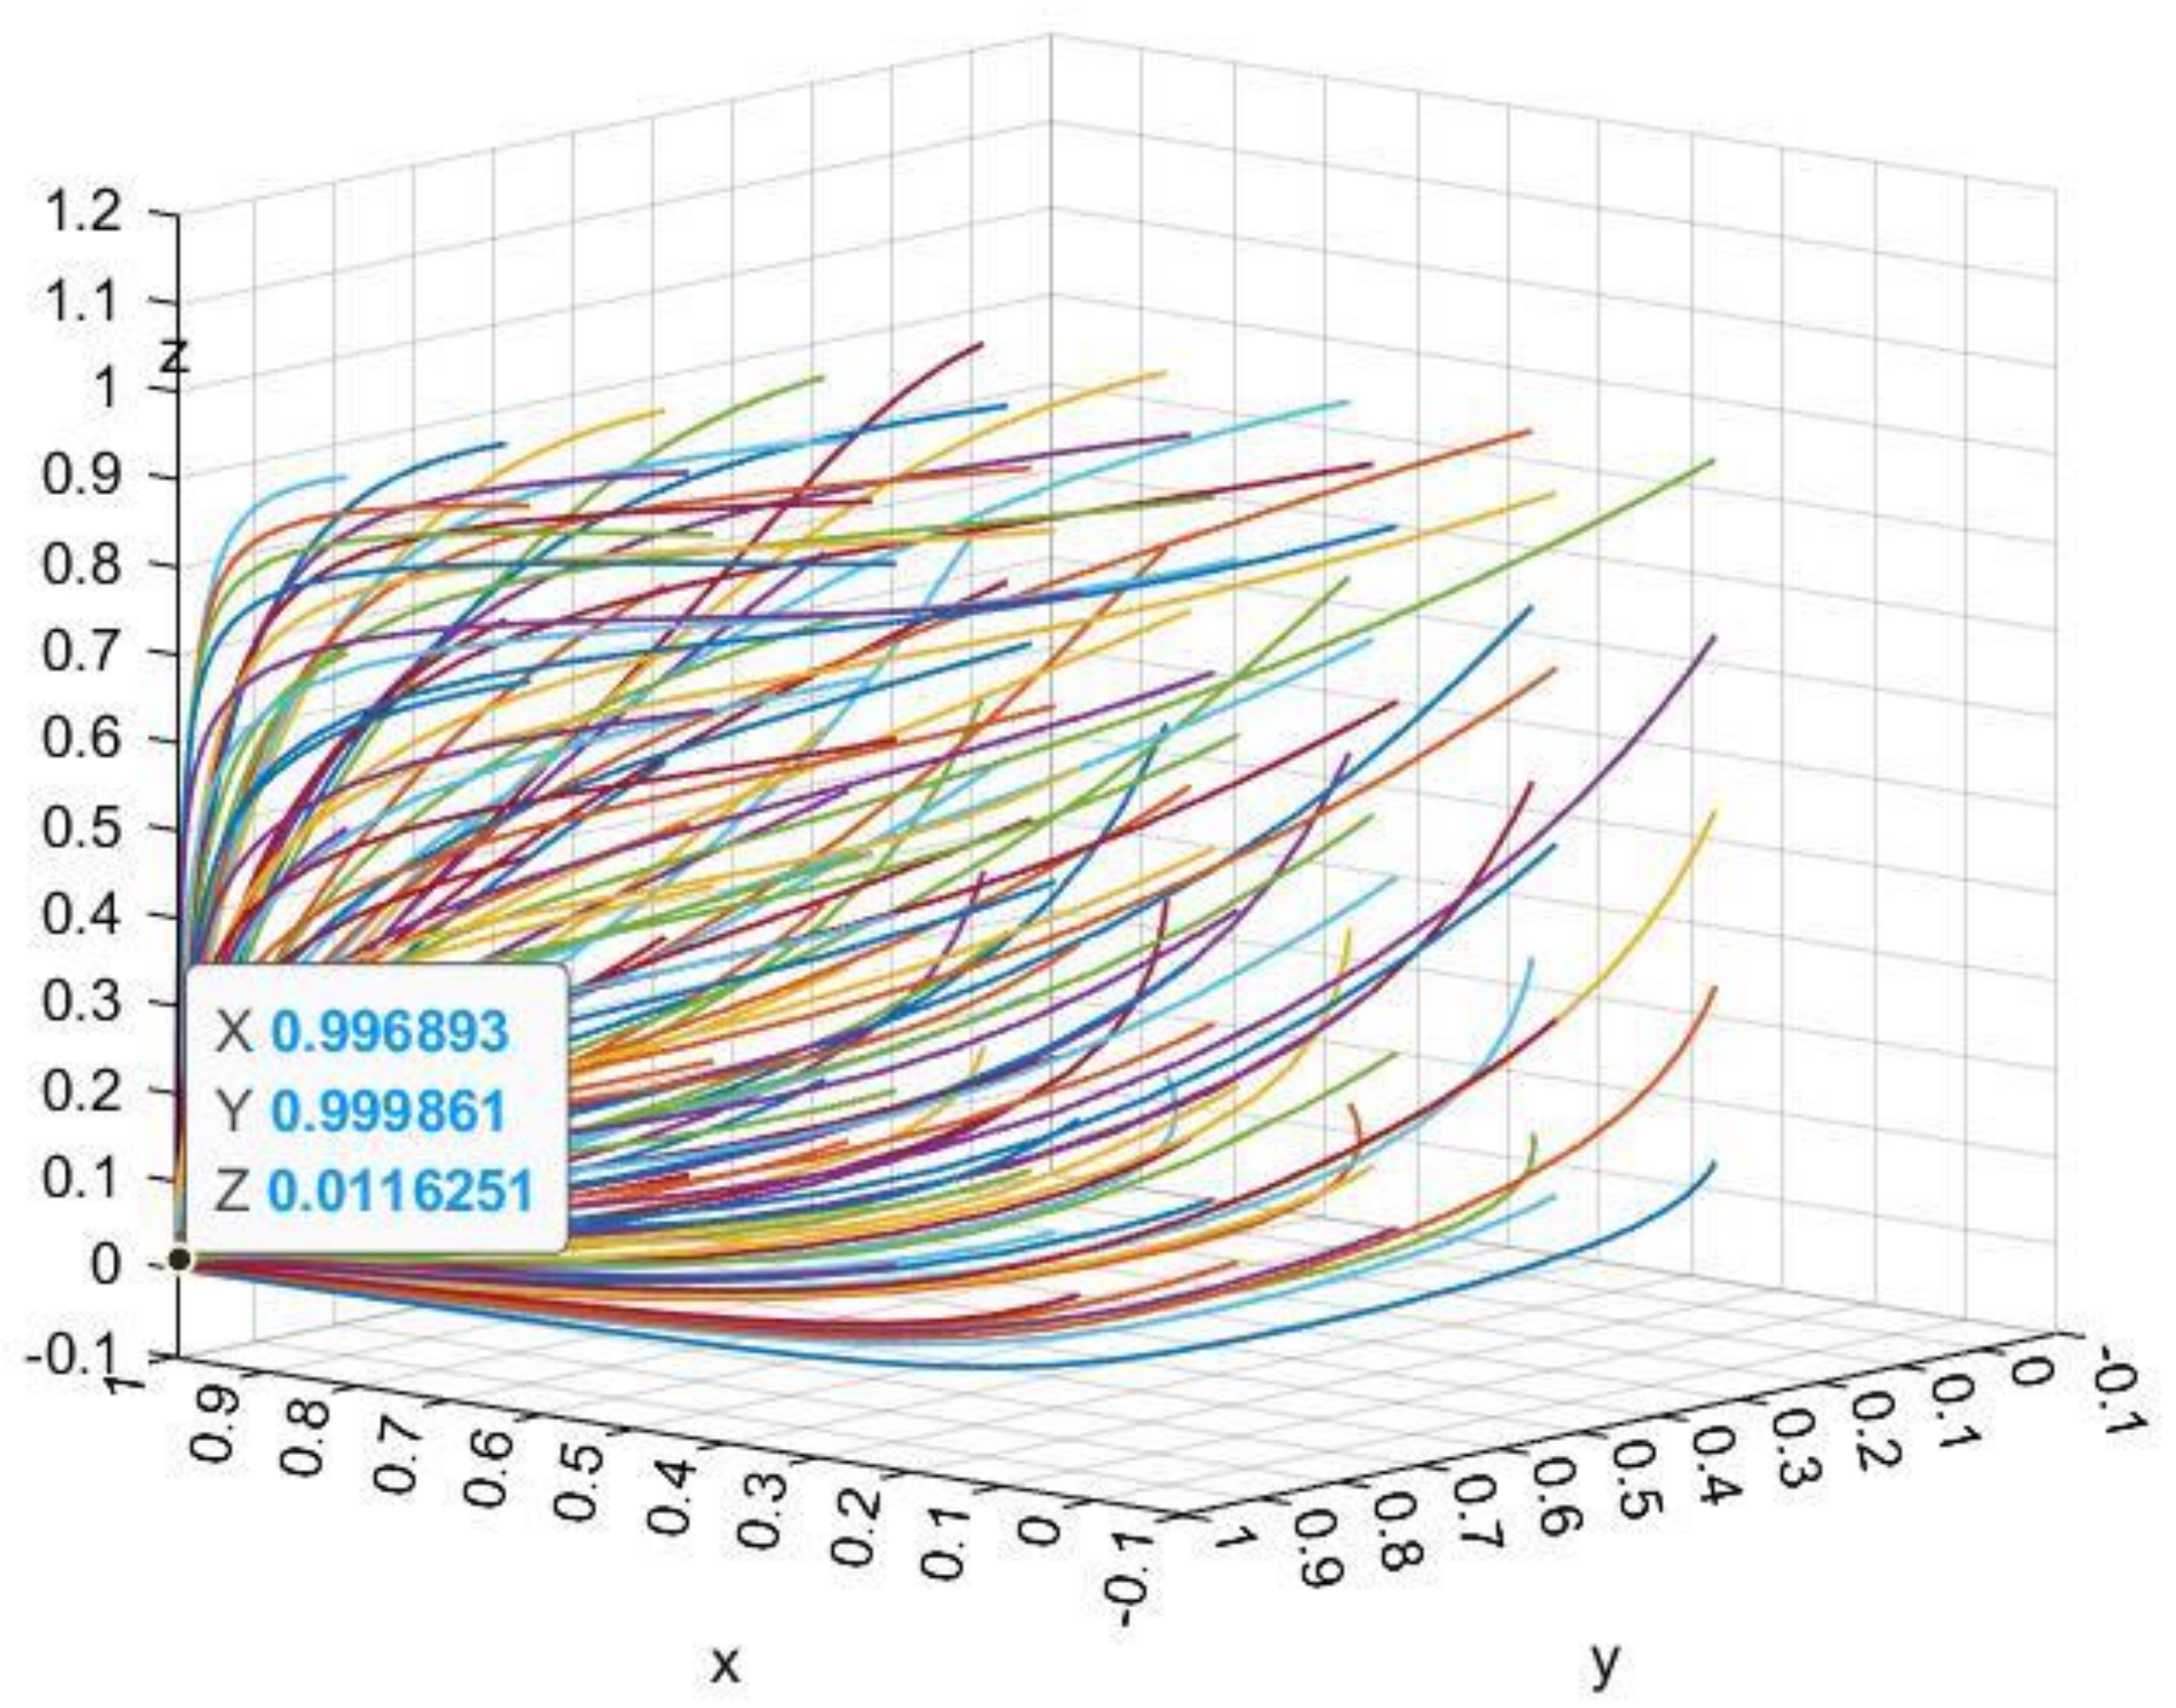
The value of each parameter is R1 = 30, R2 = 25, C2 = 10, C1 = 45, F1 = 6, F2 = 2, G = 8, H = 4, W = 8, E1 = 4, E2 = 6, L1 = 12, L2 = 15, S1 = 11, S2 = 10, C3 = 14, C4 = 20, and M = 5. The path diagrams of the above parameters all meet the stability state E3 (0,1,0), namely R 1 C 1 + F 1 + G < R 2 C 2 , L 2 W < 0 , and S 2 + M < C 4 . It can be seen in Figure 1 that the high revenues stimulate manufacturing enterprises to choose the traditional high-polluting production mode and public media tends to evade active investigation due to the high investigation cost. Under the strengthened supervision, firms tend to take the risk of punishment despite the fact that inactive investigation and high-polluting production mode will lead to the high penalties. Thus, after 50 simulation tests, the strategies of the three parties converges at the stable condition E3 (0,1,0).
(2)
The numerical simulation tests of dynamic evolution in the early stage
The value of each parameter is R1 = 30, R2 = 25, C2 = 10, C1 = 45, F1 = 6, F2 = 2, G = 8, H = 4, W = 8, E1 = 4, E2 = 6, L1 = 12, L2 = 15, S1 = 11, S2 = 10, C3 = 14, C4 = 15, and M = 15. Compared with the beginning stage, the values of punishment of inactive investigation and cost for public media have changed. The above parameters all satisfy the stable condition E4 (0,1,1), and the inequality R 1 C 1 + F 1 + F 2 + G + H < R 2 C 2 , L 1 W < 0 , and S 2 + M > C 4 . As we can see from Figure 2, the increased punishment of inactive investigation and decreased investigation cost may promote public media to transform the investigation attitude. At the end of the simulation tests, the equilibrium point of pure strategies for three parties centralizes at the stable condition E4 (0,1,1).
(3)
The numerical simulation tests of dynamic evolution in the middle stage
The value of each parameter is R1 = 30, R2 = 25, C2 = 10, C1 = 30, F1 = 6, F2 = 4, G = 15, H = 8, W = 15, E1 = 8, E2 = 6, L1 = 12, L2 = 15, S1 = 20, S2 = 10, C3 = 13, C4 = 16, and M = 5. The above parameters all meet at stability state E8 (1,1,1), and is subject to the inequality R 1 C 1 + F 1 + F 2 + G + H > R 2 C 2 , E 1 W < 0 , and S 1 > C 3 . As shown from Figure 3, the potential subsidies of lower-carbon production have gradually increased and the punishment of high-polluting production has risen as well, so that manufacturing enterprises are more willing to choose the cleaner production over heavy-polluting production mode. Therefore, it demonstrates manufacturer tendency to choose the lower-carbon production mode under the duplex supervision of government agency and public media, and the evolution path converges at stable condition E8 (1,1,1).
(4)
The numerical simulation tests of dynamic evolution in the mature stage
The value of each parameter is R1 = 30, R2 = 25, C2 = 10, C1 = 30, F1 = 18, F2 = 8, G = 15, H = 8, W = 8, E1 = 4, E2 = 6, L1 = 12, L2 = 15, S1 = 12, S2 = 10, C3 = 20, C4 = 25, and M = 5. These parameters meet at stability condition E7 (1,1,0) and substitute into the inequality R 1 C 1 + F 1 + G > R 2 C 2 , E 2 W < 0 , and S 1 < C 3 . When manufacturing enterprises consciously adopt a cleaner production model, media supervision becomes less necessary. Figure 4 describes the public media tendency to avoid the active investigation at the mature supervision stage. Therefore, it concludes that the strategy of public media is related to the strategies of government supervision and manufacturing production mode. If companies are more willing to adopt the low-carbon production mode under the strengthened supervision, the public media no longer needs to increase investigation intensity and the evolution path achieves the mature stability E7 (1,1,0).

3.2. Sensitive Analysis of Parameters

3.2.1. Revenue and Subsidy Parameters Analysis

In order to further study the cause of the transformations of path evolution of the three participants, a sensitivity analysis of the major parameters is done through the numerical simulation tests. Because the commonality of the four equilibrium points obtained by this research model is that the government adopts a strong supervision strategy, the reasons for the change of the equilibrium points will be mainly analyzed from the perspectives of the other two participating entities, the manufacturing enterprise and public media. The revenue parameters of manufacturers and media are, respectively, R1 and R2, E1 and E2. Apart from revenues, the subsidies parameters F1 and F2 also influence the strategies for manufacturing companies.
(1)
Revenue parameters of manufacturing firms
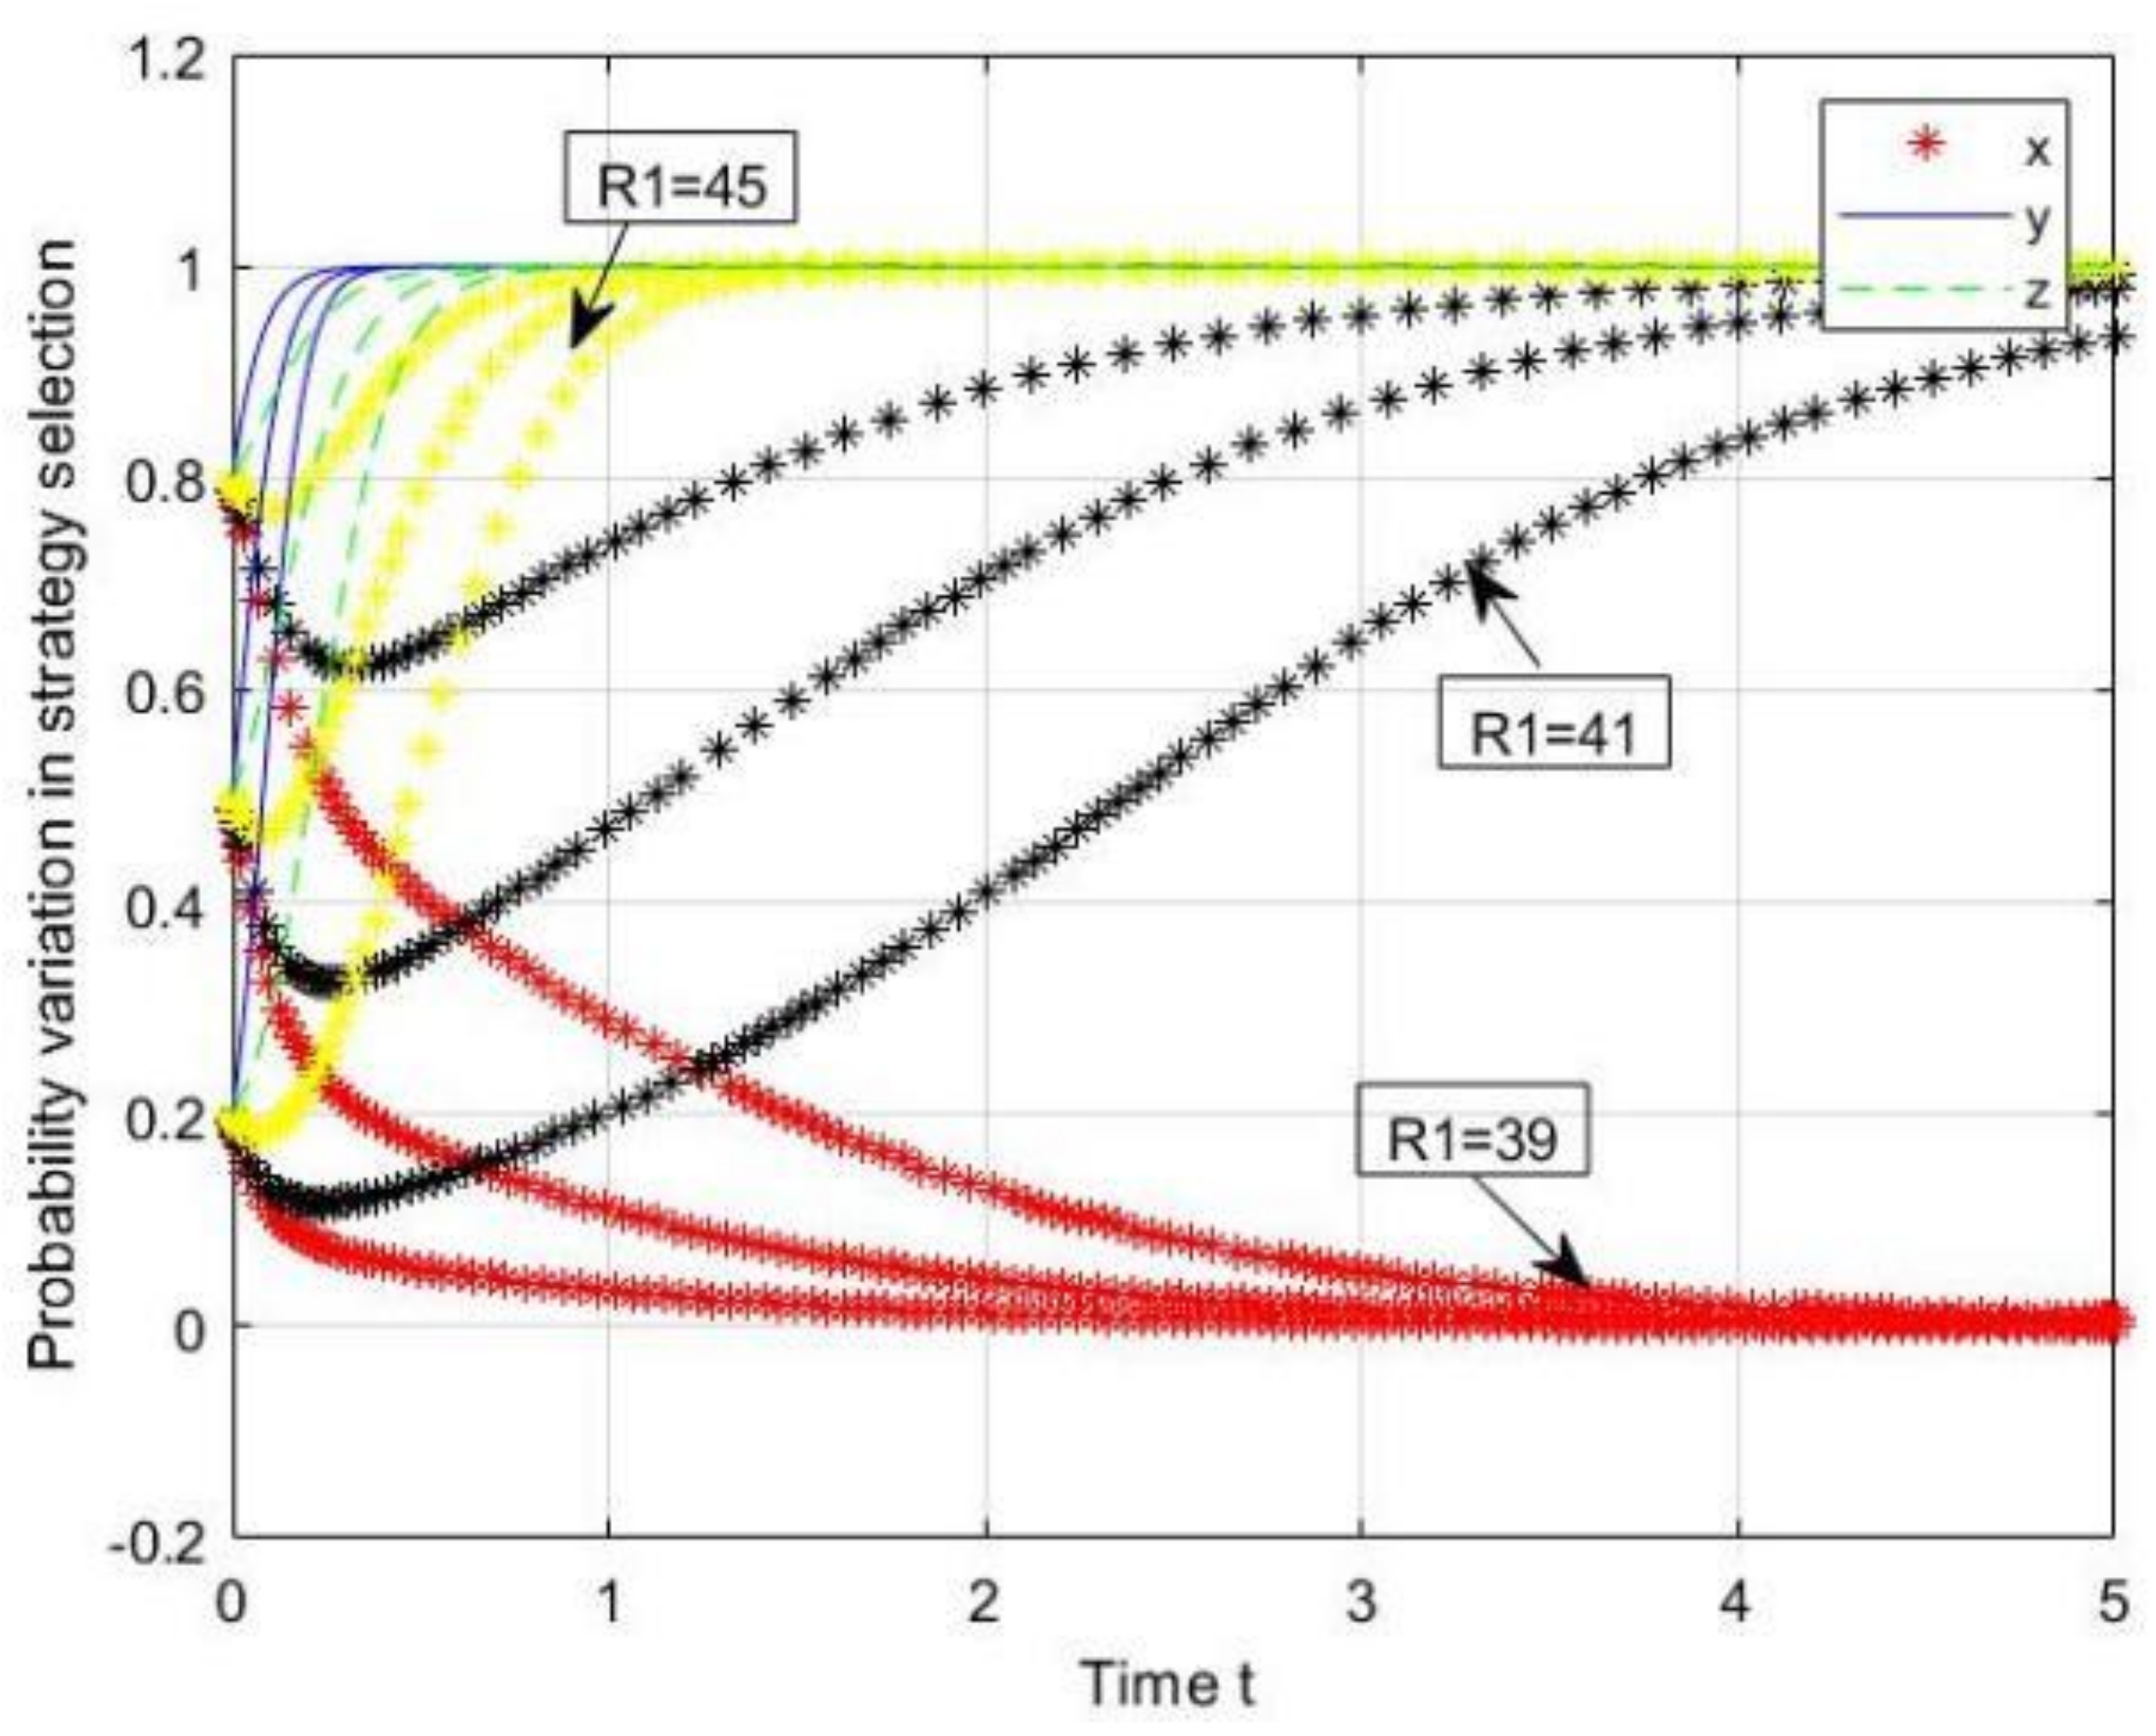
Satisfying the condition of R 1 C 1 + F 1 + F 2 + G + H < R 2 C 2 , this simulation test sets the values of parameter R1 as 39 (Red), 41 (Black) and 45 (Yellow). As shown in Figure 5, the initial choice of manufacturing enterprises is high-polluting production, and as the revenues of low-carbon production mode increase, enterprises gradually turn to a cleaner production mode. At this time, the stable condition changes from E4 (0,1,1) to E8 (1,1,1). Therefore, it explains why high revenues of lower-carbon production mode motivates firms to reform the traditional production mode.
Compared with the change of parameter R1, the values of parameter R2 are denoted as 21 (Red), 24 (Black), and 28 (Yellow), which is subject to the condition of R 1 C 1 + F 1 + G > R 2 C 2 . It is shown in Figure 6 that the equilibrium point transformed from E7 (1,1,0) to E3 (0,1,0), which reflects that heavy-polluting enterprises’ attempts to avoid the public media investigation in pursuit of high profits.
(2)
Subsidies parameters of manufacturers firms
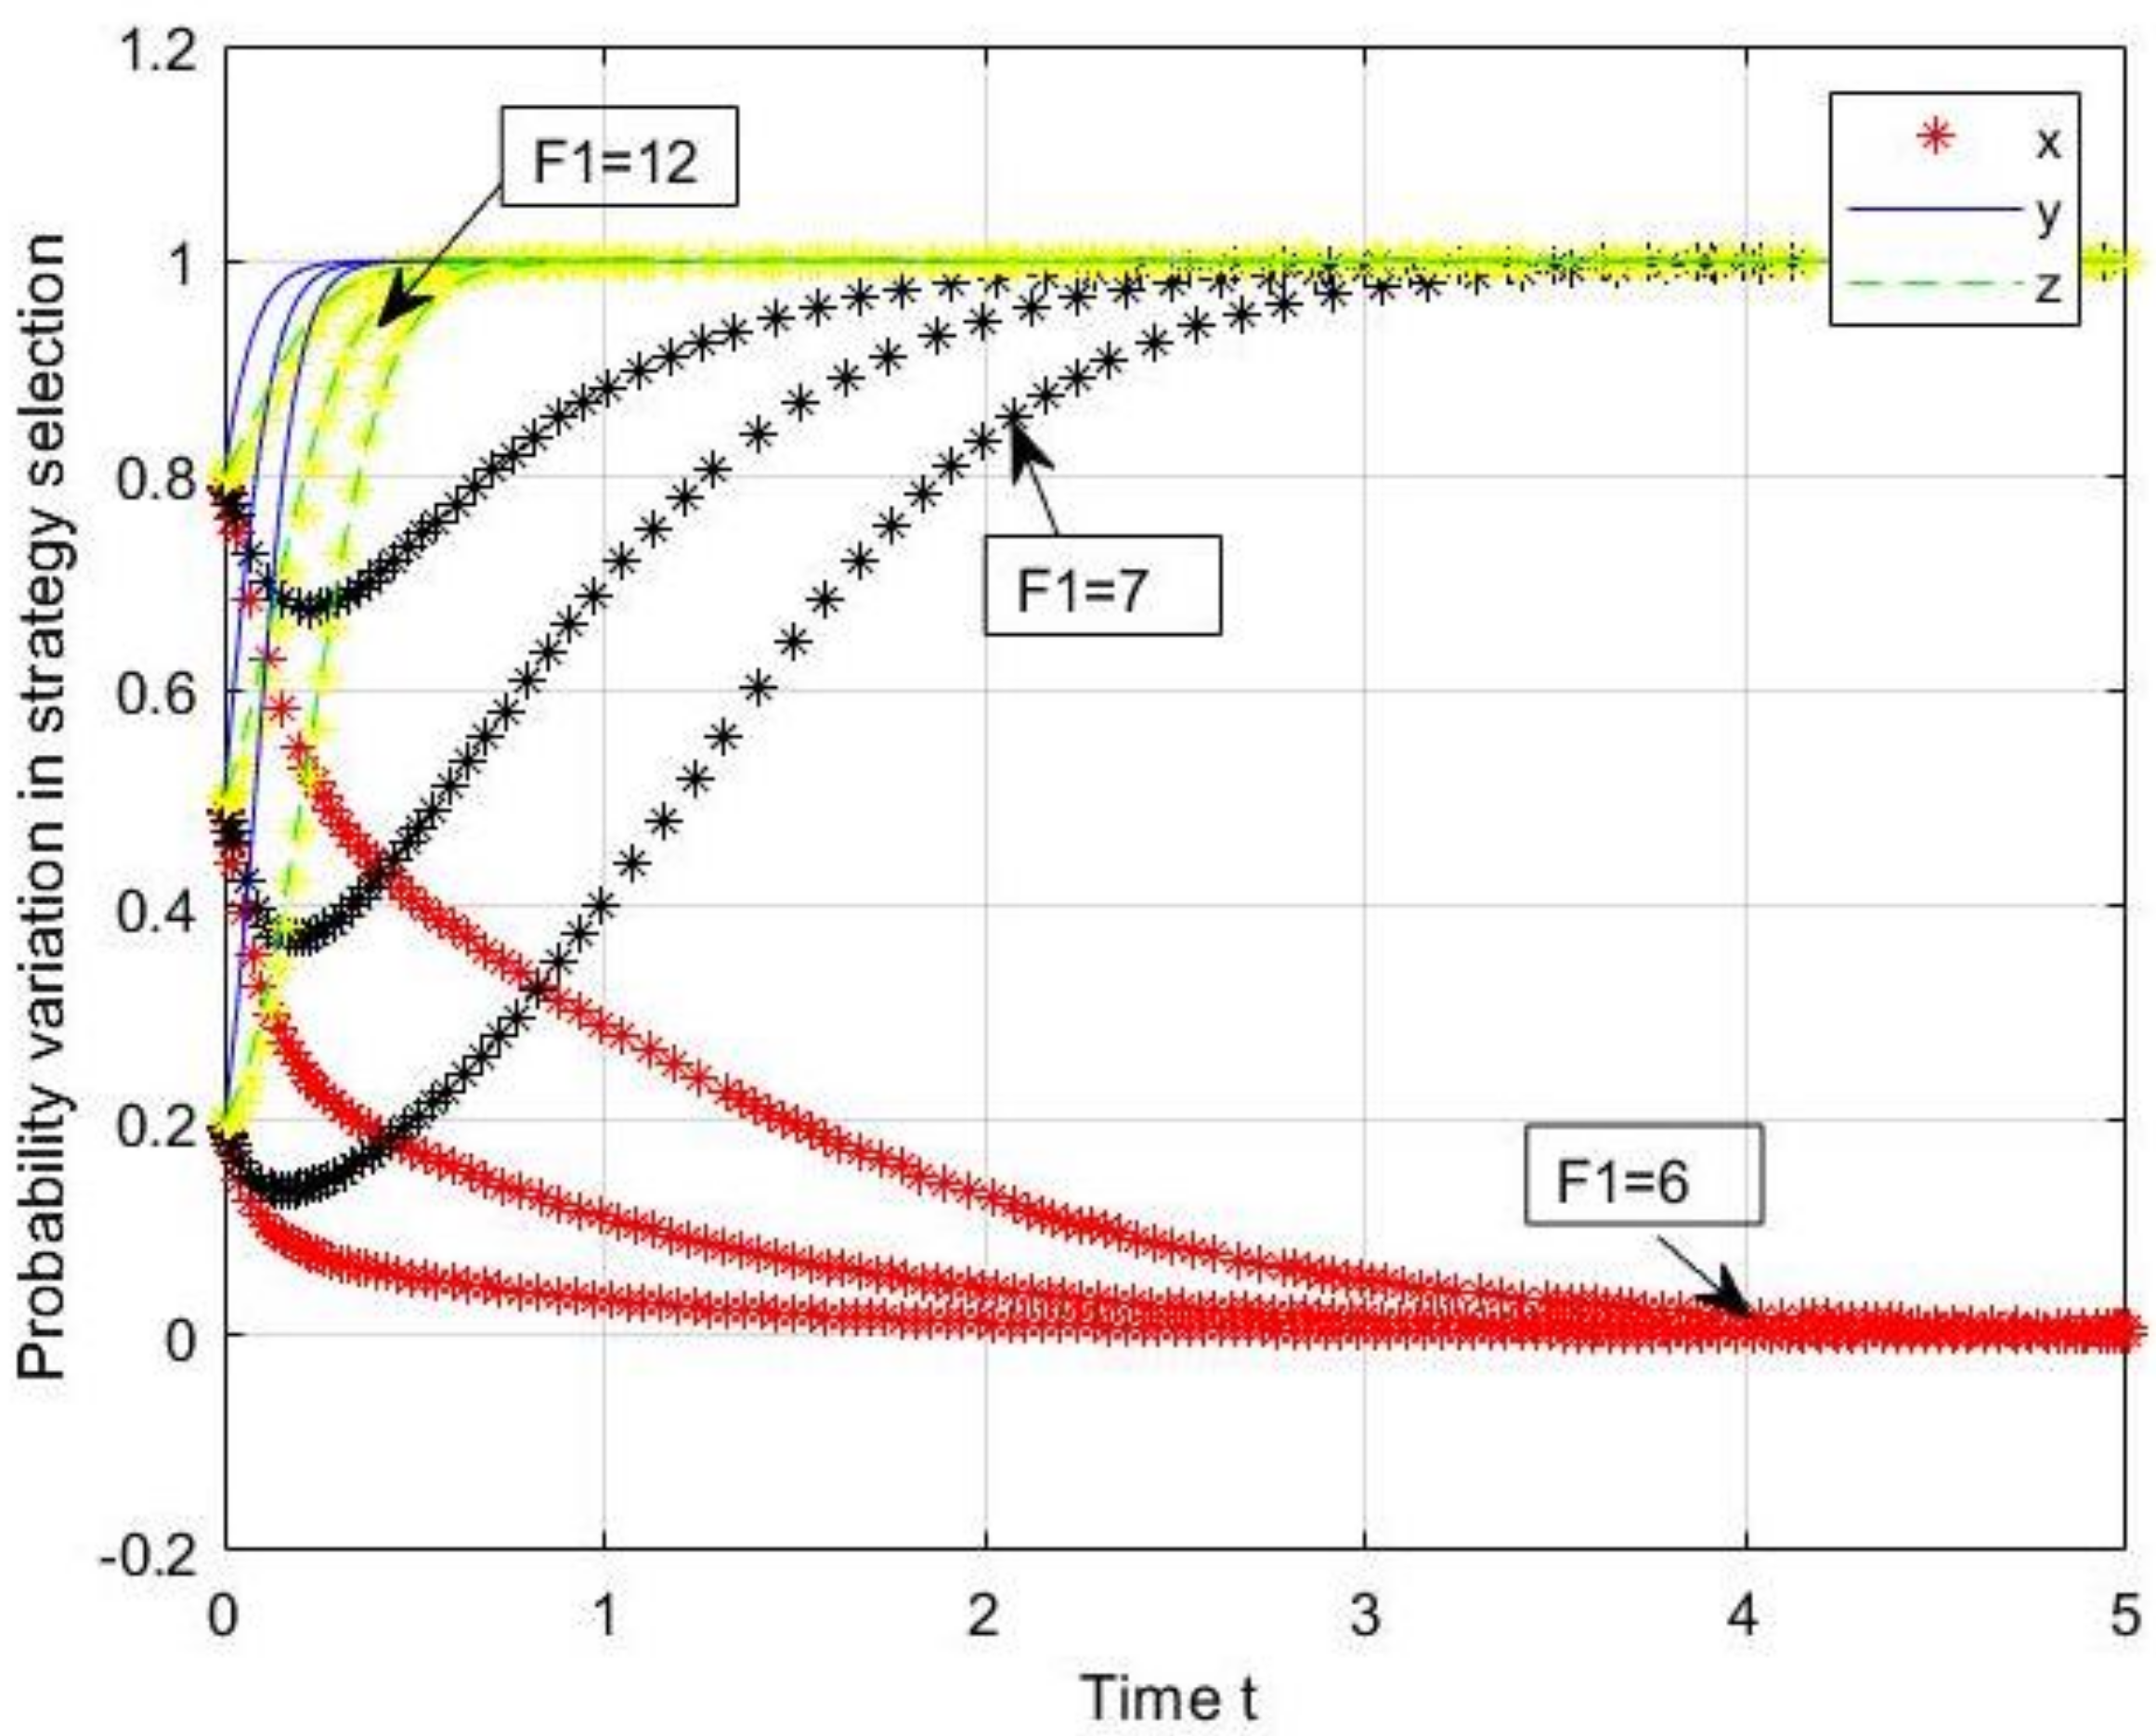
In addition to revenue, subsidies also influence the manufacturing production strategy. Although the government regulatory and public media carry out the strengthened supervision and active investigation, heavy-polluting manufacturers still focus on the high revenues only and are not willing to promote the clean production mode. In order to motivate the firms to adopt the clean production mode, government and public media both provide the potential subsidies for lower-carbon manufacturing business. Figure 7 and Figure 8 both show that increasing subsidy parameters F1 and F2 positively encourage the manufacturers to choose the lower-carbon production strategy. At this time, the equilibrium point changes from E4 (0,1,1) to E8 (1,1,1) through increasing the values of F1 (F1 = 6 (Red), 7 (Black) and 12 (Yellow)) and F2 (F2 = 2 (Red), 3 (Black) and 5 (Yellow)).
(3)
Revenue parameters of public media
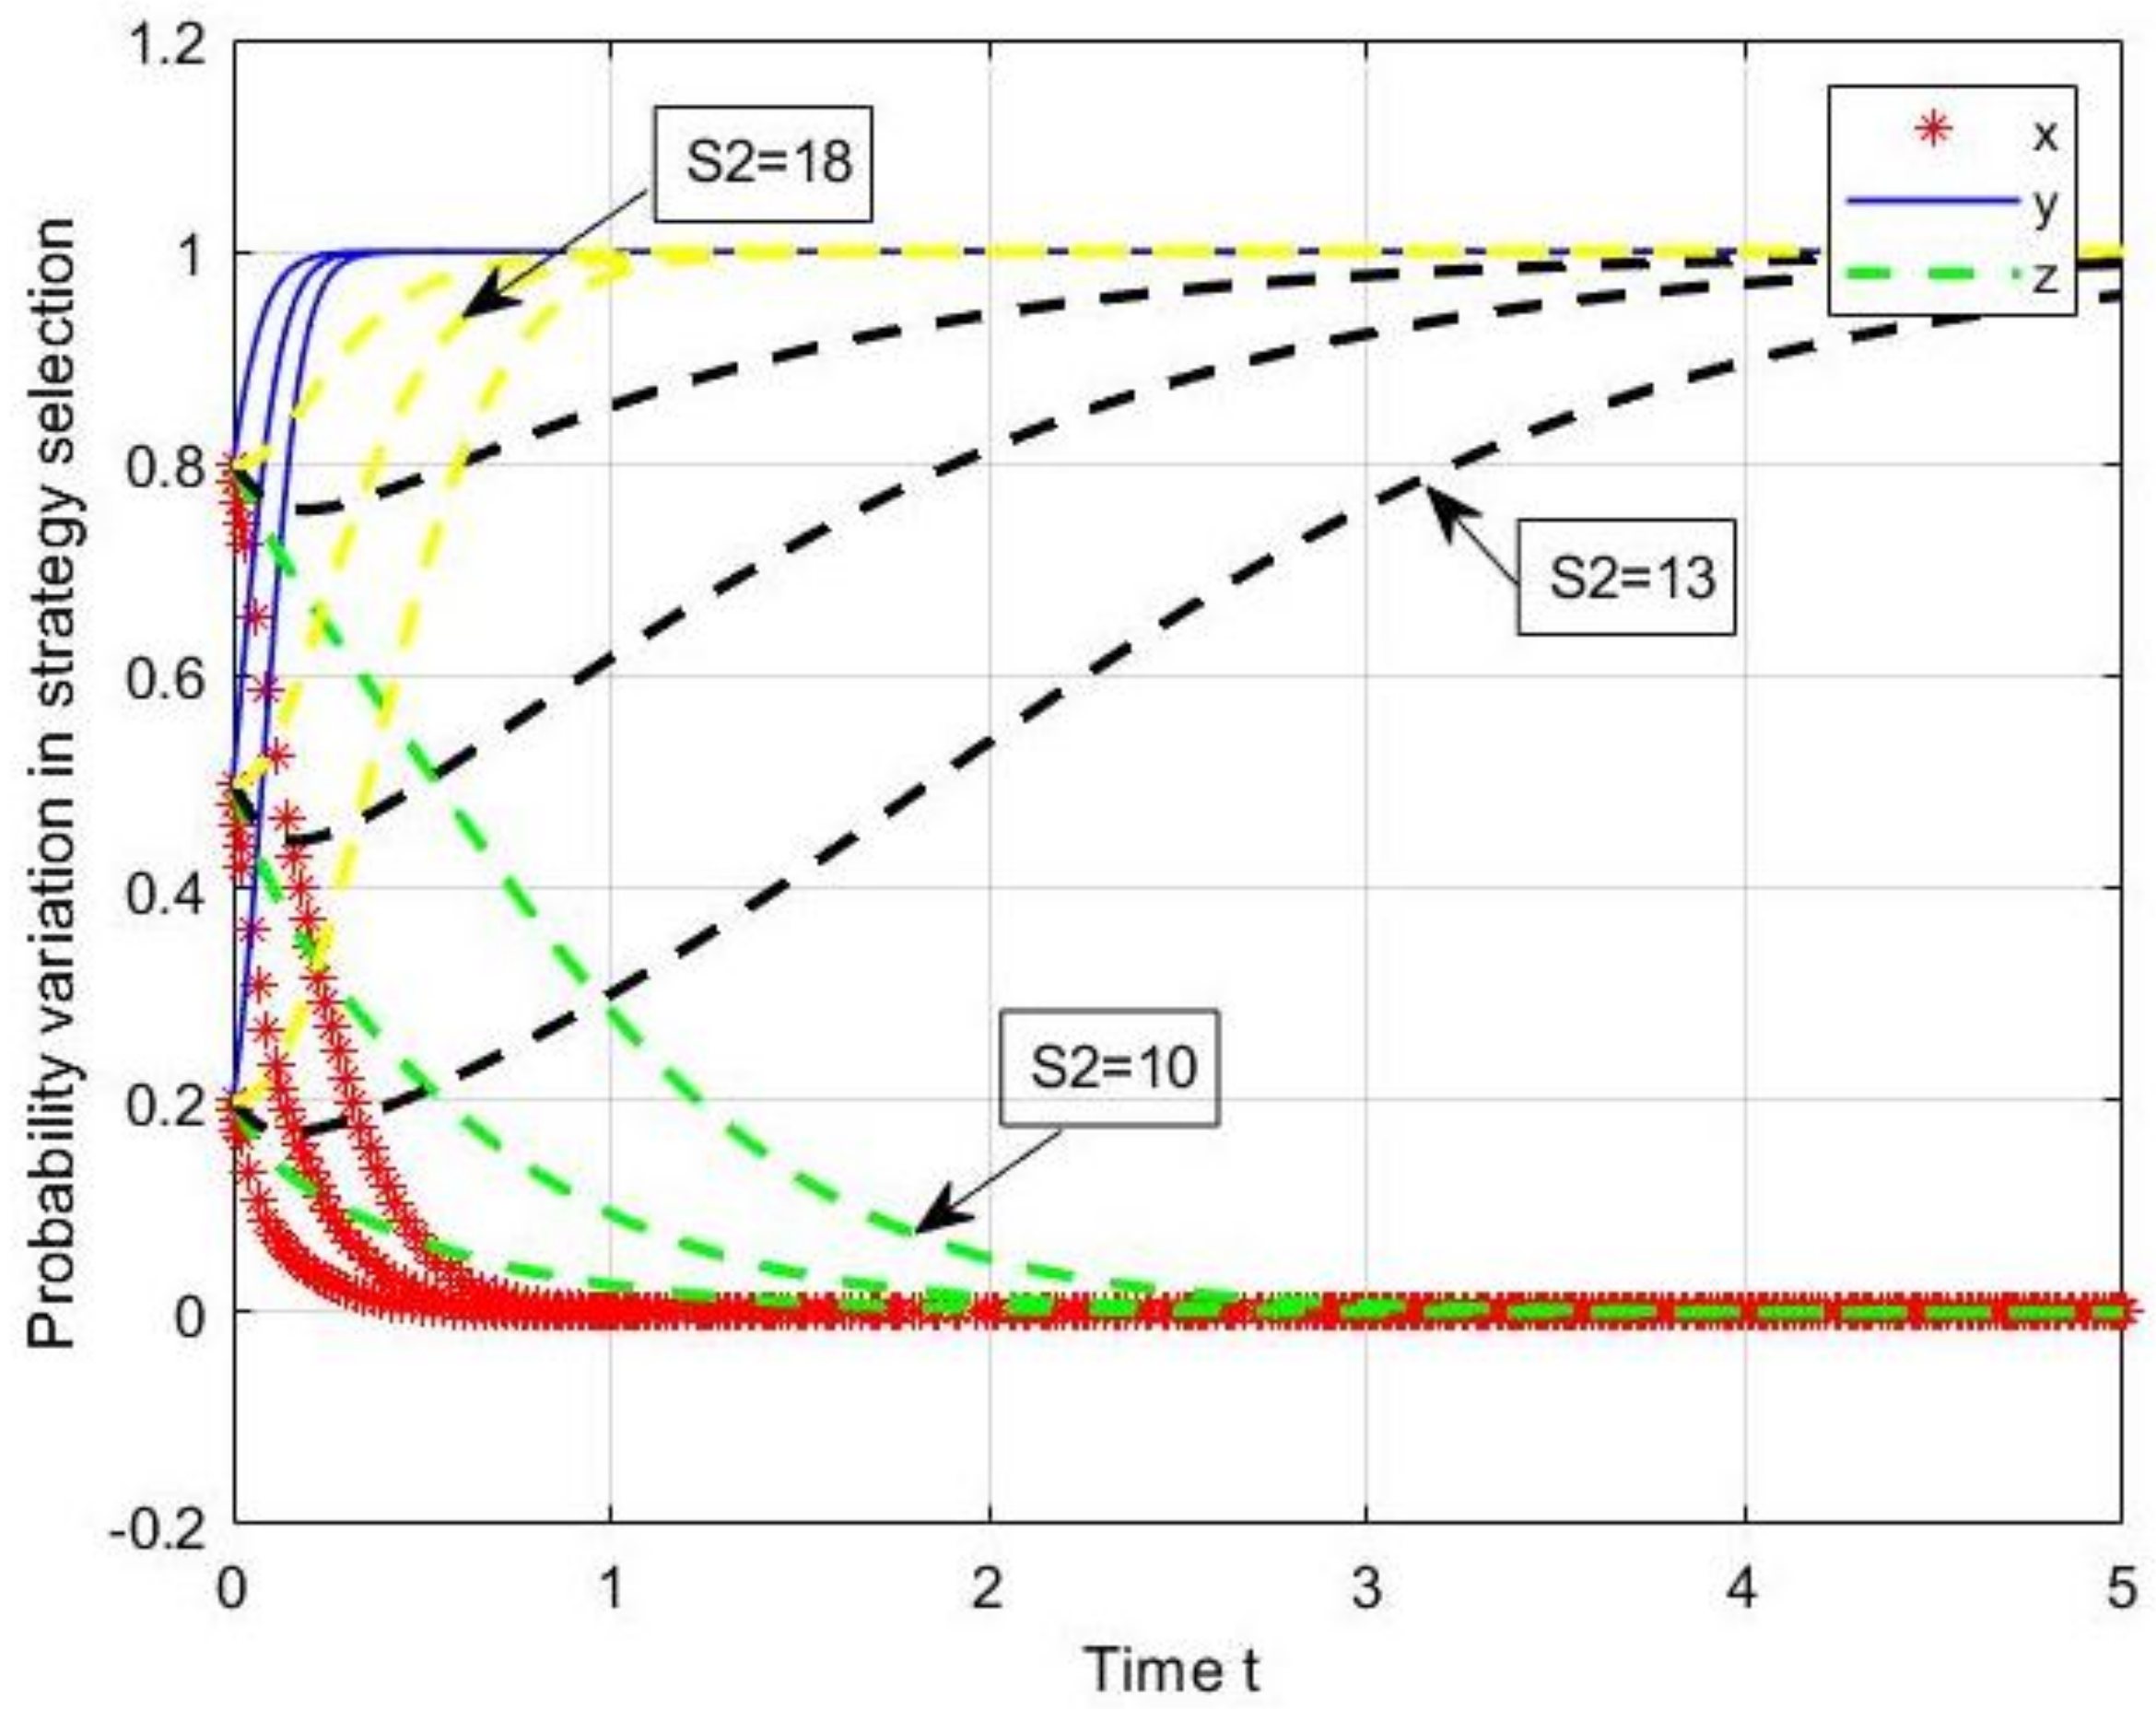
In addition to the strategy of manufacturing firms, the investigative attitude of public media also affects the transformation of equilibrium evolution. While the government maintains strong supervision, public media will evaluate the costs and revenues during the process of investigation. If the public media survey discovers that the majority enterprises take over the heavy-polluting production mode, the potential revenues of media investigation will increase under the support of the government regulatory agency. As it can be seen from Figure 9, the values of revenues S2 for public media in investigating heavy-polluting firms increase from 10 (Green) to 18 Yellow), so that the equilibrium point moves from E3 (0,1,0) to E4 (0,1,1). Thus, it means that the strategy of public media changes from the inactive survey to active investigation.
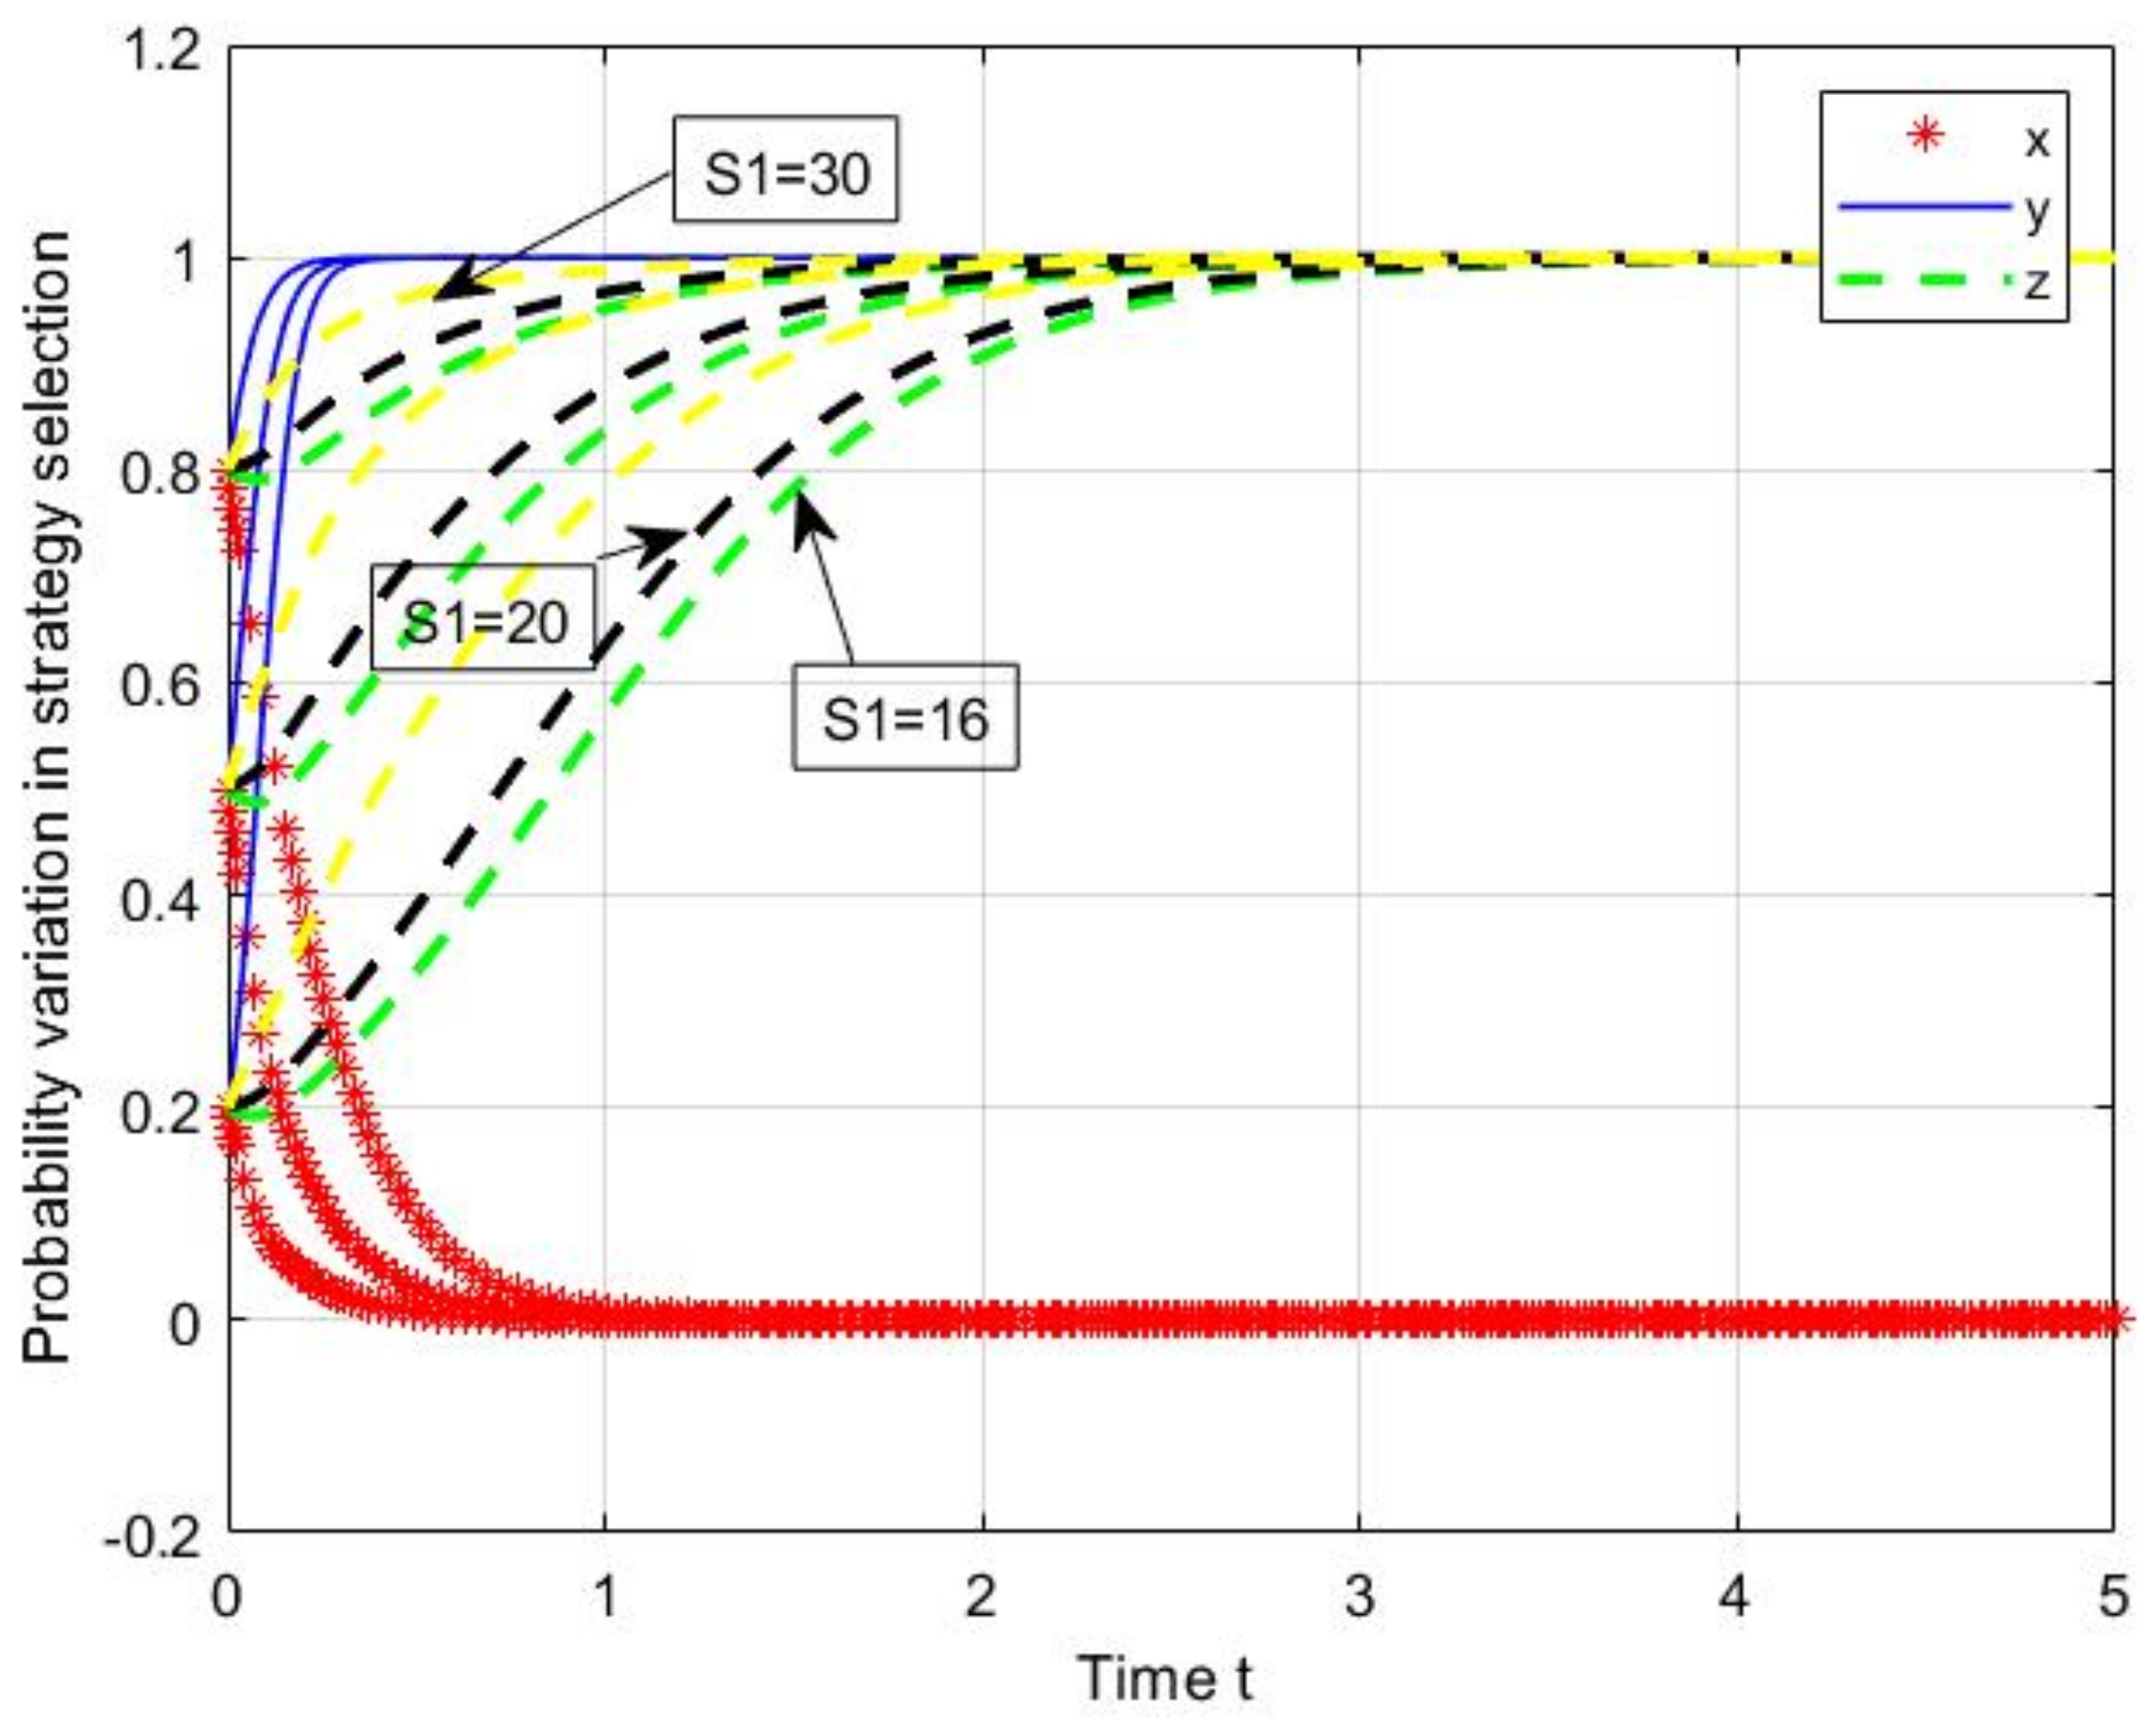
However, when the majority firms have rectified the production mode from heavy-polluting to lower-carbon production under the strong supervision of government, it is not necessary for public media to pay much attention to investigation. Figure 10 shows that survey revenues (S1 = 16 (Green), 20 (Black) and 30 (Yellow)) have no obvious effect on the movement of equilibrium evolution when entering into the mature supervision system. Thus, it can be concluded that it is not essential for public media to carry out a deep investigation at the mature supervision stage.

3.2.2. Cost Parameters Analysis

Based on the payoff matrix of the three parties evolutionary game model, participants also consider the cost of choosing strategies, so this study further analyzes the major cost parameters of manufacturing enterprises and public media. Since the four equilibrium points belong to the strategy of strong government supervision, the following analysis focuses on evaluating the parameters of the other two participants, namely manufacturing companies and public media.
(1)
Cost parameters of manufacturing firms
Considering the different costs of heavy-polluting and clean corporate production mode, the cost parameters C1 represents the cost of low-carbon production and C2 represents the heavy-polluting production cost. Figure 11 and Figure 12 compare the difference between the change of C1 and C2. When the government and the media strongly promote the low-carbon production, such as the support of technique and policy, the cost for manufacturing in clean production mode decreases. Decreased costs of clean production (C1 = 36 (Red), 34 (Black) and 30(Yellow)) push the movement of equilibrium point from E4 (0,1,1) to E8 (1,1,1) in Figure 11, which means that manufacturing enterprises tend to choose the lower-carbon strategy.
In addition, if government departments continue to strengthen the supervision of high-polluting enterprises, the production and operation of these enterprises will be hindered. As a result, the production costs (C2 = 9 (Red), 11 (Black), and 15 (Yellow)) of these enterprises rise. Figure 12 shows that increased heavy-polluting cost will encourage the firms to improve their production mode, so that the stable condition is shifted from E3 (0,1,0) to E4 (0,1,1).
(2)
Cost parameters of public media
In terms of the investigation cost for public media, there are also two different situations to be discussed. The first condition is that government chooses the strong supervision strategy and manufacturing firms accept the heavy-polluting production strategy. Then, if the cost of media survey gradually rises and exceeds its benefits, public media may be not willing to keep the active investigation. At this time, the increasing changes of C4 (C4 = 19 (Green), 20 (Black), and 25 (Yellow)) will result in the transformation of equilibrium point from E4 (0,1,1) to E3 (0,1,0). Thus, it demonstrates that the cost of investigation has an obvious effect on public media strategy in Figure 13.
The second condition is that government still maintains the strong supervision, while manufacturing companies choose the lower-carbon production mode. This means that the supervision system of carbon emission has entered into the mature stage, so the public media does not have the obvious effect on regulating manufacturing production. Then, the cost of investigation C3 (C3 = 15 (Green), 20 (Black) and 25 (Yellow)) for public media may outweigh its profits. It also can be seen from Figure 14 that the higher cost of media investigation will change the strategies of public media and the equilibrium stage also transfers from E8 (1,1,1) to E7 (1,1,0).

3.2.3. Loss Parameters Analysis

After carrying out the sensitivity analysis of revenue, subsidy, and cost parameters of this research, the effect of loss cannot be ignored. For heavy-polluting manufacturing companies, the government and the media will impose certain penalties under the strengthened supervision. At the same time, if the media does not actively investigate when the pollution of enterprises becomes critical, media will also be penalized by the government. Thus, this research carries out the further sensitivity simulation tests of the loss parameters.
(1)
Loss parameters of heavy-polluting manufacturing firms
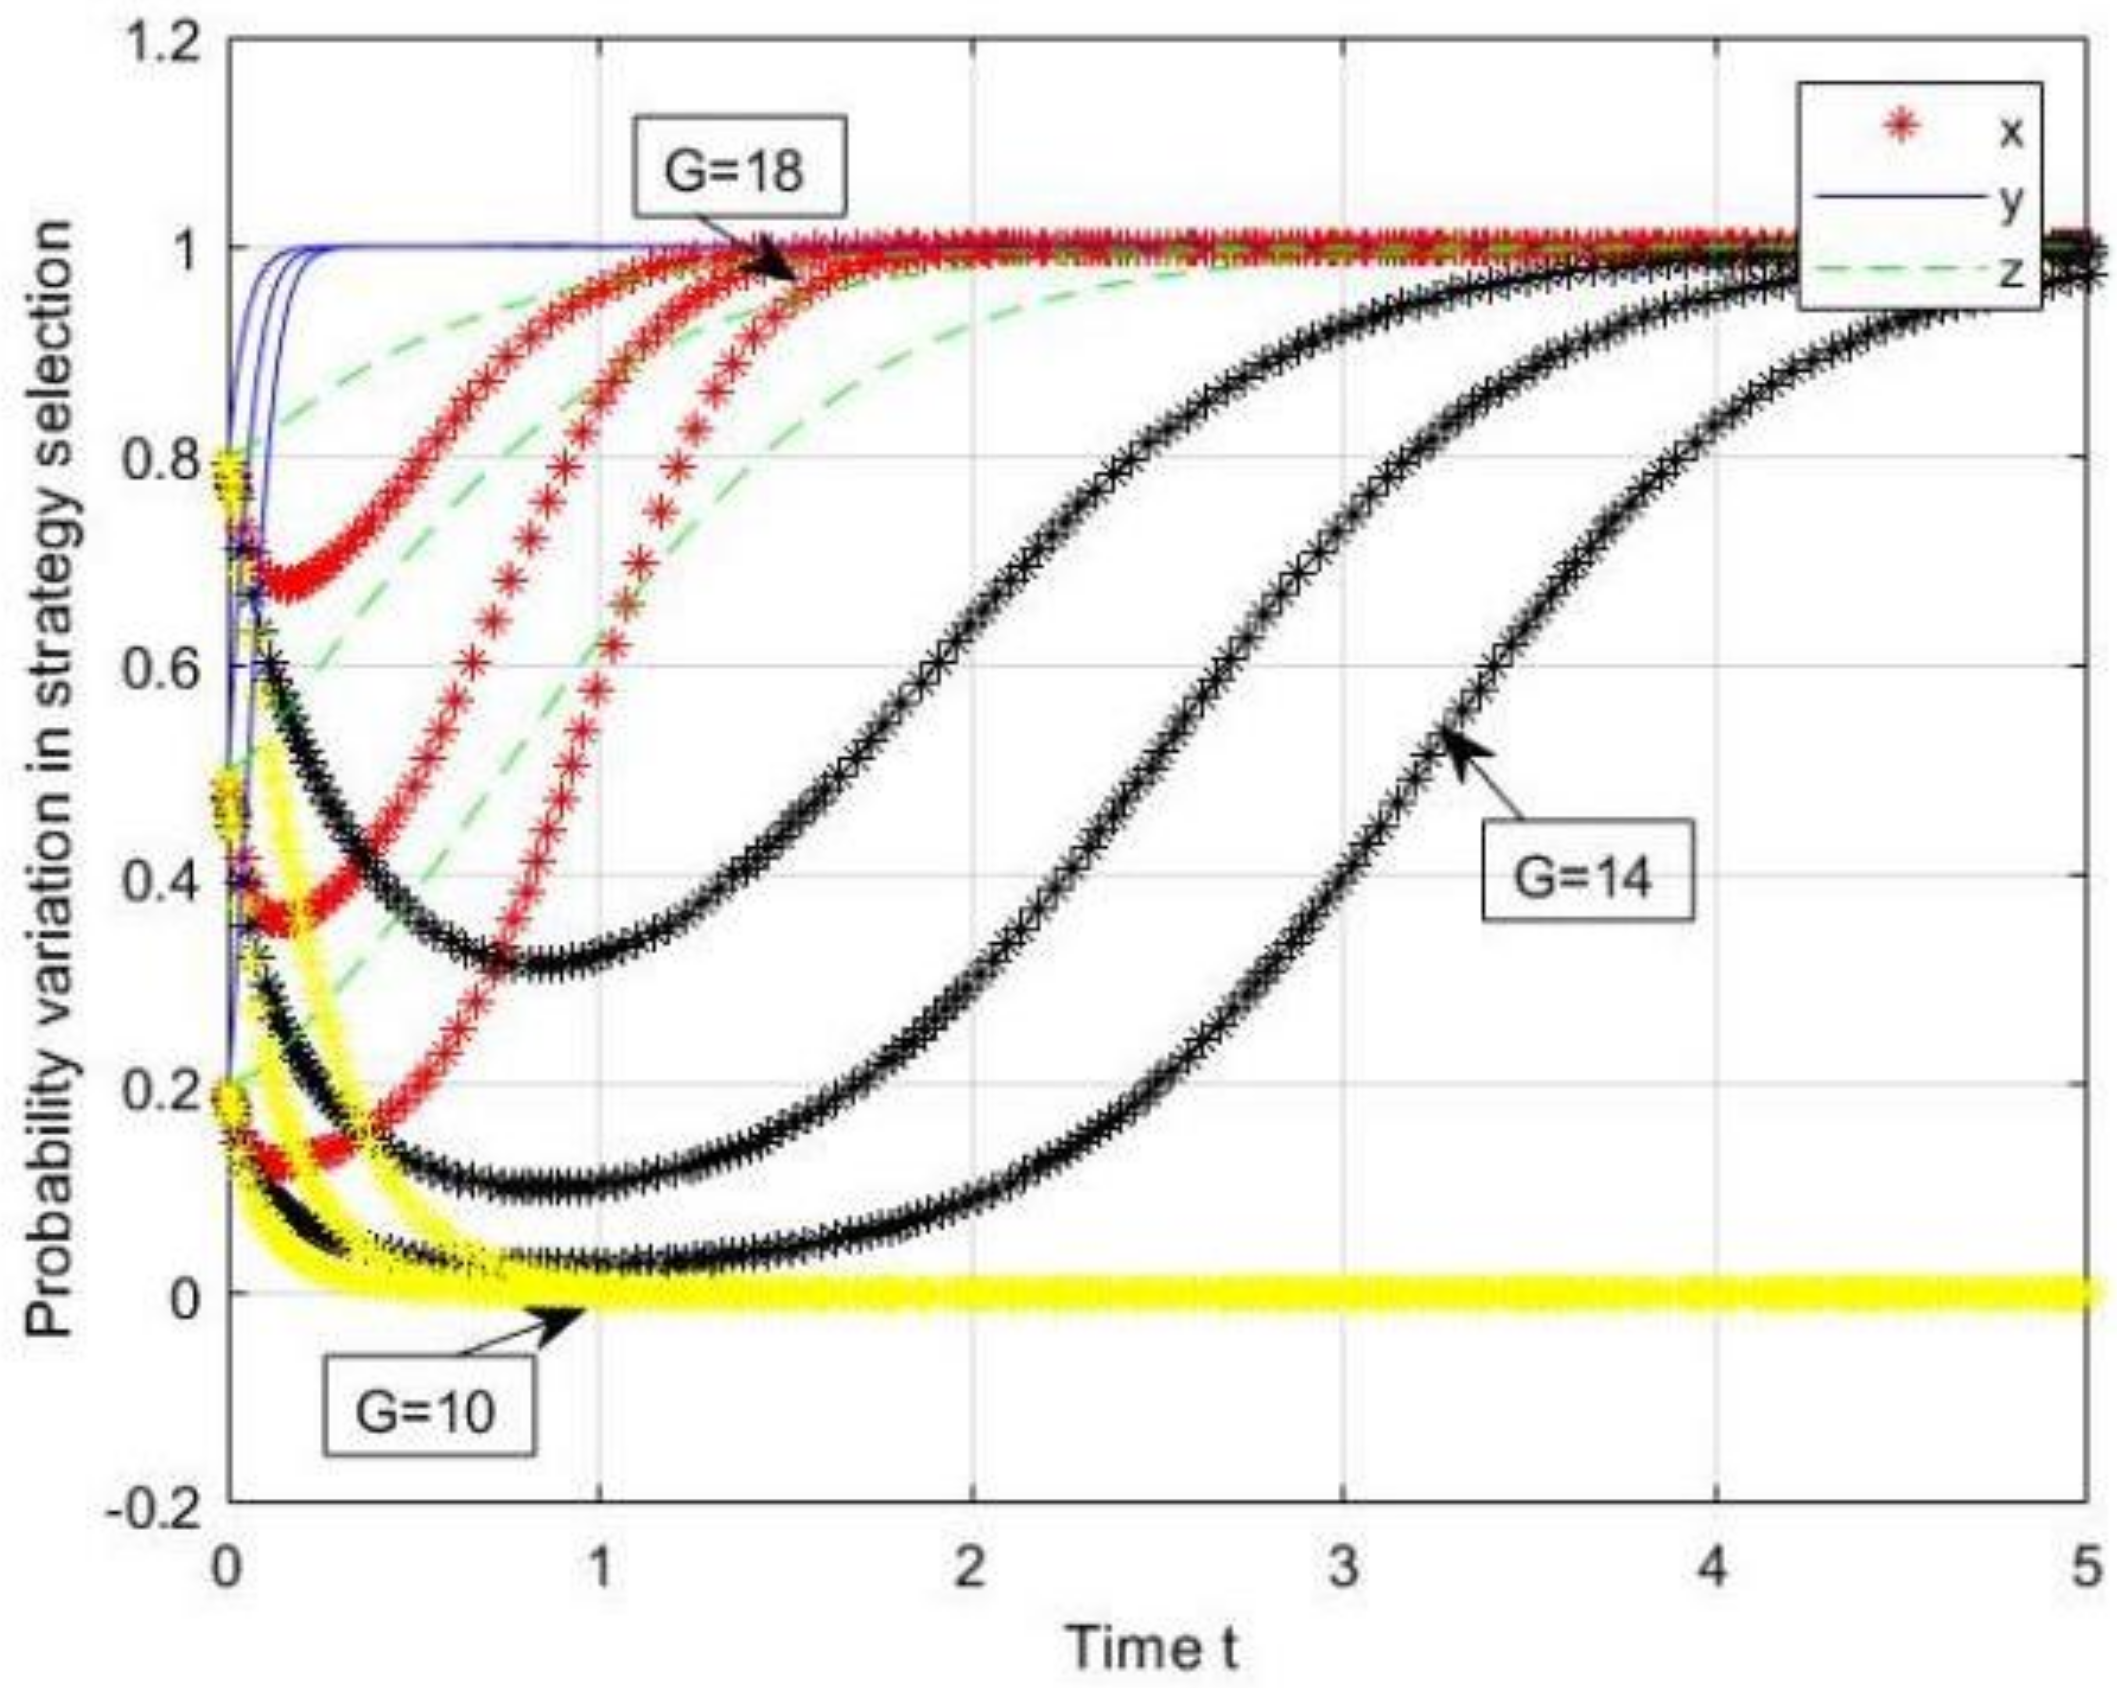
As for the loss of heavy-polluting manufacturing firms, the punishment is given by the government and public media. Manufacturing firms may still choose the traditional heavy-polluting production mode when government and public media loosen the supervision and investigation. It can be explained from Figure 15 and Figure 16 that the decreased values of G (G = 18 (Red), 14 (Black), and 10 (Yellow)) and H (H = 12 (Red), 7 (Black), and 3 (Yellow)) for heavy-polluting production will lead to an increasing number of traditional production firms. Thus, the weakened punishment is the reason for the change of equilibrium evolution.
(2)
Loss parameters of inactive media investigation
When the government regulatory agency takes over the strong supervision and public media and does not pay attention to actively surveying, the punishment should be taken by public media. These simulation tests of evolutionary game modes denote the values of M as 9 (Green), 11 (Black), and 15 (Yellow). Then, Figure 17 reflects that the path lines of equilibrium point have moved from E3 (0,1,0) to E4 (0,1,1). Therefore, this transformation demonstrates that increased penalties can significantly motivate the media to conduct active investigations of heavy-polluting manufacturing firms.

3.3. Summary of Equilibrium Variation

In order to intuitively describe the changing trajectory of four different dynamic stages, this section summarizes the transformation relationship of equilibrium points through the phase diagram. Then, according to the above sensitive analysis of each parameter, this study further concludes the numerical simulation tests of each equilibrium change process. As it can be seen from Figure 18, the phase diagram shows the mutual transformation of the beginning, early, middle, and mature stage, respectively, E3 (0,1,0), E4 (0,1,1), E8 (1,1,1), and E7 (1,1,0).
To sum up, the mutual changes of the equilibrium points of evolutionary games can be divided into eight different processes in Table 4. The common feature of the above equilibrium stage reflects that the government still carries out the strengthened supervision, so this sensitive analysis focuses on studying the factors of public media and manufacturing companies. On one hand, the change in the selection of public media is influenced by the factors of cost, revenue, and loss, including the four different evolution process, respectively E3 (0,1,0) to E4 (0,1,1), E4 (0,1,1) to E3 (0,1,0), E8 (1,1,1) to E7 (1,1,0), and E7 (1,1,0) to E8 (1,1,1). On the other hand, considering the factors of benefits, costs, and losses, manufacturing companies will also consider subsidies that come with lower-carbon production strategies. The remaining four dynamic evolution processes consist of the sensitive analysis of R1, R2, C1, C2, F1, F2, G, and H.

4. Promotion Mechanism of Manufacturing Production Mode

In the previous sections, the stable conditions to select the optimal strategies at different evolution stages of supervision system were discussed from the perspective of the production mode of manufacturing companies. Based on the numerical simulation tests of evolutionary game model, there are four equilibrium points: E3 (0,1,0), E4 (0,1,1), E7 (1,1,0), and E8 (1,1,1). As mentioned above in Table 4, costs, subsidies, gains, and losses are the main factors that affect the choice of manufacturing business and media strategies. In this section, the promotion mechanism of manufacturing production mode under the immature supervision stage is discussed.

4.1. Promotion Mechanism of Manufacturing Production Mode in Circumstance 1

Under Circumstance 1 of the equilibrium point at E3 (0,1,0), the production of manufacturing firms is still traditional heavy-polluting mode. The revenue of traditional production is high and outweighs the production cost. Few manufacturing companies choose the “lower-carbon production” strategy because of the higher profits. At the same time, government supervision plays an important role in restricting the heavy-polluting production. The government can raise the penalties for high-polluting enterprises, which also promotes supervision through implementing the environmental regulatory policies and principles. For example, the Chinese government has increased raw material costs and fiscal taxes on high-polluting companies, thereby reducing the profit margins of these companies and encouraging them to choose the low-carbon production mode.

4.2. Promotion Mechanism of Manufacturing Production Mode in Circumstance 2

Under Circumstance 2 of the equilibrium point at E4 (0,1,1), the public media are gradually realizing the importance of investigation, and the positive impact on propagating the benefits of “low-carbon” production. When public media actively cooperates with the government regulatory agency to carry out the active investigations on high-polluting enterprises, higher risk of punishment and exposure will push these firms to avoid the traditional heavy-polluting production. For example, when the online media continuously exposure their uneven and illegal production behaviors, the heavy-polluting business must spend more efforts on rectifying their non-environmental performance. According to the 49th “Statistical Report on Internet Development in China” released by the China Internet Network Information Center (CNNIC), as of December 2021, the number of Internet users in China has reached 1.032 billion. In the era of rapid development of the Internet, negative public opinion reports are detrimental to sustainable development of enterprises. Thus, if the public media is willing to actively investigate and cooperate with the government regulation, the dual supervision is more powerful to encourage firms to change the traditional high-polluting production mode and choose the “low-carbon production” strategy.

4.3. Promotion Mechanism of Manufacturing Production Mode in Circumstance 3

Under Circumstance 3 of the equilibrium point at E8 (1,1,1), with the support of government policy and the positive media reporting, the proportion of manufacturing companies choosing the “low-carbon production” strategies has gradually increased. At this stage, the technical talents provided by the government help enterprises to save a lot of production costs and create higher economic benefits. When the quality of manufacturing environmental performance maintains the high level, the positive media tendency also brings about potential profits for manufacturing companies. In addition, Chinese government and public media cooperate to set up a third-party regulatory platform to establish an environmental public opinion index of manufacturing firms on the Internet platform, so that the environmental performance of enterprises is subject to real-time supervision by the public. Therefore, the interactive collaboration between public media and government agency has a positive impact on promoting the “low-carbon production” strategy for manufacturing companies, and the evolutionary stage will gradually be achieved at the mature development.

5. Conclusions, Discussion, and Limitation

Based on evolutionary game theory, this paper constructs manufacturing enterprises, governments, and public media as the participants of evolutionary game, and studies the evolutionary stability strategy of these stakeholders. In this paper, numerical simulation experiments are used to explore the influence of related parameters on the choice of low-carbon behavior in the three parties. It is worth mentioning that from a low-carbon perspective, this paper studies the impact of government and media adoption of different regulatory policies on the production strategy of manufacturing enterprises. From the perspective of economics, analysis is done on the evolution of benefits, costs, subsidies, and losses on the decision-making choices of each participating entity. By comparing the Nashi equilibrium solutions of the evolutionary game model of three participants, this paper comes to the following conclusions:
  • The environmental performance of manufacturing companies, the supervision strategy of government agency, and adjustment mechanism of public media were examined on the basis of evolutionary game theory. The results of numerical simulation tests showed that strengthened supervision by the government and active investigation by public media both have obvious impact on motivating the manufacturing business to choose the “low-carbon production” strategy. Highly polluting companies are subject to more external pressure under the dual supervision of the government and public media, so they are willing to adjust their production strategies for the sustainable development.
  • By comparing the sensitive analysis of numerical simulation tests, the parameters cost, subsidy, and penalty related to manufacturers have great influence on the strategy adjustment of three participants. The lower cost and higher subsidy of clean production significantly attract the manufacturers, and the high penalty from the government supervision makes heavy-polluting companies reluctant to take risks. The increased proportion of “low-carbon production” manufacturing enterprises, the strengthened supervision and active investigation lead to the stable condition E8 (1,1,1). Moreover, if most enterprises voluntarily choose a “low-carbon production” strategy, the government will not mandate the media to conduct an in-depth investigation.
  • This study provides the equilibrium strategies for decision-makers at different supervision stages of manufacturing production. In the beginning and early stage, it was found that increasing the revenue for public media is beneficial for governments to implement regulation effectively. At this stage, most of the high-polluting enterprises still maintain the original traditional production mode and they just pay attention to pursuit of high profits and ignore the poor quality of their environmental performance, so the active investigation of public media plays an important role in reforming the environmental performance of heavy-polluting firms.
  • The above mentioned equilibrium points of this evolutionary game model demonstrate that government regulatory agency should choose the “strengthened supervision” strategy. The penalty and subsidy from the government positively regulate the environmental performance of manufacturing and greatly promote the lower-carbon production. Moreover, the low subsidy and penalty do not contribute to the equilibrium stability condition. On the contrary, if government regulatory agencies provide the talent technical support and reduce the raw materials for manufacturing companies choosing the “low-carbon production” strategy, companies will adopt the clean production mode and invest more to improve their environmental performance.
This study aims to provide suggestions for government supervision and media investigation of environmental issues for manufacturing firms, especially the regulation for heavy-pollution firms. The implications of this study are derived from practice and theory. In terms of practical implication, the results of numerical simulation tests about the evolutionary game model have demonstrated that government supervision and public media investigation both influence the production strategy of manufacturing firms. Moreover, the sensitivity analysis of parameters penalty and subsidy from the government are taken into account by manufacturing firms when they make the adjustment to their strategy of production mode. Additionally, if the government provides the subsidy and support for public media to investigate the corporate environmental issues, the revenue of investigation will increase and outweigh its cost. Thus, the collaboration of government regulation and media survey will better motivate the manufacturing firms to take the “low-carbon production” strategy. In terms of theoretical implication, this essay drew on evolution game theory to study the interactive effect of government and public media supervision on manufacturing production mode. From the perspective of low-carbon economy, the impact of parameters such as benefits, costs, subsidies, and losses on the three-way evolutionary game was also analyzed. This paper further carried out the sensitivity analysis of each relevant parameter and plotted the distinct path evolution diagrams through the numerical simulation tests. Thus, the equilibrium analysis of the evolutionary game model provides the theoretical foundation for regulating the environmental performance of manufacturing firms and motivating them to adjust the environmental strategy for the sustainable development.
Although this paper investigated the decision-making performance and equilibrium strategies of manufacturing firms, government regulator, and public media, the main parameters including revenue, cost, subsidy, and loss do not cover all the factors that affect the evolution of equilibrium. The other factors such as the region diversity, industrial classification, government implementation, and public recognition need to be further researched. Furthermore, the evolutionary game model of this work only focuses on studying the interactive supervision for manufacturing firms, and companies in other industry sectors can also be used as research objects. In fact, there are significant differences in environmental management mechanisms between state-owned enterprises and private enterprises in China. New research can make the comparison analysis of businesses with different natures. Further study considering more relevant factors will be helpful for government regulators to make a sustainable strategy and improve corporate environmental performance.

Author Contributions

Conceptualization, Data collection, Methodology and Writing Original Draft Preparation, J.X.; Supervision and Funding Acquisition, Y.H.; Editing and Writing Review, P.G.; Data Curation, Y.T.; Data Validation, H.X. All authors have read and agreed to the published version of the manuscript.

Funding

This research was funded by [National Social Science Foundation of China] grant number [16BGL088].

Institutional Review Board Statement

Not applicable.

Informed Consent Statement

Not applicable.

Data Availability Statement

Not applicable.

Conflicts of Interest

The authors declare no conflict of interest.

References

  1. Liu, X.; Fan, Y.; Li, C. Carbon pricing for low carbon technology diffusion: A survey analysis of China’s cement industry. J. Energy 2016, 106, 73–86. [Google Scholar] [CrossRef]
  2. Wang, L.; Zheng, J. Research on low-carbon diffusion considering the game among enterprises in the complex network context. J. Clean. Prod. 2019, 210, 1–11. [Google Scholar] [CrossRef]
  3. Yin, J.; Shi, S. Social interaction and the formation of residents′ low-carbon consumption behaviors: An embeddedness perspective. Resour. Conserv. Recycl. 2021, 164, 105116. [Google Scholar] [CrossRef]
  4. Wu, B.; Liu, P.; Xu, X. An evolutionary analysis of low-carbon strategies based on the government–Enterprise game in the complex network context. J. Clean. Prod. 2017, 141, 168–179. [Google Scholar] [CrossRef]
  5. Zhang, H.; Li, P.; Zheng, H.; Zhang, Y. Impact of carbon tax on enterprise operation and production strategy for low-carbon products in a co-opetition supply chain. J. Clean. Prod. 2021, 287, 125058. [Google Scholar] [CrossRef]
  6. Sun, H.; Wan, Y.; Zhang, L.; Zhou, Z. Evolutionary game of the green investment in a two-echelon supply chain under a government subsidy mechanism. J. Clean. Prod. 2019, 235, 1315–1326. [Google Scholar] [CrossRef]
  7. Li, F.; Cao, X.; Ou, R. A network-based evolutionary analysis of the diffusion of cleaner energy substitution in enterprises: The roles of PEST factors. Energy Policy 2021, 156, 112385. [Google Scholar] [CrossRef]
  8. Ma, J.; Li, P.; Lin, X.; Zhu, W.; Yuan, X. Game theory method for multi-objective optimizing operation in micro-grid. In Proceedings of the 2015 IEEE 12th International Conference on Networking, Sensing and Control, Taipei, Taiwan, 9–11 April 2015; pp. 421–425. [Google Scholar]
  9. Xu, Y.Y.; Qi, L.Q. Research on low carbon technological innovation diffusion in enterprises clusters based on evolutionary game theory on complex networks. J. China Popul. Resour. Environ. 2016, 26, 16–24. [Google Scholar]
  10. Chhipi-Shrestha, G.; Rodriguez, M.; Sadiq, R. Selection of sustainable municipal water reuse applications by multi-stakeholders using game theory. Sci. Total Environ. 2019, 650, 2512–2526. [Google Scholar] [CrossRef]
  11. Jia, S.; Yan, G.; Shen, A.; Zheng, J. Dynamic simulation analysis of a construction and demolition waste management model under penalty and subsidy mechanisms. J. Clean. Prod. 2017, 147, 531–545. [Google Scholar] [CrossRef]
  12. Chang, S.; Qin, W.; Wang, X. Dynamic optimal strategies in trans boundary pollution game under learning by doing. J. Phys. A 2018, 490, 139–147. [Google Scholar]
  13. Ghaffar, S.H.; Burman, M.; Braimah, N. Pathways to circular construction: An integrated management of construction and demolition waste for resource recovery. J. Clean. Prod. 2020, 244, 118710. [Google Scholar] [CrossRef]
  14. Zhu, Y.Y.; Zhong, Y.G.; Liu, C.; Zhang, L.M. Simulation analysis of evolutionary behavior of construction waste resource utilization under the treatment fund. J. Qingdao Univ. (Nat. Sci. Ed.) 2019, 32, 69–76. [Google Scholar]
  15. Vanclay, J.K.; Shortiss, J.; Aulsebrook, S.; Gillespie, A.M.; Howell, B.C.; Johanni, R.; Maher, M.J.; Mitchell, K.M.; Stewart, M.D.; Yates, J. Customer Response to Carbon Labelling of Groceries. J. Consum. Policy 2011, 34, 153–160. [Google Scholar] [CrossRef]
  16. Lee, S.-H.; Park, C.-H. Environmental regulations in private and mixed duopolies: Taxes on emissions versus green R&D subsidies. Econ. Syst. 2021, 45, 100852. [Google Scholar] [CrossRef]
  17. Li, A.; Zhang, Z.; Zhang, A. Why are there large differences in performances when the same carbon emission reductions are achieved in different countries? J. Clean. Prod. 2015, 103, 309–318. [Google Scholar] [CrossRef]
  18. Chew, I.L.M.; Tan, R.R.; Chwan, D.; Foo, Y.; Shun, A.; Chiu, F. Game theory approach to the analysis of inter-plant water integration in an eco-industrial park. J. Clean. Prod. 2009, 17, 1611–1619. [Google Scholar] [CrossRef]
  19. Palafox-Alcantar, P.; Hunt, D.; Rogers, C. The complementary use of game theory for the circular economy: A review of waste management decision-making methods in civil engineering. Waste Manag. 2020, 102, 598–612. [Google Scholar] [CrossRef]
  20. Wang, Z.; Wang, Q.X.; Chen, B.X.; Wang, Y. Evolutionary game analysis on behavioral strategies of multiple stakeholders in E-waste recycling industry. Resour. Conserv. Recycl. 2020, 155, 104618. [Google Scholar] [CrossRef]
  21. Zhang, L.; Xue, L.; Zhou, Y. How do low-carbon policies promote green diffusion among alliance-based firms in China? An evolutionary-game model of complex networks. J. Clean. Prod. 2019, 210, 518–529. [Google Scholar] [CrossRef]
  22. Xue, J.; He, Y.; Liu, M.; Tang, Y.; Xu, H. Incentives for Corporate Environmental Information Disclosure in China: Public Media Pressure, Local Government Supervision and Interactive Effects. Sustainability 2021, 13, 10016. [Google Scholar] [CrossRef]
  23. Xu, J.Z.; Xu, Y.Y. Study on low-carbon technology adoption among manufacturers based on evolutionary game theory. J. Oper. Res. Manag. Sci. 2014, 23, 264–272. [Google Scholar]
  24. Su, Y. Muti-agent evolutionary game in the recycling utilization of construction waste. Sci. Total Environ. 2020, 738, 139826. [Google Scholar] [CrossRef] [PubMed]
  25. Shi, Y.; Wei, Z.; Shahbaz, M.; Zeng, Y. Exploring the dynamics of low-carbon technology diffusion among enterprises: An evolutionary game model on a two-level heterogeneous social network. Energy Econ. 2021, 101, 105399. [Google Scholar] [CrossRef]
  26. Kong, D.; Feng, Q.; Zhou, Y.; Xue, L. Local implementation for green-manufacturing technology diffusion policy in China: From the user firms’ perspectives. J. Clean. Prod. 2016, 129, 113–124. [Google Scholar] [CrossRef]
  27. Lu, W.; Chi, B.; Bao, Z.; Zetkulic, A. Evaluating the effects of green building on construction waste management: A comparative study of three green building rating systems. Build. Environ. 2019, 155, 247–256. [Google Scholar] [CrossRef]
  28. Friedman, D. Evolutionary games in economics. J. Econom. 1991, 59, 637–666. [Google Scholar] [CrossRef] [Green Version]
  29. Romero-Gomez, P.; Choi, C.Y.; Woods, G.; Kang, D. A game theory approach for decentralization of reclaimed water systems. In Water Distribution Systems Analysis; American Society of Civil Engineers: Tucson, AZ, USA, 2012; pp. 833–842. [Google Scholar]
  30. Khan, Z.; Ali, S.; Dong, K.; Li, R.Y.M. How does fiscal decentralization affect CO2 emissions? The roles of institutions and human capital. Energy Econ. 2021, 94, 105060. [Google Scholar] [CrossRef]
  31. Weinstein, M.I. Lyapunov stability of ground states of nonlinear dispersive evolution equations. J. Commun. Pure Appl. Math. 2010, 39, 51–67. [Google Scholar] [CrossRef]
  32. Madani, K. Game theory and water resources. J. Hydrol. 2010, 381, 225–238. [Google Scholar] [CrossRef]
  33. Nash, J. Non-cooperative games. Ann. Math. 1951, 54, 286–295. [Google Scholar] [CrossRef]
Figure 1. Evolution path diagram of stable point E3 (0,1,0).
Sustainability 14 05587 g001
Figure 2. Evolution path diagram of stable point E4 (0,1,1).
Sustainability 14 05587 g002
Figure 3. Evolution path diagram of stable point E8 (1,1,1).
Sustainability 14 05587 g003
Figure 4. Evolution path diagram of stable point E7 (1,1,0).
Sustainability 14 05587 g004
Figure 5. Transfer from E4 (0,1,1) to E8 (1,1,1) by changing the values of R1.
Sustainability 14 05587 g005
Figure 6. Transfer from E7 (1,1,0) to E3 (0,1,0) by changing the values of R2.
Sustainability 14 05587 g006
Figure 7. Transfer from E4 (0,1,1) to E8 (1,1,1) by changing the values of F1.
Sustainability 14 05587 g007
Figure 8. Transfer from E4 (0,1,1) to E8 (1,1,1) by changing the values of F2.
Sustainability 14 05587 g008
Figure 9. Transfer from E3 (0,1,0) to E4 (0,1,1) by changing the values of S2.
Sustainability 14 05587 g009
Figure 10. Transfer from E7 (1,1,0) to E8 (1,1,1) by changing the values of S1.
Sustainability 14 05587 g010
Figure 11. Transfer from E4 (0,1,1) to E8 (1,1,1) by changing the values of C1.
Sustainability 14 05587 g011
Figure 12. Transfer from E3 (0,1,0) to E4 (0,1,1) by changing the values of C2.
Sustainability 14 05587 g012
Figure 13. Transfer from E4 (0,1,1) to E3 (0,1,0) by changing the values of C4.
Sustainability 14 05587 g013
Figure 14. Transfer from E8 (1,1,1) to E7 (1,1,0) by changing the values of C3.
Sustainability 14 05587 g014
Figure 15. Transfer from E8 (1,1,1) to E4 (0,1,1) by changing the values of G.
Sustainability 14 05587 g015
Figure 16. Transfer from E8 (1,1,1) to E4 (0,1,1) by changing the values of H.
Sustainability 14 05587 g016
Figure 17. Transfer from E3 (0,1,0) to E4 (0,1,1) by changing the values of M.
Sustainability 14 05587 g017
Figure 18. The phase diagram of equilibrium points.
Sustainability 14 05587 g018
Table 1. Description of major symbols.
SymbolsDefinitions
R1If the corporate adopts the lower carbon production, the total revenue is R1.
R2If the high-polluting company adopt the high-polluting production, the total revenue is R2.
C1If the company adopts the lower carbon production, the total expense is C1.
C2If the company adopts high-polluting production, the total expense is C2. (C1 > C2)
F1If the government department implements a strengthened supervision strategy, the government’s subsidy to low-carbon production enterprises is F1.
F2If the public media actively investigate the lower-production corporate, the subsidy of the enterprise is F2.
GIf the government department implements a strong supervision strategy, the punishment for high-polluting enterprises is G.
HIf the public media takes the active investigation, the governance cost of high-polluting enterprises is H.
WIf the government take the strengthened supervision, the potential revenue of the strengthened government supervision is W.
E1If the companies accept the lower carbon production and the public media takes the active investigation, the potential revenue of government is E1.
E2If the companies accept the lower carbon production and the public media takes the inactive investigation, the potential revenue of government is E2.
L1If enterprises still adopt high-polluting production strategy and the public media takes the active investigation, the potential loss of weakened government supervision is L1.
L2If enterprises still adopt highly polluting production strategy and the public media takes the inactive investigation, the potential loss of weakened government supervision is L2.
S1If the public media takes the active investigation of enterprises with lower carbon production, the revenue of public media is S1.
S2If the public media takes the active investigation of enterprises with high-polluting production, the revenue of public media is S2.
C3If the public media takes the active investigation of enterprises with lower carbon production, the cost of public media is C3.
C4If the public media takes the active investigation of enterprises with high-polluting production, the cost of public media is C4.
MIf the government takes the strengthened supervision of high-polluting company and the public media takes the inactive investigation, the punishment of public media is M.
Table 2. Payoff matrix of tripartite evolutionary game model.
StrategyManufacturing Enterprise
x , 1 x
Government Regulator
y , 1 y
Public Media
z , 1 z
(low-carbon production, strengthened supervision, active investigation) R 1 C 1 + F 1 + F 2 W + E 1 S 1 C 3
(low-carbon production, strengthened supervision, inactive investigation) R 1 C 1 + F 1 W + E 2 0
(low-carbon production, weakened supervision, active investigation) R 1 C 1 + F 2 0 S 1 C 3
(low-carbon production, weakened supervision, inactive investigation) R 1 C 1 0 0
(high-polluting production, strengthened supervision, active investigation) R 2 C 2 G H W S 2 C 4
(high-polluting production, strengthened supervision, inactive investigation) R 2 C 2 G W M
(high-polluting production, weakened supervision, active investigation) R 2 C 2 H L 1 S 2 C 4
(high-polluting production, weakened supervision, inactive investigation) R 2 C 2 L 2 0
Table 3. Stability analysis of equilibrium point.
Equilibrium PointEigenvaluesEvaluation of EigenvaluesStability of Equilibrium Point
E 1 0 , 0 , 0 C 2 C 1 + R 1 R 2 pendingunstable
L 2 + W > 0
S 2 C 4 pending
E 2 0 , 0 , 1 C 2 C 1 + R 1 R 2 + F 1 + H pendingunstable
L 1 + W > 0
C 4 S 2 pending
E 3 0 , 1 , 0 C 2 C 1 + R 1 R 2 + F 1 + G pendinglikely to be stable
L 2 W < 0
S 2 C 4 + M pending
E 4 0 , 1 , 1 C 2 C 1 + R 1 R 2 + F 1 + F 2 + G + H pendinglikely to be stable
L 1 W < 0
C 4 S 2 M pending
E 5 1 , 0 , 0 C 1 C 2 + R 2 R 1 pendingunstable
E 2 + W > 0
S 1 C 3 pending
E 6 1 , 0 , 1 C 1 C 2 + R 2 R 1 F 1 H pendingunstable
E 1 + W > 0
C 3 S 1 pending
E 7 1 , 1 , 0 C 1 C 2 + R 2 R 1 F 1 G pendinglikely to be stable
E 2 W < 0
S 1 C 3 pending
E 8 1 , 1 , 1 C 1 C 2 + R 2 R 1 F 1 F 2 G H pendinglikely to be stable
E 1 W < 0
C 3 S 1 pending
E 9 E 13 eigenvalues with different valencesaddle point
Table 4. The summary of equilibrium variation.
The Change of Stability ConditionVariation of Key ParametersThe Change of Stability ConditionVariation of Key Parameters
E 3 0 , 1 , 0 E 4 0 , 1 , 1 S2: 10 18 E 4 0 , 1 , 1 E 8 1 , 1 , 1 R1: 39 45
C1: 36 30
M: 9 15F1: 6 12
F2: 2 5
E 4 0 , 1 , 1 E 3 0 , 1 , 0 C4: 19 25 E 8 1 , 1 , 1 E 4 0 , 1 , 1 G:18 10
H: 12 3
E 8 1 , 1 , 1 E 7 1 , 1 , 0 C3: 15 25 E 7 1 , 1 , 0 E 3 0 , 1 , 0 R2: 21 28
E 7 1 , 1 , 0 E 7 1 , 1 , 1 S1: 16 30 E 3 0 , 1 , 0 E 7 1 , 1 , 0 C2: 9 15
Publisher’s Note: MDPI stays neutral with regard to jurisdictional claims in published maps and institutional affiliations.