
Public Research and Development Funding for Renewable Energy Technologies in Europe: A Cross-Country Analysis


Abstract
:1. Introduction
- What was the extent of European public research and development funding for RE technologies in 2000–2020 across EU countries?
- Within public RE R&D support, what was the importance of the European Commission’s funding relative to national budgets in 2000–2020?
- Has recent European public research and development funding generally been effective as a driver of knowledge and innovation in RE technologies?
2. Materials and Methods
2.1. Public Research and Development Funding
2.2. Private Research and Development Funding
2.3. Patents in Renewable Energy Technologies
2.4. Additional Covariates
2.5. Econometric Approach
3. Results
3.1. National Funding
3.2. European Commission Funding
3.3. Total Public Funding
3.4. The Effectiveness of Public R&D Funding
4. Discussion
4.1. Limitations of the Study
4.2. Policy Recommendations
5. Conclusions
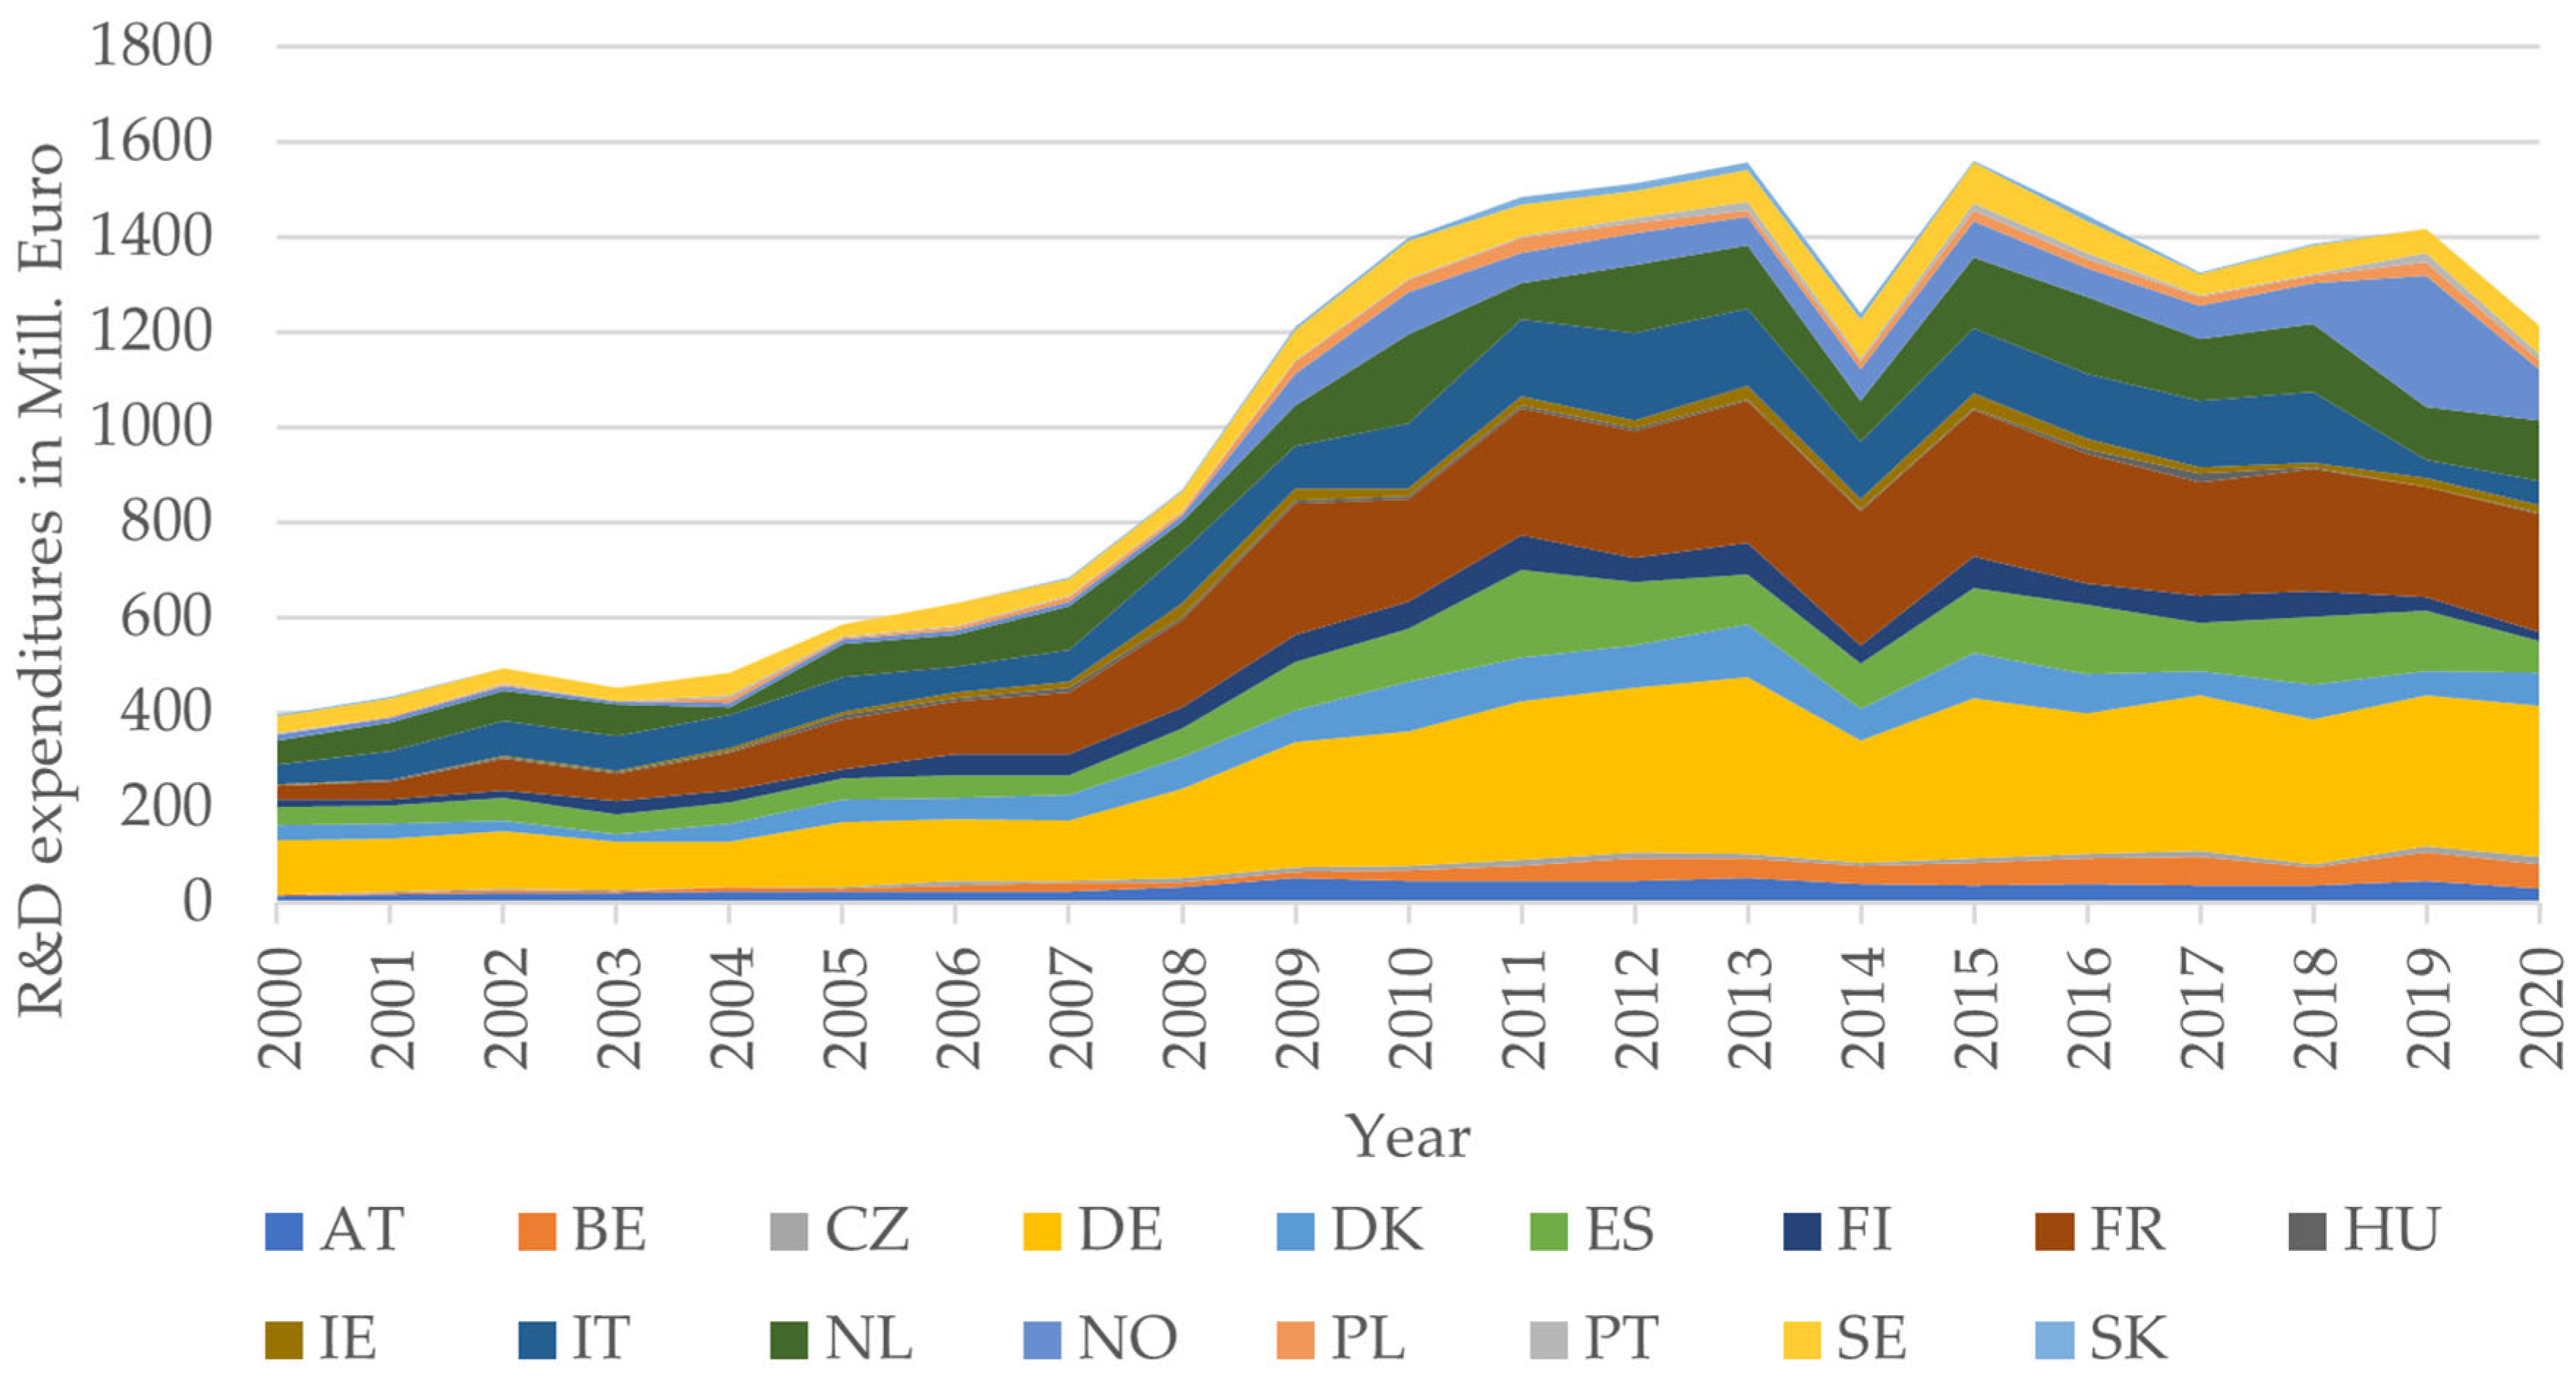
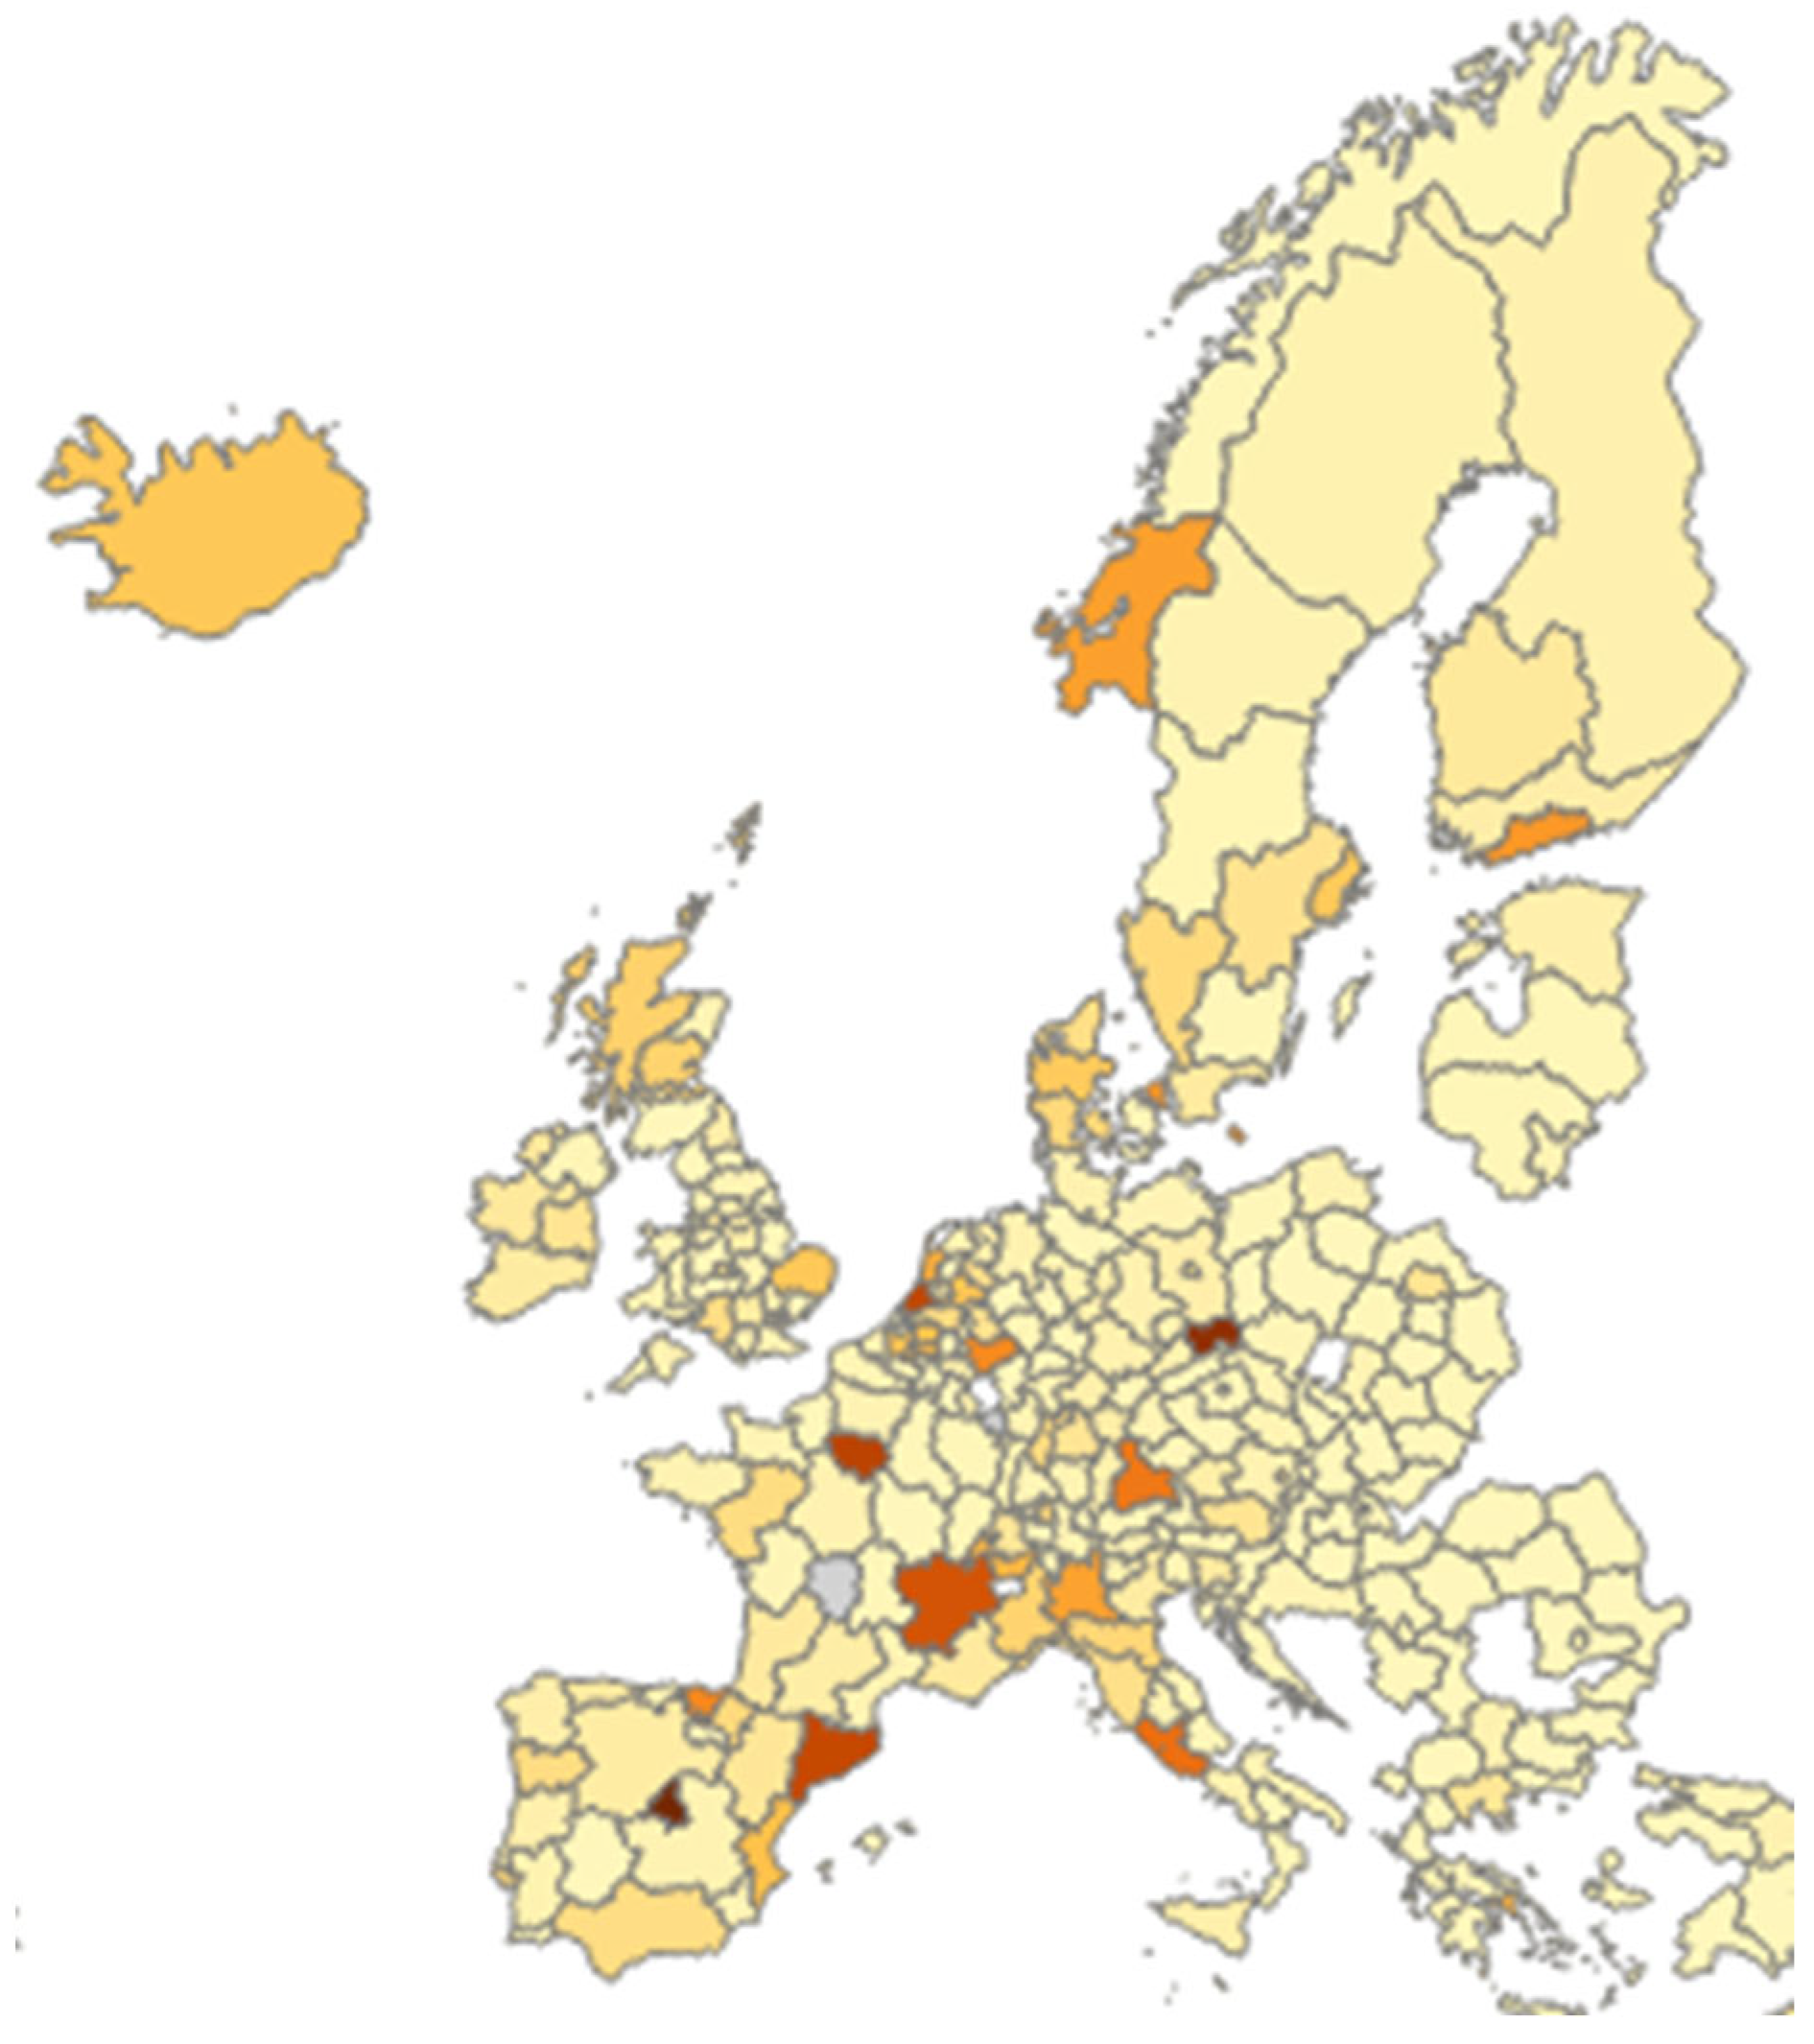
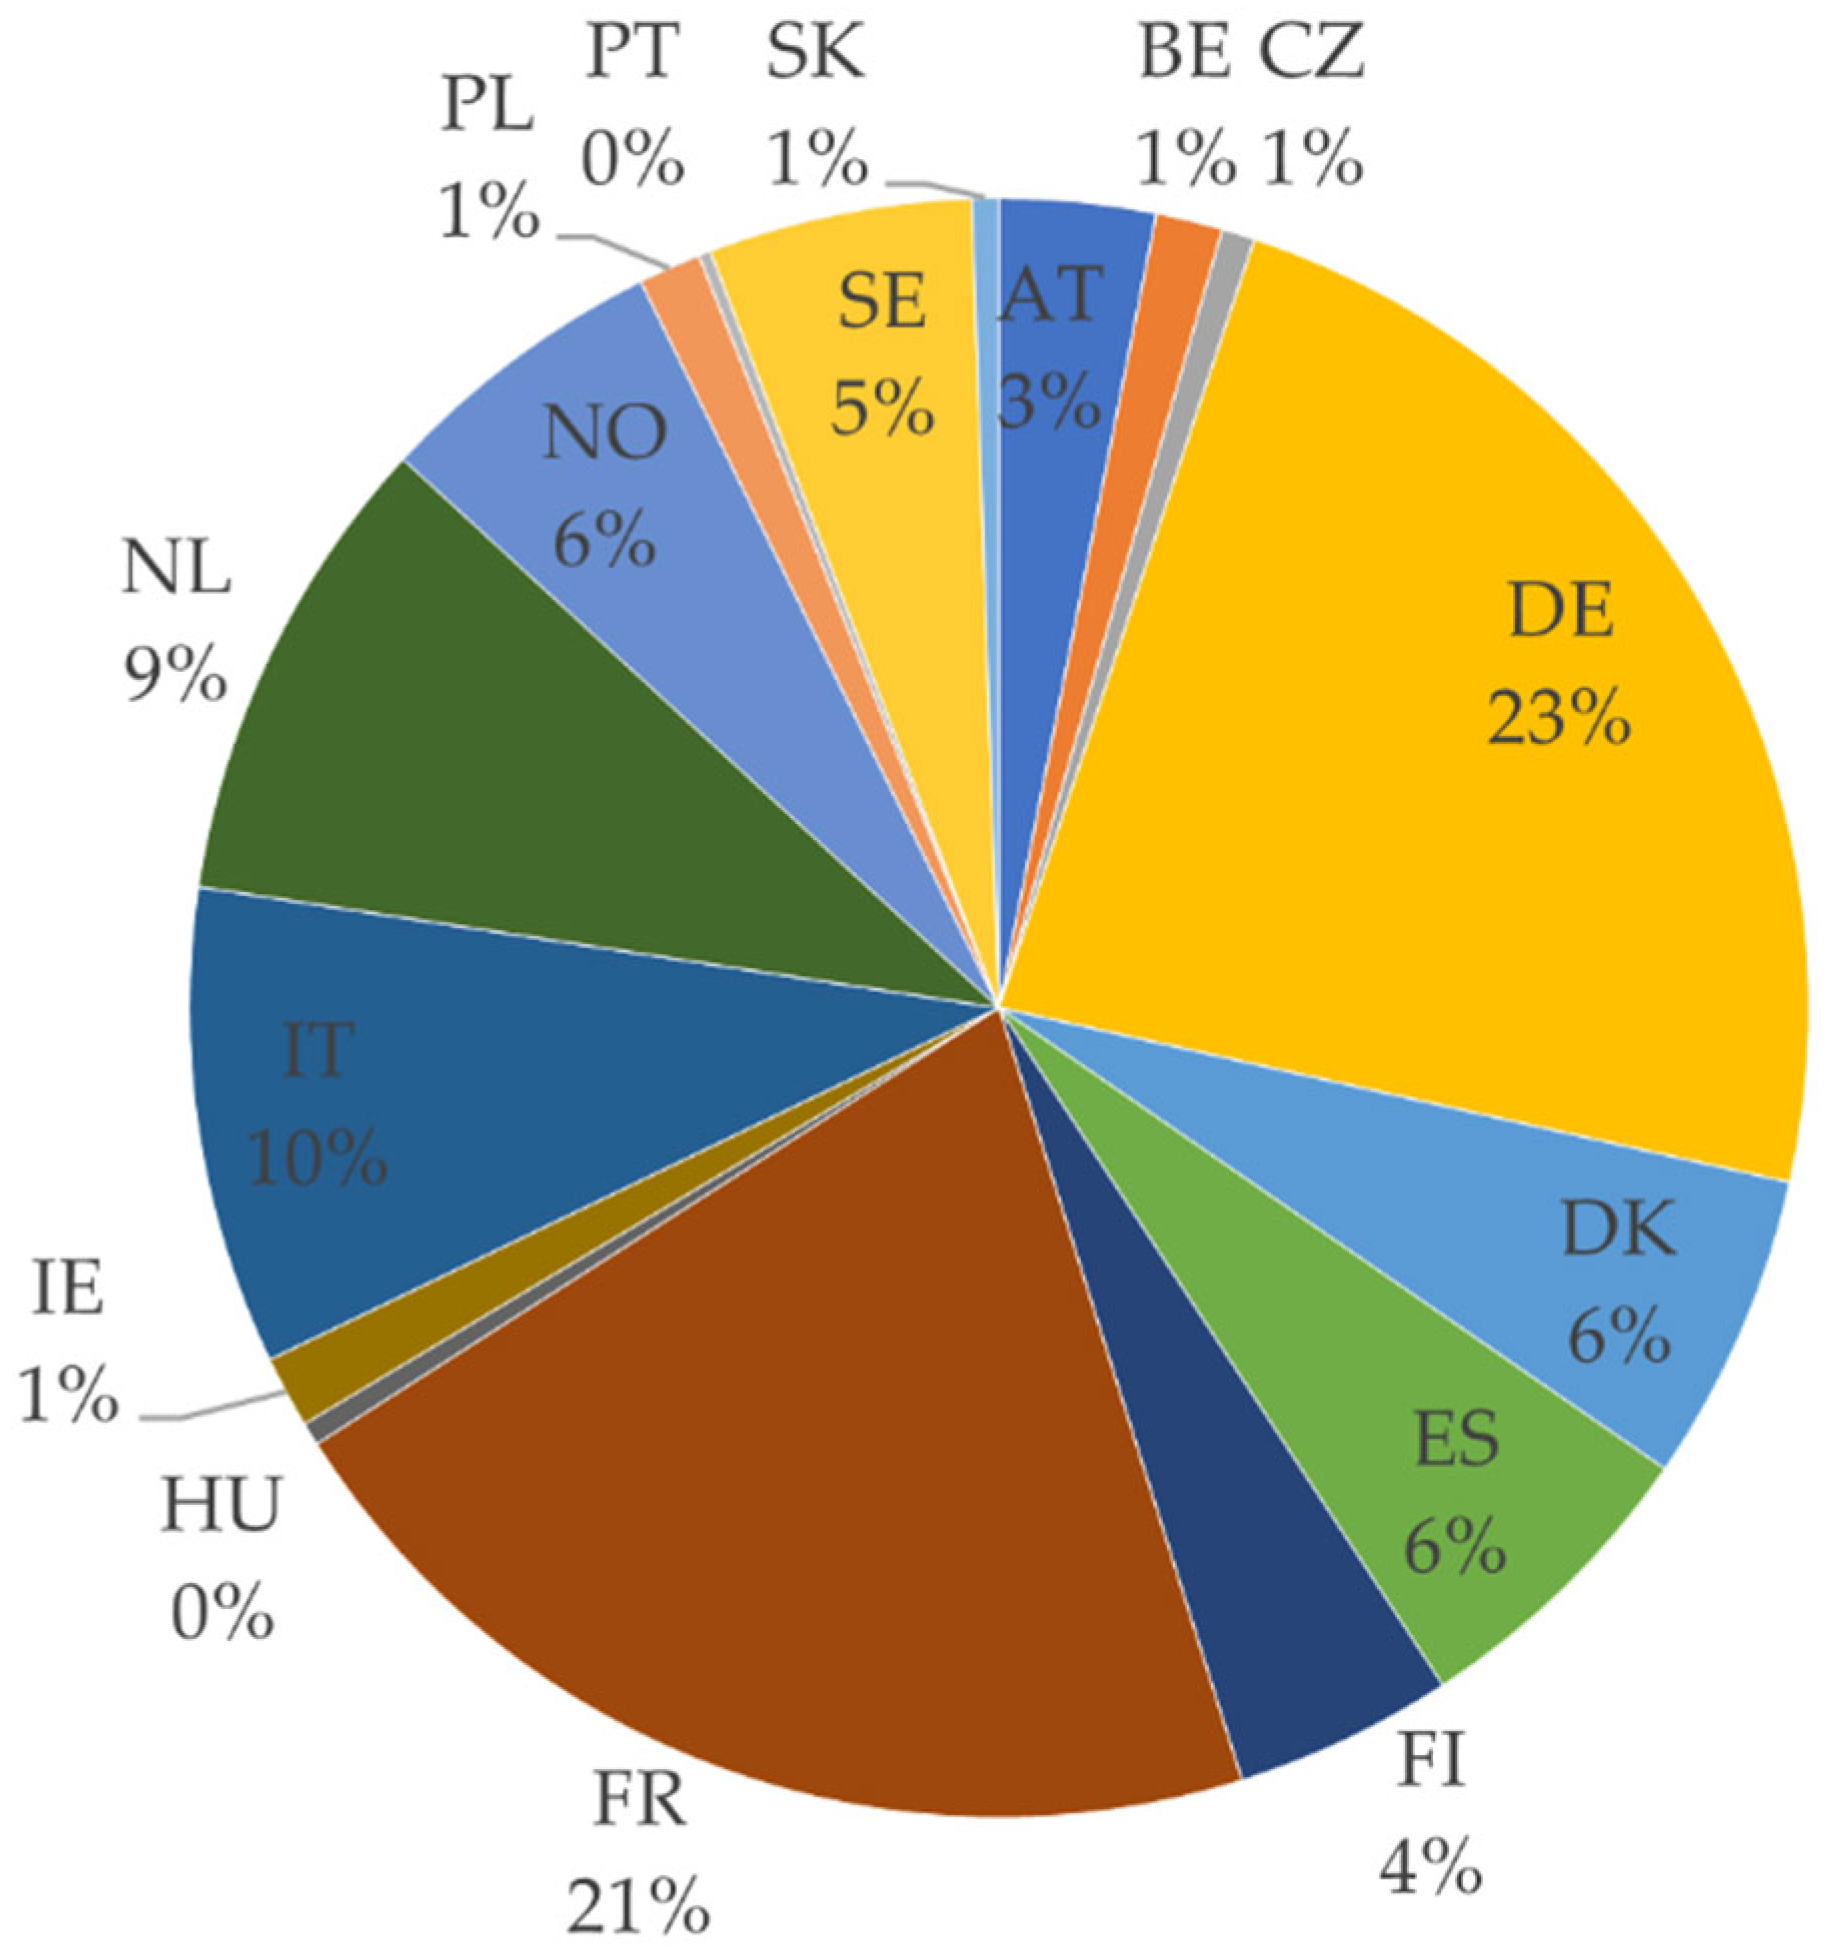
- What was the size of European public research and development funding for RE technologies in 2000–2020 across countries? Concerning this first research question, yearly averages for public R&D funding for RE technologies have been the highest in the largest economies (DE, FR). Nordic countries lead when the sizes of the economies are taken into account. Regarding changes over time, all countries experienced an increase in both national and EC’s public R&D funding until 2011, driven, among others, by ambitious legislation such as the legally binding Renewable Energy Directive 2009/28/EC. From 2012 onwards, in most countries, total public RE R&D support remained relatively stable since 2012. Thereby, a strong increase in EC contributions coincided with and compensated for decreasing national budgets. Hence, this research highlights the vital role of EC expenditures in stabilizing total public R&D support for renewable energy technologies. While relatively stable for most countries, in Norway, the Netherlands, Belgium and Portugal, total available public R&D funding for RE technologies even increased after 2012. However, none of the countries could double available public R&D support between 2015 and 2020, despite their commitment to the MI initiative. The EC’s very recent R&D funding that targeted RE technologies and that was issued through the Horizon 2020 (2014–2020) funding program did not vary strongly across most NUTS 2 regions, although economically strong regions profited significantly more than others.
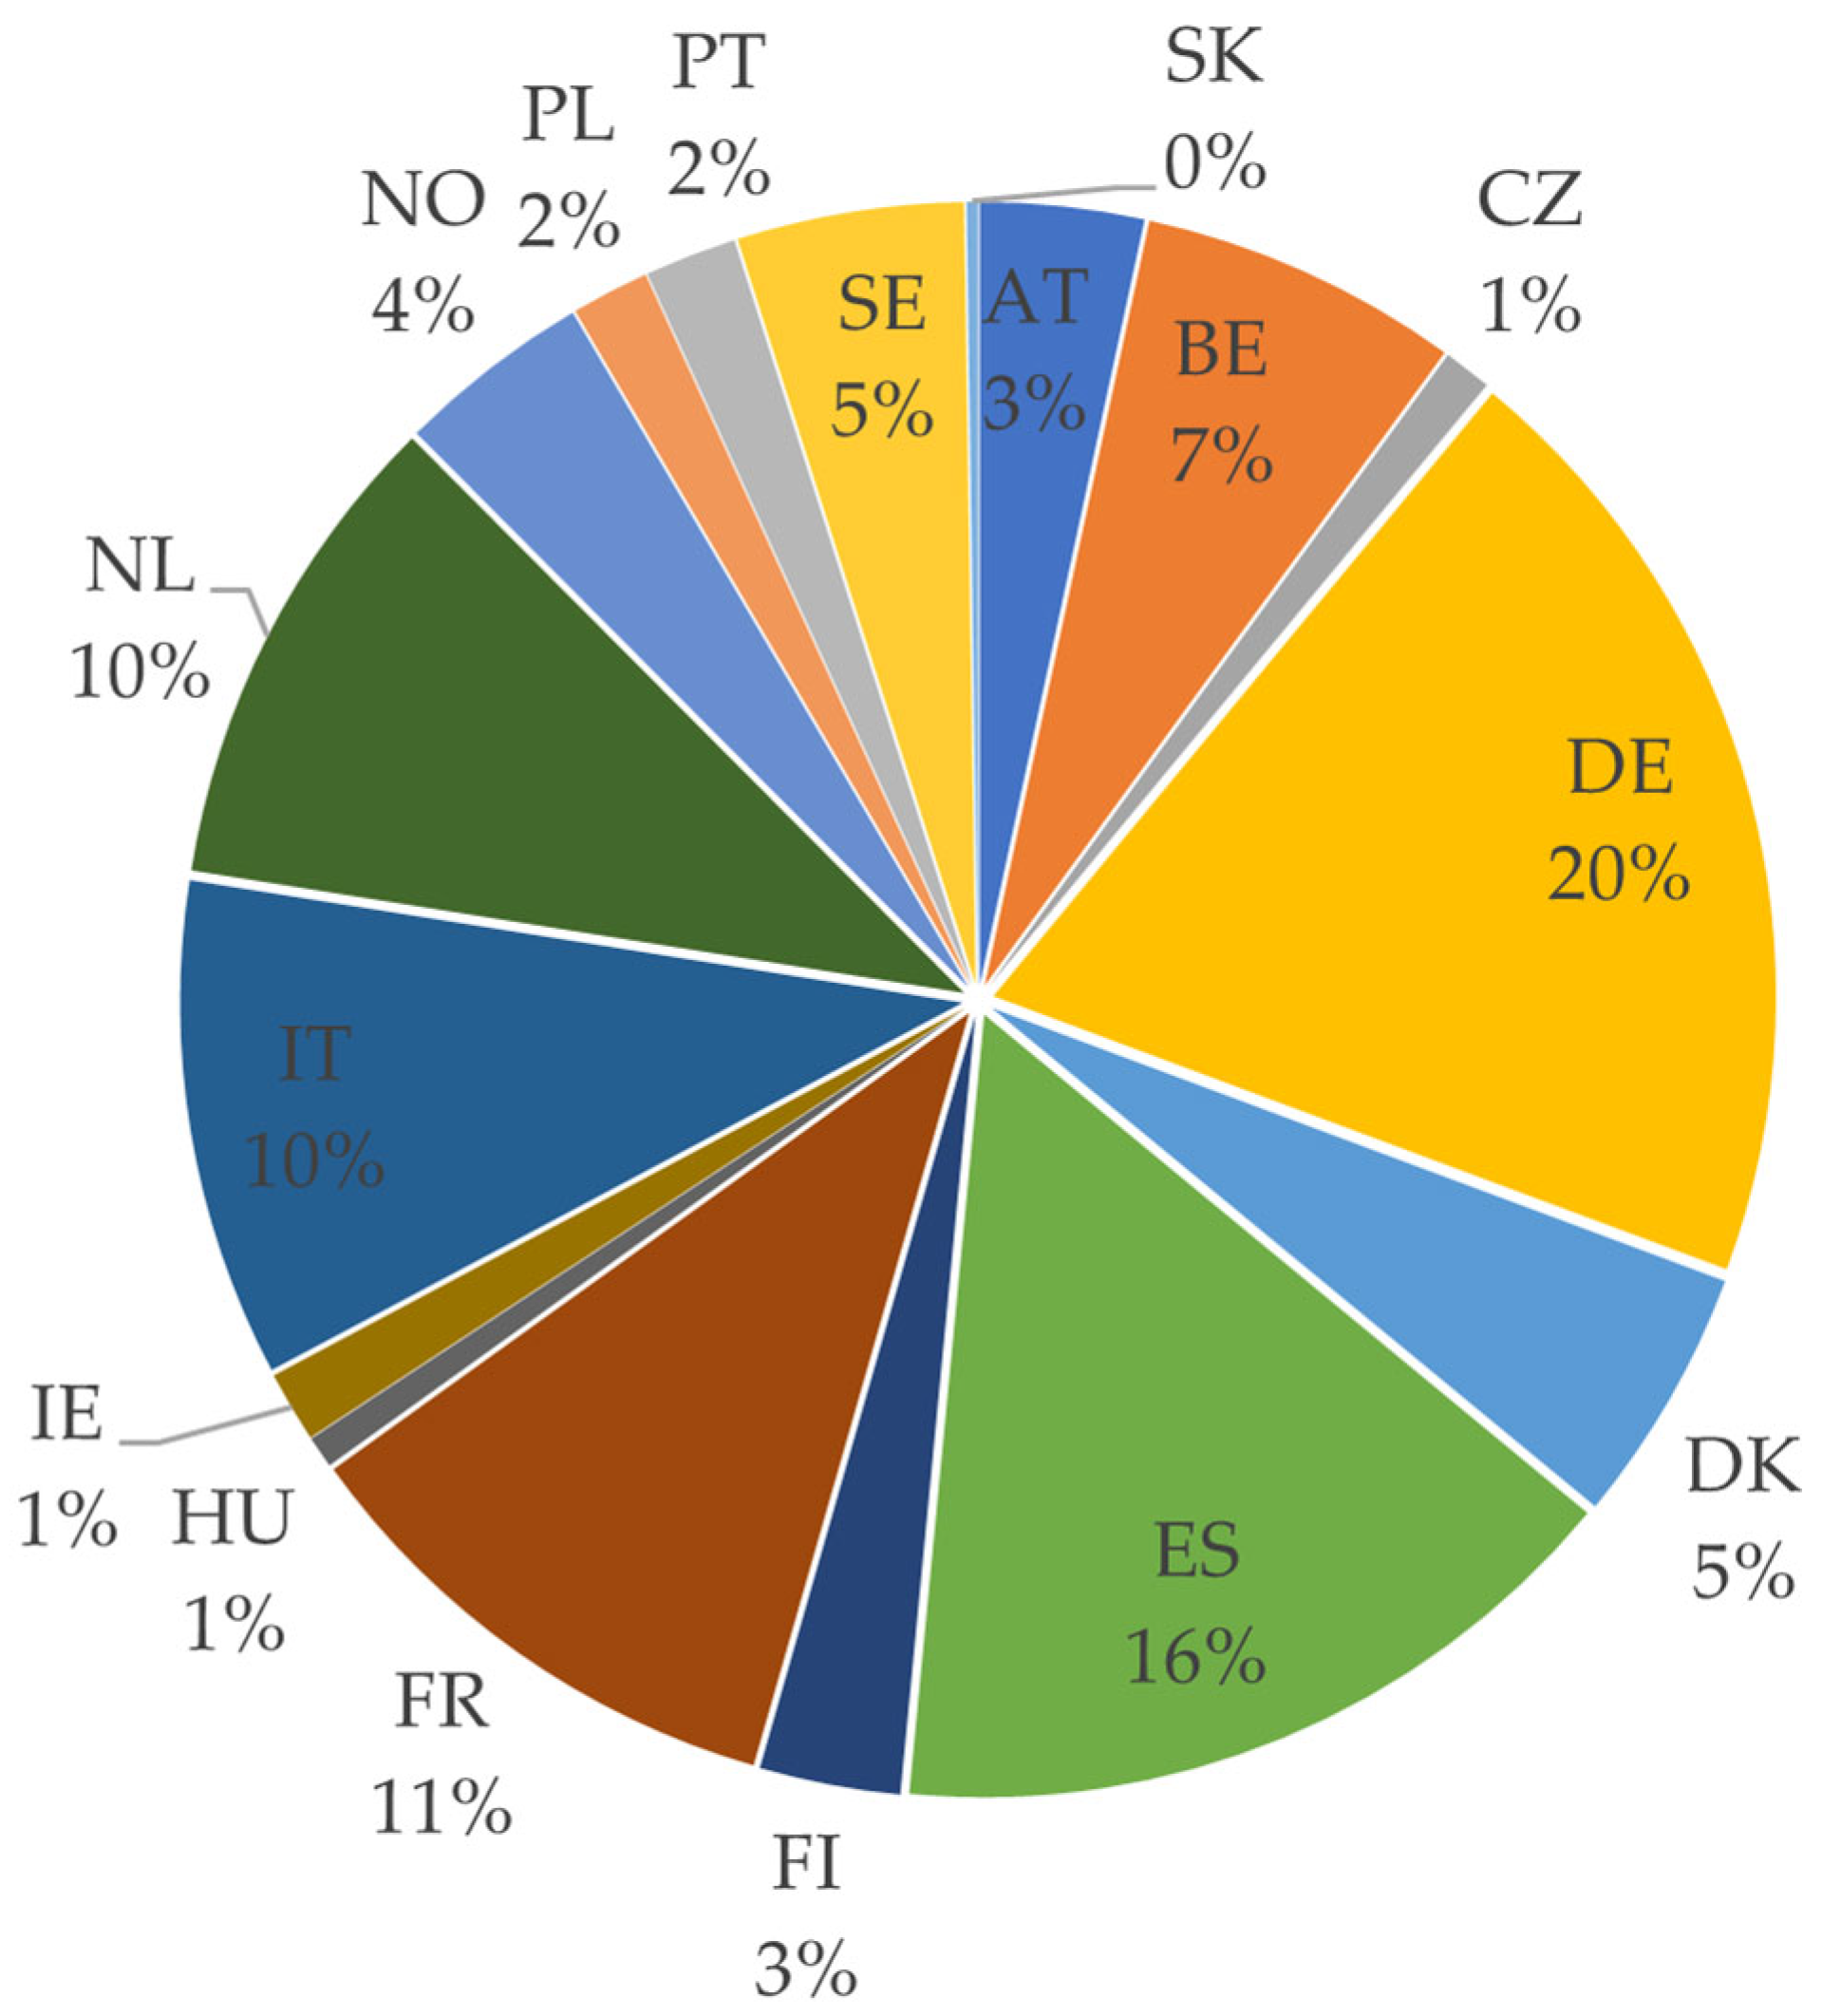
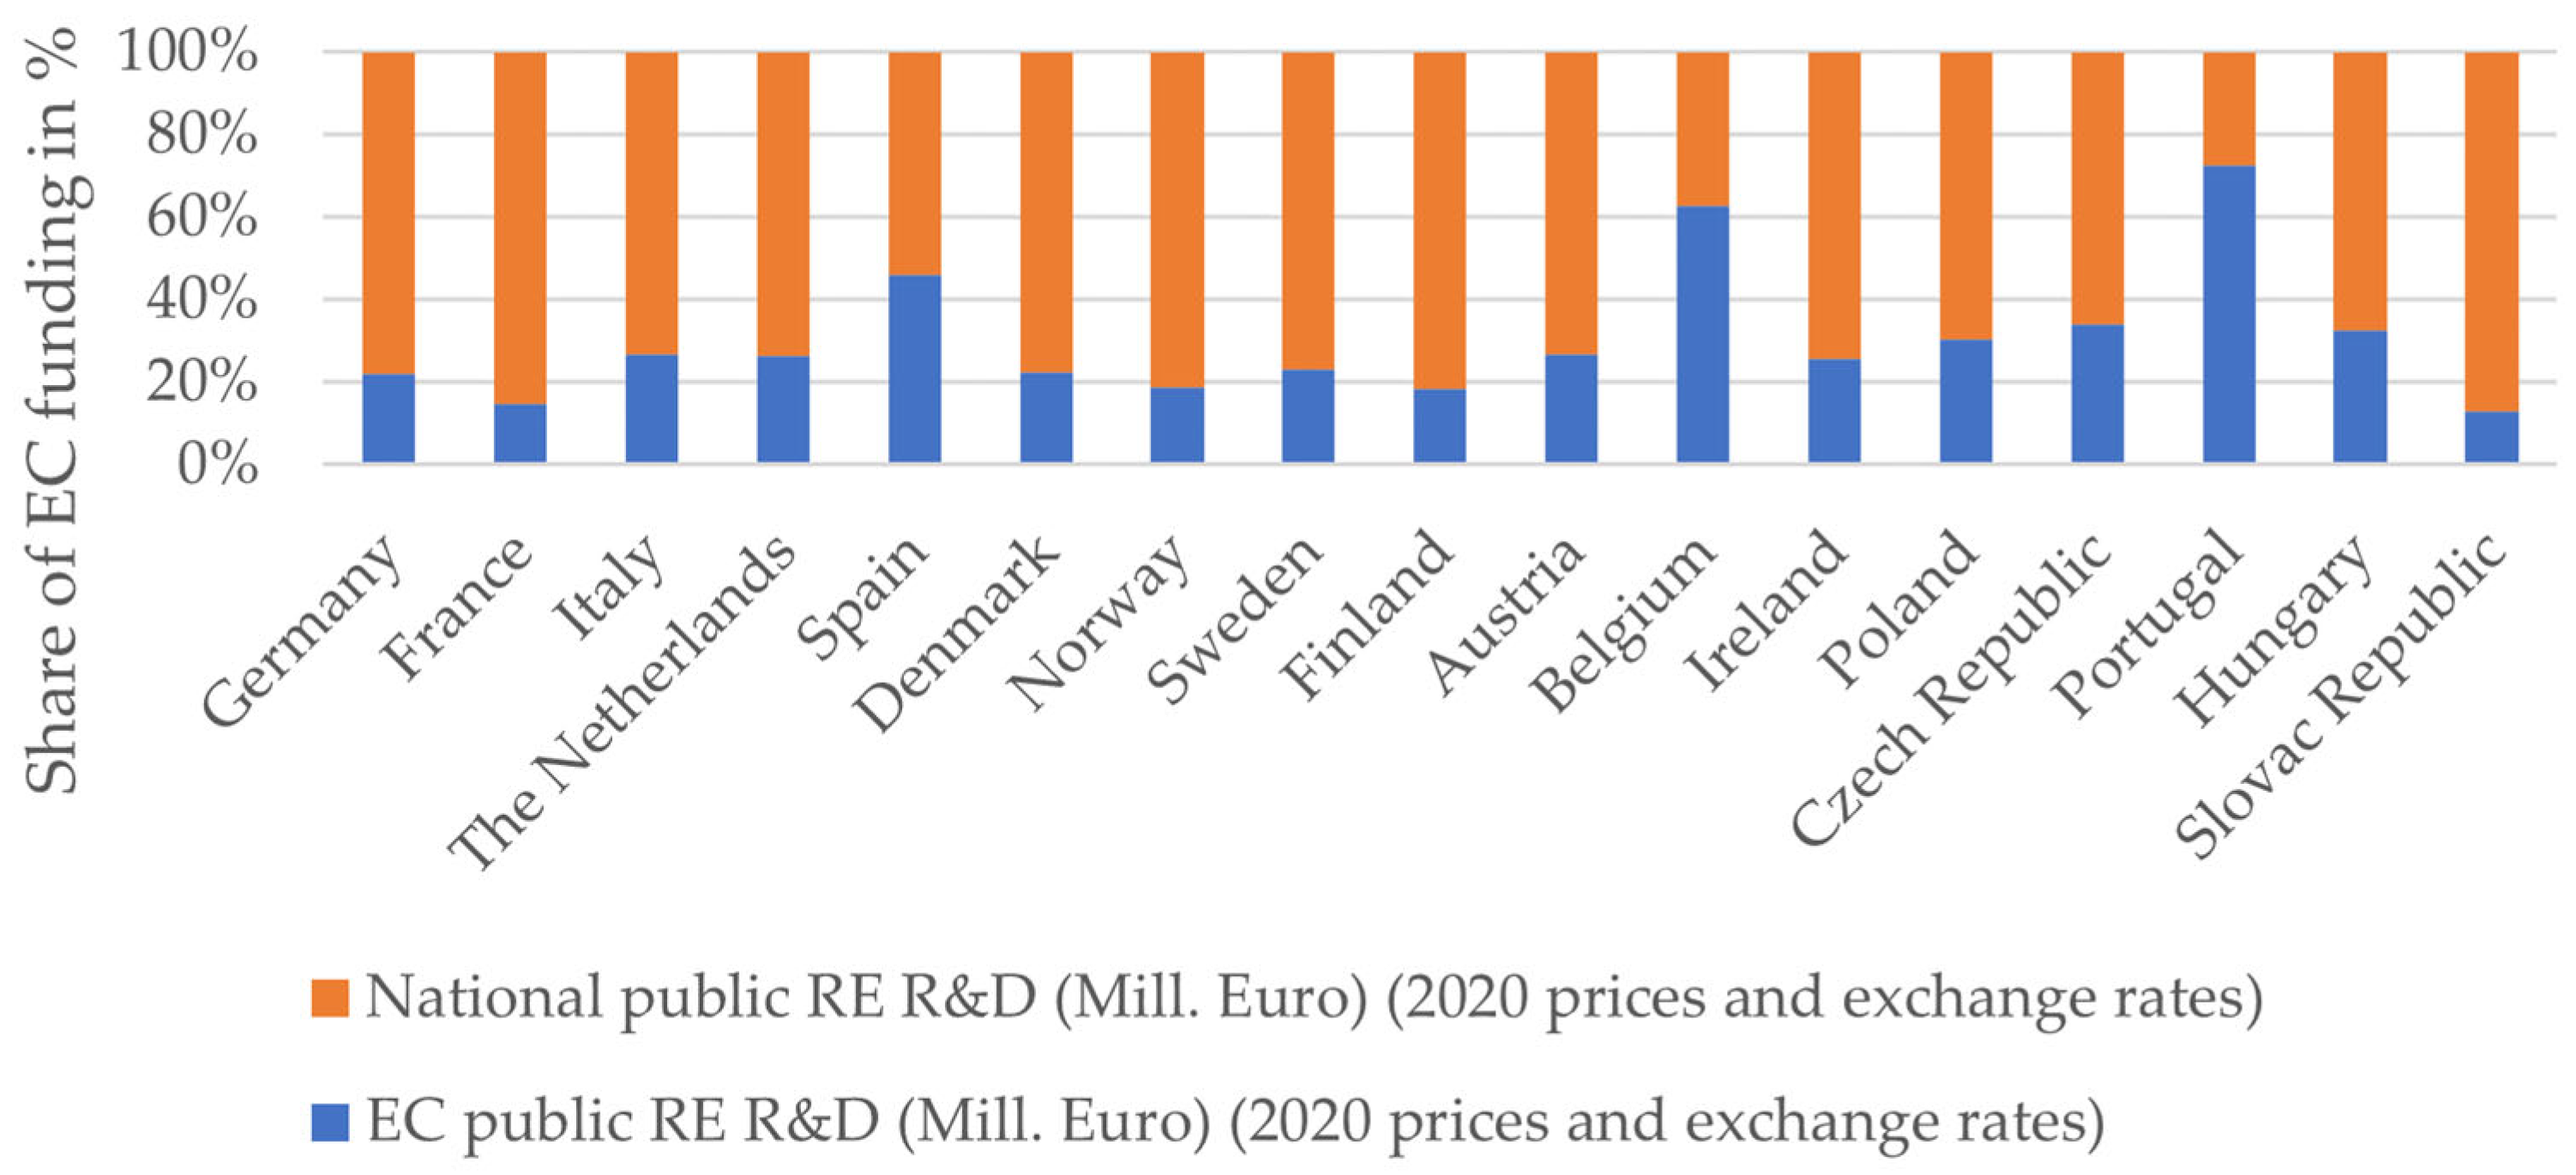
- Within public RE R&D support, what was the importance of the European Commission’s funding relative to national budgets in 2000–2020 across countries? This research sheds light on the vast heterogeneity of the relative importance of EC contributions (as shares of total public R&D funding for renewable energy technologies): Belgium received 63% and Spain 46% of their total public R&D support for renewable energy technologies from the European Commission. In contrast, France received only 15% and Finland only 18% from the EC.
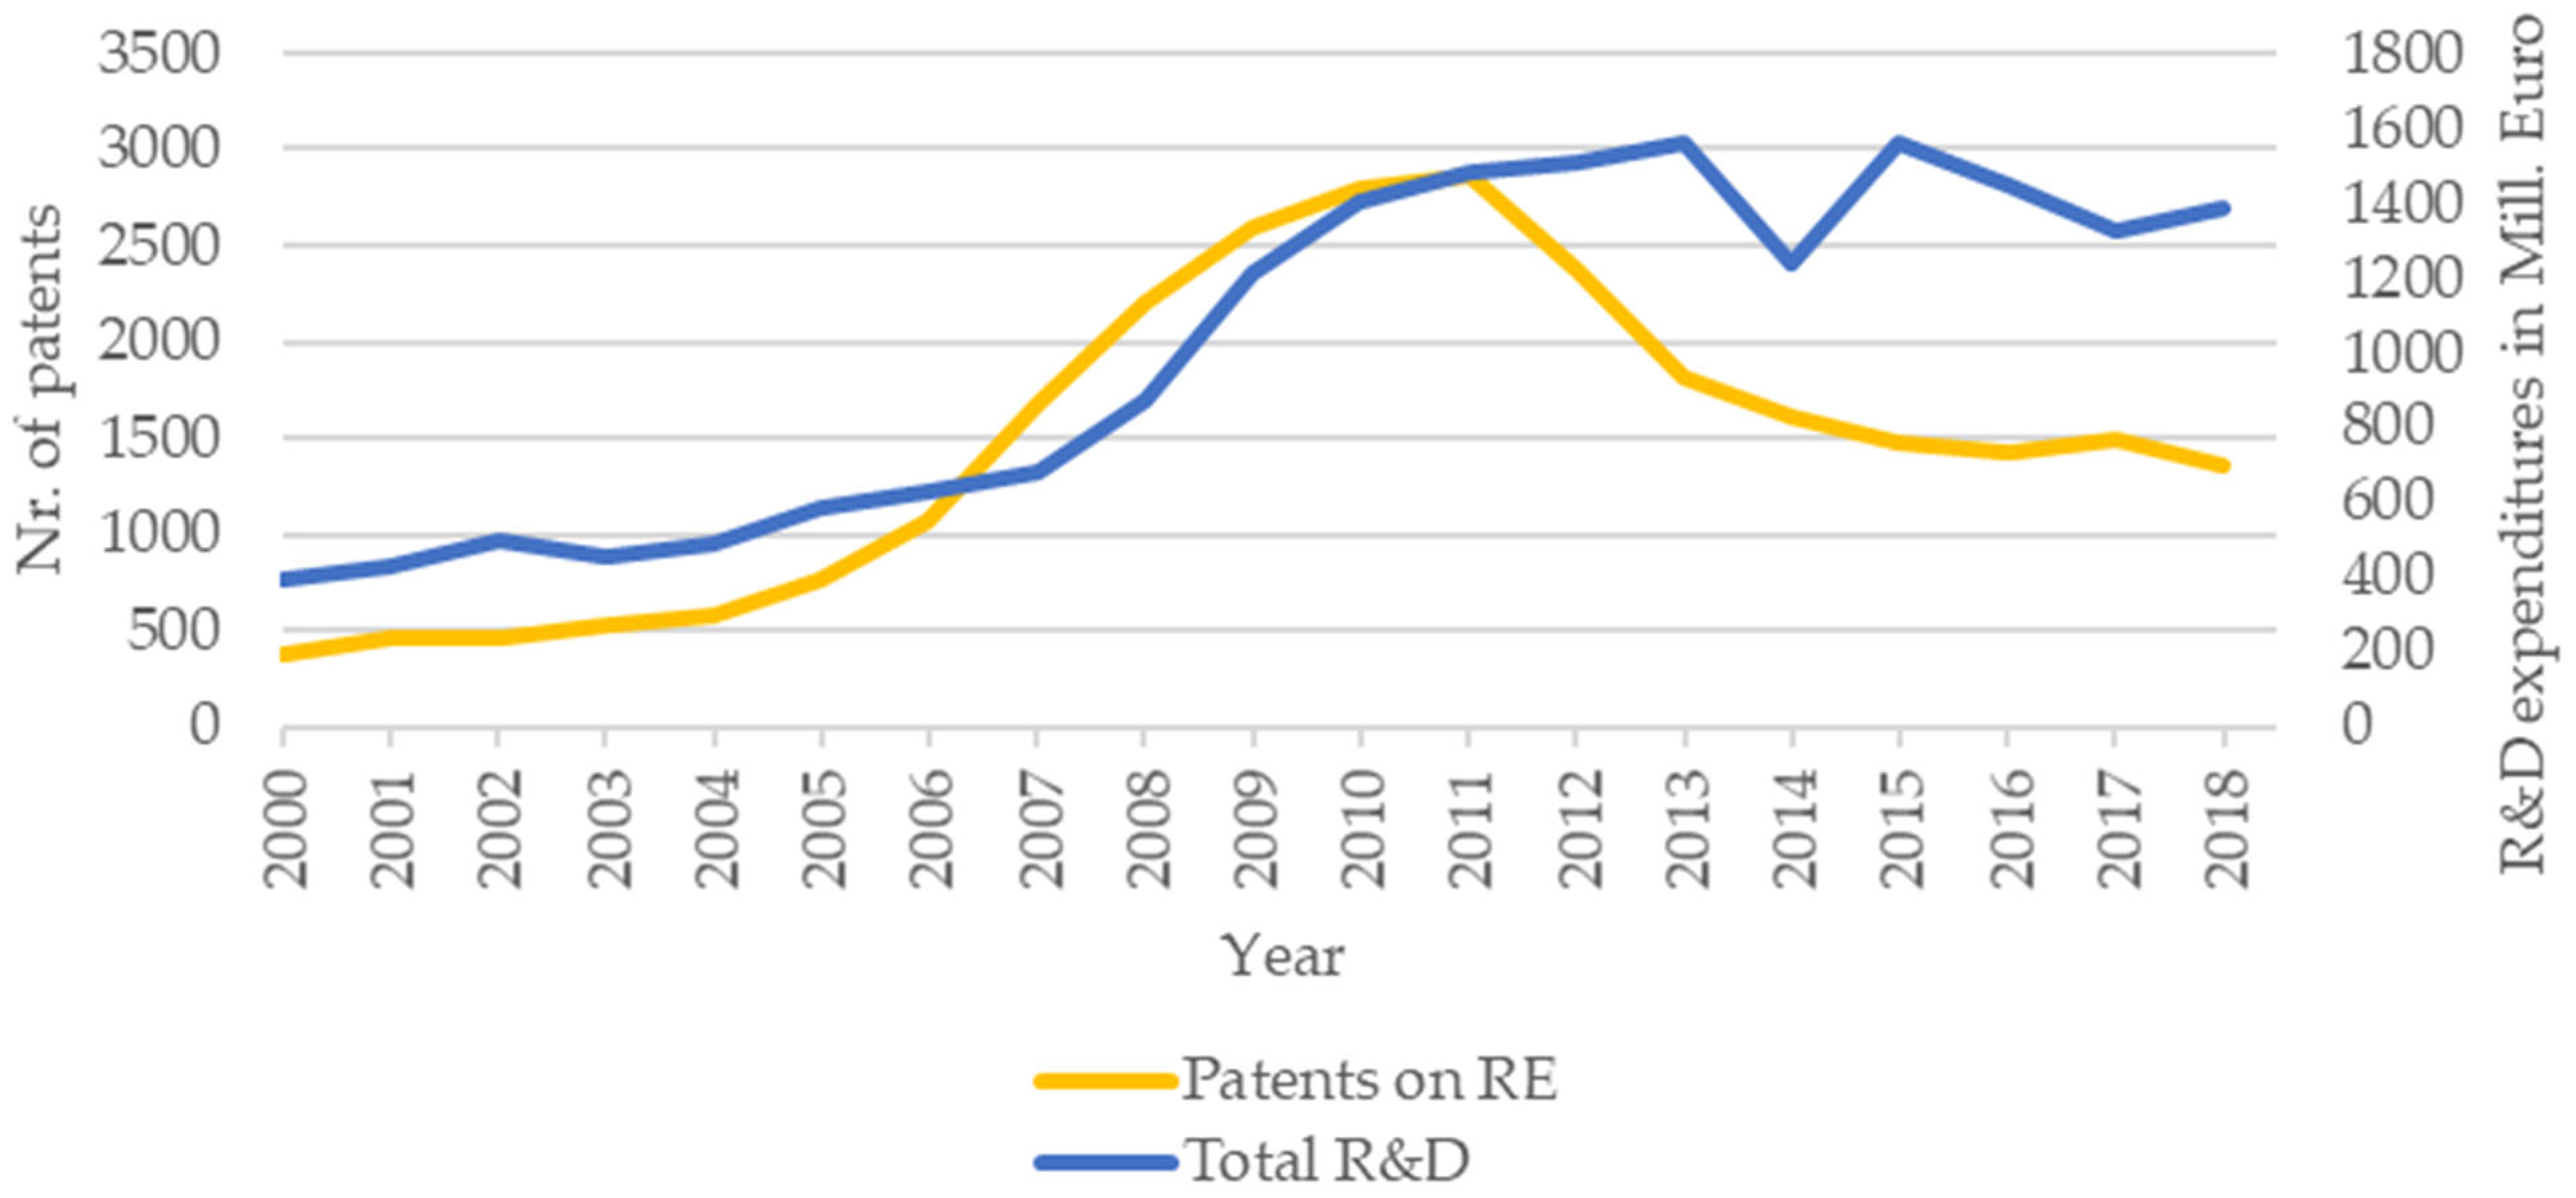
- Has recent European public research and development funding been generally effective as a driver of knowledge and innovation in RE technologies? Concerning this third research question, estimates for the overall average effect of total public R&D support on green innovation are statistically significant and positive. Therefore, based on precise data for the recent period of 2000–2015 and including the European Commission’s contributions, existing evidence derived from indices and without the consideration of EC contributions is confirmed. Furthermore, the relevance of public R&D support, but also the heterogeneity of its effectiveness, is confirmed for the largest sectors (biomass, solar- and wind energy). For the most recent years 2012–2015, the association between public R&D funding and patenting in renewable energy technologies is statistically insignificant. Statistically, the estimates for that period are unreliable: the period is too short and within variation too small. Also, the decrease in patenting activity contrasts with the development of other innovation output measures such as academic publications on RE technologies. Overall, various factors not included in this analysis may have affected patenting activity in those years, such as the industry decline in the solar sector and less need for patenting due to, for example, technology advancement.
- The limited availability of private and international data as well as of data that discriminates between various stages of technological development represent limitations in this paper. Accessible data on R&D support that stems from the private sector or international funding schemes and enhanced accessibility and categorization of country-level data on the European Commission’s R&D expenditures are needed. This will provide promising opportunities for future research and an even more comprehensive picture of R&D financing to policy makers.
- The restricted availability of data represents an even more urgent limitation in light of the necessity to align research efforts across countries, a goal that is reflected, for example, in the National Energy and Climate Plans of the EU member states. Efforts need to be aligned so that they recognize the local policies and conditions which are in place. While alignment does not mean equality, the findings of this research strongly suggest a high degree of relevance, but also a vast heterogeneity in terms of the distribution of national and EC budgets for renewable energy R&D across countries and regions. This should be considered in aligning and extending public R&D support policies. Furthermore, this vast heterogeneity of public R&D support should be taken into account in future research that aims at comparing the financing of R&D activities within the renewable energy sector across countries and regions.
- Another limitation which this research shares with similar studies is the general challenge of reliably quantifying causal effects. Again, the design of energy innovation policies can address this challenge and facilitate future research, for example, by determining support by grades or rankings that would permit the application of Regression Discontinuity Designs.
- Finally, also for the present study, the manifestation of innovation outcomes remains uncertain. According to Pitelis 2018 [23], since estimates depend on the chosen lag structures, this may undermine a quantitative interpretation. Energy innovation policies should be designed so that they address this limitation and facilitate future research and policy evaluation. For example, policies should be coupled with consistent reporting processes of innovation impacts that are maintained for several years.
Author Contributions
Funding
Data Availability Statement
Acknowledgments
Conflicts of Interest
Appendix A


| Variable | Obs. | Mean | Std. dev. | Min. | Max. |
|---|---|---|---|---|---|
| Patents RE | 272 | 86.899 | 177.944 | 0 | 1282.920 |
| Total public R&D expenditures for RE in Mill. Euro | 272 | 55.081 | 70.599 | 0.234 | 372.022 |
| Total public R&D expenditures for RE in % of GDP | 272 | 0.040 | 0.033 | 0.001 | 0.177 |
| Energy consumption | 272 | 96.588 | 5.625 | 80.900 | 113.300 |
| Electricity prices | 272 | 0.126 | 0.043 | 0.052 | 0.235 |
| Feed-in Tariffs | 272 | 2.003 | 1.912 | 0 | 6.000 |
| Standards | 272 | 4.019 | 1.338 | 1 | 6.627 |
| Taxes | 272 | 1.733 | 0.806 | 0.637 | 4.335 |
| Trading Schemes | 272 | 1.497 | 1.248 | 0 | 5.281 |
| Market-based instruments | 272 | 1.744 | 0.754 | 0.250 | 3.433 |
| R&D Stringency | 272 | 2.578 | 1.460 | 0.919 | 6.728 |
| Patents RE Knowledge Stock | 272 | 476.128 | 1026.011 | 2.350 | 6716.002 |
| Patents Solar Energy | 272 | 42.733 | 105.462 | 0 | 762.090 |
| Patents Wind Energy | 272 | 26.661 | 58.979 | 0 | 349.000 |
| Patents Biomass | 272 | 8.632 | 13.310 | 0 | 81.790 |
| Patents Ocean Energy | 272 | 3.721 | 5.670 | 0 | 38.000 |
| Patents Geothermal Energy | 272 | 1.320 | 3.195 | 0 | 27.000 |
| Patents Hydroelectricity | 272 | 3.828 | 6.896 | 0 | 59.830 |
| Total public R&D for Solar Energy in Mill. Euro | 272 | 20.858 | 30.179 | 0 | 140.600 |
| Total public R&D for Solar Energy in % of GDP | 272 | 0.011 | 0.008 | 0 | 0.054 |
| Total public R&D for Wind Energy in Mill. Euro | 272 | 8.205 | 12.734 | 0 | 75.941 |
| Total public R&D for Wind Energy in % of GDP | 272 | 0.007 | 0.011 | 0 | 0.073 |
| Total public R&D for Biomass in Mill. Euro | 272 | 17.245 | 22.575 | 0 | 140.532 |
| Total public R&D for Biomass in % of GDP | 272 | 0.016 | 0.018 | 0 | 0.103 |
| Total public R&D for Ocean Energy in Mill. Euro | 272 | 1.366 | 2.755 | 0 | 15.834 |
| Total public R&D for Ocean Energy in % of GDP | 272 | 0.002 | 0.004 | 0 | 0.032 |
| Total public R&D for Geothermal Energy in Mill. Euro | 272 | 2.002 | 4.585 | 0 | 24.706 |
| Total public R&D for Geothermal Energy in % of GDP | 272 | 0.001 | 0.001 | 0 | 0.013 |
| Total public R&D for Hydroelectricity in Mill. Euro | 272 | 1.273 | 2.347 | 0 | 12.731 |
| Total public R&D for Hydroelectricity in % of GDP | 272 | 0.001 | 0.003 | 0 | 0.029 |
| GDP Deflator | 272 | 145,603.8 | 173,140.7 | 5418.9 | 745,226.0 |
Appendix B
| (1) | (2) | (3) | |
|---|---|---|---|
| Variable | NBRM 2000–2015 | PRM 2000–2015 | OLS 2000–2015 |
| Total public RE R&D in% of GDP | 6.058 *** | 8.701 *** | 832.800 * |
| (0.00) | (0.00) | (0.05) | |
| Electricity prices | 4.292 ** | −0.058 | −263.800 |
| (0.00) | (0.98) | (0.18) | |
| Energy consumption | 0.035 *** | 0.021 | −0.418 |
| (0.00) | (0.23) | (0.74) | |
| Patents all technologies | 0.000 | 0.000 *** | 0.136 *** |
| (0.70) | (0.00) | (0.00) | |
| Feed−in tariffs | 0.044 | −0.021 | −9.674 |
| (0.08) | (0.62) | (0.26) | |
| Standards | 0.153 *** | 0.158 *** | −1.098 |
| (0.00) | (0.00) | (0.84) | |
| Taxes | −0.034 | −0.093 | −14.670 |
| (0.66) | (0.25) | (0.48) | |
| Trading schemes | 0.158 *** | 0.140 *** | 5.817 |
| (0.00) | (0.00) | (0.13) | |
| Constant | −3.376 *** | −373.200 ** | |
| (0.00) | (0.00) | ||
| Observations | 272 | 272 | 272 |
| BIC | 2088.7 | 4701.5 | 3163 |
| (1) | (2) | (3) | (4) | (5) | (6) | |
|---|---|---|---|---|---|---|
| Variable | Biomass | Wind | Solar | Ocean | Geothermal | Hydroelectricity |
| R&D Biomass | 7.906 ** | |||||
| (0.01) | ||||||
| Electricity prices | 4.517 | 7.996 *** | 3.687 * | 6.151 * | −3.931 | 1.934 |
| (0.05) | (0.00) | (0.03) | (0.01) | (0.42) | (0.46) | |
| Energy consumption | 0.029 ** | 0.024 * | 0.044 *** | 0.042 *** | 0.036 | 0.016 |
| (0.00) | (0.02) | (0.00) | (0.00) | (0.05) | (0.20) | |
| Patents all technologies | −0.000 | 0.000 | −0.000 | −0.000 *** | 0.000 *** | −0.000 |
| (0.63) | (0.09) | (0.79) | (0.00) | (0.00) | (0.33) | |
| Feed−in tariffs | 0.056 | 0.013 | 0.056 | 0.036 | 0.032 | −0.021 |
| (0.10) | (0.70) | (0.07) | (0.45) | (0.61) | (0.64) | |
| Standards | 0.135 ** | 0.156 *** | 0.177 *** | 0.209 *** | 0.135 | 0.288 *** |
| (0.00) | (0.00) | (0.00) | (0.00) | (0.09) | (0.00) | |
| Taxes | −0.075 | −0.055 | 0.006 | −0.118 | 0.163 | −0.212 |
| (0.43) | (0.61) | (0.95) | (0.31) | (0.40) | (0.12) | |
| Trading schemes | 0.225 *** | 0.125 ** | 0.197 *** | 0.120 * | 0.174 * | 0.130 * |
| (0.00) | (0.00) | (0.00) | (0.04) | (0.01) | (0.03) | |
| R&D Wind | 13.490 * | |||||
| (0.03) | ||||||
| R&D Solar | 15.080 ** | |||||
| (0.00) | ||||||
| R&D Ocean | −18.780 | |||||
| (0.14) | ||||||
| R&D Geothermal | 17.130 | |||||
| (0.77) | ||||||
| R&D Hydroelectricity | −27.300 | |||||
| (0.23) | ||||||
| Constant | −2.288 * | −2.868 * | −4.672 *** | −3.340 * | −4.173 | −0.931 |
| (0.05) | (0.01) | (0.00) | (0.01) | (0.05) | (0.51) | |
| Observations | 272 | 272 | 272 | 272 | 256 | 272 |
| (1) | (2) | (3) | (4) | (5) | (6) | |
|---|---|---|---|---|---|---|
| Variable | lag2 | lag3 | Family Size Two | Family Size One | Family Size Three | Family Size Four |
| Total public RE R&D | 1.480 | −3.070 * | 6.060 *** | 5.980 *** | 6.350 *** | 5.470 *** |
| (0.299) | (0.034) | (0.000) | (0.000) | (0.000) | (0.000) | |
| Electricity prices | 2.070 | −1.120 | 4.290 ** | 4.650 *** | 3.510 * | 3.120 * |
| (0.111) | (0.397) | (0.002) | (0.000) | (0.016) | (0.041) | |
| Energy consumption | 0.040 *** | 0.040 *** | 0.030 *** | 0.030 *** | 0.030 *** | 0.030 *** |
| (0.000) | (0.000) | (0.000) | (0.000) | (0.000) | (0.000) | |
| Patents all technologies | 0.0000017 | 0.0000024 | 0.0000048 | 0.0000048 | 0.0000110 | 0.0000109 |
| (0.896) | (0.857) | (0.705) | (0.714) | (0.412) | (0.446) | |
| Feed−in tariffs | 0.026 | 0.007 | 0.045 | 0.017 | 0.040 | 0.033 |
| (0.293) | (0.773) | (0.077) | (0.469) | (0.126) | (0.217) | |
| Standards | 0.170 *** | 0.186 *** | 0.153 *** | 0.115 *** | 0.150 *** | 0.176 *** |
| (0.000) | (0.000) | (0.000) | (0.000) | (0.000) | (0.000) | |
| Taxes | −0.065 | −0.080 | −0.034 | −0.013 | −0.080 | −0.097 |
| (0.361) | (0.244) | (0.656) | (0.848) | (0.312) | (0.227) | |
| Trading schemes | 0.189 *** | 0.163 *** | 0.158 *** | 0.159 *** | 0.150 *** | 0.149 *** |
| (0.000) | (0.000) | (0.000) | (0.000) | (0.000) | (0.000) | |
| Constant | −3.185 *** | −2.278 *** | −3.376 *** | −2.382 *** | −2.541 ** | −2.434 ** |
| (0.000) | (0.001) | (0.000) | (0.001) | (0.002) | (0.003) | |
| Observations | 272 | 272 | 272 | 272 | 272 | 272 |
| BIC | 2084.1 | 2104.6 | 2088.7 | 2359.1 | 1902.3 | 1770.4 |
References
- EU. Directive (EU) 2018/2001 of the European Parliament and of the Council of 11 December 2018 on the Promotion of the Use of Energy from Renewable Sources; EU: Brussels, Belgium, 2018. [Google Scholar]
- Tutak, M.; Brodny, J. Renewable energy consumption in economic sectors in the EU-27. The impact on economics, environment and conventional energy sources. A 20-year perspective. J. Clean. Prod. 2022, 345, 131076. [Google Scholar] [CrossRef]
- Bilan, Y.; Streimikiene, D.; Vasylieva, T.; Lyulyov, O.; Pimonenko, T.; Pavlyk, A. Linking between Renewable Energy, CO2 Emissions, and Economic Growth: Challenges for Candidates and Potential Candidates for the EU Membership. Sustainability 2019, 11, 1528. [Google Scholar] [CrossRef] [Green Version]
- Brodny, J.; Tutak, M.; Bindzár, P. Assessing the Level of Renewable Energy Development in the European Union Member States. A 10-Year Perspective. Energies 2021, 14, 3765. [Google Scholar] [CrossRef]
- Bórawski, P.; Bełdycka-Bórawska, A.; Szymańska, E.; Jankowski, K.J.; Dubis, B.; Dunn, J.W. Development of renewable energy sources market and biofuels in The European Union. J. Clean. Prod. 2019, 228, 467–484. [Google Scholar] [CrossRef]
- Papież, M.; Śmiech, S.; Frodyma, K. Determinants of renewable energy development in the EU countries. A 20-year perspective. Renew. Sustain. Energy Rev. 2018, 91, 918–934. [Google Scholar] [CrossRef]
- Marques, A.C.; Fuinhas, J.A. Are public policies towards renewables successful? Evidence from European countries. Renew. Energy 2012, 44, 109–118. [Google Scholar] [CrossRef]
- IEA. European Union 2020. Paris. 2020. Available online: https://www.iea.org/reports/european-union-2020 (accessed on 25 January 2022).
- IEA. World Energy Outlook 2021. Paris. 2021. Available online: https://www.iea.org/reports/world-energy-outlook-2021 (accessed on 24 January 2022).
- European Commission. A Framework Strategy for a Resilient Energy Union with a Forward-Looking Climate Change Policy; European Commission: Brussels, Belgium, 2015. [Google Scholar]
- European Commission. The Implementation Plans: Research & Innovation Enabling the EU’s Energy Transition; European Commission: Brussels, Belgium, 2018. [Google Scholar]
- De Negri, J.F.; Pezzutto, S.; Gantioler, S.; Moser, D.; Sparber, W. A Comprehensive Analysis of Public and Private Funding for Photovoltaics Research and Development in the European Union, Norway, and Turkey. Energies 2020, 13, 2743. [Google Scholar] [CrossRef]
- EU. Regulation (EU) 2018/1999 of the European Parliament and of the Council of 11 December 2018 on the Governance of the Energy Union and Climate Action; EU: Brussels, Belgium, 2018; pp. 1–77. [Google Scholar]
- European Commission. Communication From the Commission: The European Green Deal; European Commission: Brussels, Belgium, 2019. [Google Scholar]
- Cunliff, C. Omission Innovation 2.0: Diagnosing the Global Clean Energy Innovation System. 2019. Available online: https://itif.org/publications/2019/09/23/omission-innovation-20-diagnosing-global-clean-energy-innovation-system. (accessed on 24 January 2022).
- Bointner, R.; Pezzutto, S.; Sparber, W. Scenarios of public energy research and development expenditures: Financing energy innovation in Europe. WIREs Energy Environ. 2016, 5, 470–488. [Google Scholar] [CrossRef]
- Bointner, R.; Pezzutto, S.; Grilli, G.; Sparber, W. Financing Innovations for the Renewable Energy Transition in Europe. Energies 2016, 9, 990. [Google Scholar] [CrossRef] [Green Version]
- Pezzutto, S.; Mosannenzadeh, F.; Grilli, G.; Sparber, W. European Union Research and Development Funding on Smart Cities and Their Importance on Climate and Energy Goals. In Smart and Sustainable Planning for Cities and Regions; Springer: Cham, Switzerland, 2016; pp. 421–435. [Google Scholar]
- Pezzutto, S.; De Negri, F.; Gantioler, S.; Moser, D.; Sparber, W. Public Research and Development Funding for Photovoltaics in Europe-Past, Present, and Future. In Green Energy and Technology; Springer: Cham, Switzerland, 2021; pp. 117–128. [Google Scholar]
- Johnstone, N.; Haščič, I.; Popp, D. Renewable Energy Policies and Technological Innovation: Evidence Based on Patent Counts. Environ. Resour. Econ. 2010, 45, 133–155. [Google Scholar] [CrossRef]
- Lee, K.; Lee, S. Patterns of technological innovation and evolution in the energy sector: A patent-based approach. Energy Policy 2013, 59, 415–432. [Google Scholar] [CrossRef]
- Costantini, V.; Crespi, F.; Martini, C.; Pennacchio, L. Demand-pull and technology-push public support for eco-innovation: The case of the biofuels sector. Res. Policy 2015, 44, 577–595. [Google Scholar] [CrossRef]
- Pitelis, A.T. Industrial policy for renewable energy: The innovation impact of European policy instruments and their interactions. Competition Chang. 2018, 22, 227–254. [Google Scholar] [CrossRef]
- Pitelis, A.; Vasilakos, N.; Chalvatzis, K. Fostering innovation in renewable energy technologies: Choice of policy instruments and effectiveness. Renew. Energy 2020, 151, 1163–1172. [Google Scholar] [CrossRef]
- Peters, M.; Schneider, M.; Griesshaber, T.; Hoffmann, V.H. The impact of technology-push and demand-pull policies on technical change—Does the locus of policies matter? Res. Policy 2012, 41, 1296–1308. [Google Scholar] [CrossRef]
- Dechezleprêtre, A.; Glachant, M. Does Foreign Environmental Policy Influence Domestic Innovation? Evidence from the Wind Industry. Environ. Resour. Econ. 2014, 58, 391–413. [Google Scholar] [CrossRef]
- Nesta, L.; Vona, F.; Nicolli, F. Environmental policies, competition and innovation in renewable energy. J. Environ. Econ. Manag. 2014, 67, 396–411. [Google Scholar] [CrossRef]
- Pless, J.; Hepburn, C.; Farrell, N. Bringing rigour to energy innovation policy evaluation. Nat. Energy 2020, 5, 284–290. [Google Scholar] [CrossRef]
- IEA. Statistics Data Browser. 2021. Available online: https://www.iea.org/data-and-statistics/data-product/energy-technology-rd-and-d-budget-database-2#energy-technology-rdd-budgets (accessed on 3 November 2021).
- IEA. Energy Technology RD&D Budgets October 2021 Edition—Database Documentation; IEA: Paris, France, 2021; Available online: https://www.iea.org/data-and-statistics/data-product/energy-technology-rd-and-d-budget-database-2#documentation (accessed on 3 November 2021).
- EU Publications Office. EU Open Data Portal. 2021. Available online: https://data.europa.eu/data/datasets?locale=en (accessed on 12 December 2021).
- EUROSTAT. Eurostat Database. 2021. Available online: https://ec.europa.eu/eurostat/web/main/data/database (accessed on 4 December 2021).
- European Commission. Capacity Mapping: R&D Investment in SET-Plan Technologies; EC: Luxembourg, 2015. [Google Scholar]
- IEA. Clean Energy Innovation. Paris. 2020. Available online: https://www.iea.org/reports/clean-energy-innovation (accessed on 28 January 2022).
- OECD. Environment Database Technology Development. 2021. Available online: https://stats.oecd.org/Index.aspx?DataSetCode=PAT_DEV (accessed on 21 November 2021).
- Hall, B.H.; Griliches, Z.; Hausman, J.A. Patents and R&D: Searching for a Lag Structure. Natl. Bur. Econ. Res. Work. Pap. Ser. 1983, 1227. [Google Scholar] [CrossRef]
- Brunnermeier, S.B.; Cohen, M.A. Determinants of environmental innovation in US manufacturing industries. J. Environ. Econ. Manag. 2003, 45, 278–293. [Google Scholar] [CrossRef]
- Hall, B.H.; Griliches, Z.; Hausman, J.A. Patents and R and D: Is There a Lag? Int. Econ. Rev. 1986, 27. [Google Scholar] [CrossRef]
- Popp, D. Lessons from patents: Using patents to measure technological change in environmental models. Ecol. Econ. 2005, 54, 209–226. [Google Scholar] [CrossRef] [Green Version]
- OECD. Indicators of Patent Value. In OECD Patent Statistics Manual; OECD: Paris, France, 2009; pp. 135–149. [Google Scholar]
- Putnam, J. The Value of International Patent Rights. Ph.D. Thesis, Yale University, New Haven, CT, USA, 1996. [Google Scholar]
- Cremers, K.; Harhoff, D.; Scherer, F.M.; Vopel, K. Citations, family size, opposition and the value of patent rights. Res. Policy Sep. 2003, 32, 1343–1363. [Google Scholar] [CrossRef]
- Jaffe, A.B.; Trajtenberg, M. Patents, Citations, and Innovations: A Window on the Knowledge Economy; MIT Press: Cambridge, MA, USA, 2002. [Google Scholar]
- Griliches, Z. Patent Statistics as Economic Indicators: A Survey. J. Econ. Lit. 1990, 28, 1661–1707. Available online: http://www.jstor.org.eur.idm.oclc.org/stable/2727442 (accessed on 14 January 2022).
- OECD. OECD Environment Statistics Database. 2016. Available online: https://doi-org.eur.idm.oclc.org/10.1787/2bc0bb80-en (accessed on 21 November 2021).
- Cameron, A.C.; Trivedi, P.K. Econometric models based on count data. Comparisons and applications of some estimators and tests. J. Appl. Econ. 1986, 1, 29–53. [Google Scholar] [CrossRef]
- Schwarz, G. Estimating the dimension of a model. Ann. Stat. 1978, 6, 461–464. Available online: http://links.jstor.org.eur.idm.oclc.org/sici?sici=0090-5364(197803)6:2%3C461:ETDOAM%3E2.0.CO;2-5&origin=MSN (accessed on 19 January 2022).
- Burnham, K.P.; Anderson, D.R. Multimodel Inference: Understanding AIC and BIC in Model Selection. Sociol. Methods Res. 2004, 33, 261–304. [Google Scholar] [CrossRef]
- Wooldridge, J.M. Introductory Econometrics: A Modern Approach; Mason, O.H., Ed.; Cengage Learning: South Western, OH, USA, 2009. [Google Scholar]
- Baccini, L.; Urpelainen, J. Legislative fractionalization and partisan shifts to the left increase the volatility of public energy R&D expenditures. Energy Policy 2012, 46, 49–57. [Google Scholar] [CrossRef] [Green Version]
- European Commission. Horizon 2020 Dashboard. 2022. Available online: https://ec.europa.eu/info/funding-tenders/opportunities/portal/screen/opportunities/horizon-dashboard (accessed on 9 February 2022).
- EU Publications Office. Statistical Regions in the European Union and Partner Countries—NUTS and Statistical Regions 2021; EU Publications Office: Luxembourg, 2020. [Google Scholar] [CrossRef]
- CIEEM. EU Environmental Legislation and UK Implementation; CIEEM: Hampshire, UK, 2015. [Google Scholar]
- Rennings, K. Redefining innovation—Eco-innovation research and the contribution from ecological economics. Ecol. Econ. 2000, 32, 319–332. [Google Scholar] [CrossRef]
- Groba, F.; Breitschopf, B. Impact of Renewable Energy Policy and Use on Innovation: A Literature Review. Entrep. Econ. Ejournal 2013. Available online: https://www.diw.de/documents/publikationen/73/diw_01.c.426553.de/dp1318.pdf (accessed on 12 January 2022). [CrossRef] [Green Version]
- Horbach, J. Determinants of environmental innovation—New evidence from German panel data sources. Res. Policy 2008, 37, 163–173. [Google Scholar] [CrossRef] [Green Version]
- Ramstein, C.; Dominioni, G.; Ettehad, S.; Lam, L.; Quant, M.; Zhang, J.; Mark, L.; Nierop, S.; Berg, T.; Leuschner, P.; et al. State and Trends of Carbon Pricing 2019; The World Bank: Washington, DC, USA, 2019. [Google Scholar] [CrossRef]
- Fraunhofer ISE. Photovoltaics Report. Freiburg, Germany. 2021. Available online: https://www.ise.fraunhofer.de/de/veroeffentlichungen/studien/photovoltaics-report.html (accessed on 16 January 2022).
- Li, S.; Shao, Q. Exploring the determinants of renewable energy innovation considering the institutional factors: A negative binomial analysis. Technol. Soc. 2021, 67, 101680. [Google Scholar] [CrossRef]
- Hoogland, O.; Veenstra, E.; Opinska, L.G.; Vega, P.C.T.; Rademaekers, K. Study on impacts of EU Actions Supporting the Development of Renewable Energy Technologies. 2019. Available online: https://trinomics.eu/project/impact_of_eu_r_and_d_support_for_renewables/ (accessed on 12 January 2022).
- Lee, D.S.; Lemieux, T. Regression Discontinuity Designs in Economics. J. Econ. Lit. 2010, 48, 281–355. [Google Scholar] [CrossRef] [Green Version]
- Bronzini, R.; Piselli, P. The impact of R&D subsidies on firm innovation. Res. Policy 2016, 45, 442–457. Available online: https://econpapers.repec.org/RePEc:eee:respol:v:45:y:2016:i:2:p:442-457 (accessed on 18 January 2022).
- Agrawal, A.; Rosell, C.; Simcoe, T. Tax Credits and Small Firm R&D Spending. Am. Econ. J. Econ. Policy 2020, 12, 1–21. [Google Scholar] [CrossRef]
- Becker, B. Public r&d policies and private r&d investment: A survey of the empirical evidence. J. Econ. Surv. 2014, 29, 917–942. [Google Scholar] [CrossRef] [Green Version]
- Grubb, M. Technology Innovation and Climate Change Policy: An overview of issues and options. Keio Econ. Stud. 2004, 41, 103–132. [Google Scholar]
- Grafström, J.; Söderholm, P.; Gawel, E.; Lehmann, P.; Strunz, S. Government support to renewable energy R&D: Drivers and strategic interactions among EU Member States. Econ. Innov. New Technol. 2020, 1–24. [Google Scholar] [CrossRef]
- Acemoglu, D.; Aghion, P.; Bursztyn, L.; Hemous, D. The Environment and Directed Technical Change. Am. Econ. Rev. 2012, 102, 131–166. [Google Scholar] [CrossRef] [Green Version]


| (1) | (2) | (3) | (4) | (5) | |
|---|---|---|---|---|---|
| Variable | 2000–2015 | 2000–2015 | 2000–2015 | 2000–2011 | 2012–2015 |
| Total public RE R&D in % of GDP | 12.660 *** | 12.200 *** | 6.058 *** | 5.825 *** | −0.267 |
| (0.00) | (0.00) | (0.00) | (0.00) | (0.89) | |
| Electricity prices | 7.509 *** | 4.292 ** | 8.160 *** | −7.074 | |
| (0.00) | (0.00) | (0.00) | (0.15) | ||
| Energy consumption | 0.033 *** | 0.035 *** | 0.020 * | 0.024 | |
| (0.00) | (0.00) | (0.02) | (0.07) | ||
| Patents all technologies | 0.000 | 0.000 | −0.000 | 0.000 ** | |
| (0.23) | (0.70) | (0.29) | (0.00) | ||
| Feed−in tariffs | 0.045 | 0.059 * | −0.085 | ||
| (0.08) | (0.04) | (0.11) | |||
| Standards | 0.153 *** | 0.335 *** | −0.029 | ||
| (0.00) | (0.00) | (0.64) | |||
| Taxes | −0.034 | 0.007 | −0.075 | ||
| (0.66) | (0.94) | (0.54) | |||
| Trading schemes | 0.158 *** | 0.094 * | −0.038 | ||
| (0.00) | (0.01) | (0.53) | |||
| Constant | 0.626 *** | −3.373 *** | −3.376 *** | −2.597 ** | 2.471 |
| (0.00) | (0.00) | (0.00) | (0.00) | (0.11) | |
| Observations | 272 | 272 | 272 | 204 | 68 |
| BIC | 2170.3 | 2145.5 | 2088.7 | 1473.6 | 382.6 |
Publisher’s Note: MDPI stays neutral with regard to jurisdictional claims in published maps and institutional affiliations. |
© 2022 by the authors. Licensee MDPI, Basel, Switzerland. This article is an open access article distributed under the terms and conditions of the Creative Commons Attribution (CC BY) license (https://creativecommons.org/licenses/by/4.0/).
Share and Cite
Gasser, M.; Pezzutto, S.; Sparber, W.; Wilczynski, E. Public Research and Development Funding for Renewable Energy Technologies in Europe: A Cross-Country Analysis. Sustainability 2022, 14, 5557. https://doi.org/10.3390/su14095557
Gasser M, Pezzutto S, Sparber W, Wilczynski E. Public Research and Development Funding for Renewable Energy Technologies in Europe: A Cross-Country Analysis. Sustainability. 2022; 14(9):5557. https://doi.org/10.3390/su14095557
Chicago/Turabian StyleGasser, Maximilian, Simon Pezzutto, Wolfram Sparber, and Eric Wilczynski. 2022. "Public Research and Development Funding for Renewable Energy Technologies in Europe: A Cross-Country Analysis" Sustainability 14, no. 9: 5557. https://doi.org/10.3390/su14095557
APA StyleGasser, M., Pezzutto, S., Sparber, W., & Wilczynski, E. (2022). Public Research and Development Funding for Renewable Energy Technologies in Europe: A Cross-Country Analysis. Sustainability, 14(9), 5557. https://doi.org/10.3390/su14095557