Article

About the New Methodology and XAI-Based Software Toolkit for Risk Assessment

by
Zygimantas Meskauskas
* and
Egidijus Kazanavicius
Centre of Real Time Computer Systems, Kaunas University of Technology, LT-51423 Kaunas, Lithuania
*
Author to whom correspondence should be addressed.
Sustainability 2022, 14(9), 5496; https://doi.org/10.3390/su14095496
Submission received: 11 March 2022 / Revised: 15 April 2022 / Accepted: 30 April 2022 / Published: 4 May 2022

Abstract

:
There are different approaches in different areas of what the risk is. ISO 31000 risk management standards describe risk as the effect of uncertainty on objectives. Many existing risk assessment procedures are based on the assumption that risk is the amount of any damage or loss multiplied by the probability of an event that could cause the damage. We are proposing a new risk approach, based on Hillson’s positive risk philosophy, that risk is not just a threat but also a composition of new opportunities, efforts that need to be put in, and uncertainty. For this approach, we composed a risk formula and a methodology based on that formula. A prototypical software tool was developed, and an experiment was performed using this tool to evaluate the risk of several interconnected projects and validate the developed risk assessment methodology. It should be mentioned that, in the methodology, the decision-making process is performed traceably; therefore, it can be stated that it has explainable artificial intelligence (XAI) traits.

1. Introduction

Society, collectively or individually, living in conditions of constant change is exposed to various risks arising from the many threats that can occur and affect people, buildings, property, and the environment. Risk is an integral part of life, affecting all people without exception; it is constantly accompanied by challenges and potential opportunities, and there will always be factors that can affect the individual or society that are underestimated or overlooked [1]. Risk management is a systematic application of management policies, procedures, and practices to the tasks of communication, consultation, establishing the context, identifying, analyzing, evaluating, treating, monitoring, and reviewing risks [2].
Research to generalize the concept of risk and to find a common approach for risk assessments in different fields has been conducted for many years, but different authors have different approaches to this phenomenon. There are subjective approaches to risk that depend on the available knowledge and objective approaches that depend on specific parameters. Risk itself is perceived as an impact, outcome, or uncertainty—there is no common agreement. Risk is a contextual concept, the meaning of which varies in different situations, perspectives, or attitudes. Although the most obvious differences in the interpretation of risk are noticeable following the technical–social sciences divide, in related disciplines, the term risk and its analysis are also not understood unambiguously.
Specific methods, procedures, models, and tools are required to assess risks in specific fields, indicating that risk is an area-dependent derivative category that cannot be assessed directly. On this basis, the general risk research aim is to purify the general concept, which would not be dependent on the particular field and describe the results of the activity that differs from the expected outcomes.
The structure of this paper: the second section reviews the existing risk approaches and proposes a new approach, the third section describes the risk assessment methodology based on the proposed approach, the fourth section describes the implementation of the risk evaluation system based on the proposed methodology, the fifth section describes the experimental study using the developed software tool, and the aggregated conclusions together with drawbacks and future works are presented in the sixth section.

2. Risk Approach

The diversity of existing risk management methods and procedures induces to find a common approach applicable to multiple fields, but due to the distinct nature of the problems in different fields, this has not been achieved yet. Additionally, no general definition of risk has been accepted by the scientific community in a sufficiently broad and precise manner and therefore remains a field of research. Different risk interpretations are noticeable not only between different paradigms of science but also within them. This confirms that the concept of risk is contextual and applied to the given situation. An economist, politician, manager, psychologist, or sociologist acting in their field of science formulates different risk-related questions that emerge from different epistemological assumptions of risk understanding. However, despite differences in risk conceptualization, different risk approaches also have commonalities. According to Ortwin Renn, all risk concepts have one element in common: the difference between a possible and a chosen action [3]. Philosophers call this difference uncertainty. Irrespective of scientific discipline, the risk is not perceived as a constant condition but as a phenomenon with different outcomes. Scientists perceive risk as an activity, as a process, or a characteristic of a situation, but in all cases, the dimension of uncertainty remains. In this case, risk can be referred to as a complex phenomenon. Thus, given the complexity of the risk, several existing risk approaches are provided:
  • Risk is the measure of probability and the weight of undesired consequences [4].
  • Risk equals the triplet (si, pi, ci), where si is the set of scenarios, pi is the likelihood of that scenario, and ci is the consequence of the scenario, i = 1, 2, …, N [5].
  • Risk equals the product of probability and severity [6].
  • According to critics, risk means different things to different people [7].
  • Risk is the likelihood of adverse effects predicting the possible consequences of exposure to a particular threat in a particular hazardous area over time [8].
  • Risk is a combination of five primitives: outcome, likelihood, significance, causal scenario, and population affected [9].
  • Risk is a situation or event where something of human value (including humans themselves) has been put at stake and where the outcome is uncertain [10].
  • A “risk triangle” consists of three components: threat, openness, and vulnerability [11].
  • Risk is the expression of influence and possibility of an accident in the sense of the severity of the potential accident and the probability of the event [12].
  • Risk is a combination of the probability and scope of the consequences [13].
  • Risk equals expected damage [14].
  • The concept of risk is incorporated into so many different disciplines, starting with engineering and ending with portfolio theory, so it should come as no surprise that it is defined in different ways [15].
  • Risk refers to uncertainty about and severity of the events and consequences (or outcomes) of an activity with respect to something that humans value [16].
  • Risk is the effect of uncertainty on objectives [2].
  • The simplest, most widely used definition of risk, used by many risk managers, is described by the equation: risk is the probability of an event occurring multiplied by the consequences of an event that has already occurred [17].
  • Risk is an important concept in a number of scientific fields, yet there is no consensus on how it is to be defined and interpreted [18].
  • The concept of risk is used in various fields of science. In each of them, the risk concept has topics, directions, and methods used [19].
  • Risk is a word that causes the feeling of urgency, because it addresses detrimental, sometimes catastrophic, outcomes. If you asked ten different people what they imply by the word risk, you would probably get ten different answers [20].
  • The risk concept indicates a complex state that, at least in modern society, is a normal aspect of life [21].
  • The Oxford English Dictionary definition of risk is as follows: “a chance or possibility of danger, loss, injury or other adverse consequences”, and the definition of at risk is “exposed to danger”. In this context, risk is used to signify negative consequences. However, taking a risk can also result in a positive outcome. A third possibility is that risk is related to the uncertainty of an outcome [22].
  • The community needs to take risks, all forms of human activity carry risks, and there is no such thing as “risk-free” [23].
  • In general, there are two basic approaches to risk assessment: [24].
    a.
    Objective risk assessment, where all factors influencing its occurrence are measurable and can be identified and quantified.
    b.
    Subjective risk assessment, where the factors that lead to the occurrence of risk can be difficult to quantify and measure with exact mathematical methods.
Risk standardization can be expressed in layers, as presented in Figure 1.
After reviewing existing risk approaches, we introduce our new approach for a field-independent risk assessment methodology (experts should formally express field-specific knowledge, and the methodology itself is only responsible for risk assessment calculations). We propose that risk is a normalized to the subjective level of uncertainty about the consequences of the state of the entity system in question in complex environments, consisting of four overlapping entities:
  • Opportunities (OP)—profit, achievements, and positive results.
  • Threats (TH)—losses, damage, and negative results.
  • Efforts (EFF)—investment, labor cost, and contributions.
  • Hesitancies (HES)—uncertainties, randomness, possibilities, probabilities, and level of doubts related to incomplete or inaccurate information or its probabilistic nature.
We propose that a measurable level of risk R can be calculated as a value of a certain function R (.), depending on OP, TH, EFF, and HES parameters as presented in (1):
R = R (OP↓; TH↑; EFF↑; HES ↑)
In this formula, the upward arrows indicate which member of the formula increases, and the downward arrows indicate which member decreases the magnitude of the calculated risk. The estimation of the formula members (as well as the calculation of the function R itself) is based on a mathematical apparatus fuzzy computing with words (FCWW) [25] that is adequate for the task, user-friendly, and convenient for experts.
Risk management requires information technology solutions, which implementation requires the definition of risk, its formal model, understanding of the environment, and the integration and monitoring of ongoing processes in real time. Risk assessment is the first step towards risk management. It provides mechanisms to assess which risks present opportunities and which present traps [26]. Risk assessment is the most important and time-consuming step in the risk management process [27].

3. Functional Organization

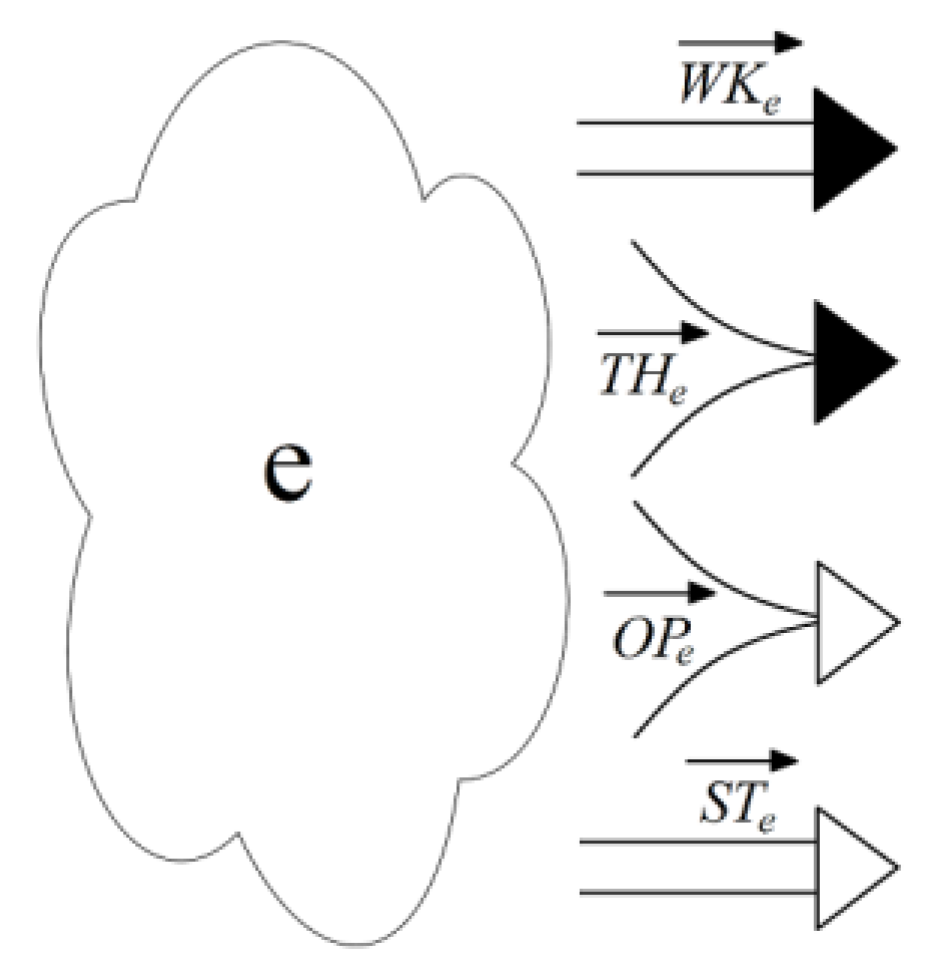
Any situation under investigation originates in its environment. There are numerous ways to define the situation, i.e., brainstorming, diagrams, surveys, etc., but we chose to apply a well-known method of SWOT analysis, because it is time-tested and has good potential for expansion. By using a SWOT analysis, the situation is characterized by the following vectors, indicating strengths S T e , weaknesses W K e , opportunities O P e , and threats T H e as presented in (2):
{ S T e = ( S T e 1 ,   , S T e s ,   , S T e S ) ,   e s = ( 1 ,   , e s ,   , e S ) W K e = ( W K e 1 ,   , W K e w ,   , W K e W ) ,   e w = ( 1 ,   , e w ,   , e W ) O P e = ( O P e 1 ,   , O P e o ,   , O P e O ) ,   e o = ( 1 ,   , e o ,   , e O ) T H e = ( T H e 1 ,   , T H e t ,   , T H e T ) ,   e t = ( 1 ,   , e t ,   , e T )
The SWOT descriptors of the situation in its defined environment are shown in Figure 2.
In the case of the classical SWOT analysis, each descriptor needs to be evaluated quantitatively. Evaluating SWOT descriptors of projects by using numerical estimates is a complex, tedious, and often not accurate enough procedure for experts. For this reason, in the previous stage of the risk assessment methodology research, we proposed an extension of the classical SWOT analysis method that allows experts to use words from the selected vocabulary for the verbal evaluation of all possible entities during the SWOT analysis [28]. Research for the extension of the classical SWOT analysis was performed in Reference [29], together with classical SWOT analysis calculations. When the extended SWOT analysis was proposed in [28], calculations on the same project were performed, which allowed to validate the results and to prove the effectiveness, along with the accuracy of the proposed SWOT method extension.
The extended SWOT analysis used the input words vector vocabulary { α } , consisting of verbal descriptors as presented in (3):
{ α } = ( { α 1 } ,   , { α a } , , { α A } )
According to Miller’s law [30], humans can differentiate up to six verbal descriptors, so we chose to use six different words in our vocabulary, as presented in (4):
{ { Z } N o n e / Z e r o { V S } V e r y   s m a l l { S } S m a l l { M } M e d i u m { L } L a r g e { V L } V e r y   l a r g e
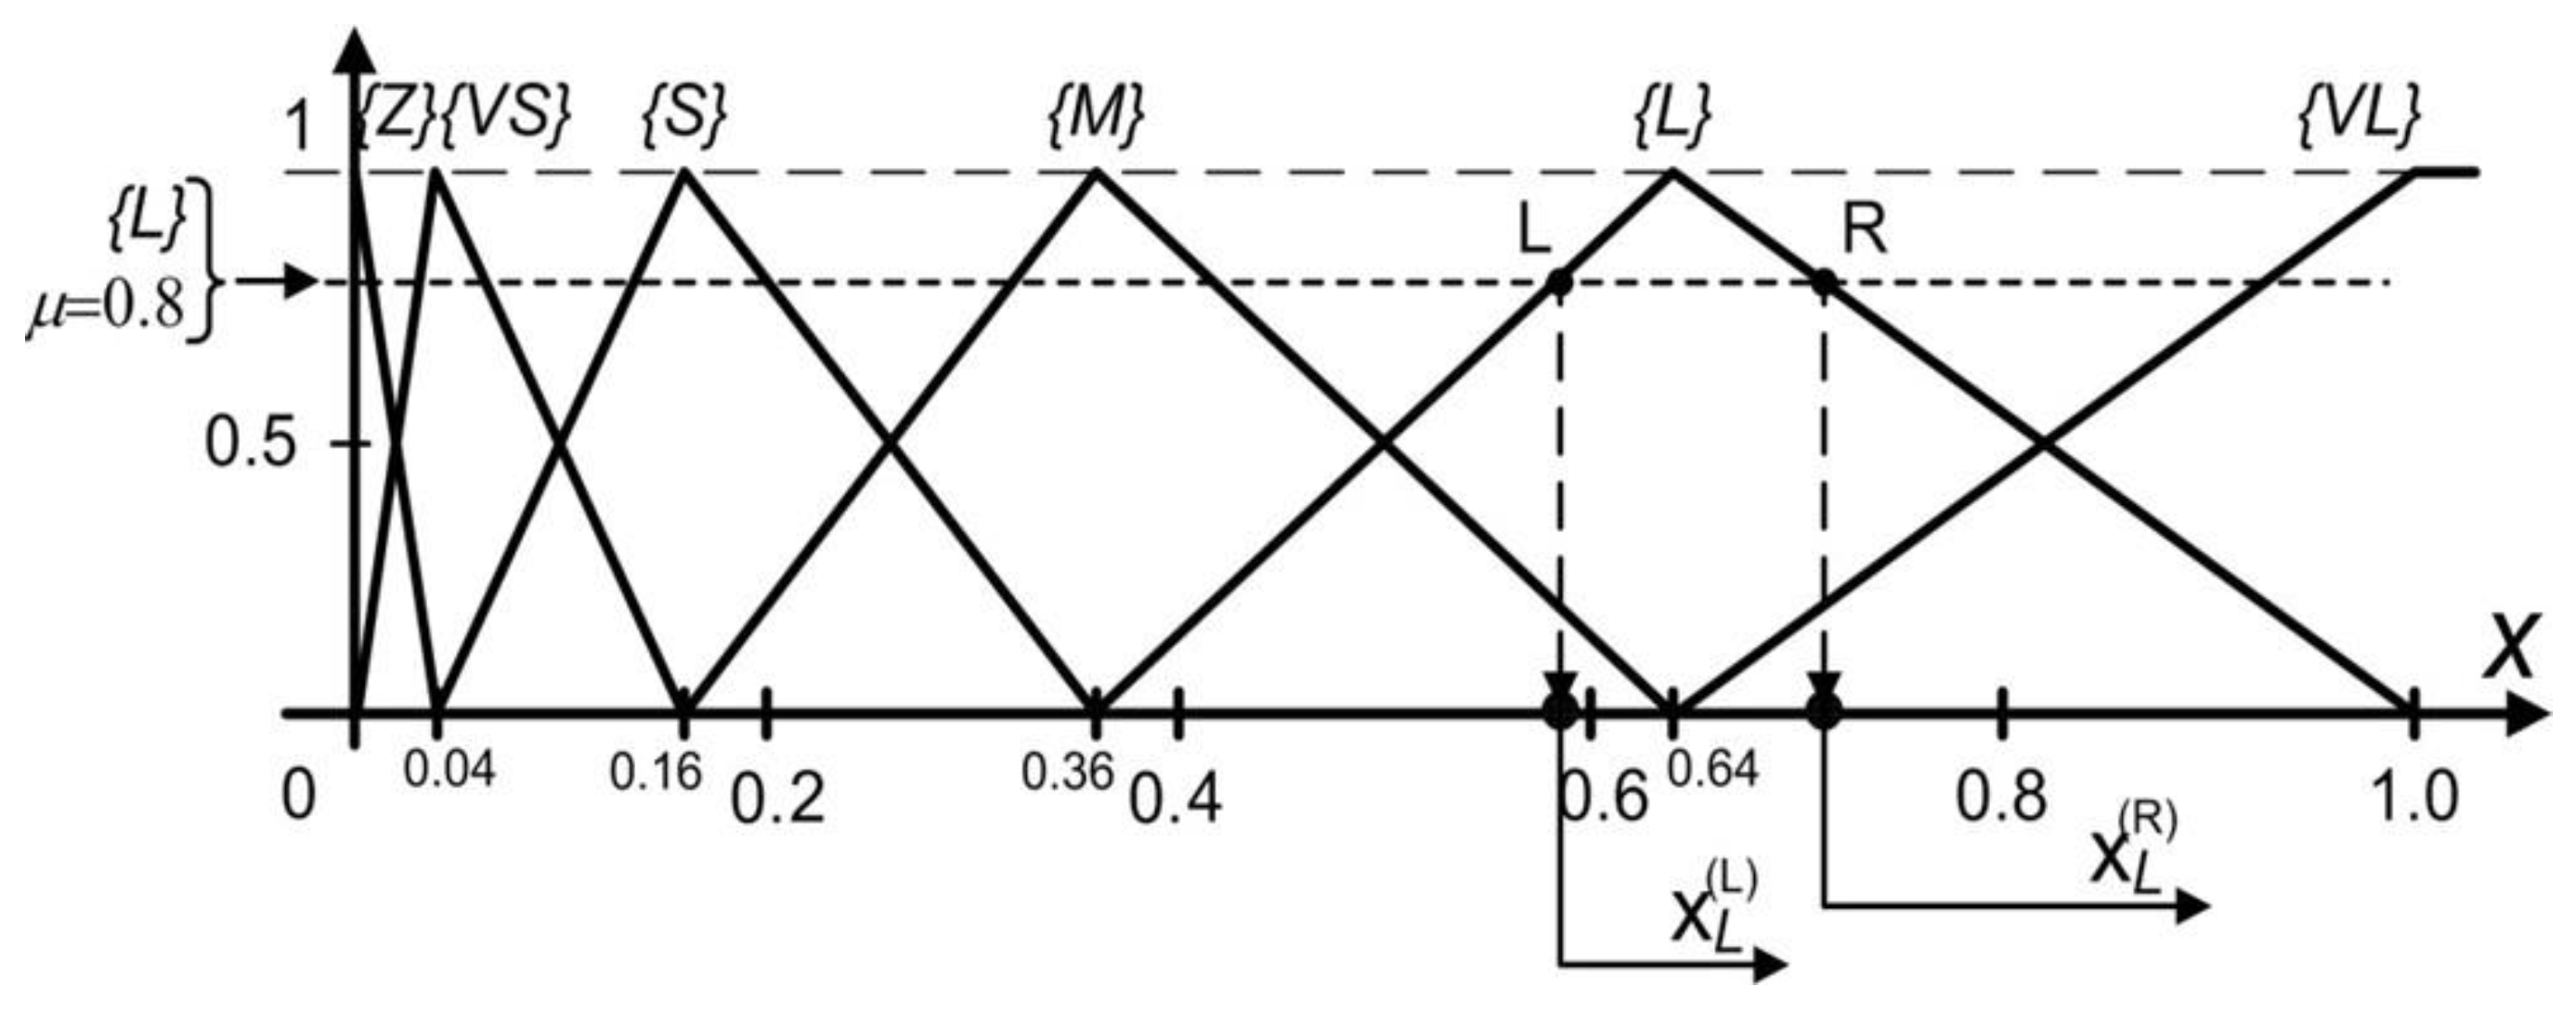
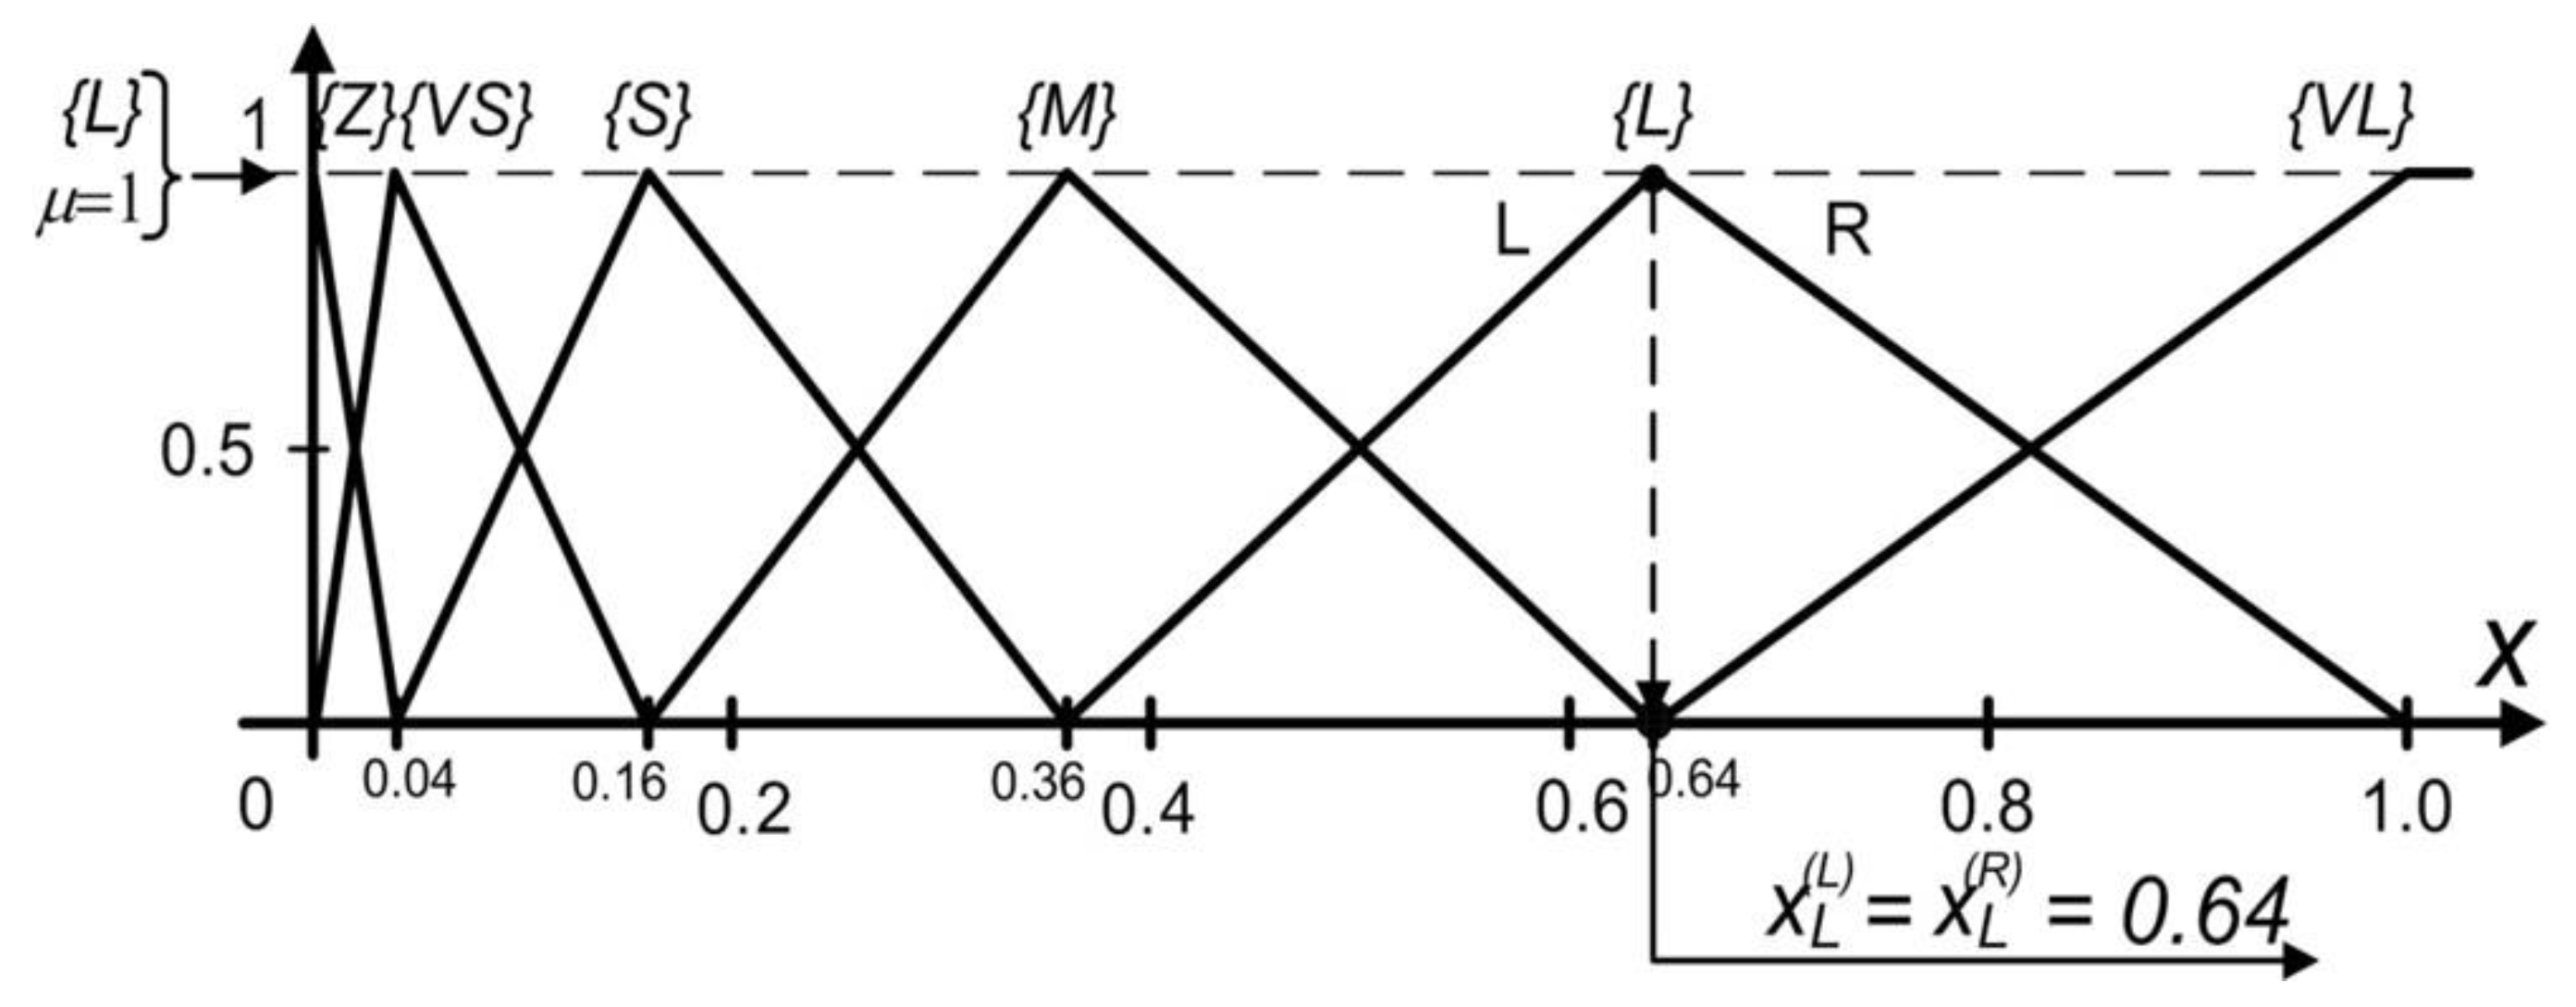
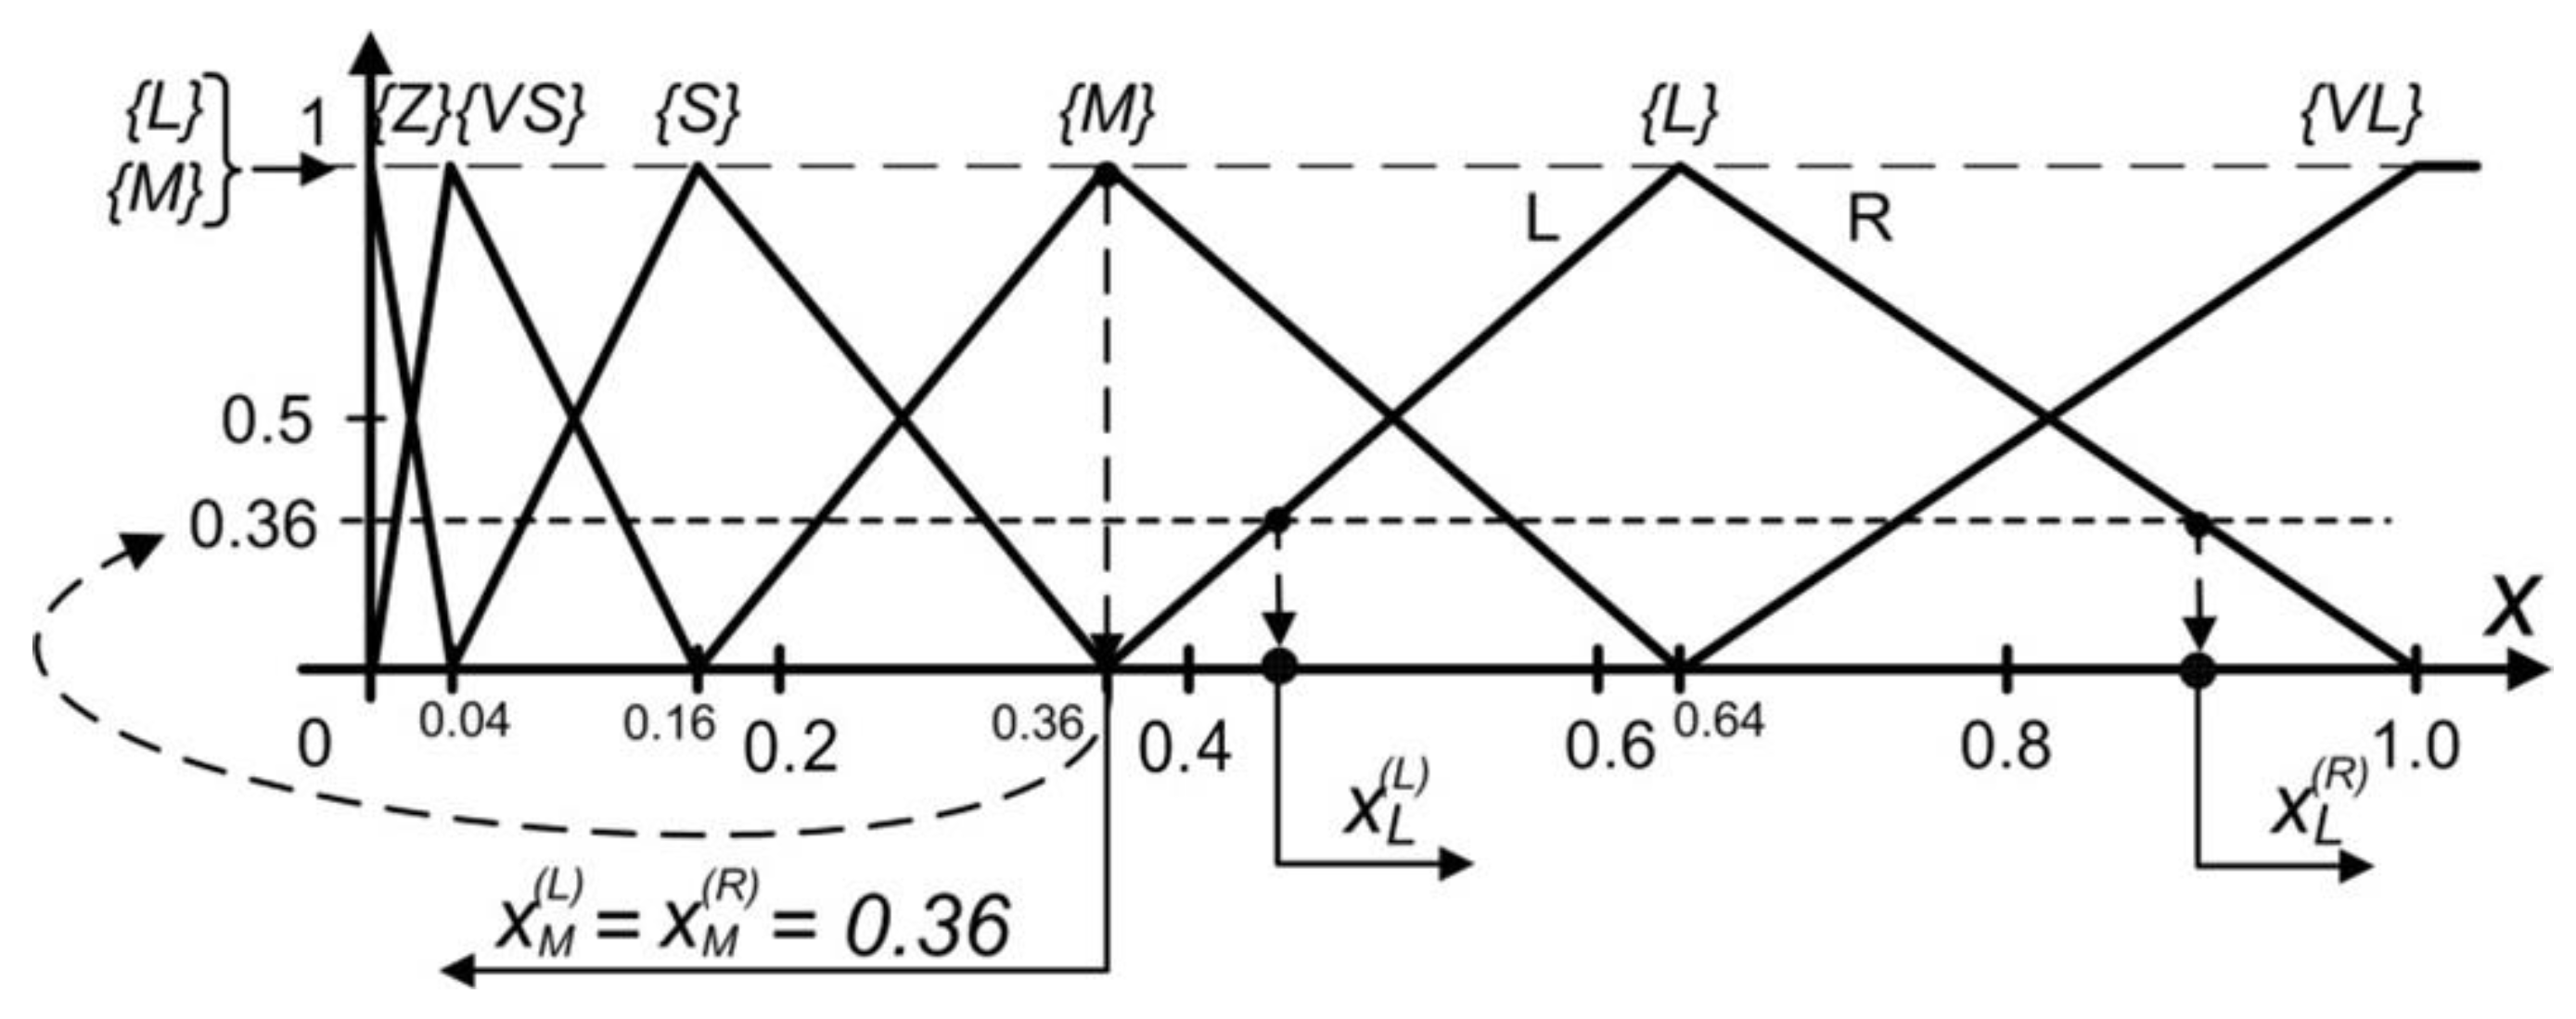
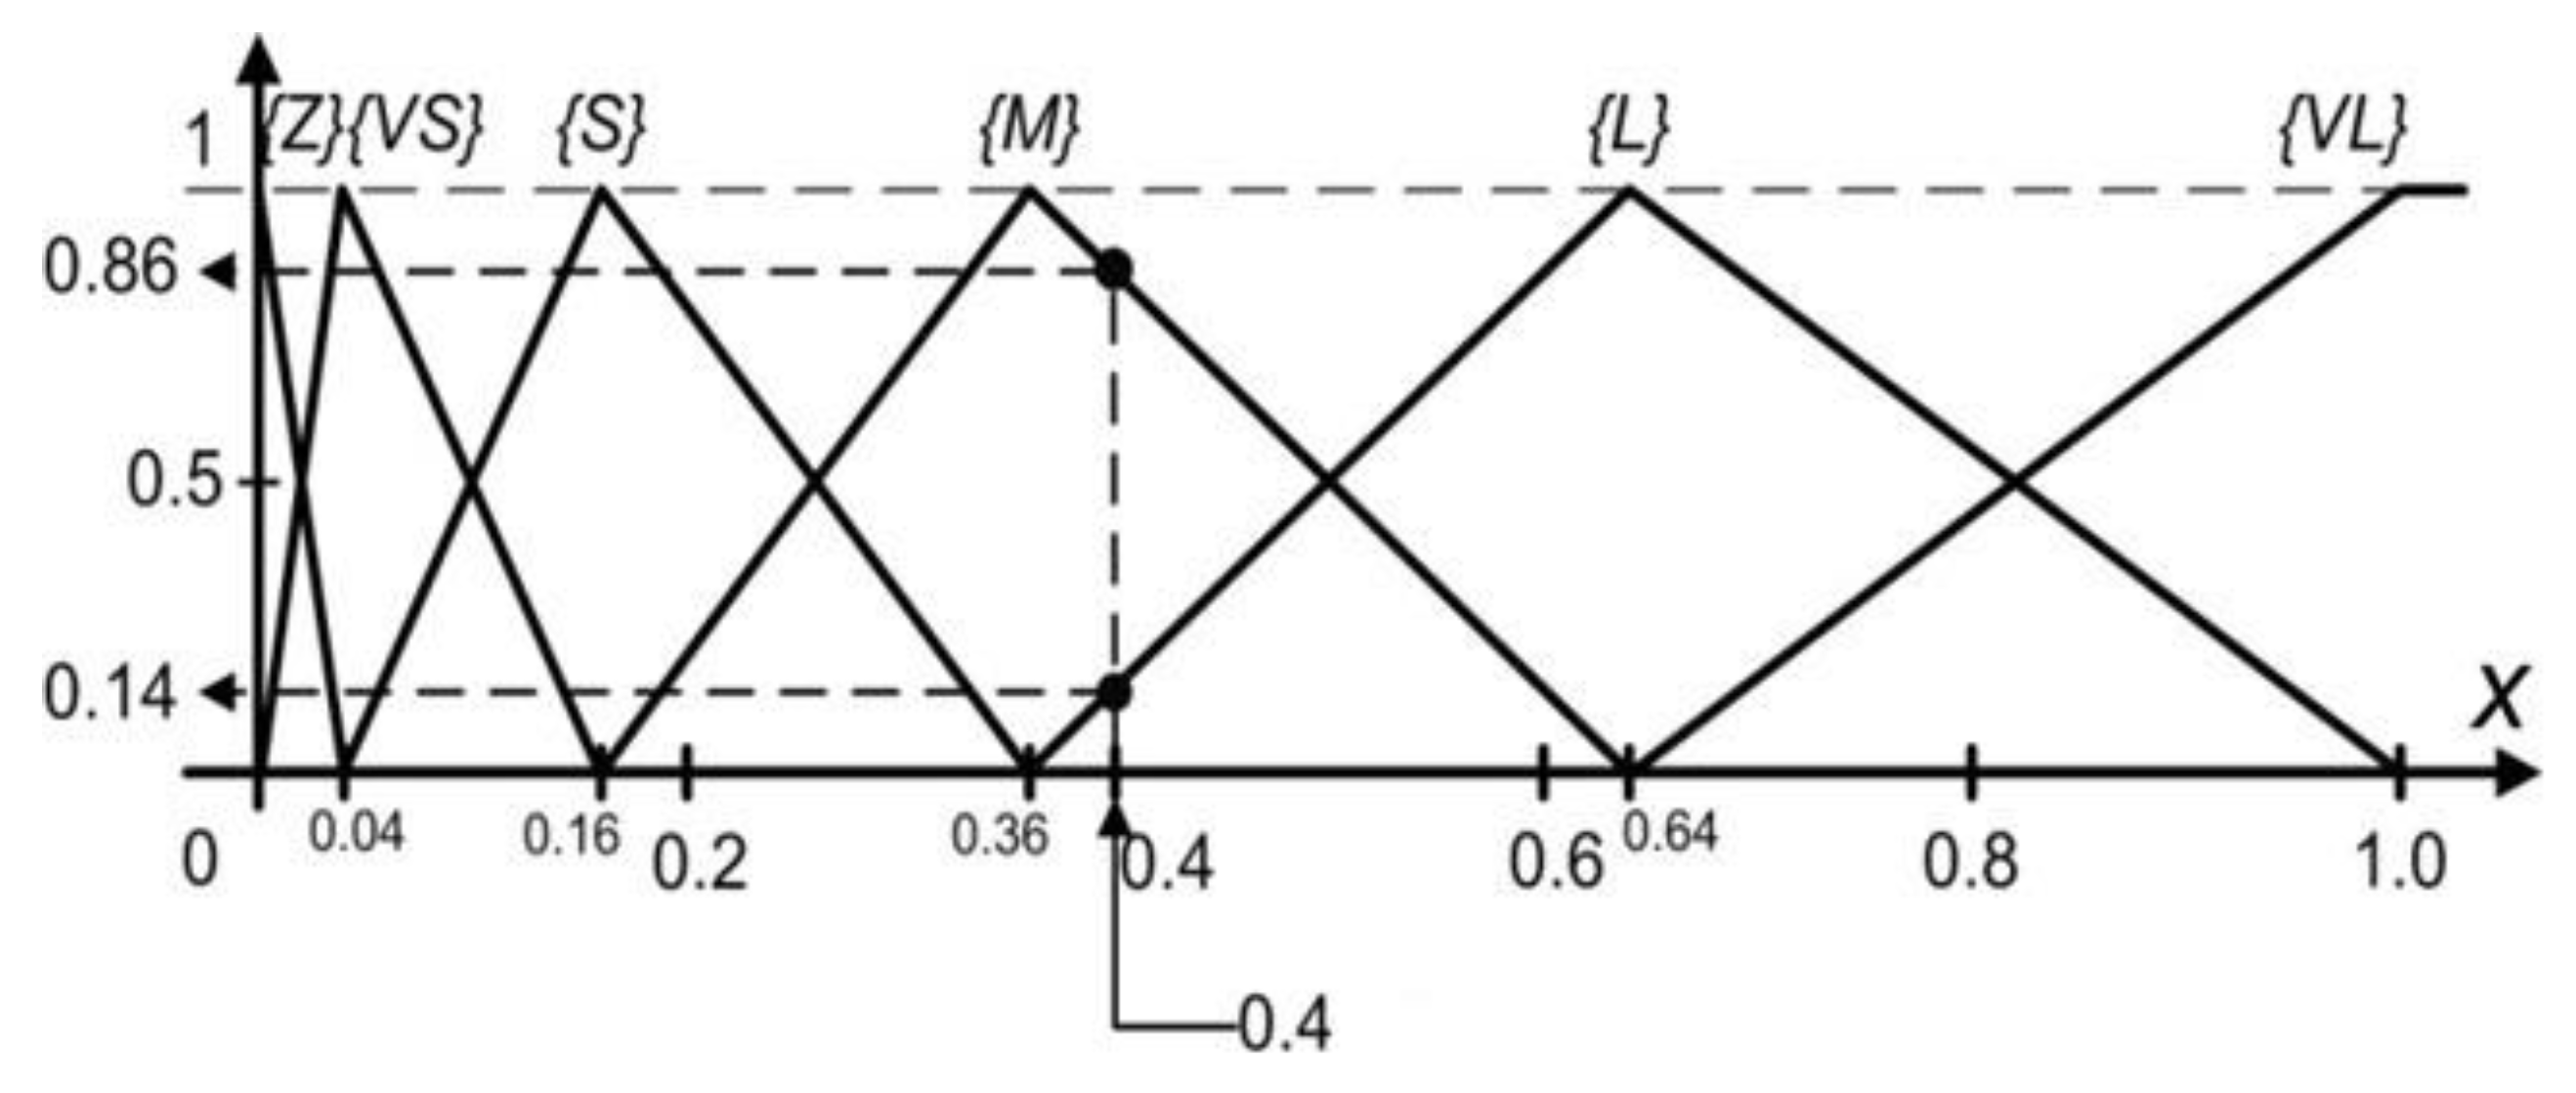
The functions of these six fuzzy terms are arranged according to the law of squares parabola (x-axis is divided into equal parts by the number of terms and each coordinate obtained after the division is squared—squared X coordinates are the vertices of fuzzy terms).
In this extended methodology, the SWOT questionnaire estimates are entered in verbal form, along with the certainties in the numerical (type 1 fuzzy relation) or verbal (type 2 fuzzy relation) form. The verbal terms are translated into numbers according to the specified certainty. If the certainty is given in verbal form, the first step is to convert the certainty value to the numeric form (the X coordinate point of the term vertex is taken). By a numerical certainty value, a horizontal line is drawn at that height, and the points of intersection with the given term are marked. If the certainty is at the maximum, such a point will be one; otherwise, there will be two points (called the left and right shoulders). The coordinates on the x-axis at these intersections are a numerical expression of the term with a given certainty. Since there may be several values, the value of the left shoulder is considered a pessimistic variant, and the value of the right shoulder is considered optimistic. The third (medium) value is averaged from them. An example of the numerical estimate obtained from a term by a given certainty in all three cases is presented in Figure 3, Figure 4 and Figure 5.
The inverse logic applies to the transformation from a numerical value to a fuzzy term with its certainty. A vertical line is drawn from the x-axis coordinate, and the points of intersection with the terms are marked. The resultant terms are considered those in which the vertical line intersects, and the certainty of these terms are at the points of the intersection of the y-axis coordinates. An example of a term with this certainty obtained from a numerical value is presented in Figure 6.
After the experts provide all the necessary data for the SWOT questionnaire, the total values of OP and TH are calculated by [28]. Further research of this method included an analysis of several interconnected situations under investigation, forming a SWOT network (called FSM—fuzzy SWOT maps) [31], in which the total OP and TH of one situation can influence the total OP and TH of another situation. A single SWOT analysis of the situation in the environment e becomes a SWOT-enginee node in the network. A graphical scheme of a SWOT engine node is presented in Figure 7.
The single SWOT analysis can be called stage 1, the interconnected multiple SWOT analyses network stage 2, and now, we move onto stage 3, the risk assessment based on the SWOT analysis.
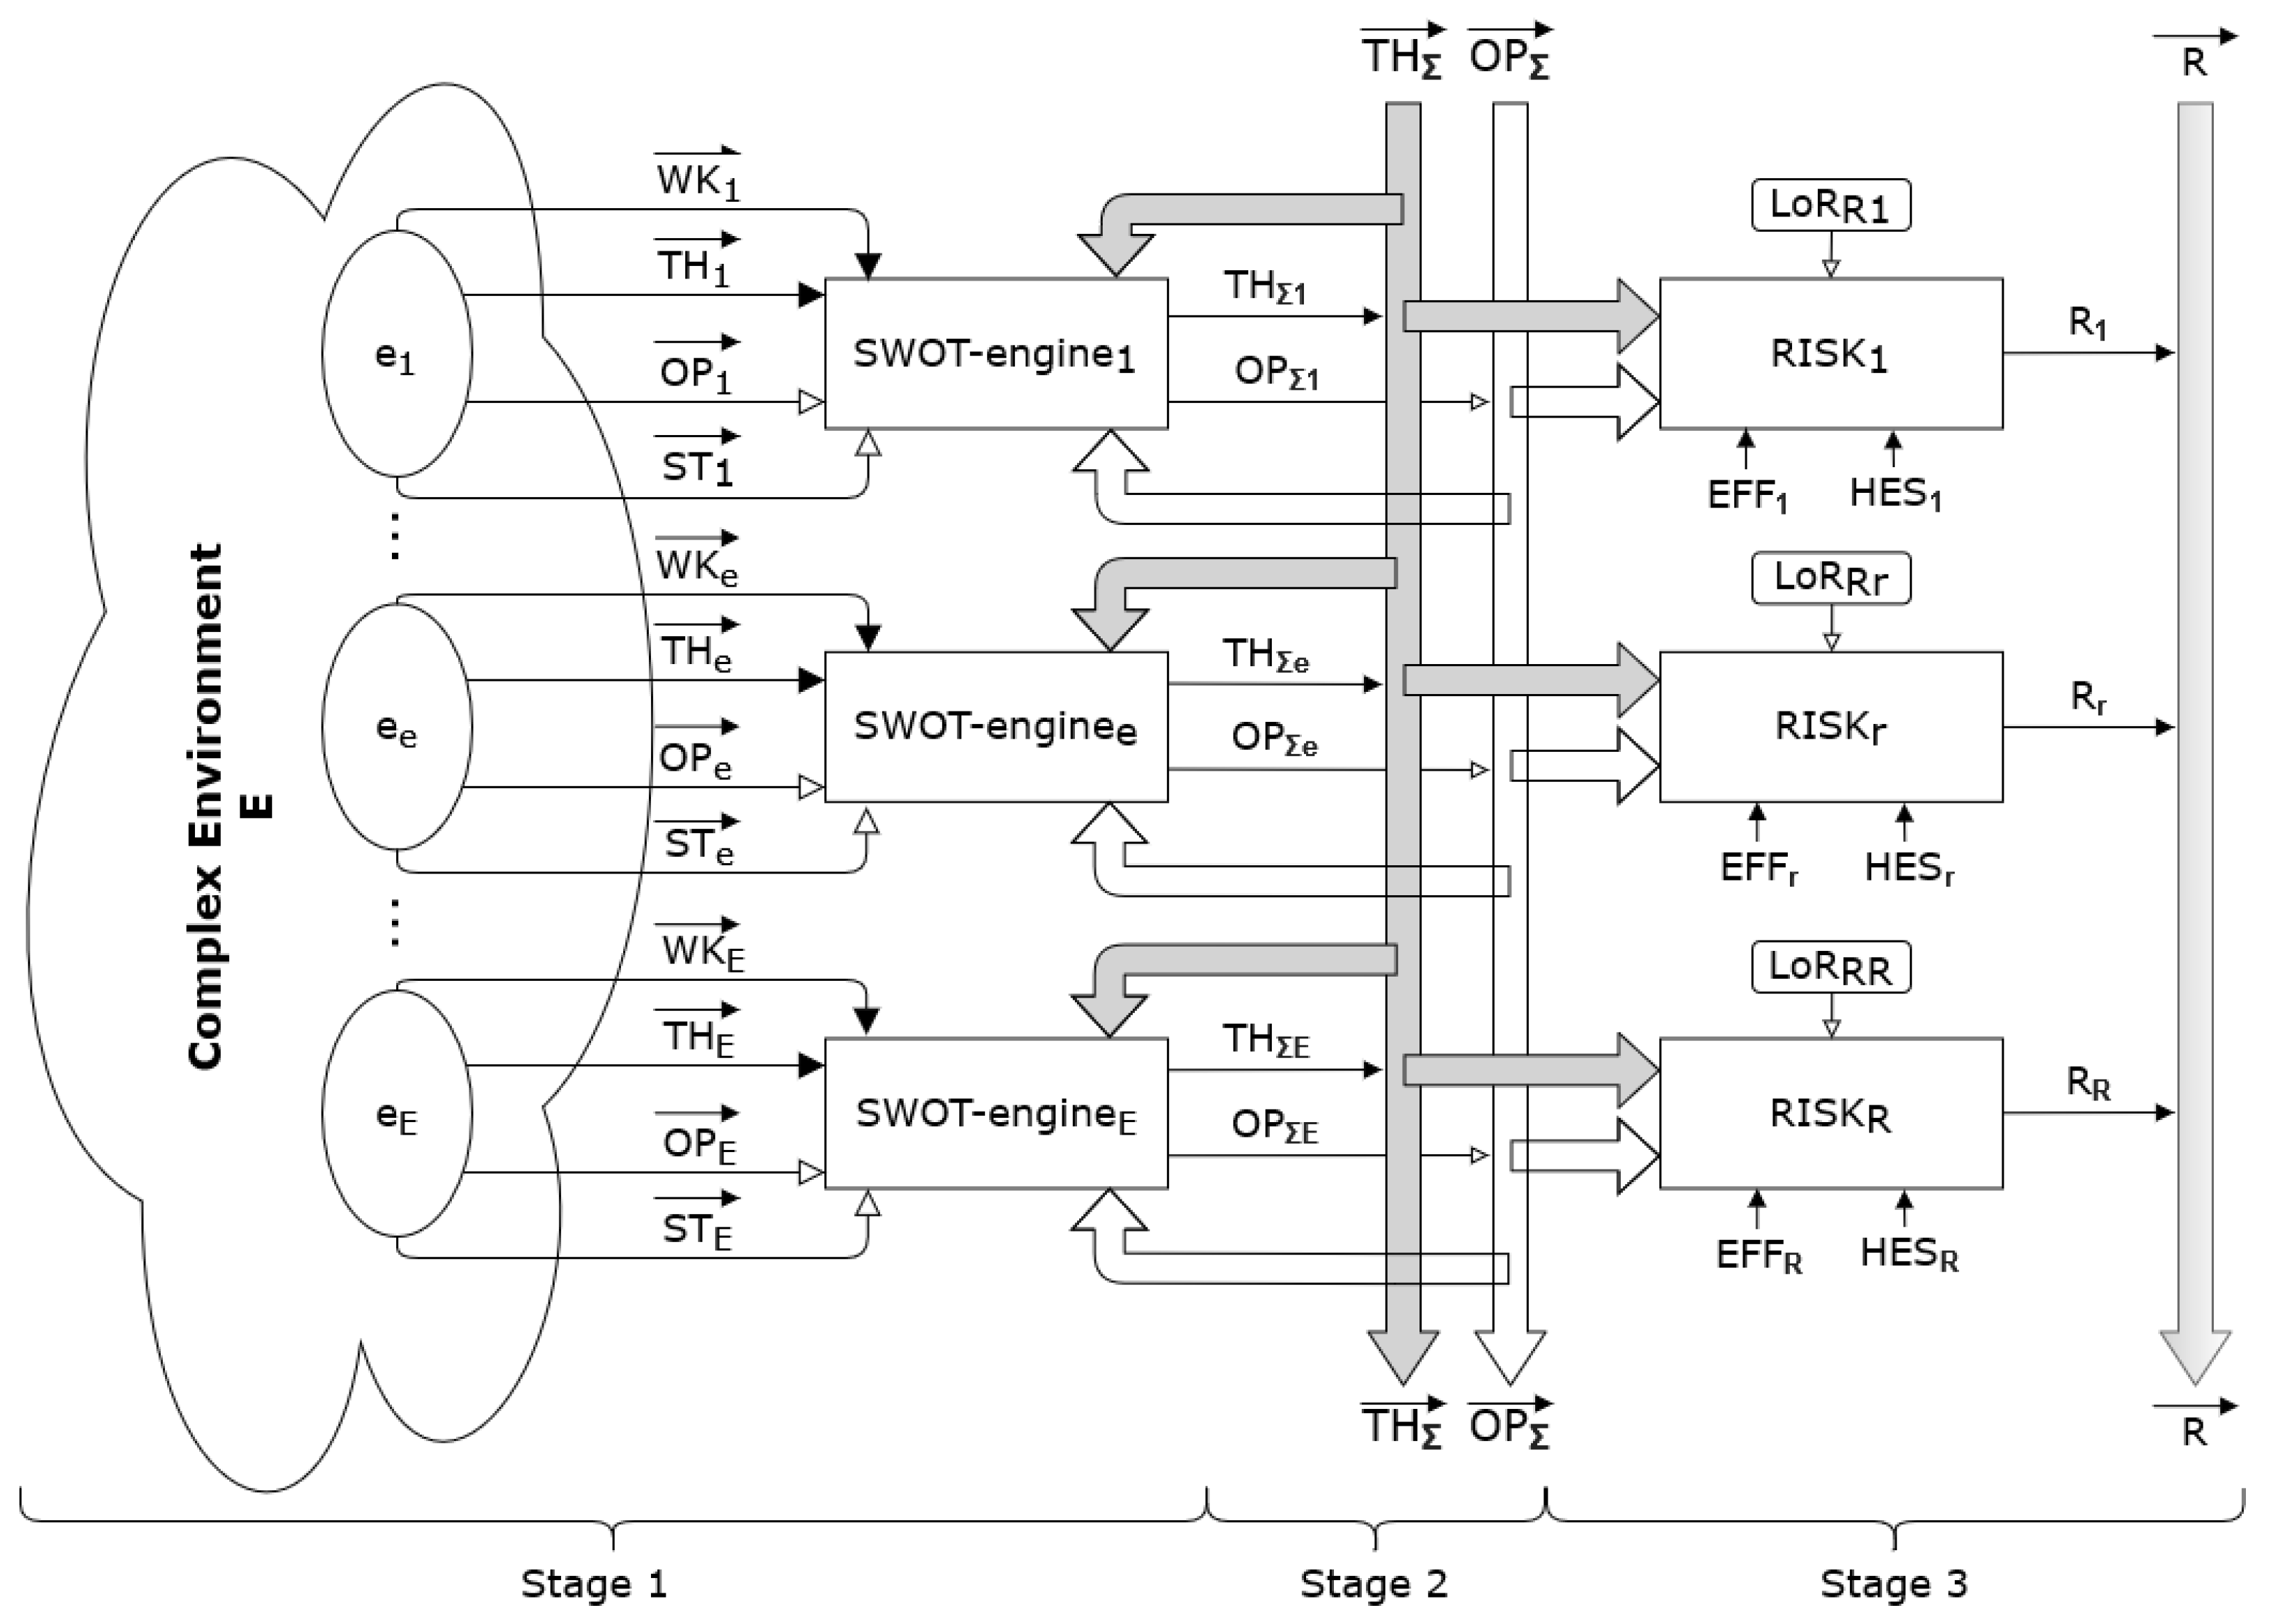
Functional organization of all the subsystems, described in Section 3, are implemented in the structure, presented in Figure 8.
According to the formed risk Formula (1), we already have OP and TH values from the SWOT analysis (first two stages), so, in addition, using the same verbal situation description methodology, experts must evaluate the EFF and HES parameters and, most importantly, construct a block of rules (IF… THEN type list or fuzzy rules (LoR)) to determine the risk. The fuzzy risk rules list is presented in Table 1.
α—fuzzy term from the vocabulary of (4). Since our vocabulary consists of six terms and we have four risk parameters, the rule block consists of a total of 64 = 1296 rules. Rule blocks and rule counts are described more in [32]. The rule block contains information about the risk values under certain conditions (OP, TH, EFF, and HES values). Based on the OP and TH values obtained in the first two steps of the SWOT analysis, as well as the EFF and TH values evaluated by experts, it is determined which risk-specific rules from the formed rules block are covered. Since the OP, TH, EFF, and HES values in the rules block are in verbal form, each has its own certainty. For each selected rule, a minimum certainty is selected from these four risk parameters and assigned to the estimated risk value from that rule, as shown in (5):
i { 1 , , n } .   [ R I S K , c e r t ] = min _ c e r t ( O P [ i ] ,   T H [ i ] ,   E F F [ i ] ,   H E S [ i ] ) w h e r e   i r o w   n u m b e r   o f   t h e   r u l e   b l o c k
An array of the risk terms and their certainties are calculated, from which the highest certainty for each risk term needs to be selected, as shown in (6):
j { 1 , , r } .   [ F i n a l _ R I S K , c e r t ] = max _ c e r t ( R I S K [ j ] ) , w h e r e   j F i n a l _ R I S K   i n d e x min _ c e r t ( O P [ i ] ,   T H [ i ] ,   E F F [ i ] ,   H E S [ i ] )
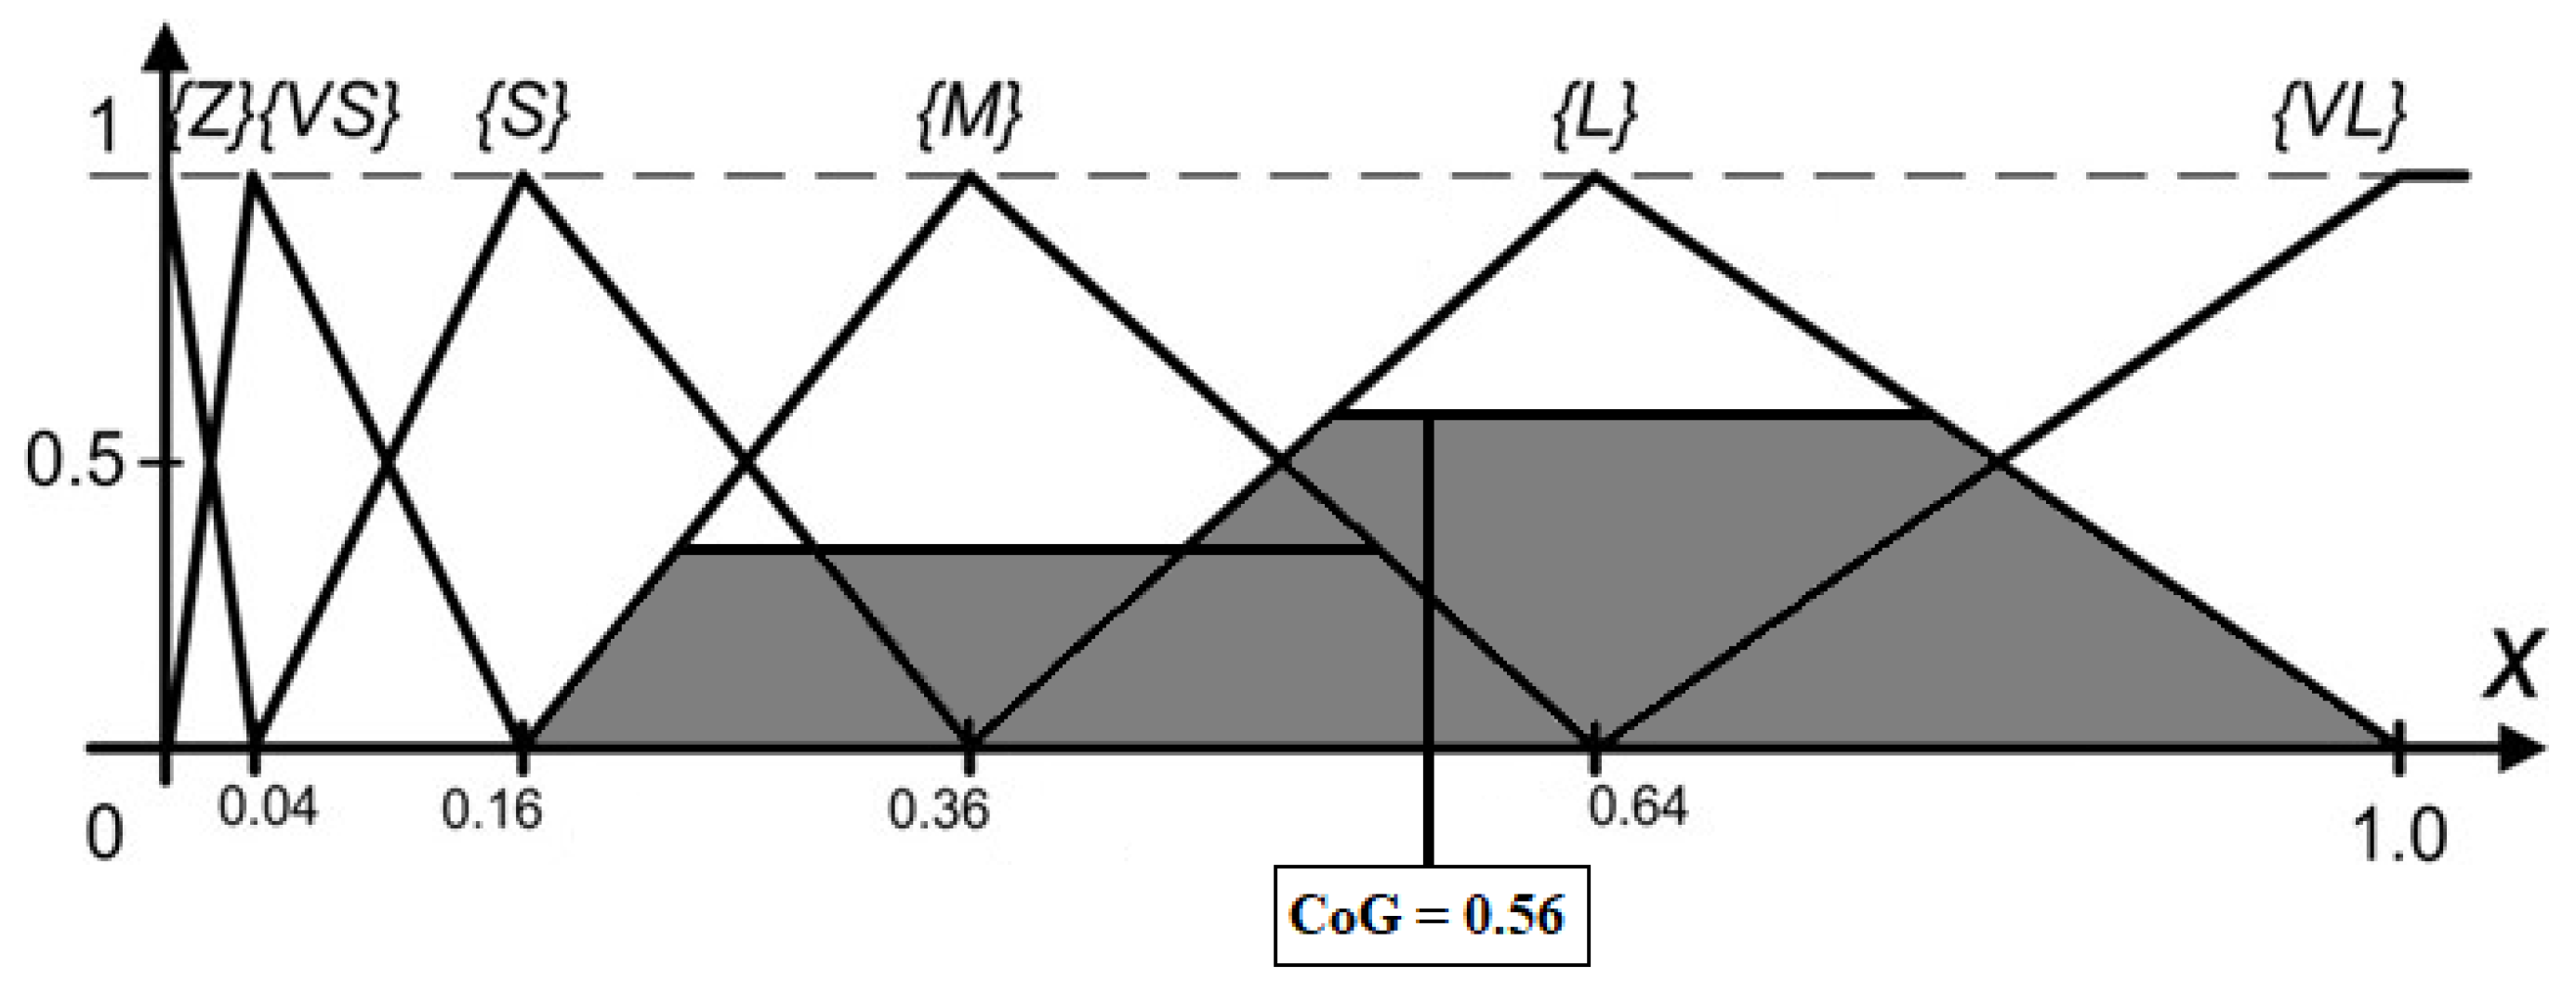
After this step, we have the final risk terms with their certainties, as presented in Figure 9.
The final output Rr can be aggregated using different strategies, but the CoG (center of gravity) method [33] is used throughout this paper for its simplicity and effectiveness. The final risk evaluation is calculation according to CoG method by using geometry of the fuzzy terms as presented in (7):
C o G = i = 1 R a r e a i m i d p o i n t X ( t o p _ b a s e i ) i = 1 R a r e a i
The risk results are presented in both numerical and verbal form and from three perspectives: optimistic, pessimistic, and medium, as in the first two stages of risk estimation methodology (SWOT analysis stages). It is worth emphasizing that some parts of Figure 8 may not be present to calculate the results (modular structure), e.g., calculated threats from the SWOT analysis can be considered a risk measurement, as in [34].

4. Implementation of Risk Assessment System

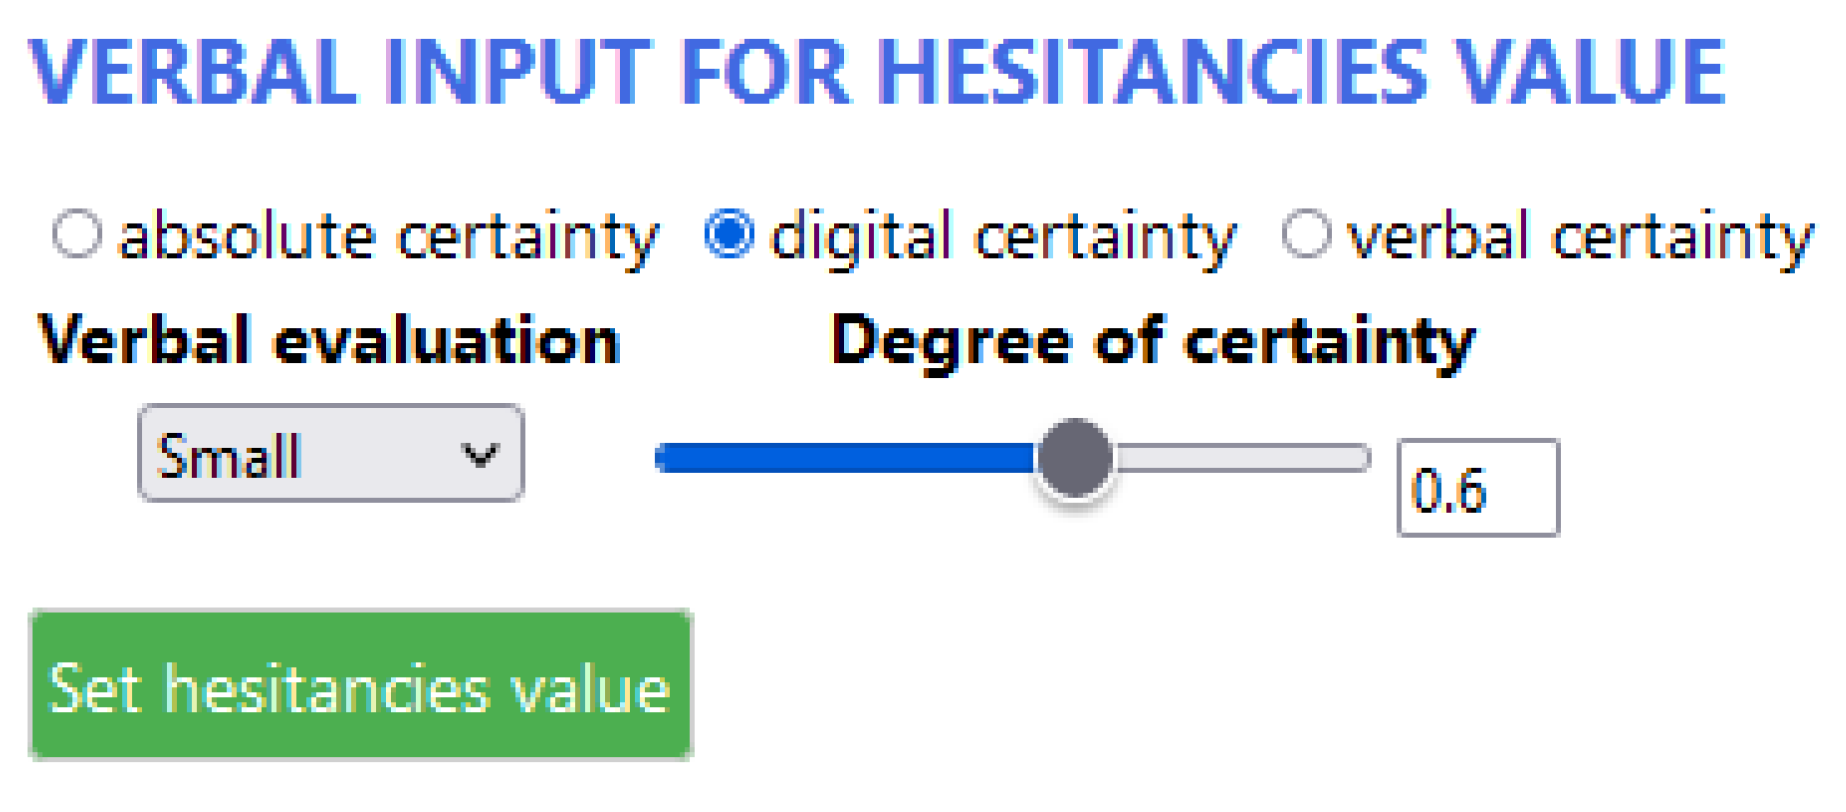
Following the extension of the FSM methodology [31], the existing prototype software tool has also been extended with a module for the risk assessment. The extended tool added the possibility for the expert to evaluate the efforts (EFF) and hesitancies (HES) values for the risk assessment of each situation or project under investigation. An example of the hesitancies input window is presented in Figure 10.
The input windows for the effort and hesitancy values are the same. As in the previous steps of the SWOT analysis, the evaluation is entered verbally and can certainty be expressed in three ways: absolute, digital, and verbal. After the EFF and HES values are entered, all four components required for the risk assessment are available, and the expert can proceed by expressing the risk rules.
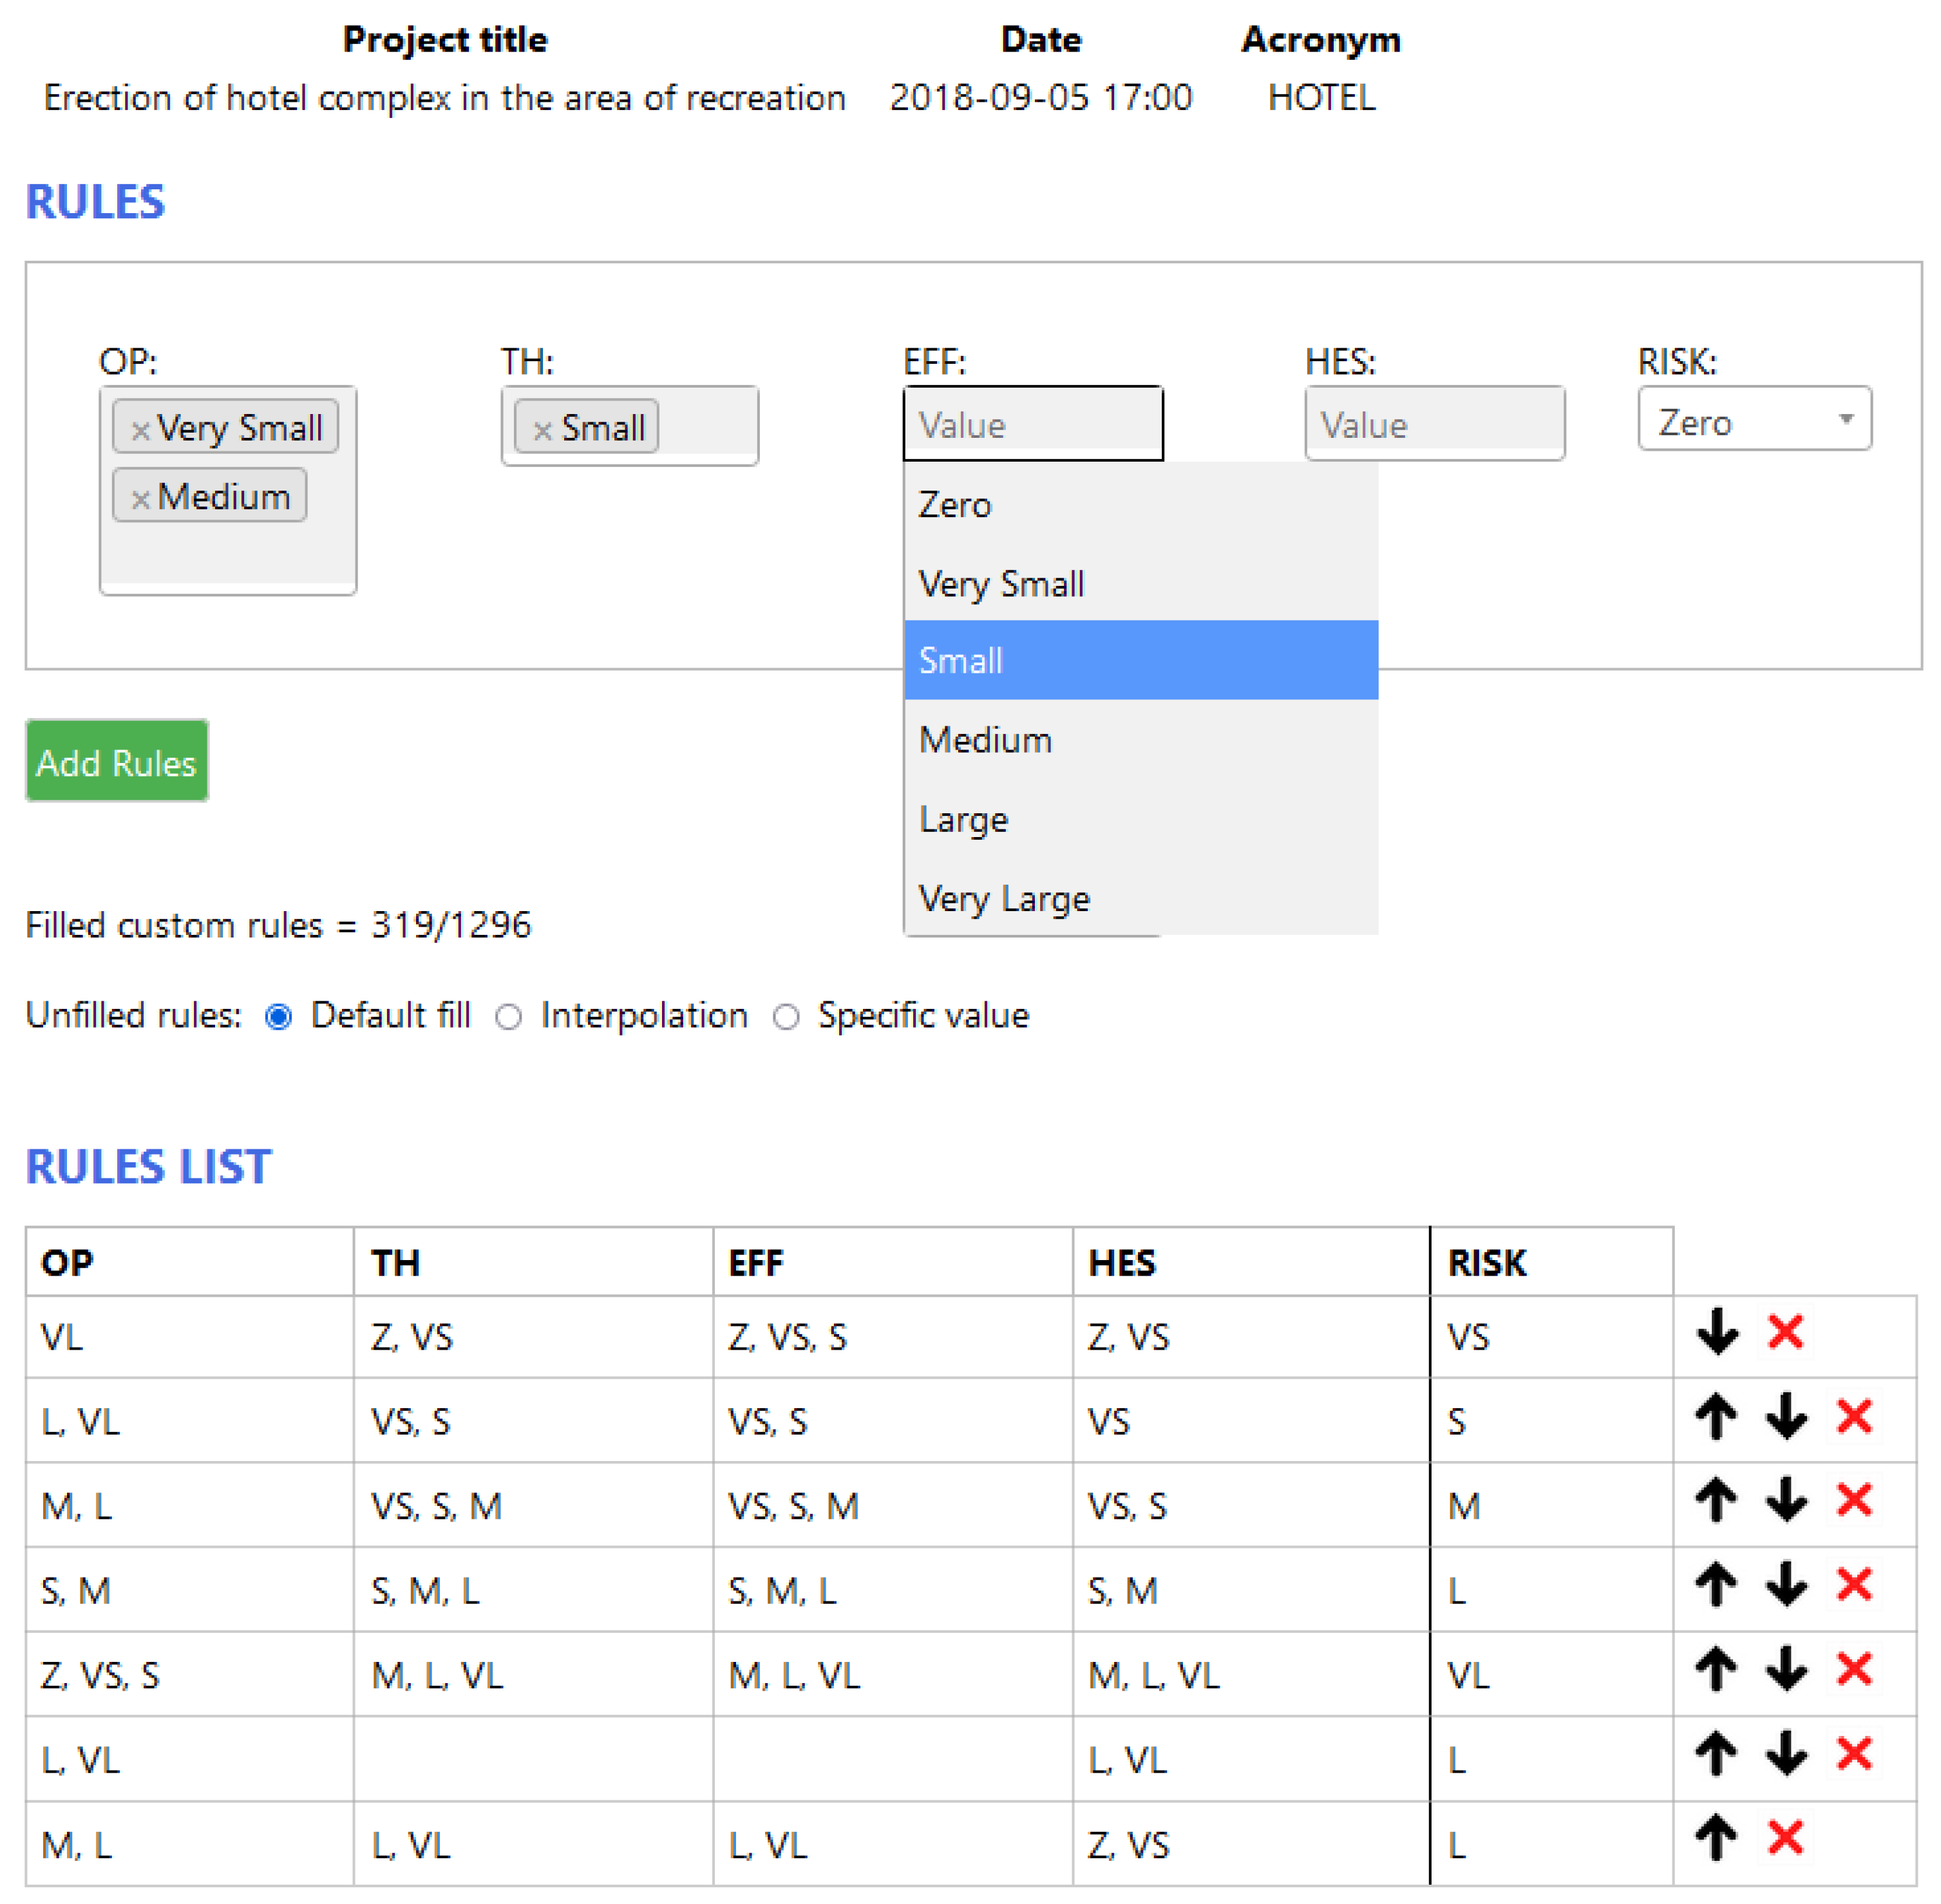
An example of entering a block of risk rules is shown in Figure 11.
The final risk is calculated according to this block of rules. The entire rule block (all possible combinations of OP, TH, EFF, and HES) would consist of 1296 rule block lines, which would be an overwhelming task for the expert to enter them all. For this purpose, a possibility has been created to mark several values, so that more combinations can be covered, for which a certain risk value is obtained. The user can select multiple values or leave the box blank (this option is treated as all value selections). Using this mechanism, an expert can describe a situation by entering several combinations of essential rules. Since combined rules can overlap, they are listed in descending order of priority, and there are also specially made arrow and cross buttons in the right side to move or remove rules. Additionally, when the expert enters the rules, the program shows what part of the whole block they cover, and there is a choice from three options of how to fill in the uncovered rules:
  • Default fill—The entire rule block is already filled with default precalculated risk values, and only those that are specified will be overridden.
  • Interpolation—Missing rules in the block are interpolated according to the entered values.
  • Specific value—User enters a specific risk value for the undefined rules.
The risk is calculated based on the following Algorithmic 1 pseudocode:
Algorithmic 1. Risk estimation
Load OP, TH, HES, EFF and RulesBlock
Calculate two times (pessimistic and optimistic):
Get fuzzy terms and certainties for OP, TH, EFF, HES according to defined vocabulary (set OPTermsAndCert, ThTermsAndCert, EffTermsAndCert, HesTermsAndCert)
Set leftSideRules to []
for each OPTermCert in OPTermsAndCert do
  for each THTermCert in THTermsAndCert do
    for each EFFTermCert in EFFTermsAndCert do
      for each HESTermCert in HESTermsAndCert do
        set minCert to Min(OPTermCert.cert, THTermCert.cert, EFFTermCert.cert, HESTermCert.cert)
        leftSideRules add minCert and rulesRow from RulesBlock according to OPTermCert.term, THTermCert.term, EFFTermCert.term and HESTermCert.term
Set riskTermsAndCertainties to []
for each rule in leftSideRules do
  if riskTermsAndCertainties contains term from rule then
    set index = index of riskTermsAndCertainties.term is equal to rule.term
    if rule.cert > riskTermsAndCertainties[index].cert then
      riskTermsAndCertainties[index].cert = rule.cert
    else
      riskTermsAndCertainties add rule
    end if
set dividentSum to 0
set divisorSum to 0
for each riskTermCert in riskTermsAndCertainties do
  set area to riskTermCert polygon area
  set midpointX to riskTermCert polygon upper hizontal midpoint on X axis
  dividentSum = dividentSum + midpointX * area
  divisorSum = divisorSum + area
set CoG = dividentSum/divisorSum
set Risk[pes] to smaller CoM value
set Risk[opt] to greater CoM value
set Risk[med] to (Risk[pes]+Risk[opt])/2
Additionally, convert the risk results to verbal values.
Once the final risk has been calculated, as in the previous stages, it is represented graphically and textually in numerical and verbal formats.

5. Experimental Simulation

To test the validity of the idea, a scenario of three interconnected situations in Palanga City was used to evaluate the risk by using the extended prototypical software tool. These situations have already been analyzed until stage 2 in previous articles [28,31], so the work continues with the stage 3 risk assessment, and we evaluated the required risk factors. The values of the efforts and hesitancies evaluated for each project are presented in Table 2.
Achieving the OP and TH values obtained from the second step of the methodology together with the EFF and HES values assessed in the third step of the methodology, the experts must create a fuzzy IF… THEN… type rule block according to Table 1 for each project, using the instruments provided by the tool, as shown in the Figure 11. The tool allows experts to create a block of rules by entering only important rules (others filling automatically) and also provides the possibility to enter multiple rule combinations. The rules in the block indicate the values of the OP, TH, EFF, and HES components that determine the specified risk value. Since the tool allows multiple combinations to be entered in a single row, conditions may arise under which the transformation of several such complex rows into the risk rules will result in an overlap. In this case, the risk block rules obtained after the transformation from the rows in the list above take precedence and overwrite those in the lower positions.
Risk rules for the GAS STATION project are presented in Table 3.
Risk rules for the HOTEL project are presented in Table 4.
Risk rules for the LOBBY project are presented in Table 5.
The risk rules entered into the tool are transmitted to the fuzzy IF… THEN… type rule blocks for each project, filling the unspecified rules with the default filler (precalculated averages). Using the proposed risk assessment methodology, the risk values of each project are calculated from pessimistic, medium, and optimistic perspectives in numerical expressions and additionally translated into verbal descriptions for the presentation of the results.
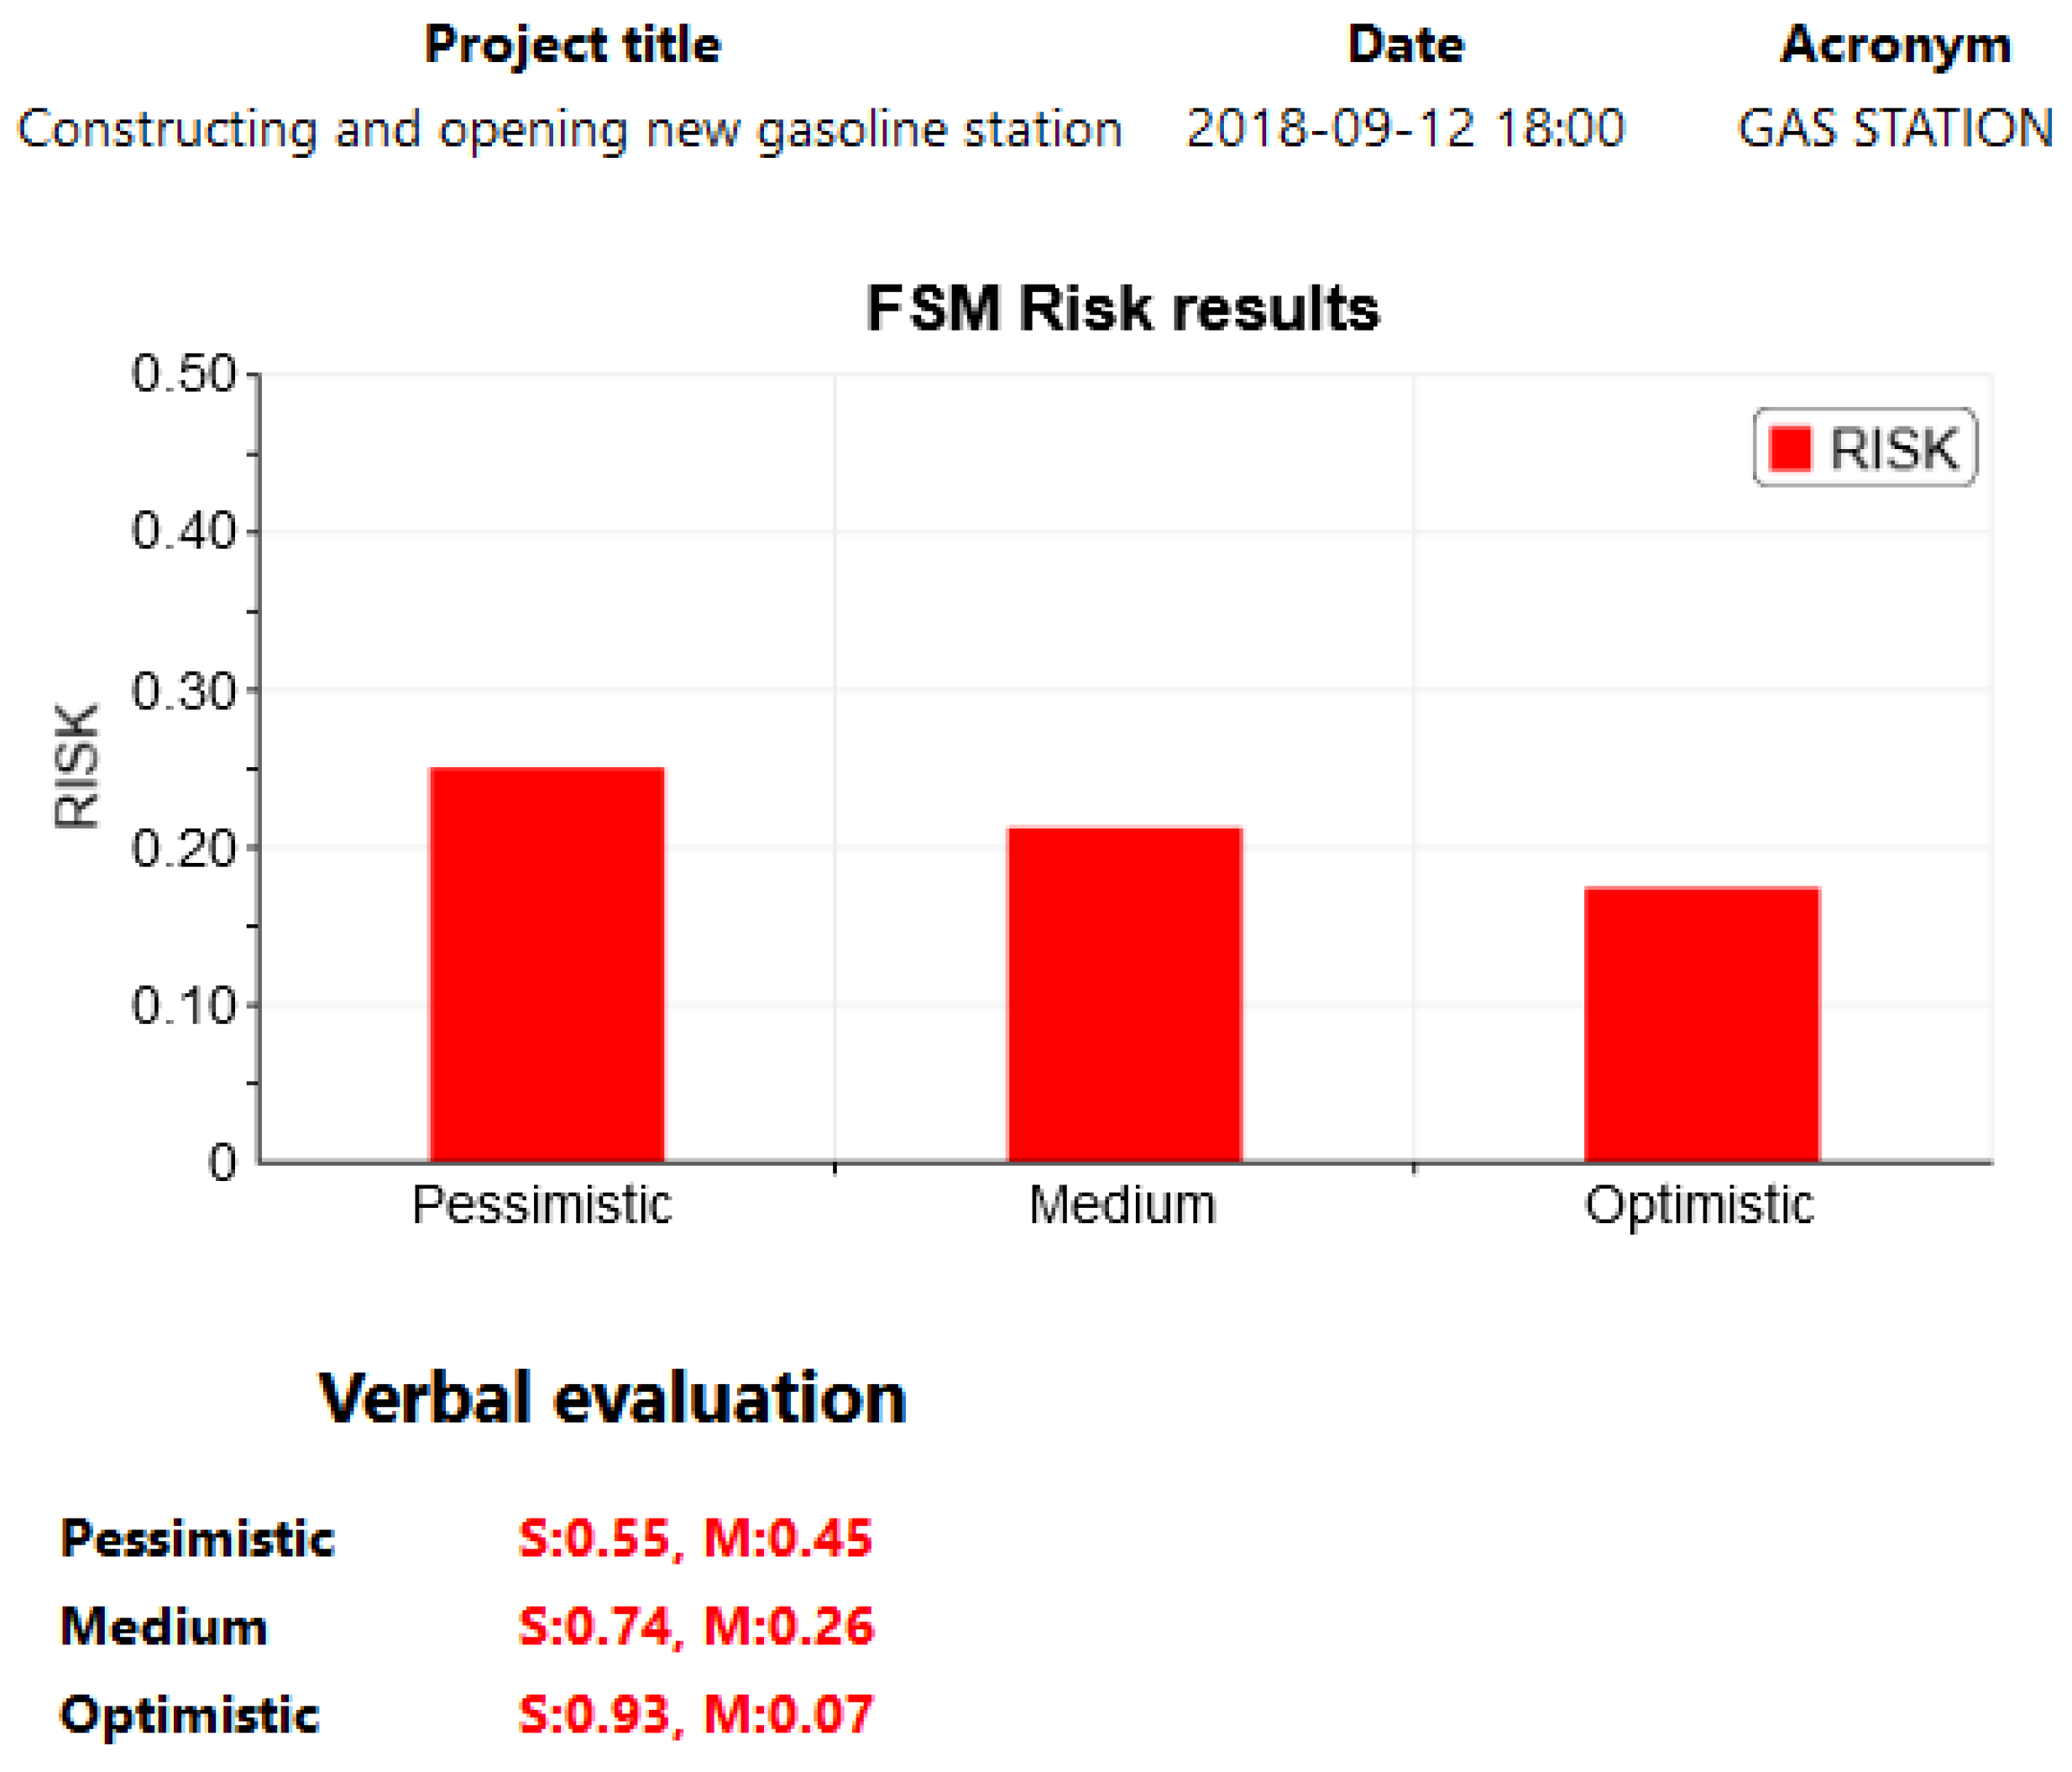
The GAS STATION project risk results are presented in Figure 12.
The HOTEL project risk results are presented in Figure 13.
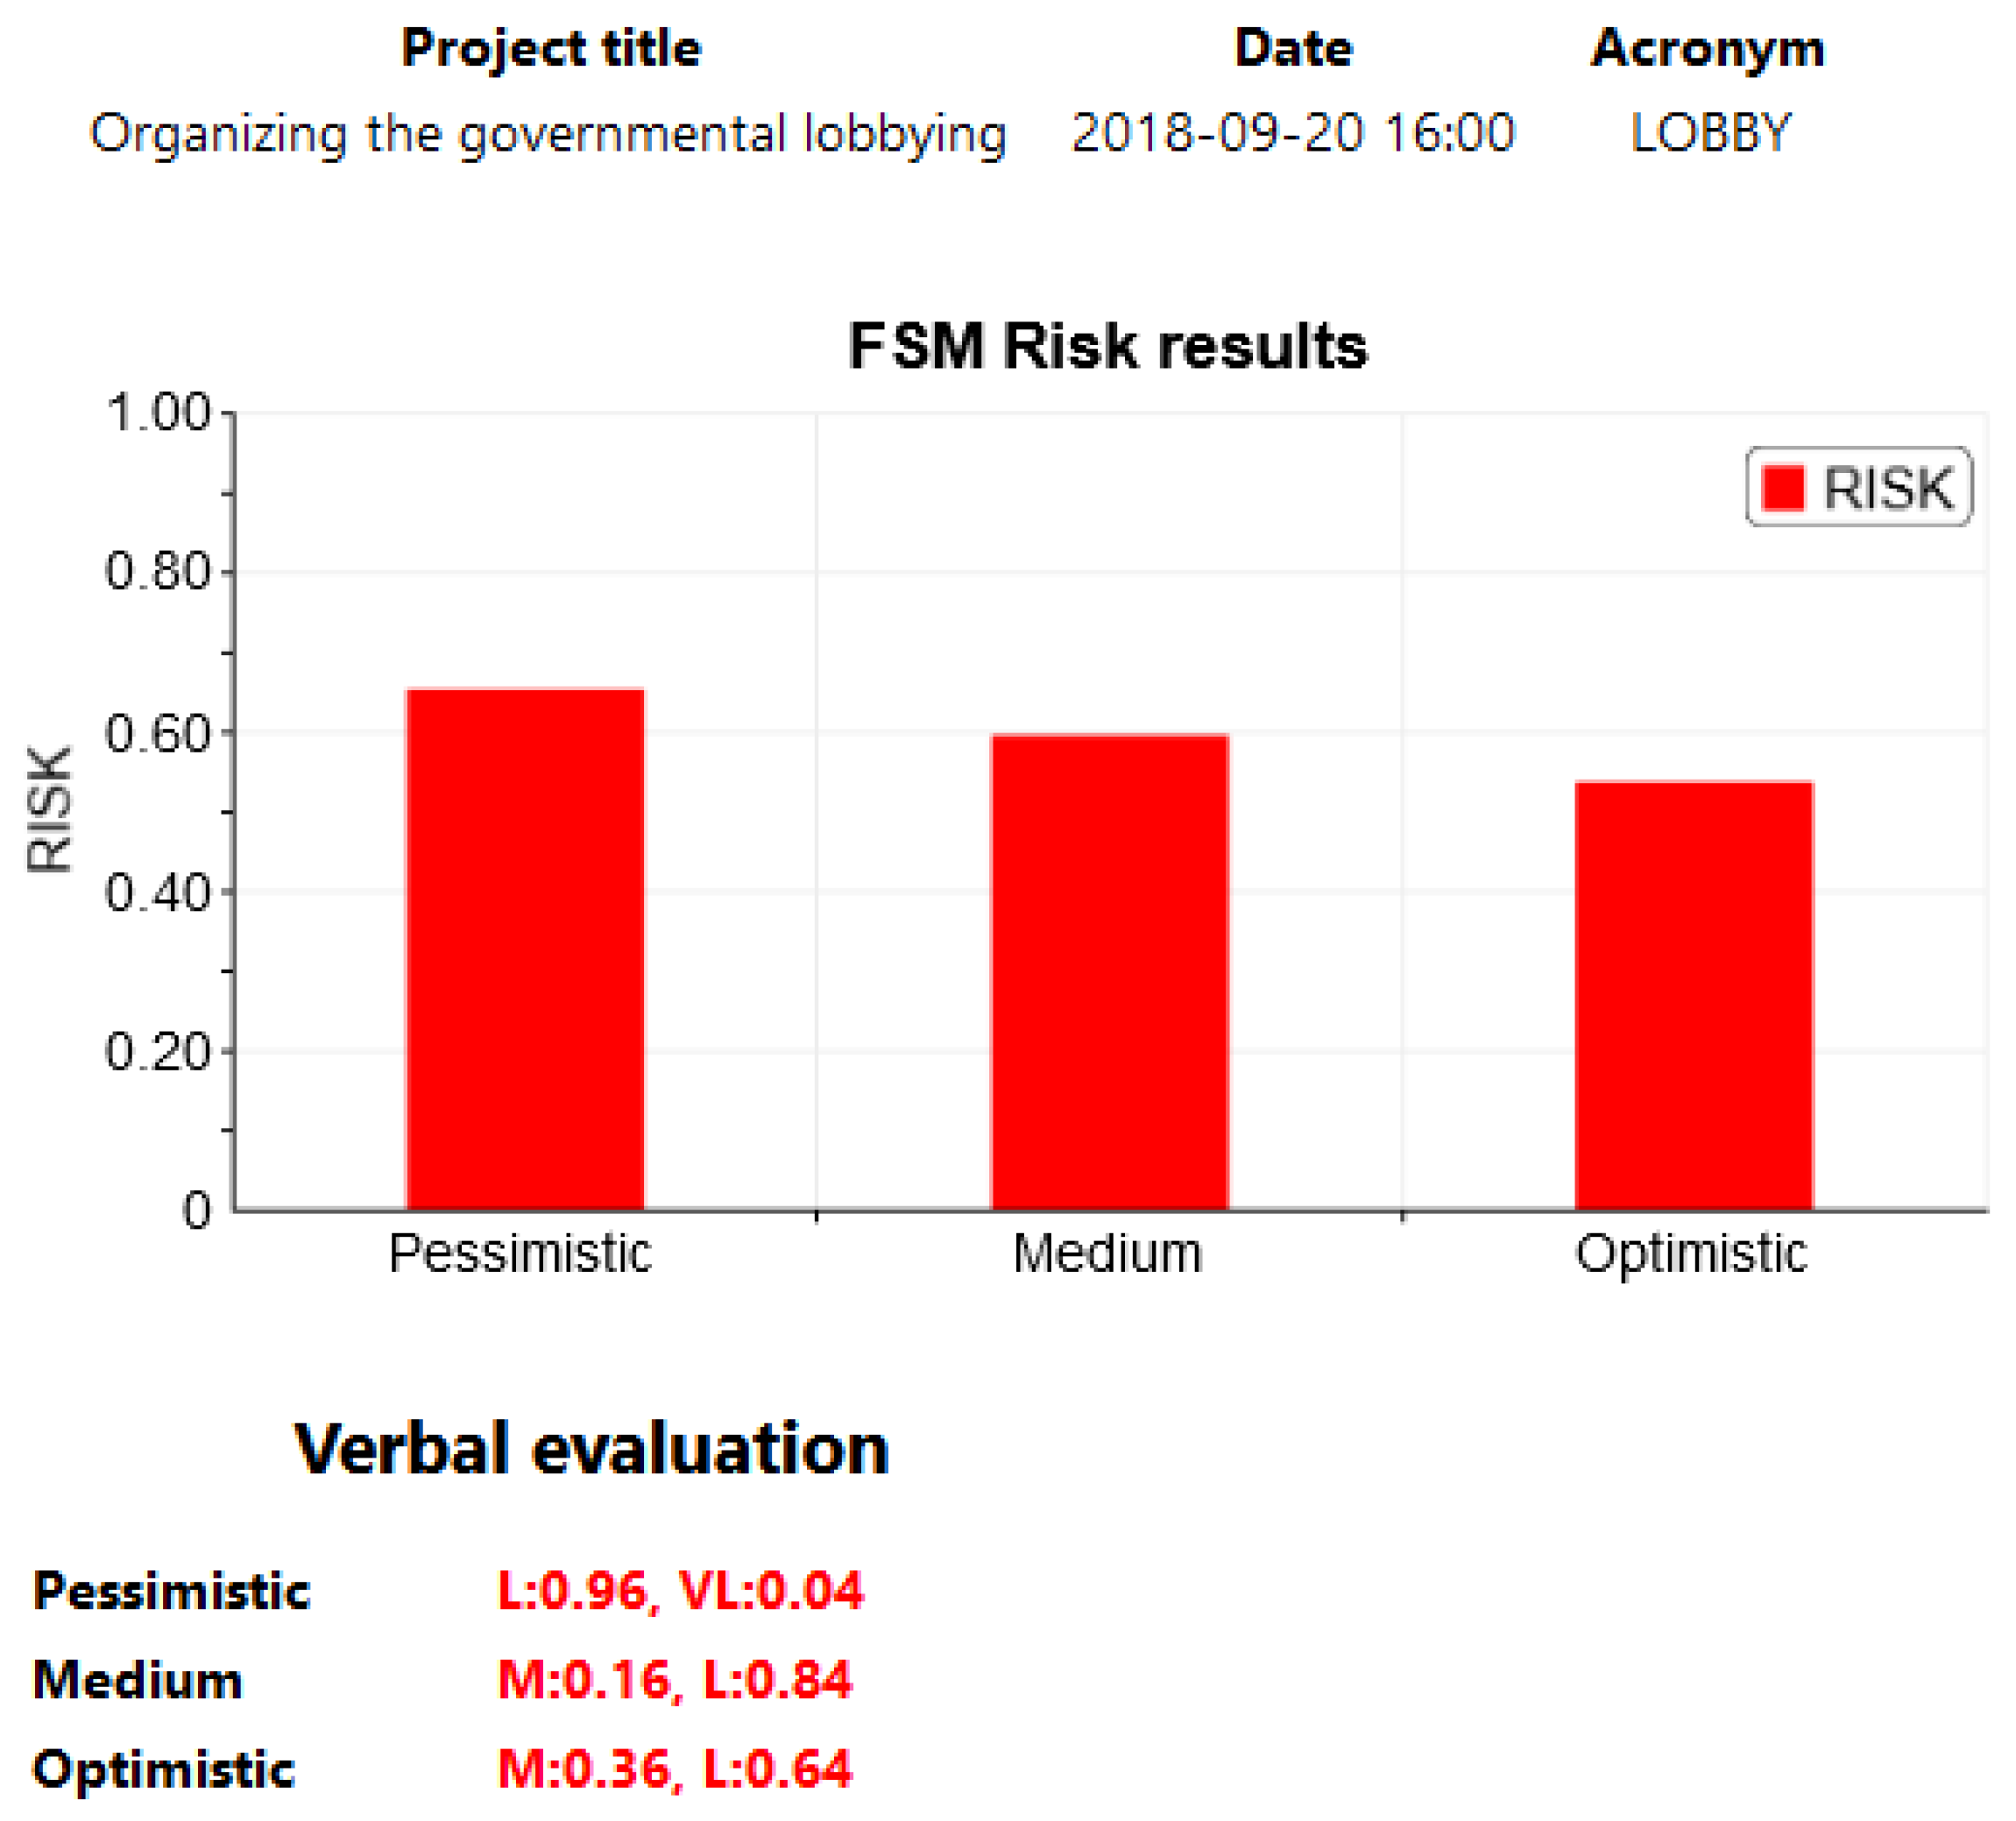
The LOBBY project risk results are presented in Figure 14.
Figure 12, Figure 13 and Figure 14 show the numerical risk estimation results as bar charts and the verbal results in text format, providing verbal evaluation with a degree of certainty. Using numerical values corresponding to the bar charts, together with verbal evaluations, a summary of all the projects risk results is presented in Table 6.
The final results interpretations could be as follows:
  • The estimated risk for project LOBBY is relatively high, but the decision-maker may accept the risk due to the dynamics of the field.
  • In the case of the HOTEL project, the risk varies between pessimistic and optimistic perspectives. The decision-maker must assess whether such an outcome is more indicative of the potential value through risk or whether the project is too risky to implement.
  • In the case of GAS STATION, the risk is relatively low in all three perspectives, so it is likely that the decision-maker will be more inclined to implement the project based on this result.

6. Concluding Remarks

In this paper, a brand-new concept of risk assessment based on SWOT analysis was proposed. The first two steps of the analysis have already been implemented [28,31], and at this stage, the risk assessment has been connected. To check the validity of the idea, the prototype software tool was expanded, and a risk analysis of three interrelated situations was performed. The obtained results indicate the applicability and extensibility of the methodology. The whole approach is supported by the opinion of Francisco Herrera, who wrote “In the future, more priority deriving methods will be done and we will adapt the IFANP to solve other MCDM problems, such as R&D project selection, strengths, weaknesses, opportunities, and threats (SWOT) analysis, logistics service provider selection, production planning and so forth.” [35].
Explainable artificial intelligence (XAI) elements were used in this methodology, such as the process of imitating human reasoning, verbal information processing, accumulation of expert knowledge in rules, fuzzy logic, traceability of the reasoning process, partially verbal explanation of results, and verbal assessment and its certainty.
The main weakness of the proposed approach is that the input data rely solely on expert knowledge, and there is no other way to assess the specific dynamics of the field. Future works include research for solutions to this problem by additionally connecting separate modules for the input data to the methodology collected from the real environment and transformed to be suitable for processing. Another weakness is the lack of an interaction estimation between separate project risks, which may have a significant impact on the results, and the lack of an overall risk calculation for all projects, which is also left for a future work. Further research also has to focus on the optimization of the assessed risks by introducing a feedback loop to find the parameters for which the risk would be minimal or acceptable.

Author Contributions

Conceptualization, Z.M. and E.K.; data curation, Z.M.; formal analysis, Z.M.; funding acquisition, E.K.; investigation, Z.M.; methodology, Z.M.; project administration, E.K.; resources, E.K.; software, Z.M.; supervision, E.K.; validation, Z.M.; visualization, Z.M.; writing—original draft preparation, Z.M.; writing—review and editing, Z.M. All authors have read and agreed to the published version of the manuscript.

Funding

This research received no external funding.

Conflicts of Interest

The authors declare no conflict of interest.

References

  1. Survila, A. Nepaprastųjų Situacijų Valdymas; Mykolas Romeris University: Vilnius, Lithuania, 2015. [Google Scholar]
  2. ISO 31000. Risk Management-Principles and Guidelines; International Organization for Standardization: Geneva, Switzerland, 2009; pp. 15–21. [Google Scholar]
  3. Jaeger, C.C.; Webler, T.; Rosa, E.A.; Renn, O. Risk, Uncertainty and Rational Action; Routledge: London, UK, 2001. [Google Scholar]
  4. Lowrance, W.W. Of Acceptable Risk: Science and the Determination of Safety; William Kaufman Inc.: Los Altos, CA, USA, 1976. [Google Scholar]
  5. Kaplan, S.; Garrick, B.J. On the quantitative definition of risk. Risk Anal. 1981, 1, 11–27. [Google Scholar] [CrossRef]
  6. Crouch, E.A.; Wilson, R. Risk/Benefit Analysis; Harvard University Press: Cambridge, MA, USA, 1982. [Google Scholar]
  7. Moore, P.G.; Moore, P.G. The Business of Risk; Cambridge University Press: Cambridge, MA, USA, 1983. [Google Scholar]
  8. Dolce, M.; Kappos, A.; Zuccaro, G.; Coburn, A.W. Report of the EAEE Working Group 3: Vulnerability and risk analysis. In Proceedings of the 10th European Conference on Earthquake Engineering, Vienna, Austria, 28 August–2 September 1994. [Google Scholar]
  9. Henley, E.J.; Kumamoto, H. Probabilistic Risk Assessment and Management for Engineers and Scientists, 2nd ed.; IEEE Press: Piscataway, NJ, USA, 1996. [Google Scholar]
  10. Rosa, E.A. Metatheoretical foundations for post-normal risk. J. Risk Res. 1998, 1, 15–44. [Google Scholar] [CrossRef]
  11. Crichton, D. The risk triangle. Nat. Disaster Manag. 1999, 102–103. [Google Scholar]
  12. Clemens, P.L. Comments on the MIL-STD-882D example risk assessment matrix. J. Syst. Saf. 2000, 36, 20–24. [Google Scholar]
  13. International Electrotechnical Commission. Risk Management-Vocabulary-Guidelines for Use in Standards; International Organization for Standardization (ISO): Geneva, Switzerland, 2002. [Google Scholar]
  14. Campbell, J.Y.; Viceira, L.M. The term structure of the risk-return trade-off. Financ. Anal. J. 2005, 61, 34–44. [Google Scholar] [CrossRef] [Green Version]
  15. Damodaran, A. Equity risk premiums (ERP): Determinants, estimation and implications. Financ. Mark. Inst. Instrum. 2009, 18, 1–82. [Google Scholar] [CrossRef]
  16. Aven, T.; Renn, O. On risk defined as an event where the outcome is uncertain. J. Risk Res. 2009, 12, 1–11. [Google Scholar] [CrossRef]
  17. Marchand, M.; Buurman, J.; Pribadi, A.; Kurniawan, A. Damage and casualties modelling as part of a vulnerability assessment for tsunami hazards: A case study from Aceh, Indonesia. J. Flood Risk Manag. 2009, 2, 120–131. [Google Scholar] [CrossRef]
  18. Aven, T. On some recent definitions and analysis frameworks for risk, vulnerability, and resilience. Risk Anal. Int. J. 2011, 31, 515–522. [Google Scholar] [CrossRef] [PubMed]
  19. Miheyeva, N. Dynamics of the Development of ’Risk’ Notion in the Psychological Science and its Interdisciplinary Discourse. Soc. Nat. Sci. J. 2012, 5, 1–6. [Google Scholar] [CrossRef] [Green Version]
  20. Johansen, I.L.; Rausand, M. Foundations and choice of risk metrics. Saf. Sci. 2014, 62, 386–399. [Google Scholar] [CrossRef]
  21. Luhmann, N.; Barrell, R.; Stehr, N.; Bechmann, G. Risk: A Sociological Theory; Routledge: Boca Raton, FL, USA, 2017. [Google Scholar]
  22. Hopkin, P. Fundamentals of Risk Management: Understanding, Evaluating and Implementing Effective Risk Management; Kogan Page Publishers: London, UK, 2018. [Google Scholar]
  23. Abu-Alrop, J.H. Risk Definition in Banks. In Proceedings of the Сoвременная мирoвая экoнoмика: прoблемы и перспективы в эпoху развития цифрoвых технoлoгий и биoтехнoлoгии, Moscow, Russia, 15–16 May 2020. [Google Scholar]
  24. Babić, B. Identification and Definition of Risk, Threats and Disasters. In Risk Management in the Western Balkans; University of Novi Sad, Faculty of Technical Sciences: Novi Sad, Serbia, 2020; pp. 2–10. [Google Scholar]
  25. Zadeh, L.A. Fuzzy logic = computing with words. In Computing with Words in Information/Intelligent Systems 1; Physica: Heidelberg, Germany, 1999; pp. 3–23. [Google Scholar]
  26. Atkinson, J.; Jourdan, C. A Practical Guide to Risk Assessment: How Principles-Based Risk Assessment Enables Organizations to Take the Right Risks; PriceWaterHouseCoopers, LLC: London, UK, 2008. [Google Scholar]
  27. Segudovic, H. Qualitative Risk Analysis Method Comparison; Infigo IS doo: Zagreb, Croatia, 2006. [Google Scholar]
  28. Petrauskas, V.; Jasinevičius, R.; Kazanavičius, E.; Meškauskas, Ž. CWW elements to enrich SWOT analysis. J. Intell. Fuzzy Syst. 2018, 34, 307–320. [Google Scholar] [CrossRef]
  29. Jasinevičius, R.; Petrauskas, V. Dynamic SWOT Analysis as a Tool for Environmentalists. Environ. Res. Eng. Manag. 2008, 43, 14–20. [Google Scholar]
  30. Miller, G.A. The magical number seven, plus or minus two: Some limits on our capacity for processing information. Psychol. Rev. 1956, 63, 81–97. [Google Scholar] [CrossRef] [Green Version]
  31. Meškauskas, Ž.; Jasinevičius, R.; Kazanavičius, E.; Petrauskas, V. XAI-Based Fuzzy SWOT Maps for Analysis of Complex Systems. In Proceedings of the 2020 IEEE International Conference on Fuzzy Systems (FUZZ-IEEE), Glasgow, UK, 19–24 July 2020. [Google Scholar]
  32. Jasinevičius, R.; Petrauskas, V. Fuzzy expert maps for risk management systems. In Proceedings of the 2008 IEEE/OES US/EU-Baltic International Symposium, Tallin, Estonia, 27–29 May 2008. [Google Scholar]
  33. Jasinevičius, R.; Petrauskas, V. Sprendimų Pagrindimo Kompiuterizavimas (Computerization of Decision Making); Technologija: Kaunas, Lithuania, 2011; p. 152. [Google Scholar]
  34. Petrauskas, V.; Damulevičienė, G.; Dobrovolskis, A.; Dovydaitis, J.; Janavičiūtė, A.; Jasinevičius, R.; Kazanavičius, E.; Knašienė, J.; Lesauskaitė, V.; Liutkevičius, A. XAI-Based Medical Decision Support System Model. Int. J. Sci. Res. Publ. 2020, 10, 598–607. [Google Scholar] [CrossRef]
  35. Liao, H.; Mi, X.; Xu, Z.; Xu, J.; Herrera, F. Intuitionistic fuzzy analytic network process. IEEE Trans. Fuzzy Syst. 2018, 26, 2578–2590. [Google Scholar] [CrossRef]
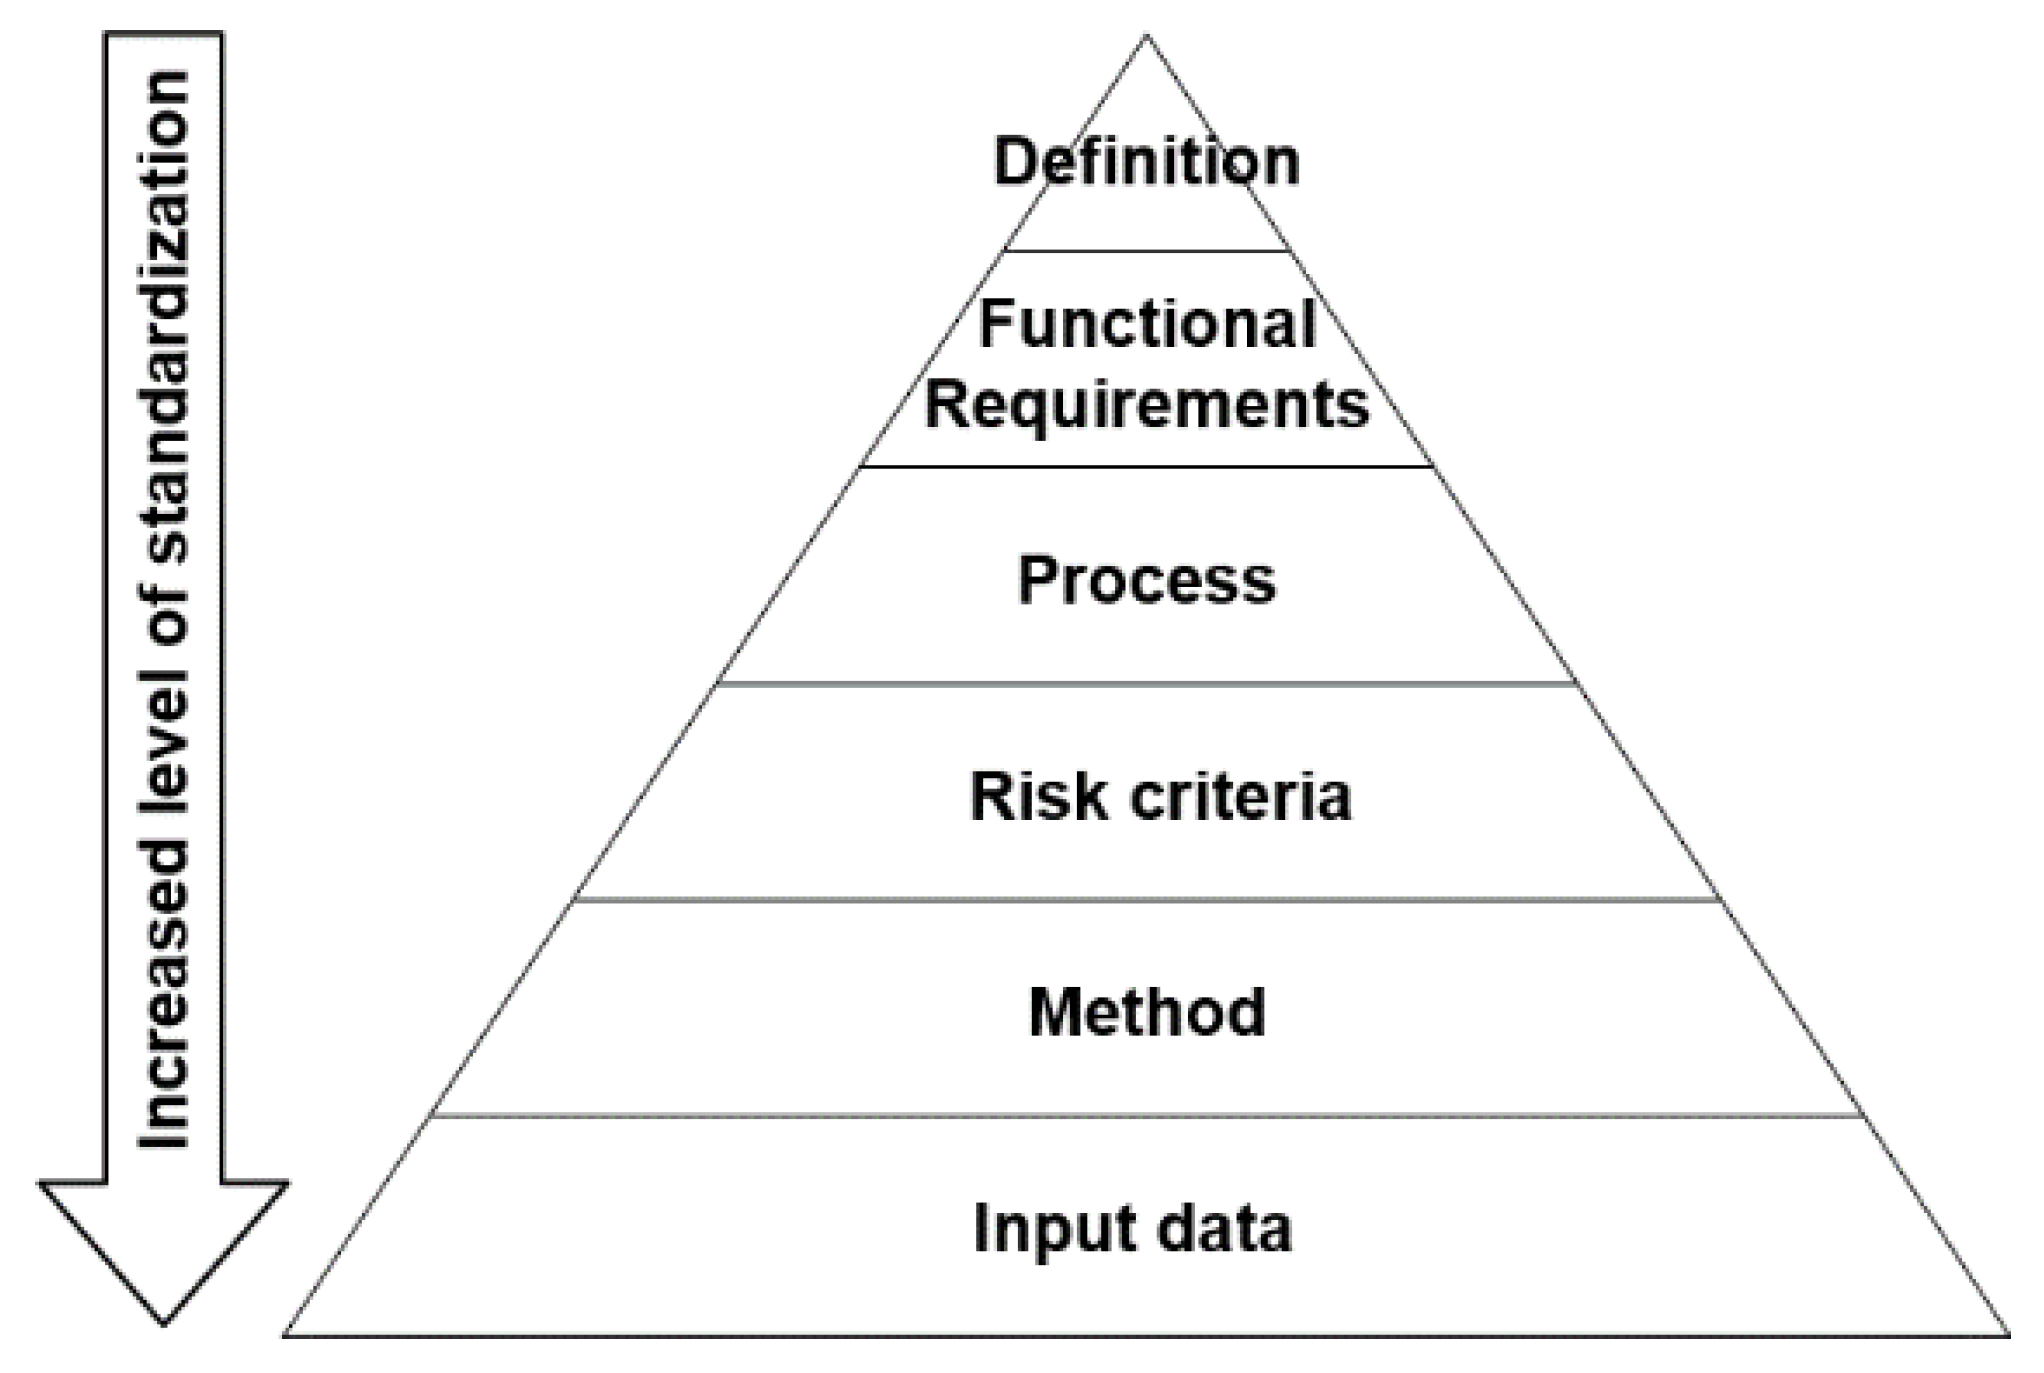
Figure 1. Standardization of the risk.
Sustainability 14 05496 g001
Figure 2. SWOT descriptors of the situation from its environment e.
Sustainability 14 05496 g002
Figure 3. Numerical estimates obtained from the terms by numerical certainty.
Sustainability 14 05496 g003
Figure 4. Numerical estimates obtained from the terms by absolute certainty.
Sustainability 14 05496 g004
Figure 5. Numerical estimates obtained from the terms by verbal certainty.
Sustainability 14 05496 g005
Figure 6. Term with its certainty obtained from a numerical value.
Sustainability 14 05496 g006
Figure 7. SWOT engine.
Sustainability 14 05496 g007
Figure 8. Functional organization of the risk assessment in a complex environment based on the CWW-enriched SWOT analysis.
Sustainability 14 05496 g008
Figure 9. Center of gravity (CoG) calculation.
Sustainability 14 05496 g009
Figure 10. Hesitancies input.
Sustainability 14 05496 g010
Figure 11. Risk rules block the input.
Sustainability 14 05496 g011
Figure 12. GAS STATION project risk results.
Sustainability 14 05496 g012
Figure 13. HOTEL project risk results.
Sustainability 14 05496 g013
Figure 14. LOBBY project risk results.
Sustainability 14 05496 g014
Table 1. List of fuzzy risk rules.
OPTHEFFHESRISK
αOP1αTH1αEFF1αHES1αR1
αOPnαTHnαEFFnαHESnαRn
Table 2. Efforts and hesitancies values.
Project AcronymEffortsHesitancies
Verbal EvaluationDegree of CertaintyVerbal EvaluationDegree of Certainty
GAS STATIONMediumLargeSmall0.8
HOTELLargeVery LargeSmall0.6
LOBBYLargeVery LargeMediumLarge
Table 3. GAS STATION risk rules.
OPTHEFFHESRISK
VLZ, VSZ, VSZZ
L, VLZ, VSZ, VS, SZ, VSVS
M, L, VLVS, SVS, S, MZ, VS, SS
M, LS, MS, MVS, SM
VS, S, MS, M, LS, M, LS, ML
Z, VS, SM, L, VLM, L, VLM, L, VLVL
L, VL L, VLM
M, L, VLL, VLL, VLZ, VSL
Table 4. HOTEL risk rules.
OPTHEFFHESRISK
VLZ, VSZ, VS, SZ, VSVS
L, VLVS, SVS, SVSS
M, LVS, S, MVS, S, MVS, SM
S, MS, M, LS, M, LS, ML
Z, VS, SM, L, VLM, L, VLM, L, VLVL
L, VL L, VLL
M, LL, VLL, VLZ, VSL
Table 5. LOBBY risk rules.
OPTHEFFHESRISK
VLZ, VSZ, VS, SZZ
L, VLZ, VS, SVS, SZ, VSVS
M, L, VLVS, S, MS, MZ, VSS
M, LS, M, LS, M, LVS, SM
VS, S, MM, LM, LVS, S, ML
Z, VSL, VLL, VLM, L, VLVL
M, L, VL M, L, VLL
M, L, VLM, L, VLL, VLZ, VSL
M, LZ, VSM, L, VLZ, VSL
Table 6. All the project risk results.
GAS STATIONHOTELLOBBY
Pessimistic
Numerical0.2510.4190.654
VerbalS:0.55,M:0.45M:0.79,L:0.21L:0.96,VL:0.04
Medium
Numerical0.2130.3380.596
VerbalS:0.74,M:0.26S:0.11,M:0.89M:0.16,L:0.84
Optimistic
Numerical0.1740.2570.538
VerbalS:0.93,M:0.07S:0.52,M:0.48M:0.36,L:0.64
Publisher’s Note: MDPI stays neutral with regard to jurisdictional claims in published maps and institutional affiliations.