Article

Thermal Perception and Physiological Responses under Different Protection States in Indoor Crowded Spaces during the COVID-19 Pandemic in Summer

1
School of Civil Engineering and Architecture, Wuhan University of Technology, Wuhan 430070, China
2
Sanya Science and Education Innovation Park, Wuhan University of Technology, Sanya 572024, China
3
School of Urban Design, Wuhan University, Wuhan 430072, China
4
School of Civil Engineering, Liaoning Technical University, Fuxin 123000, China
*
Authors to whom correspondence should be addressed.
Sustainability 2022, 14(9), 5477; https://doi.org/10.3390/su14095477
Submission received: 16 March 2022 / Revised: 27 April 2022 / Accepted: 29 April 2022 / Published: 3 May 2022

Abstract

:
Currently, people in crowded indoor spaces are required to wear a variety of personal protective equipment to curb the spread of COVID-19. This study aimed to investigate the effects of wearing four types of personal protective equipment (unprotected, wearing masks, wearing face shield and wearing medical protective clothing) on human thermal perception and physiological responses in indoor crowded spaces in summer. The experiment was conducted in a climate chamber designed to simulate the indoor crowded spaces. Environmental parameters of climate chamber (air temperature, relative humidity and wind speed), physiological parameters of subjects (wrist skin temperature and pulse rate), and subjective perceptions (thermal sensation and thermal comfort) were collected during the experiment. The experimental results showed that medical protective clothing has the most obvious blocking effect on heat exchange between human and environment. Thermal sensation in state 4 (wearing medical protective clothing) was significantly (p < 0.05) higher than that in other states. The study of physiological parameters showed that the wrist skin temperature and pulse rate under different protection states increased with the increase of room temperature. Through regression analysis, the thermal sensation estimation model of protective personnel in indoor crowded spaces based on wrist skin temperature and pulse rate was established. The adjusted R2 and RMSE of all models were above 82% and less than 1, indicating that the established thermal sensation model had a good prediction effect.

1. Introduction

The world is currently experiencing a global pandemic caused by SARS-CoV-2. The virus is transmitted mainly through respiratory droplets produced when patients cough, sneeze, sing, talk, or breathe [1], which has become a major public health problem at present. To contain the spread of COVID-19, most countries around the world have decided to tighten their public health policies [2], introducing various health interventions, such as national lockdowns, mandatory masks in public places, and social distancing, etc. [3]. Indoor crowded spaces refer to crowded public places, which are the focus of COVID-19 prevention and control. Due to their high density and strong mobility, indoor people are prone to outbreaks of aggregated epidemics. Therefore, indoor personnel must wear personal protective equipment.
There already exist some experimental studies concerning the effect of personal protective equipment on human thermal comfort. Ewa et al. studied the influence of wearing different types of masks on thermal comfort perception in low and high temperature environments by using thermal manikins [4]. Zhang et al. explored the effects of wearing medical surgical masks on human thermal sensation, thermal comfort, and breathing comfort of office buildings in summer through climate chamber experiments [5]. Tang et al. analyzed the possible symptoms of wearing masks for a long time in summer through field tests and questionnaires, and assessed the preference of subjects for wearing masks for various environmental parameters [6]. Wang et al. studied the thermal comfort properties of medical non-woven protective clothing [7]. Bongers et al. noted that medical protective equipment can easily lead to thermal fatigue and discomfort of medical staff, ultimately, leading to the shortened work tolerance time and declined physical and cognitive performance [8]. Potter et al. proposed that the impenetrable design of medical protective clothing posed a risk of thermal stress in hot and humid environments, and provided insights that could be used to guide the safety work of medical staff responding to the Ebola epidemic [9].
However, as mentioned above, previous studies were limited to exploring the thermal comfort of personnel under a single protection state, without considering the particularity of indoor crowded spaces during the COVID-19 epidemic. People in indoor crowded spaces need to wear different personal protective equipment according to the particular place, such as masks in shopping malls and medical protective clothing in hospitals, etc. Therefore, it is of great significance to effectively evaluate the thermal comfort of people under different protection states in indoor crowded spaces.
Due to the diversity of factors affecting human thermal comfort, simple subjective evaluation is often unable to comprehensively measure human thermal comfort. The subjective factors and individual differences of personnel will result in significant differences in thermal comfort. Therefore, it is necessary to integrate human physiological parameters and subjective evaluation to study the influence of personal protective equipment on human thermal comfort. By now, an increasing number of studies on personal protective equipment have combined physiological parameters to probe into thermal comfort [10,11,12,13,14].
Human skin is the main medium of heat transfer. Hence, skin temperature plays an important role in thermoregulation process through vasoconstriction and vasodilation operations using subcutaneous heat receptors [15,16]. This is integral to maintaining heat balance at a fixed level of activity [17]. The skin has a large number of cold and warm thermoreceptors connected to neurons located in the anterior hypothalamus. Any factors that can cause vasoconstriction or vasodilatation will affect skin temperature.
Thermal equilibrium in the human body is realized by the conjoined efforts of two organs, namely the skin thermal receptor (body periphery) and the human heart (body core). Under the thermal stress of vasoconstriction or vasodilation, body heat is stabilized by heat transfer between the core and the periphery of the body, which is facilitated by these two organs. Skin temperature represents the response of external skin receptors to thermal stimulation [16,17], while pulse rate, analogous to heart rate, represents the response of internal heart to thermal stimulation [18]. Pulse rate is closely related to the cardiovascular health and can reflect the effect of thermal stress on the cardiovascular system due to its connection with the autonomic nervous system [19].
As mentioned above, although personal protective equipment can effectively prevent the spread of the virus [20,21,22], the thermal comfort of subjects may be sacrificed [4,6,8]. The detailed effect of different personal protective equipment on thermal perception and physiological response is not clear. At present, there are few studies on the thermal comfort of protective personnel in indoor crowded spaces. Therefore, through experiments, this study studied the thermal perception and physiological response of personnel in indoor crowded spaces under different protection states. The collected data help to understand how different personal protective equipment affecting the human body’s response to thermal environment. Furthermore, regression analysis was used to create a thermal sensation model based on human physiological parameters, which can be potentially applied to thermal environment control in indoor crowded spaces during the control of COVID-19.

2. Materials and Methods

2.1. Human Subjects

According to the adaptive thermal comfort model, one’s thermal experiences and expectations significantly influence thermal comfort. Therefore, participants were subject to the criterion of residing in local area for at least two years so as to make sure they were physically (in terms of their thermoregulatory system) and psychologically adapted to the local climate. The subjects of this experiment were all students who had lived locally for more than two years. There are 10 subjects in total, including 7 males and 3 females, aged between 20 and 25 years. All subjects were in good health and free of any cardiovascular/respiratory/skin diseases that might interfere with the test. Prior to participating in the experiment, oral and written informed consent was obtained from each subject.
Subjects should avoid alcohol, caffeine, smoking and strenuous physical activity for at least 12 h before each experiment. During the experiment, the subjects were in stable psychological condition without emotional fluctuation, and wore their own clothes instead of uniform clothes, which were typical summer clothing, including underwear, T-shirts, sweatpants and sneakers, etc. The clothing insulation of the subject shall be calculated according to ASHRAE standard 55 [23]. The basic physical information of the subjects is shown in Table 1.

2.2. Measurements

2.2.1. Environmental Measurements

This experiment was conducted in an artificial climate chamber. The climate chamber was used to simulate the indoor crowded spaces, with an indoor personnel interval less than 1 m and the per capita area less than 1 m2. The climate chamber was located inside an indoor room, which can control indoor environmental parameters through air conditioning. The size of the climate chamber was 4.8 m × 2.1 m × 3.3 m (length × width × height), as shown in Figure 1.
The indoor environment control system of the climate chamber includes refrigeration unit, air processor, heater and humidifier with temperature control ranging 5–40 °C. Under experimental conditions, the indoor air humidity in the climate chamber was controlled within the range of 45–55%, and the indoor wind speed was controlled below 0.2 m/s to ensure that there was no obvious draft sensation in the surrounding environment of the subjects.
The measurement point of indoor environmental parameters was arranged in the center of the subjects, 0.9 m from the ground (the height of forehead when people were sitting), so as to monitor the air temperature, relative humidity, and wind speed in the activity area of the subjects. The equipment used to measure environmental parameters is shown in Table 2.

2.2.2. Physiological Measurements

Usually, the measurement of human physiological parameters mainly includes skin temperature, pulse rate, blood pressure, and blood oxygen saturation. According to previous studies [24,25,26,27], human thermal comfort is significantly correlated with wrist skin temperature and pulse rate, while thermal comfort is not significantly correlated with blood pressure and oxygen saturation. Limited by the experimental conditions, the physiological parameters of the subjects wearing medical protective clothing were not easy to measure. Considering the relationship between the measured physiological parameters and thermal comfort and the convenience of measurement. Therefore, two physiological parameters of each subject, namely wrist skin temperature and pulse rate, were monitored. The location used for skin temperature measurement is the dorsal region between the wrist and fingers (as this location is significantly indicative of overall thermal sensation compared with others) [24,25]. Pulse rate, which is analogous to heart rate was studied due to ease of measurement, it can be sensed from the wrist/finger unlike the intrusive EEG method for heart rate. To reduce the artificial error in the experimental measurement, the skin temperature sensor was fixed at the specific position of the subject’s non-dominant hand through the breathable medical tape, and the pulse rate sensor uniformly measured the pulse rate of the subject’s non-dominant hand thumb. Table 2 lists the instrument specifications for measuring physiological parameters.

2.2.3. Subjective Measurements

A questionnaire was designed to reflect the subjects’ subjective assessment of the indoor thermal environment. Subjects were required to report two subjective responses, namely thermal sensation and thermal comfort. The ISO 10551 nine-points thermal sensation scale (Table 3) was used to assess thermal sensation, including very cold (−4), cold (−3), cool (−2), slightly cool (−1), neutral (0), slightly warm (+1), warm (+2), hot (+3), and very hot (+4) [28]. Compared with the ASHARE 7-point scale [29], the 9-point scale extends the thermal sense to very cold/hot, which is suitable for high and low temperature environments beyond the range of normal temperatures. The thermal comfort questionnaire is shown in Figure 2.

2.3. Experiment Procedure

The experiment was conducted in July 2021. Previous studies [24,30,31] carried out human sensation experiments under an indoor temperature range of 20–30 °C, but did not involve human sensation experiments at high temperature. Therefore, this experiment added the high temperature part based on previous studies. The whole experiment lasted for 45 min. During the experiment, the indoor temperature was constant. After each experiment, the temperature increased by 2 °C (from 22 °C to 36 °C). Therefore, experiments were carried out at indoor temperatures of 22 °C, 24 °C, 26 °C, 28 °C, 30 °C, 32 °C, 34 °C and 36 °C, respectively.
The experimental process is shown in Figure 3. First, the subjects wore personal protective equipment and sat in the preparation room of neutral environment (≈26 °C) for 15 min rest to avoid any deviation caused by previous exposure to the environment and achieve a comfortable physical/mental state. During this period, the subjects filled in the basic physical information (Table 1) and wore physiological parameter monitoring equipment. Then, the subjects entered the experiment room from the preparation room and sat in their assigned positions, and the experiment began. During the experiment, the subjects remained seated and performed some office activities. During this period, subjects were prompted to vote on subjective questionnaires every 3 min. At the same time, the instrument recorded the indoor temperature, relative humidity, wind speed, and wrist skin temperature every 10 s and monitored the pulse rate every 3 min.

2.4. Protective States

The purpose of this study was to investigate the thermal responses of people under four different protection states in indoor crowded spaces. The mask used in the experiment is a disposable medical surgical mask with three-layer structure, the face shield is a medical isolation face shield, and the protective clothing is a non-woven one-piece medical isolation clothing. Table 4 shows four different protection states. Figure 4 shows the subjects wearing four different types of protective equipment.

2.5. Statistical Analysis

The data distributions were tested for normality using the Shapiro-Wilk Test. The Chi-Squared Test of Independence was used to evaluate the thermal response of subjects in different protection status groups, and the two-proportions Z-Test was used as a post-hoc test. Regression analysis was used to study the relationship between thermal sensation and physiological parameters of the subjects under different protection states.

3. Results

During the experiment, 28,800 wrist skin temperatures and 1600 pulse rates were collected from the physiological parameter monitoring instrument. In addition, 1600 thermal comfort questionnaires were obtained.

3.1. Subjective Perception

3.1.1. Thermal Sensation

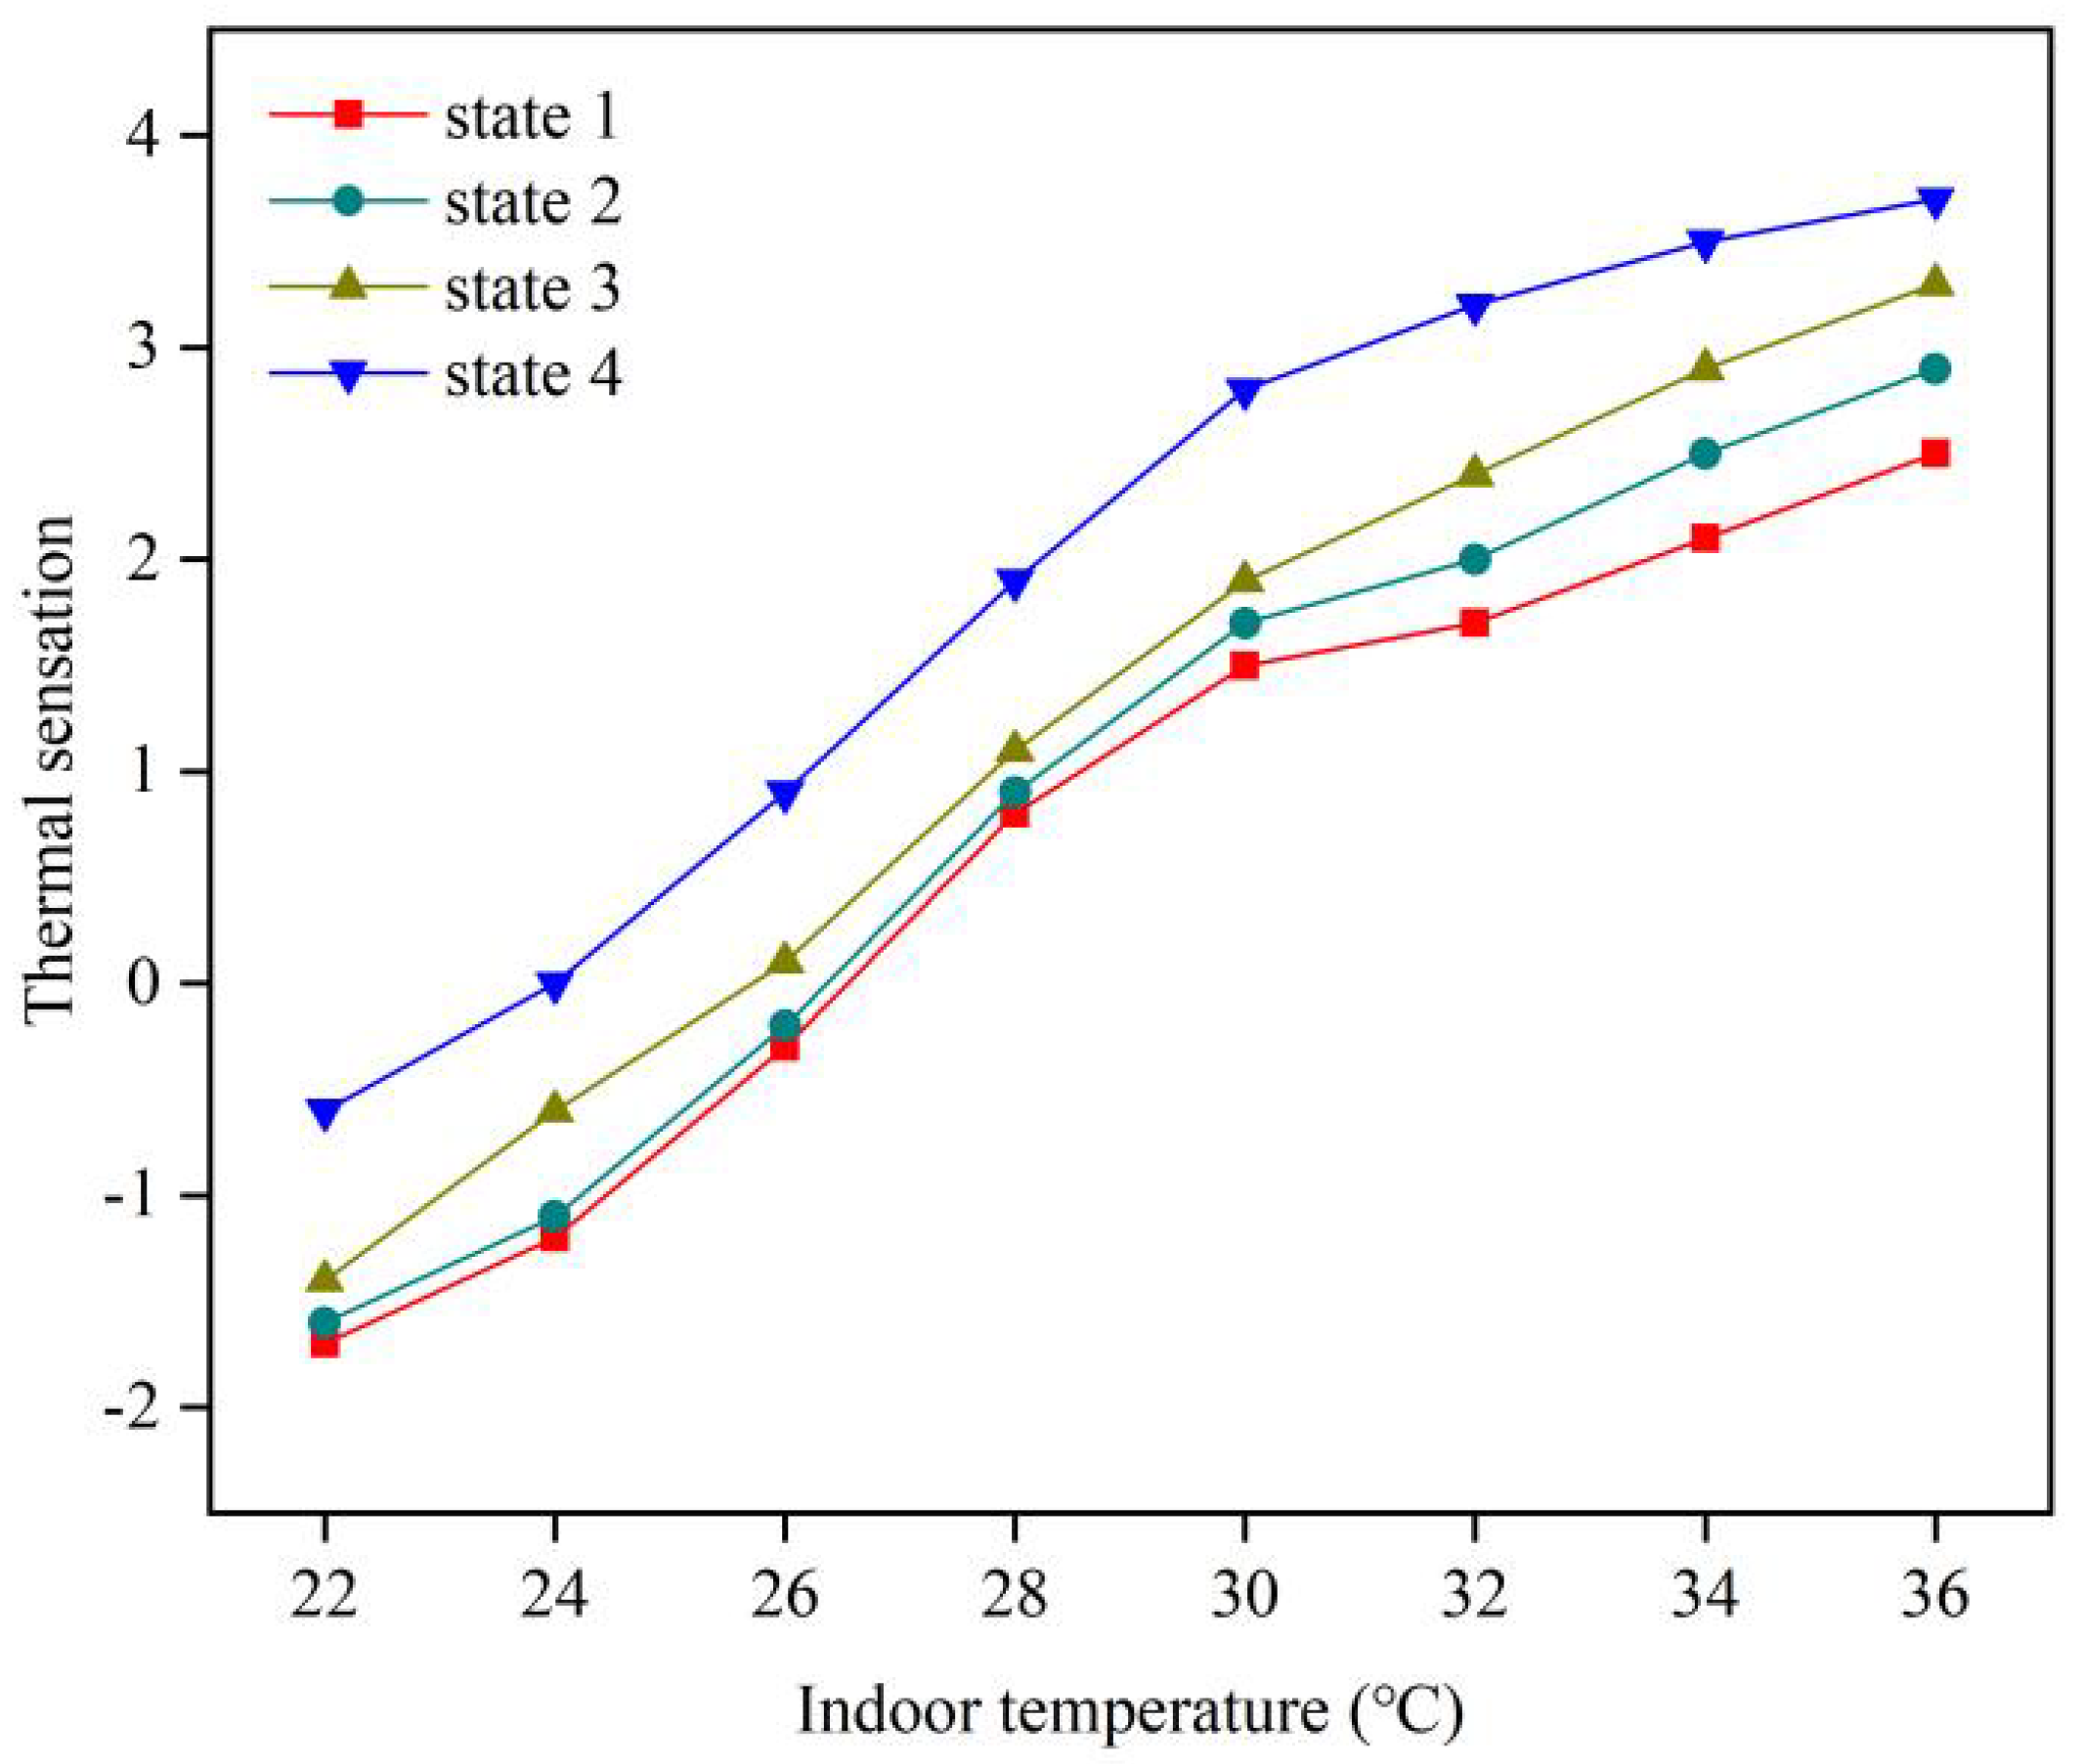
Figure 5 shows the relationship between average thermal sensation and indoor temperature of the subjects under different protection states. Only thermal sensations other than −4 and −3 were selected for the analysis. As the indoor temperature increased from 22 °C to 36 °C, the thermal sensation of the subjects gradually increased under different protection states. Among them, the thermal sensation of the subjects in state 4 was significantly (p < 0.05) higher than that in the other states. When the subjects were exposed to a low temperature (22–28 °C) environment, the thermal sensation of subjects in state 1 was basically the same as that in state 2. Conversely, when subjects were exposed to high temperatures (30–36 °C), the thermal sensation of the subjects in state 2 was significantly (p < 0.05) higher than that in state 1. This may be due to the large temperature difference between the indoor temperature and the human skin temperature in the cold experiment, resulting in the heat loss of human skin much greater than that of respiration. On the contrary, during the warm experiment, the temperature difference between the indoor temperature and the human skin temperature was small, causing the heat loss of the human skin far less than that of respiration. These results indicated that indoor temperature influenced thermal sensation and the protection state determined the degree of thermal sensation.

3.1.2. Thermal Comfort

Figure 6 shows the relationship between the average thermal comfort of the subjects and indoor temperature under different protection states. With the indoor temperature rising from 22 °C to 36 °C, the average thermal comfort of the subjects under different protection states first decreased to a minimum value and then gradually increased. However, when the indoor temperature was relatively low (22–24 °C), the thermal comfort of the subjects in state 4 was lower than that in other states. On the contrary, when the indoor temperature was at a higher level (26–36 °C), the thermal comfort of the subjects in state 4 was significantly higher than that in other states. In state 4, the thermal comfort of the subjects reached the minimum value when the indoor temperature was 24 °C, while in other states, the thermal comfort of the subjects reached the minimum value when the indoor temperature was 26 °C, and the minimum value increased in the enhanced protection state. In a low temperature environment, different protection states blocked different degrees of heat transfer between human body and environment. The stronger the protection state, the stronger the effect of blocking the heat dissipation of the human body to the external environment. Therefore, when the indoor temperature was 22 °C, the mean thermal comfort of the subjects in state 1, state 2, state 3, and state 4 was 0.9, 0.8, 0.7, and 0.4 respectively. In high temperature environment, due to the barrier effect of protective equipment, the heat inside the human body cannot be effectively dissipated. The more protected the state, the more heat accumulated in the human body. Therefore, when the indoor temperature was 36 °C, the mean thermal comfort of the subjects in state 1, state 2, state 3, and state 4 was 2.2, 2.6, 2.8, and 3.4, respectively.

3.1.3. The Relation between Thermal Sensation and Thermal Comfort

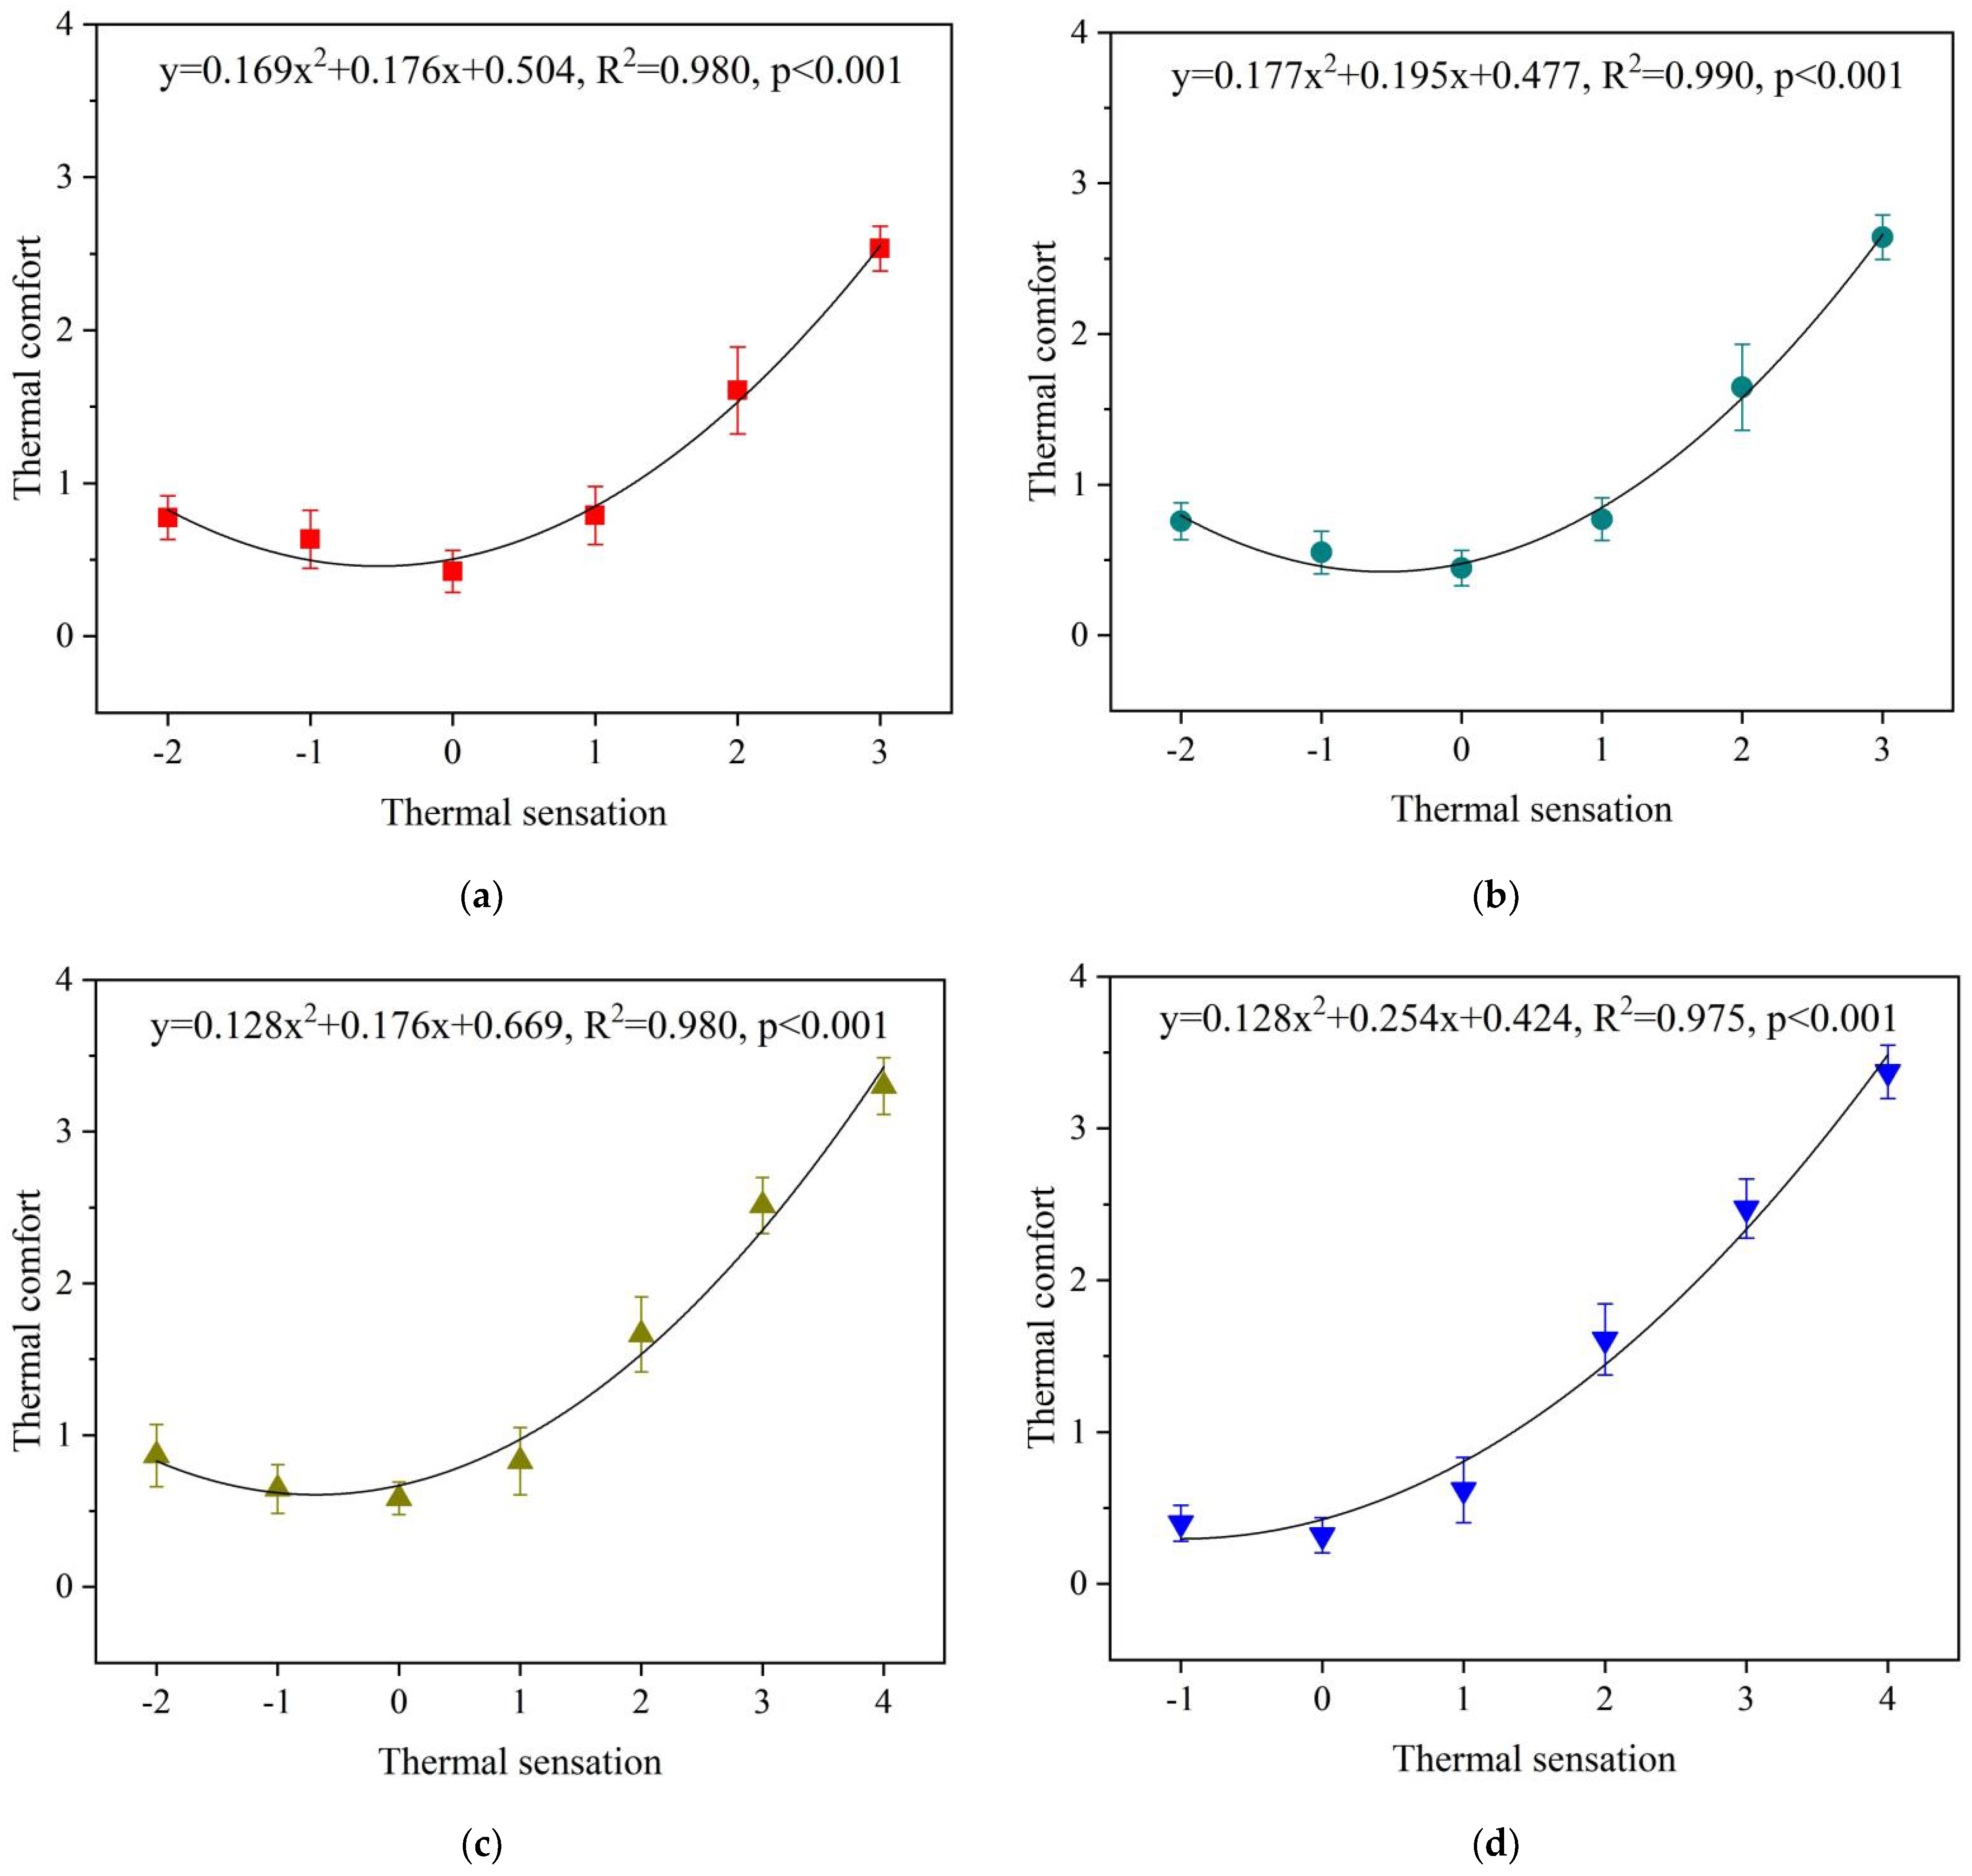
Figure 7 illustrates the relationship between thermal comfort and thermal sensation of the subjects under different protection states. When thermal sensation was less than −1 (slightly cool), except for state 4, the thermal comfort of subjects in the other three states decreases with the increase of thermal sensation. However, when thermal sensation exceeded 0 (neutral), there was an increasing relationship between thermal comfort and thermal sensation. However, the thermal comfort of the subjects in state 4 increased with the increase of thermal sensation in the whole range of thermal sensation.
In this study, the relationship between thermal comfort and thermal sensation of the subjects in the four states was highly close to the quadratic curve, and the determinant coefficient R2 indicating the goodness of fit of the quadratic curve were all greater than 0.9. When the subjects felt slightly cool (−1 < TSV < 0), the average thermal comfort was the highest under different protection states, suggesting that the subjects tend to be slightly cold in summer. With the strengthening of the protection state, the thermal sensation corresponding to the highest average thermal comfort gradually shifted to a thermal sensation of −1 (slightly cool).

3.2. Physiological Responses

3.2.1. Wrist Skin Temperature

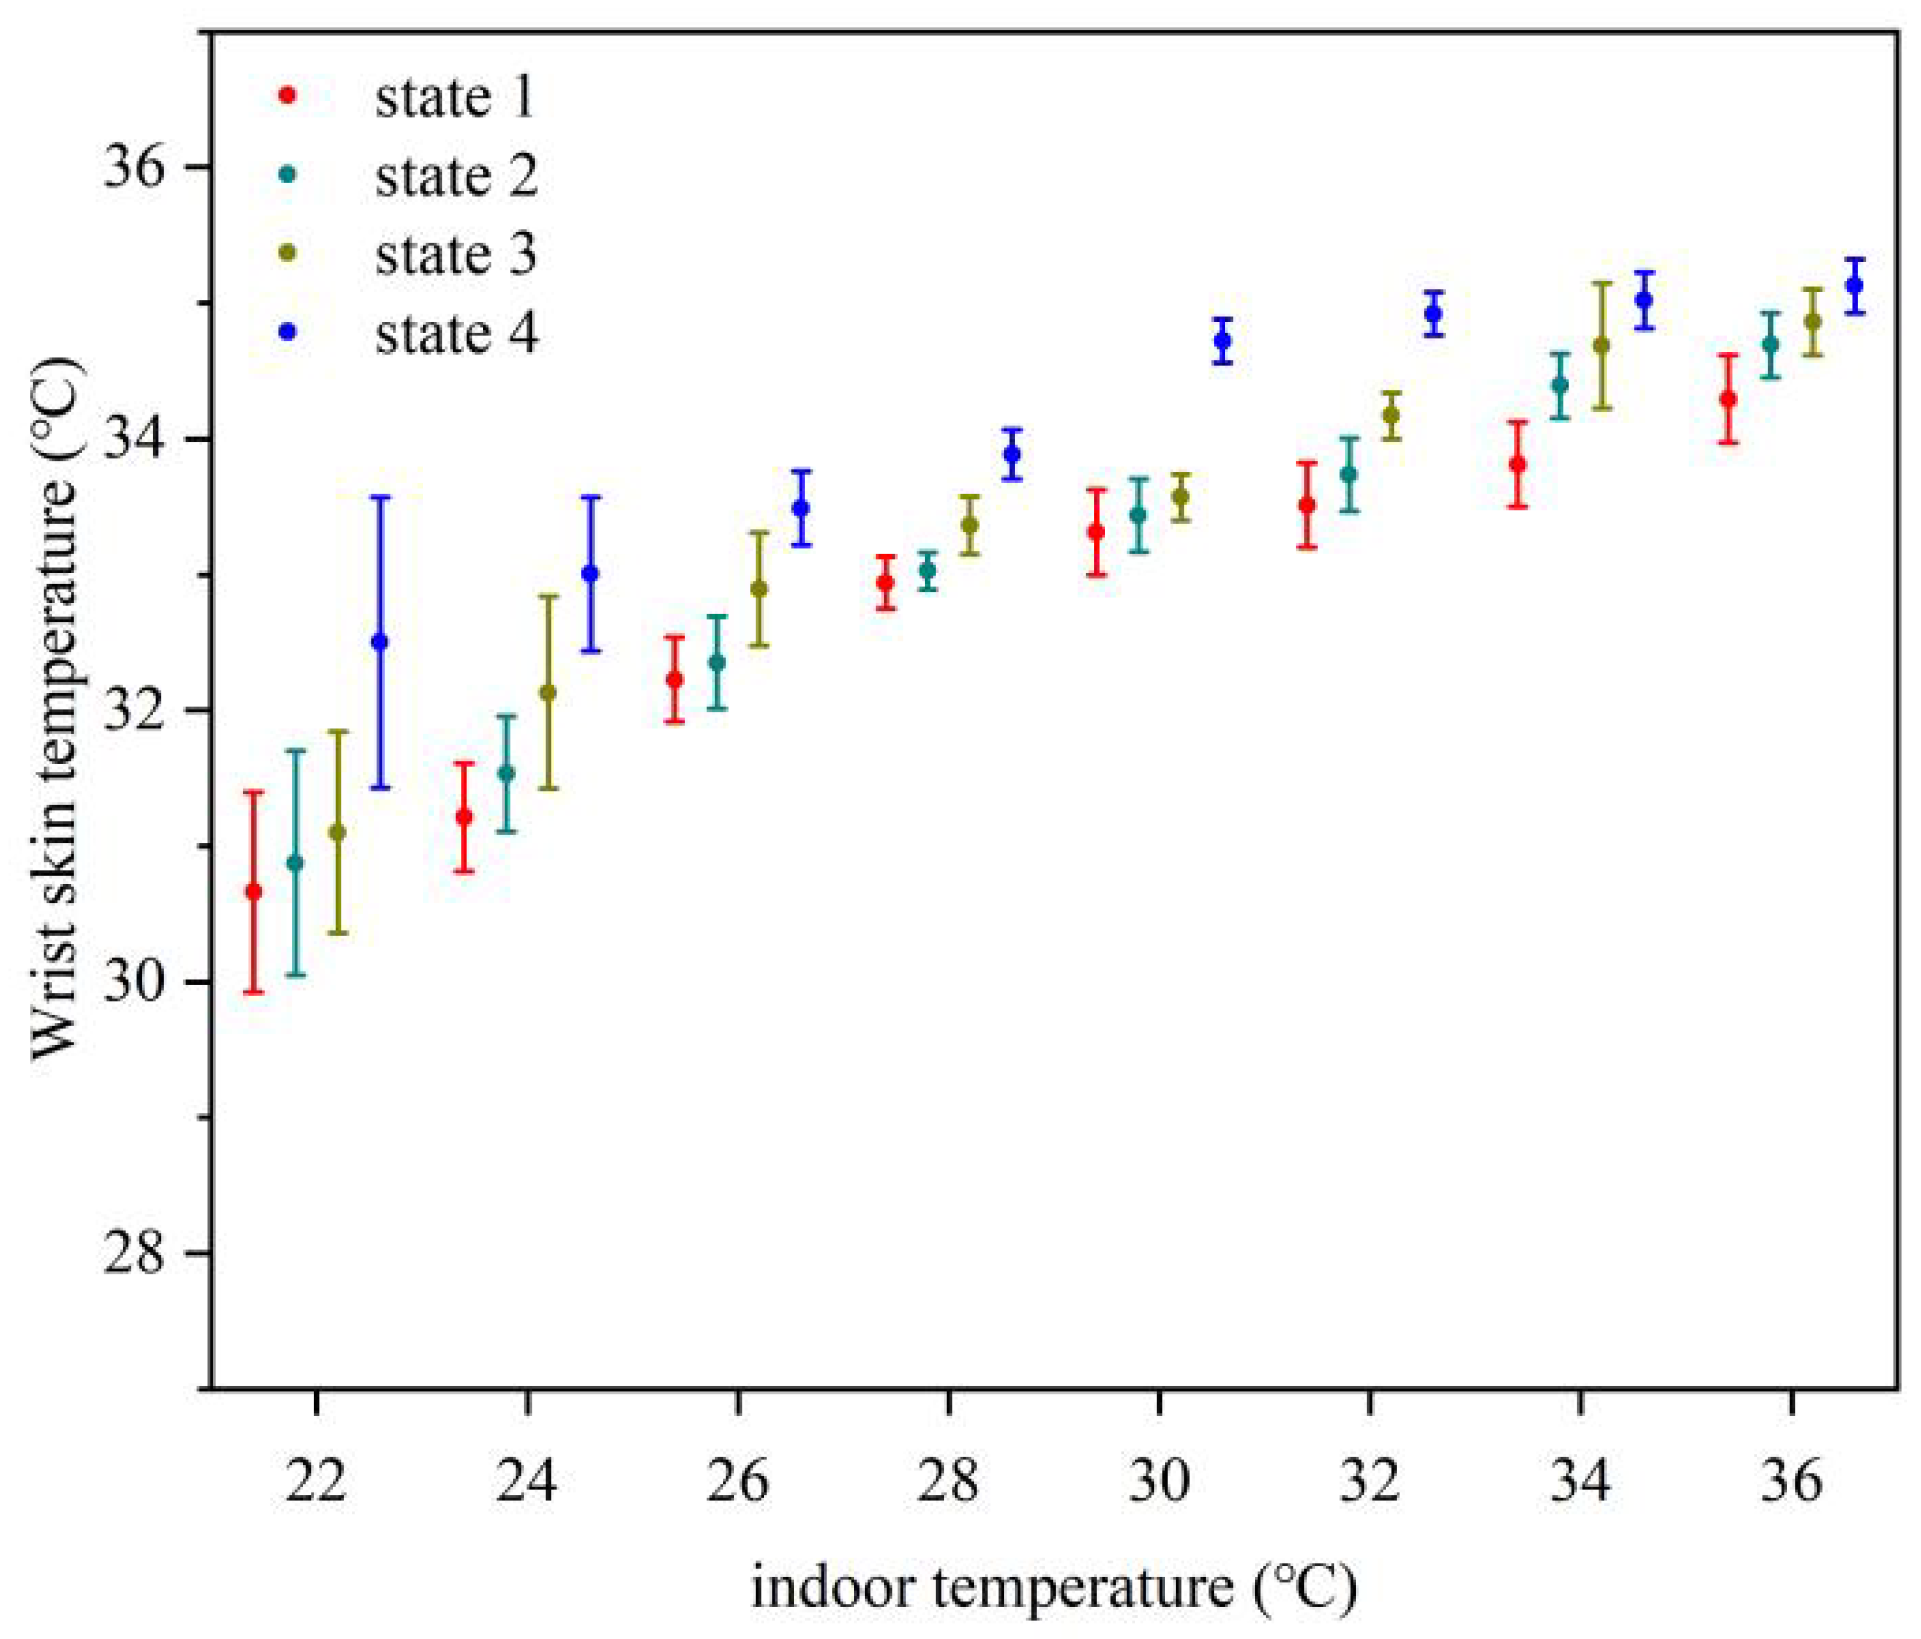
Figure 8 shows the error interval plot of the subject’s wrist skin temperature relative to the indoor temperature under different protection states. As the indoor temperature rose from 22 °C to 36 °C, the wrist skin temperature gradually increased, indicating that the wrist skin temperature was positively correlated with the indoor temperature. Among them, when the indoor temperature was higher than 30 °C, even if the indoor temperature rose, the increase of the wrist skin temperature of the subject in state 4 was not obvious, indicating that the heat dissipated by the subject’s wrist skin has reached a critical value, at this time, and the fluctuation of the wrist skin temperature was very small. In addition, under the same indoor temperature, the average wrist skin temperature of the subjects under the four protection states increased with the strengthening of the protection state. This may be due to the fact that as the protection state is strengthened, the stronger the protection state is, preventing the heat exchange between the human body and the external environment, resulting in an increased gap between the wrist skin temperature and the indoor temperature.

3.2.2. Pulse Rate

Figure 9 shows the error interval diagram of the subject’s pulse rate relative to the indoor temperature under different protection states. Under different protection states, especially in state 1, the pulse rate increased with the increase of indoor temperature, indicating a positive correlation between pulse rate and indoor temperature. Among them, under the same indoor temperature, the average pulse rate of the subjects under the four protection states increased with the strengthening of the protection state. In addition, when the indoor temperature was 26 °C, except for state 4, the average pulse rate of the subjects under the other three protection states was close to the standard average pulse rate (75 bpm), indicating that except for state 4, the thermal sensation of the subjects under the other three protection states was close to 0, and the average pulse rate under the neutral state attempted to stabilize at the average standard level.

3.3. Relationship between Physiological Parameters and Thermal Sensation

3.3.1. Relationship between Wrist Skin Temperature and Thermal Sensation

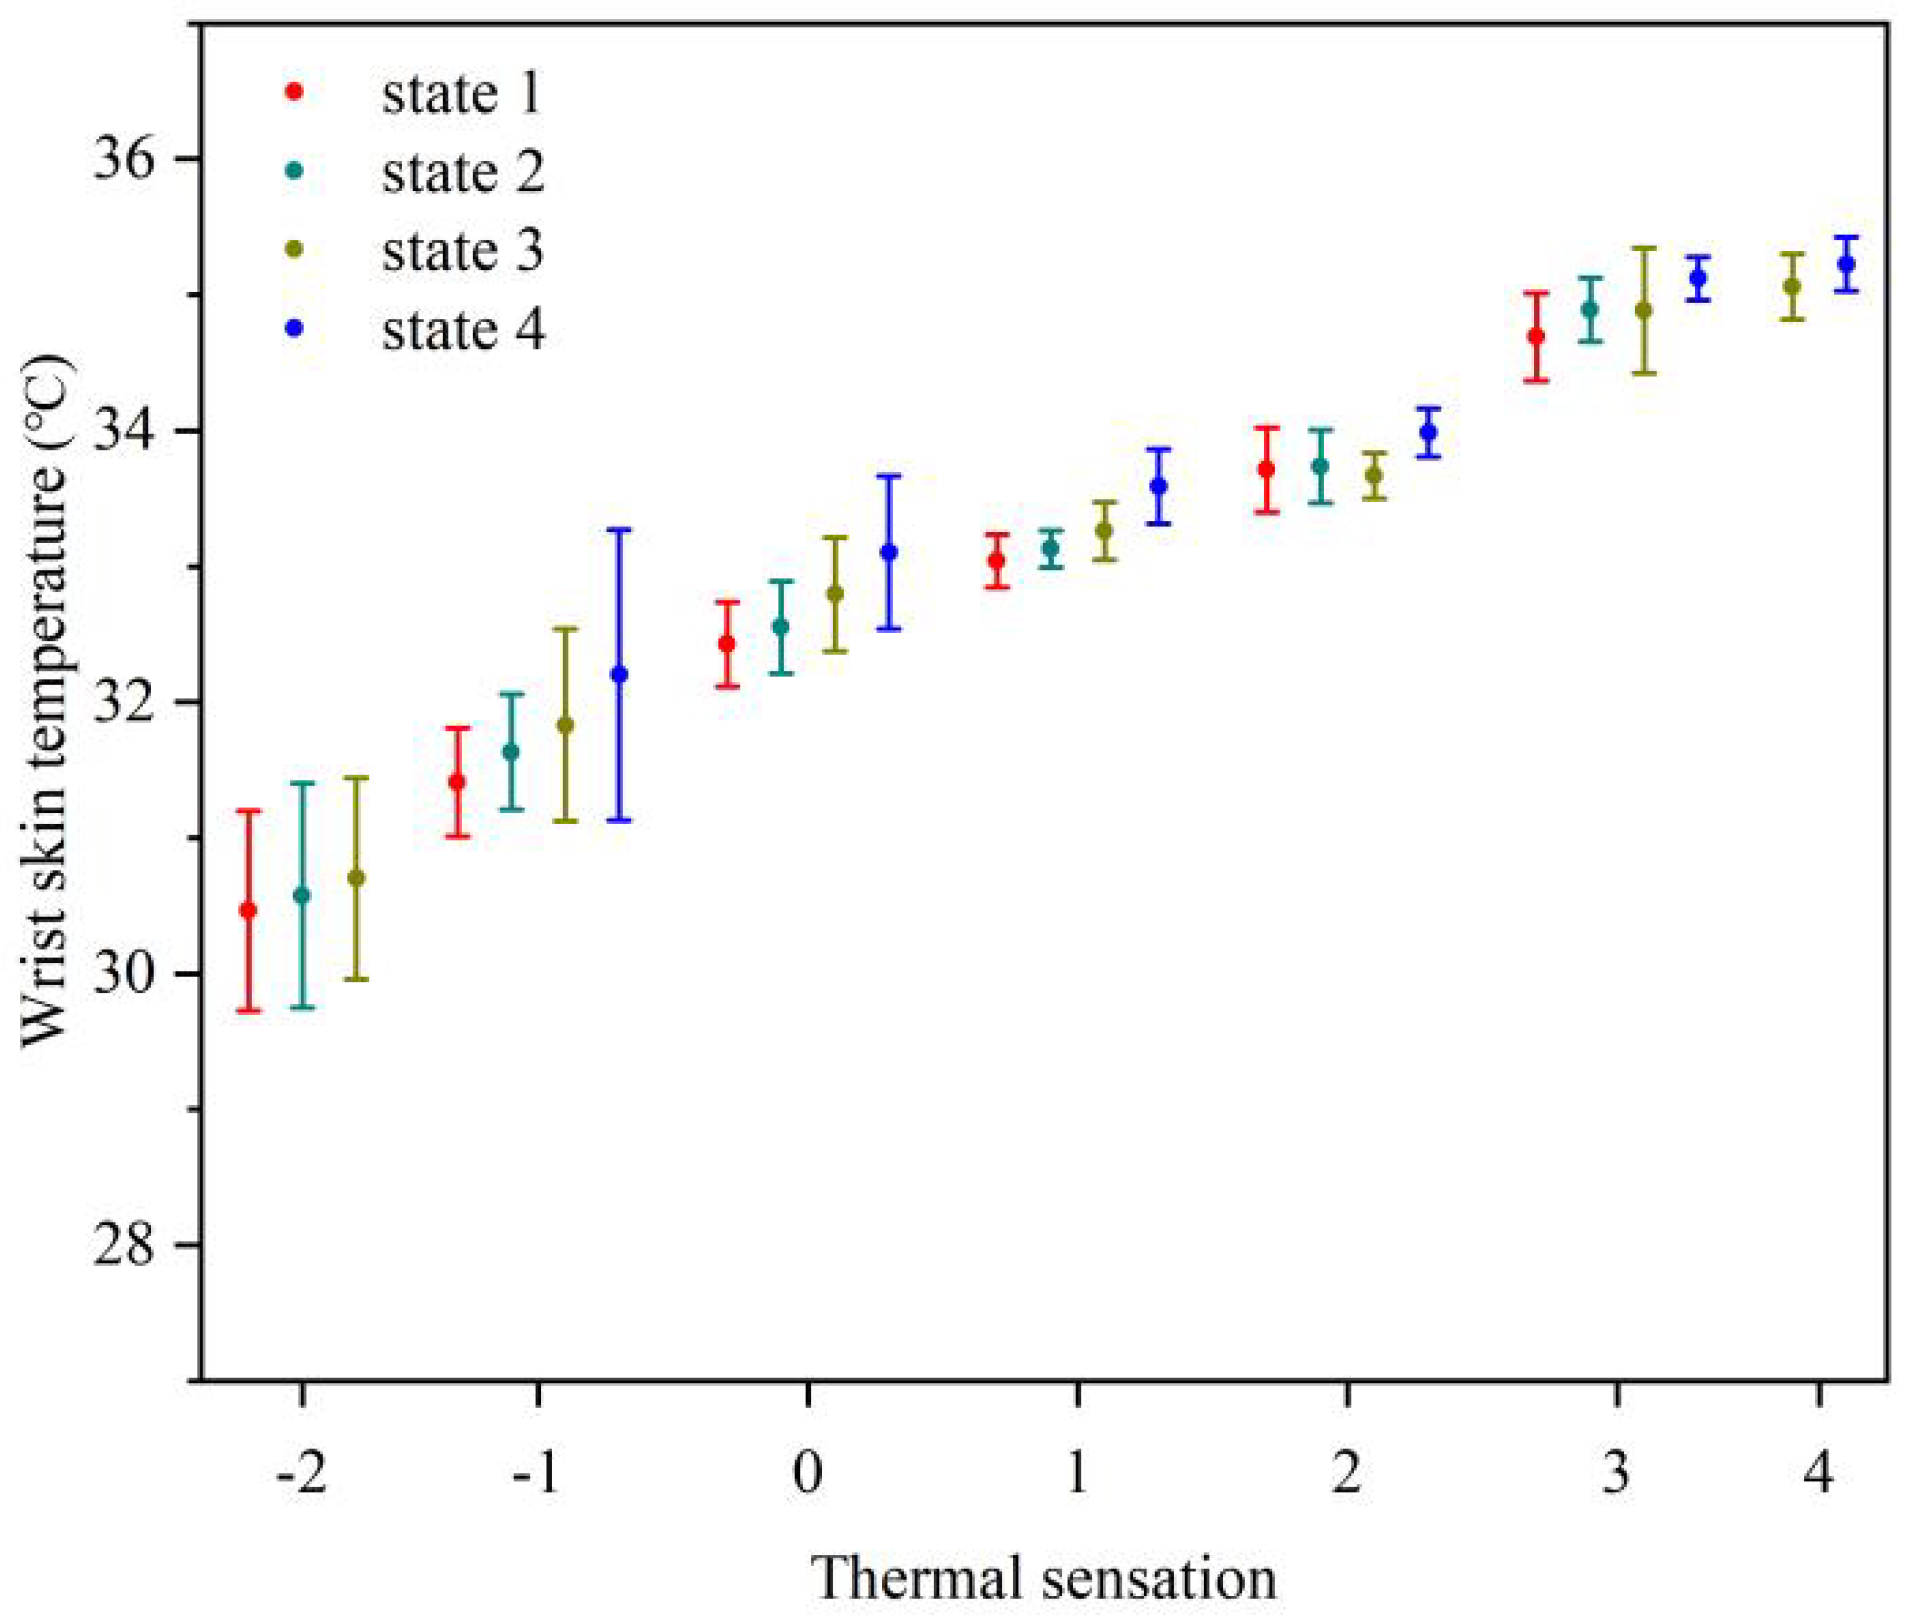
Figure 10 shows the error interval plot of the subject’s wrist skin temperature relative to the thermal sensation under different protection states. As the thermal sensation increased from −2 (cool) to +4 (very hot), the wrist skin temperature gradually increased, indicating that the wrist skin temperature reflects the human thermal sensation to a certain extent. In addition, when the subject’s thermal sensation was less than +2 (warm), the average temperature of the wrist skin of the subjects in state 1, state 2, state 3, and state 4 showed an upward trend under the same thermal sensation, but when the thermal sensation of the subject was higher than +1 (slightly warm), there was no unified trend of the average temperature of the wrist skin of the subjects under the same thermal sensation under four different protection states. This may be due to the fact that in the low temperature environment, state 1, state 2, state 3, and state 4 gradually strengthen the heat exchange between the human body and the environment, resulting in the gradual increase of the gap between the wrist skin temperature and the ambient temperature. In a high temperature environment, the heat dissipation of the wrist skin reached a critical value, and the temperature fluctuation of wrist skin was small.

3.3.2. Relationship between Pulse Rate and Thermal Sensation

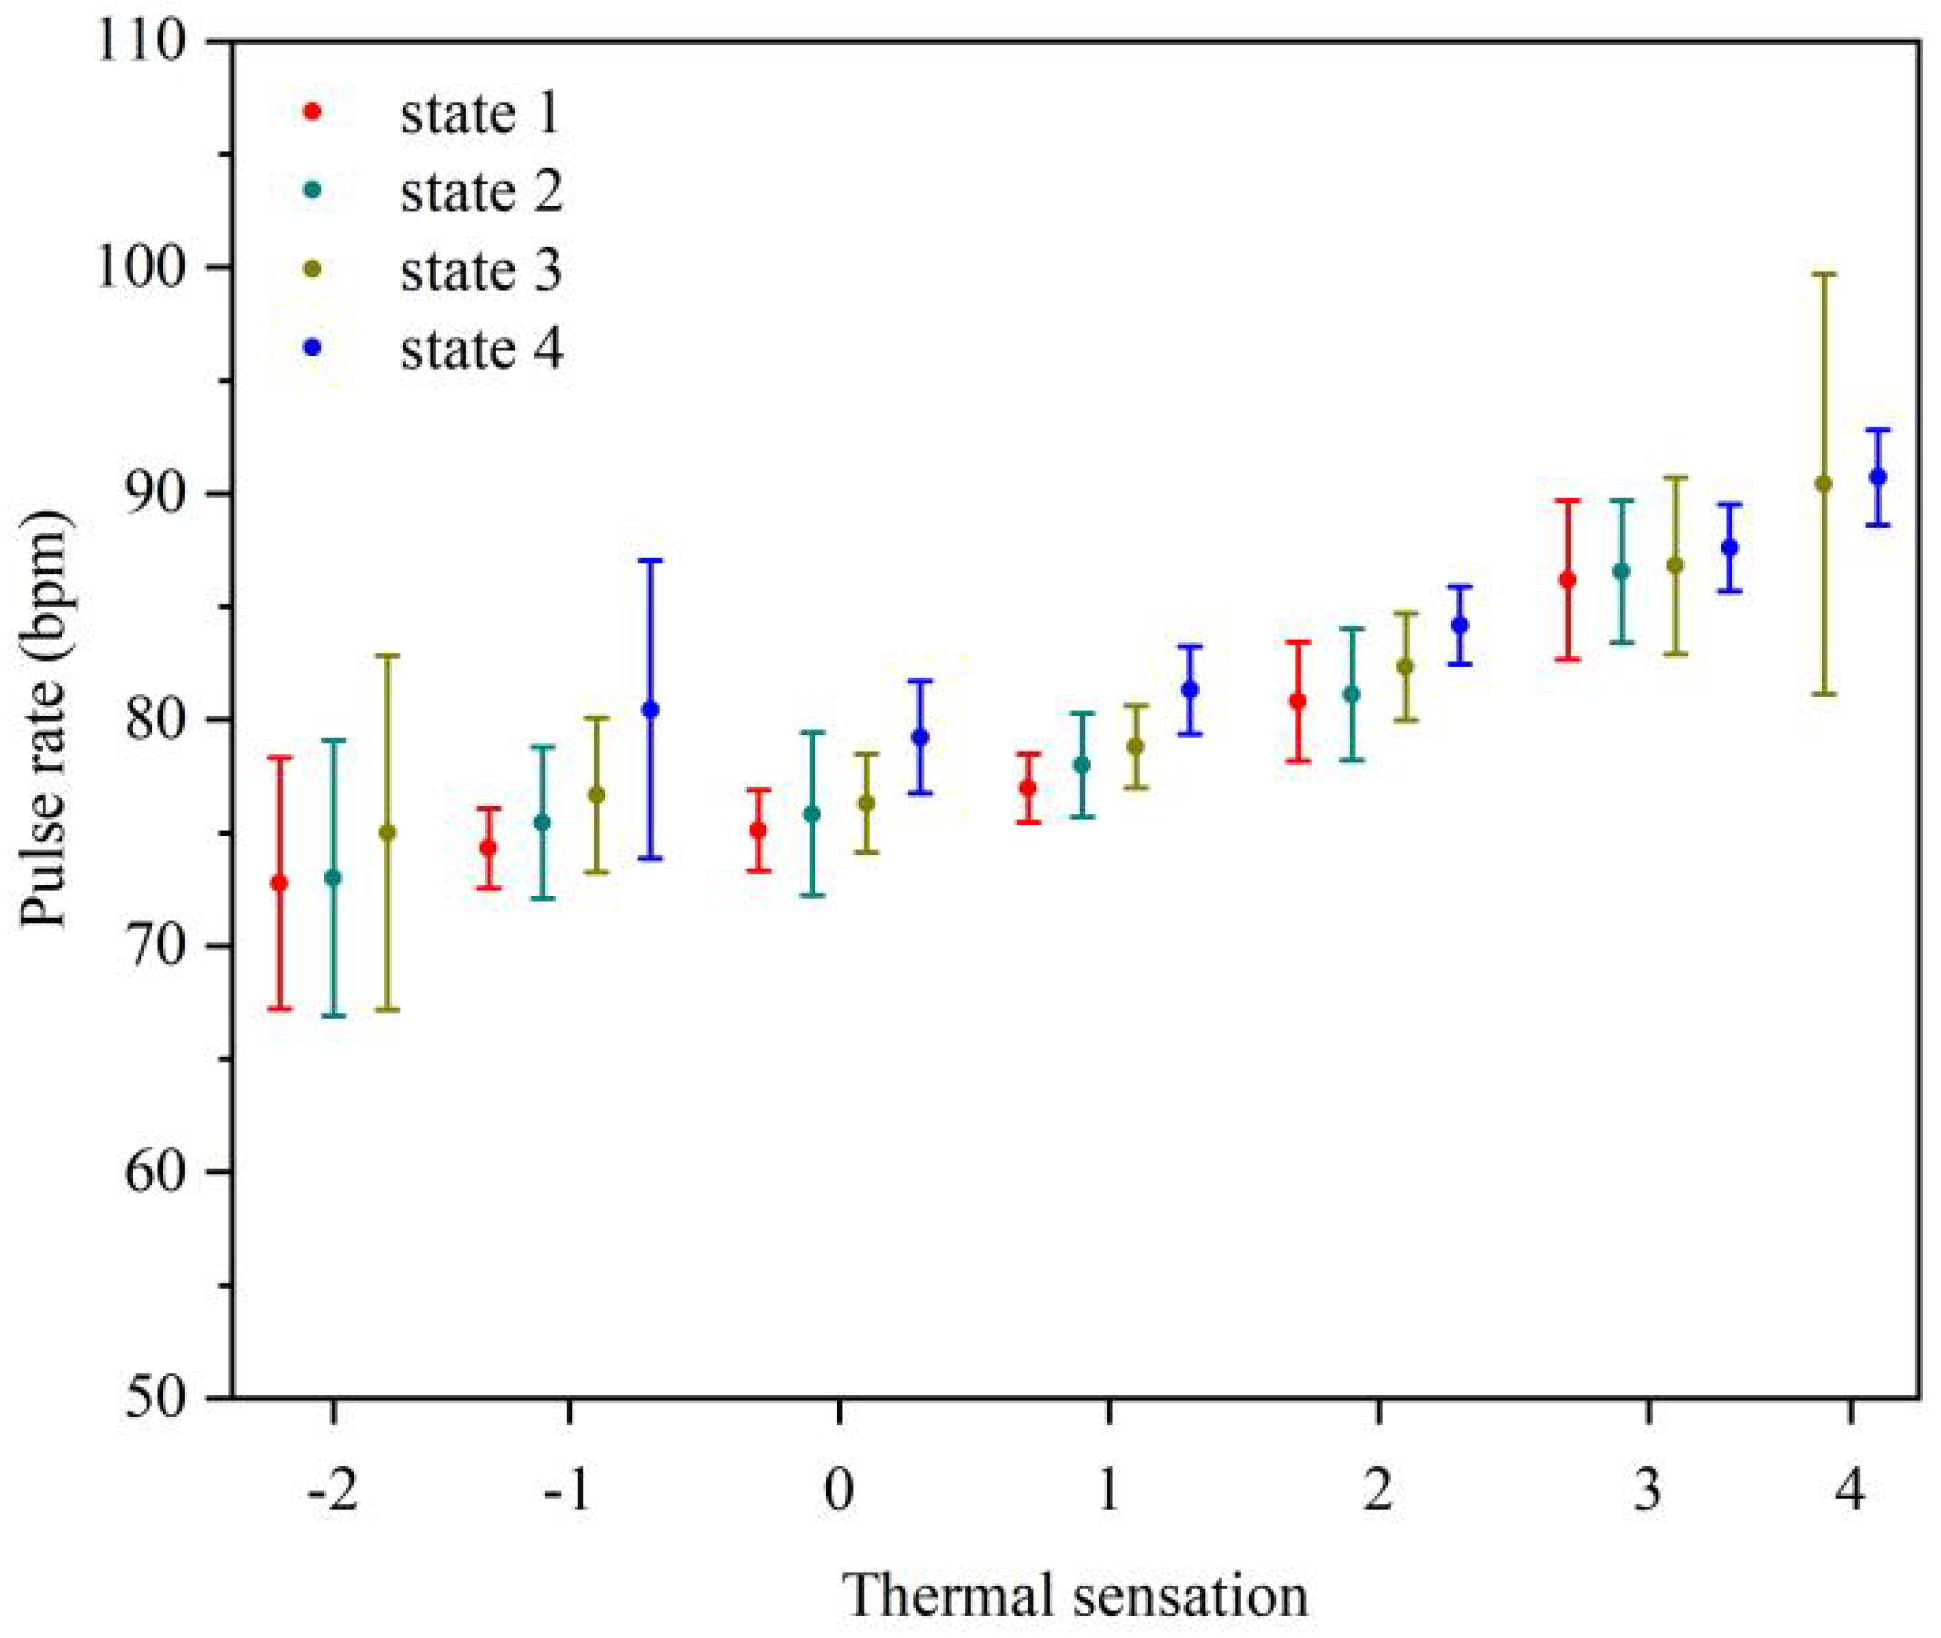
Many studies [32,33,34] pointed out that there was an important relationship between the human metabolic rate and pulse rate, and human metabolic rate was different under different protection states. Therefore, the human body has different levels of pulse rate under different protection states. Figure 11 shows the error interval plot of the subject’s pulse rate relative to thermal sensation under different protection states. The mean pulse rate of subjects in state 1, state 2, state 3, and state 4 varied in the range of 71–80 bpm, 72–81 bpm, 71–83 bpm, and 79–85 bpm, respectively. Under different protection states, the pulse rate increased with the increase of thermal sensation, indicating that the pulse rate was positively correlated with thermal sensation. When TSV = 0, the average pulse rate of the subjects under four different protection states was close to the standard average pulse rate (75 bpm). This may indicate that the average pulse rate attempted to stabilize at the average standard level when the subjects felt neutral.

3.3.3. Thermal Sensation Estimation Model

It can be seen from the experimental results that the human thermal sensation in indoor crowded spaces is affected by indoor temperature, wrist skin temperature and pulse rate. Since the indoor temperature is positively correlated with human wrist skin temperature and pulse rate, it is incorrect to take indoor temperature, human wrist skin and pulse rate as variables when using multiple linear regression model to establish the thermal sensation estimation model of protective personnel in indoor crowded spaces. Therefore, this section aimed to establish a mathematical model of thermal sensation, wrist skin temperature, and pulse rate of protective personnel in indoor crowded spaces.
The mathematical expression of thermal sensation estimation model of protective personnel in indoor crowded spaces established in this study is as follows:
T S V = a + b T w s k + c H R
where:
  • T S V : The thermal sensation vote, which is used to evaluate the degree of human thermal sensation;
  • T w s k : The average temperature of wrist skin (°C);
  • H R : the pulse rate (bpm).
The thermal sensation estimation model of personnel under different protection states in indoor crowded spaces is shown in Table 5. To compare and evaluate the performance of thermal sensation estimation models, the correlation coefficients, adjusted R2 and RMSE of each model were calculated. As shown in Table 5, the accuracy of thermal sensation estimation model was the highest in state 1, and in the remaining states, the adjusted R2 were more than 82%. In addition, RMSE of all models were less than 1, indicating that the thermal sensation estimation model has good prediction effect. The correlation coefficient and adjusted R2 of the overall thermal sensation estimation model were greater than those of the thermal sensation estimation model only in state 4, but the overall thermal sensation estimation model still had good regression performance. The RMSE was 0.723, indicating that the model has high thermal sensation estimation accuracy.
In order to find out which variables are important in the prediction, the standardized regression coefficient was calculated in this study. In multiple regression models, standardized regression coefficients were used to represent the relative importance of all regression variables. The smaller the value of the standardized regression coefficient, the less important the regression variable.
β j ' = β j × σ x σ y = β j × 1 n i = 1 n x i x ¯ 2 / 1 n i = 1 n y i y ¯ 2
where:
  • β j ' : The standardized regression coefficients;
  • σ x : The standard deviation of x ;
  • σ y : The standard deviation of y ;
  • x i : Independent variable;
  • y : Dependent variable;
  • β j : The unit influence of x j on y ;
  • n : The total number of observations sets.
The absolute value of standardized regression coefficients directly reflects the effect of x i on y . In the overall thermal sensation estimation model, the standardized regression coefficients of human wrist skin temperature and pulse rate were 0.94 and 0.31, respectively. The results revealed that pulse rate was less significant than the wrist skin temperature.

3.4. Discussion

As shown in Table 5, with the strengthening of the protection state, the correlation coefficient of the thermal sensation estimation model of each protection state gradually decreases, indicating that the strengthening of the protection state leads to the decline of the accuracy of estimating thermal sensation from wrist skin temperature and pulse rate. It may be associated with the enhanced body thermoregulatory with the strengthening of the protection state. When the protection state is strengthened, the function of blocking the heat exchange between the human body and the external environment is strengthened, the heat storage in the human body is increased and the sympathetic nervous system is excited, which causes the rise of skin temperature and pulse rate, and then leads to the decrease of the difference of physiological parameters between the adjacent thermal sensation.
As illustrated in Section 3.3, the statistical analysis and correlation analysis suggest that the wrist skin temperature and the pulse rate can be used for estimating thermal sensation under different protection states in indoor crowded spaces with high accuracy. In addition, the thermal sensation estimation model created in this study is also applicable to high temperature environment. Compared with previous studies [24,25,26,27], which mainly focused on the unprotected state of indoor personnel, in our study, the possibility of using wrist skin temperature and pulse rate to estimate thermal sensation under different protection states is detailed demonstrated. Furthermore, the proposed model provides potential application of thermal environment control for indoor crowded spaces during the prevention of COVID-19.
However, certain limitations do exist in this study. First, the number of subjects in this study was relatively small. Although the sample size has met the requirements of indoor crowded space, the data of thermal comfort questionnaire and physiological parameters are feasible and meaningful for statistical analysis and correlation analysis, and additional human subject tests would increase the validity and accuracy of the results. In addition, the subjects of this study were young people. The findings may not be applicable to people of different ages. In future study, more subjects with different ages can participate in the experiment.

4. Conclusions

In this paper, a series of human experiments were conducted in the climate chamber summer to effectively assessed the thermal perception and physiological response of people in indoor crowded spaces under different protection states, and to explore the relationship between thermal sensation and physiological parameters of indoor protective personnel through regression analysis. Based on this study, the following conclusions can be drawn:
(1)
Medical protective clothing has the most obvious effect in blocking heat exchange between human body and environment. The thermal sensation in state 4 was significantly higher (p < 0.05) than that in the other three states. When the indoor temperature was 22–24 °C, the thermal comfort in state 4 was lower than that in other states. However, when the indoor temperature was 26–36 °C, the thermal comfort in state 4 was significantly higher than that in other states. At low temperature (22–28 °C), masks had little effect on human thermal perception. The thermal perception in state 1 was basically the same as those in state 2.
(2)
The thermal sensation under the four protective states increased with the increase of indoor temperature, and the thermal comfort first decreased and then increased.
(3)
As the indoor temperature increased from 22 °C to 36 °C, wrist skin temperature and pulse rate gradually increased under different protection states. In addition, at the same room temperature, the average wrist skin temperature and average pulse rate under different protection states increased with the strengthening of protection state.
(4)
The thermal sensation estimation model was established by using multiple linear regression models with wrist skin temperature and pulse rate as variables. Among all of the models, the thermal sensation estimation model in state 1 showed the highest accuracy, and the adjusted R2 was above 82% in the remaining three protection states. Moreover, the RMSE of all models were less than 1, indicating that the thermal sensation estimation model had a good prediction effect.

Author Contributions

Conceptualization, Q.D. and Z.Z.; methodology, X.S. and Z.R.; validation, T.L., G.Y. and J.W.; formal analysis, Q.D. and T.L.; investigation, Z.Z.; resources, G.Y.; data cu-ration, T.L.; writing-original draft preparation, T.L.; funding acquisition, Q.D., X.S. and Z.Z. All authors have read and agreed to the published version of the manuscript.

Funding

This Project was funded by the National Natural Science Foundation of China (Grant No. 51808410); Sanya Science and Education Innovation Park of Wuhan University of Technology (Grant No. 2021KF0002).

Institutional Review Board Statement

Not applicable.

Informed Consent Statement

Not applicable.

Data Availability Statement

Not applicable.

Conflicts of Interest

The authors declare no conflict of interest.

References

  1. Available online: https://www.who.int/zh/emergencies/diseases/novel-coronavirus-2019/question-and-answers-hub/q-a-detail/coronavirus-disease-covid-19-how-is-it-transmitted (accessed on 30 April 2021).
  2. Felter, C.; Bussemaker, N. Which Countries Are Requiring Face Masks? Council on Foreign Relations: New York, NY, USA, 2020. [Google Scholar]
  3. Ahmad, A.; Garhwal, S.; Ray, S.K. The Number of Confirmed Cases of Covid-19 by using Machine Learning: Methods and Challenges. Arch. Comput. Methods Eng. 2020, 28, 1–9. [Google Scholar] [CrossRef]
  4. Zender-Wiercz, E.; Telejko, M.; Galiszewska, B. Influence of Masks Protecting against SARS-CoV-2 on Thermal Comfort. Energies 2021, 14, 3315. [Google Scholar] [CrossRef]
  5. Zhang, R.; Liu, J.; Zhang, L. The distorted power of medical surgical masks for changing the human thermal psychology of indoor personnel in summer. Indoor Air 2021, 31, 1645–1656. [Google Scholar] [CrossRef]
  6. Tang, T.; Zhu, Y.; Zhou, X. Investigation of the effects of face masks on thermal comfort in Guangzhou, China. Build. Environ. 2022, 214, 108932. [Google Scholar] [CrossRef]
  7. Wang, Y.Y.; Jun, L.I.; Wang, G.H. Thermal Comfort Properties of Nonwovens Used in Medical Protective Clothing. J. Donghua Univ. (Nat. Sci.) 2006, 6, 116–119+133. [Google Scholar]
  8. Bongers, C.C.; Korte, J.Q.D.; Catoire, M. Infographic. Cooling strategies to attenuate PPE-induced heat strain during the COVID-19 pandemic. Br. J. Sports Med. 2020, 55, 69–70. [Google Scholar] [CrossRef]
  9. Kuklane, K.; Lundgren, K.; Gao, C. Ebola: Improving the Design of Protective Clothing for Emergency Workers Allows Them to Better Cope with Heat Stress and Help to Contain the Epidemic. Ann. Occup. Hyg. 2015, 59, 258–261. [Google Scholar]
  10. Troynikov, O.; Nawaz, N.; Watson, C. Medical protective clothing. Prot. Cloth. 2014, 20, 192–224. [Google Scholar]
  11. Zhao, M.; Gao, C.; Li, J. Effects of two cooling garments on post-exercise thermal comfort of female subjects in the heat. Fibers Polym. 2015, 16, 1403–1409. [Google Scholar] [CrossRef]
  12. Loibner, M.; Hagauer, S.; Schwantzer, G. Limiting factors for wearing personal protective equipment (PPE) in a health care environment evaluated in a randomised study. PLoS ONE 2019, 14, e0210775. [Google Scholar] [CrossRef]
  13. Scarano, A.; Inchingolo, F.; Lorusso, F. Facial Skin Temperature and Discomfort When Wearing Protective Face Masks: Thermal Infrared Imaging Evaluation and Hands Moving the Mask. Int. J. Environ. Res. Public Health 2020, 17, 4624. [Google Scholar] [CrossRef]
  14. Shi, D.; Song, J.; Du, R. Dual challenges of heat wave and protective facemask-induced thermal stress in Hong Kong. Build. Environ. 2021, 206, 108317. [Google Scholar] [CrossRef]
  15. Arens, E.A.; Zhang, H. The skin’s role in human thermoregulation and comfort. Therm. Moisture Transp. Fibrous Mater. 2006, 560–602. [Google Scholar] [CrossRef] [Green Version]
  16. Charkoudian, N. Skin blood flow in adult human thermoregulation: How it works, when it does not, and why. Mayo Clin. Proc. 2003, 78, 603–612. [Google Scholar] [CrossRef] [Green Version]
  17. Fanger, P.O. Thermal Comfort, Analysis and Application in Environmental Engineering; Danish Technical Press: Copenhagen, Denmark, 1970. [Google Scholar]
  18. Leblanc, J.; Blais, B.; Barabé, B. Effects of temperature and wind on facial temperature, heart rate, and sensation. J. Appl. Physiol. 1976, 40, 127–131. [Google Scholar] [CrossRef]
  19. Xiong, J.; Lian, Z.; Zhou, X.; You, J.; Lin, Y. Potential indicators for the effect of temperature steps on human health and thermal comfort. Energy Build. 2016, 113, 87–98. [Google Scholar] [CrossRef]
  20. Guy, G.P., Jr.; Lee, F.C.; Sunshine, G. Association of State-Issued Mask Mandates and Allowing On-Premises Restaurant Dining with County-Level COVID-19 Case and Death Growth Rates—United States, March 1–December 31, 2020. Morb. Mortal. Wkly. Rep. 2021, 70, 350–354. [Google Scholar] [CrossRef]
  21. Bo, Y.; Guo, C.; Lin, C. Effectiveness of non-pharmaceutical interventions on COVID-19 transmission in 190 countries from 23 January to 13 April 2020. Int. J. Infect. Dis. 2021, 102, 247–253. [Google Scholar] [CrossRef]
  22. Eikenberry, S.E.; Mancuso, M.; Iboi, E. To mask or not to mask: Modeling the potential for face mask use by the general public to curtail the COVID-19 pandemic. Infect. Dis. Model 2020, 5, 293–308. [Google Scholar] [CrossRef]
  23. Standard 55-2017; Thermal Environmental Conditions for Human Occupancy. ASHRAE: Peachtree Corners, GA, USA, 2017.
  24. Choi, J.H.; Yeom, D. Study of data-driven thermal sensation prediction model as a function of local body skin temperatures in a built environment. Build. Environ. 2017, 121, 130–147. [Google Scholar] [CrossRef]
  25. Chaudhuri, T.; Zhai, D.; Soh, Y.C. Thermal comfort prediction using normalized skin temperature in a uniform built environment. Energy Build. 2018, 159, 426–440. [Google Scholar] [CrossRef]
  26. Chaudhuri, T.; Chai, Y.S.; Li, H.; Xie, L. Machine learning driven personal comfort prediction by wearable sensing of pulse rate and skin temperature. Build. Environ. 2020, 170, 106615. [Google Scholar] [CrossRef]
  27. Chaudhuri, T.; Zhai, D.; Chai, Y.S.; Li, H.; Xie, L. Random forest based thermal comfort prediction from gender-specific physiological parameters using wearable sensing technology. Energy Build. 2018, 166, 391–406. [Google Scholar] [CrossRef]
  28. ISO 10551; Ergonomics of the Thermal Environment. Assessment of the Influence of the Thermal Environment Using Subjective Judgment Scales. International Organization for Standardization: Geneva, Switzerland, 1995.
  29. ASHRAE. Data and Measurements in Thermal Comfort, American Society of Heating, Refrigerating and Air-Conditioning Engineers; ASHRAE: Atlanta, GA, USA, 2013; Chapter 9. [Google Scholar]
  30. Choi, J.H.; Yeom, D. Investigation of the relationships between thermal sensations of local body areas and the whole body in an indoor built environment. Energy Build. 2017, 149, 204–215. [Google Scholar] [CrossRef]
  31. Choi, J.H.; Loftness, V. Investigation of human body skin temperatures as a bio-signal to indicate overall thermal sensations. Build. Environ. 2012, 58, 258–269. [Google Scholar] [CrossRef]
  32. Revel, G.; Arnesano, M.; Pietroni, F. Integration of Real-Time metabolic rate measurement in a Low-Cost tool for the thermal comfort monitoring in all environments. In Ambient Assisted Living; Springer: Cham, Switzerland, 2015; pp. 101–110. [Google Scholar]
  33. Green, J.A. The heart rate method for estimating metabolic rate: Review and recommendations. Comp. Biochem. Physiol. Part A Mol. Integr. Physiol. 2011, 158, 287–304. [Google Scholar] [CrossRef]
  34. Butler, P.J.; Green, J.A.; Boyd, I.L. Measuring metabolic rate in the field: The pros and cons of the doubly labelled water and heart rate methods. Funct. Ecol. 2004, 18, 168–183. [Google Scholar] [CrossRef]
Figure 1. The climate chamber. ((a) exterior, (b) interior).
Sustainability 14 05477 g001
Figure 2. Thermal comfort.
Sustainability 14 05477 g002
Figure 3. Experimental procedure.
Sustainability 14 05477 g003
Figure 4. Subjects under different protection states. ((a) state 1, (b) state 2, (c) state 3; (d) state 4).
Sustainability 14 05477 g004
Figure 5. Relationship between mean thermal sensation and indoor temperature.
Sustainability 14 05477 g005
Figure 6. Relationship between mean thermal comfort and indoor temperature.
Sustainability 14 05477 g006
Figure 7. Relationship between thermal sensation and thermal comfort under different protection states. ((a) state 1, (b) state 2, (c) state 3; (d) state 4).
Sustainability 14 05477 g007
Figure 8. Error interval plot of wrist skin temperature by indoor temperature in different protection states.
Sustainability 14 05477 g008
Figure 9. Error interval plot of pulse rate by indoor temperature in different protection states.
Sustainability 14 05477 g009
Figure 10. Error interval plot of wrist skin temperature by thermal sensation in different protection states.
Sustainability 14 05477 g010
Figure 11. Error interval plot of pulse rate by thermal sensation in different protection states.
Sustainability 14 05477 g011
Table 1. Basic physical information of the subjects (Mean ± S.D.).
GenderCountAge (Years)Height (cm)Weight (kg)BMI 0 (kg/m2)Icl 1 (clo)
Male722.6 ± 1.9177.4 ± 5.767.6 ± 8.221.5 ± 2.60.44 ± 0.2
Female322.7 ± 1.7161.7 ± 1.754.5 ± 8.420.8 ± 2.90.46 ± 0.1
0 Body mass index; 1 Clothing Insulation.
Table 2. Information of instrumentation.
ParameterModelSpecifications
Environmental measurements
Air temperatureUX100-003Accuracy: ±0.21 °C/(0–50) °C, Range: (−20–70) °C
Relative humidityUX100-003Accuracy: ±3.5%, Range: (15–95)%
Air velocityAZ9671Accuracy: ±2%, Range: (0.6–32) m/s
Physiological measurements
Skin temperatureDS1922LAccuracy: ±0.5 °C, Range: (−40–85) °C
Pulse rateCMS50DAccuracy: ±2%, Range: (30–250) bpm
Table 3. ISO 10551 9-points thermal sensation scale.
−4−3−2−101234
Very coldColdCoolSlightly coolNeutralSlightly warmWarmHotVery hot
Table 4. Different protection states.
NumberProtection StateIndoor Temperature Range
State 1without protection22/24/26/28/30/32/34/36 °C
State 2wearing masks
State 3wearing face shield
State 4wearing medical protective clothing
Table 5. Thermal sensation estimation model and its performance.
Protection StateRegression CoefficientSig.Correlation CoefficientAdjusted R2RMSE
abc
state 1−19.4150.6850.0750.0000.9110.8860.621
state 2−20.2560.7870.0650.0000.8950.8720.654
state 3−21.3000.8530.0420.0000.8720.8510.695
state 4−23.7450.9620.0320.0000.8410.8250.769
oversall−22.5400.8840.0380.0000.8580.8430.723
Publisher’s Note: MDPI stays neutral with regard to jurisdictional claims in published maps and institutional affiliations.