Article

Spatial Analysis of Air Quality Assessment in Two Cities in Nigeria: A Comparison of Perceptions with Instrument-Based Methods

Centre for Environment and Sustainability, University of Surrey, Guildford GU2 7XH, UK
*
Author to whom correspondence should be addressed.
Sustainability 2022, 14(9), 5403; https://doi.org/10.3390/su14095403
Submission received: 15 March 2022 / Revised: 13 April 2022 / Accepted: 26 April 2022 / Published: 30 April 2022
(This article belongs to the Section Environmental Sustainability and Applications)

Abstract

:
The air quality (AQ) in urban contexts is a major concern, especially in the developing world. The environmental and social challenges created by poor AQ have continued to increase despite improvements in monitoring AQ using earth observation (EO) satellites, static and mobile ground-based sensors and models. However, these types of equipment can be expensive to purchase, operate, and maintain, especially for cities of the developing world, and, as a result, there is growing interest in the elicitation of residents’ perceptions of AQ. However, there is a need to analyse how the results obtained from sensor measurements and models match the AQ as perceived by residents. This study explored AQ in multiple locations in two developing world cities (Abuja and Enugu) in Nigeria by analysing the perceptions of 262 residents and how these compared with findings obtained from ground-based instruments. The results suggest that the perceived AQ of the locations broadly matches those obtained using instruments, although there were statistically significant differences between respondent groups based on the demographic factors of income-education (Abuja) and age (Enugu). This research supports the contention that perceptual AQ assessment provides a valuable source of data for policy and decision-makers when addressing poor AQ and can support action in the absence of instrument-based measurements.

1. Introduction

The burden of disease linked with exposure to poor AQ is significant and rising, and this is especially the case in middle and low-income countries [1]. The World Health Organization (WHO) has reported that ambient poor AQ is responsible for about 4.2 million global deaths annually, with 99% of the global population breathing air that exceeds the organisation’s guideline limits [2]. Poor AQ also has several important adverse impacts on climate change and may directly affect natural ecosystems and biodiversity [3]. Nitrogen oxides (NOX), nitrogen monoxide (NO), and ammonia (NH3) emissions alter terrestrial and aquatic ecosystems and Tropospheric Ozone (O3), while black carbon and Particulate Matter (PM) are short-lived climate forcers that lead directly to global warming. Poor AQ also damages materials, buildings and artwork through corrosion, biodegradation, and weathering and fading of colours. A report by [3] also stated that the market costs of Poor AQ include reduction in productivity of labour, extra health expenses, and loss in yield of crops and forests. Indeed, despite urbanisation being one of the fundamental features of economic development, concerns about AQ have led to a wide-ranging discussion about the meaning of urban sustainability [4]. An important consideration here is the need to define what is meant by AQ. A common approach taken by agencies charged with monitoring and managing AQ is to define it in terms of concentrations of pollutants, be they gasses or particles in the air (please see for example [5]).
Appropriate means of assessing pollutant levels are needed as the basis for AQ management [6], and many instruments such as passive air pollutant samplers, air quality sensors, reference instruments [7], and Earth Observation (EO) satellites have been employed, with data from such instruments often used as the basis for predictive models [8,9,10]. According to [11], nearly all urban areas in Europe and North America have networks of AQ monitoring instruments at a density of about 1 per 100,000 to 600,000 residents, while in developing regions, such as Africa, it is estimated to be around 1 per 4,200,000 residents. Although there has been some improvement in recent years, there are still huge challenges in monitoring AQ, especially in urban areas of developing countries [12]. For instance, ref. [11] reported that in the United States of America (USA), federal, state, and tribal agencies constructed the existing AQ monitoring systems over five decades at a cost of millions of dollars for the hardware, human resources, and institutional frameworks to install and maintain monitoring stations and process, analyse, and report the information. Additionally, in developed countries such as the USA, there is a steady electricity supply system, telecommunications, and other structures to ensure uninterrupted collection/processing of data as well as maintenance of hardware.
Conversely, many cities in developing countries have an unstable electricity supply, inadequate or no laboratories or air quality monitoring stations, little or no financial and human resources, and weak telecommunications systems, resulting in a dearth of reliable and timely information on AQ [13,14]. Finding and using the best monitoring equipment may be unique to each context and may also depend on levels of precision required, standards and regulatory framework. For example, ref. [7,15] note that a sensor’s ability to measure accurately can be compromised by chemical and physical interference, and improvements designed to tackle the abnormalities need to be validated against reference measurements. Low-cost alternative sensors have been developed, but the measurements can fluctuate depending upon factors such as temperature, humidity, pressure, and signal instability [15].
A different approach to assessing and managing AQ is to seek the views and perceptions of those people directly experiencing it. For example, an investigation by [16] found that people perceived AQ to be very poor and the major environmental problem in Ljubljana, Slovenia, while [17] found that urban residents, especially those suffering from asthma, are more concerned about and tend to check the AQ in their vicinity. In their study at Richards Bay and its surroundings in uMhlathuze Municipality, KwaZulu, South Africa, ref. [18] found that residents were concerned about AQ, and most perceive it to be fair or poor, with industrial emissions regarded by them as the major cause of poor AQ. According to [19], residents in Accra, Ghana, were aware that their AQ is poor and does influence their health, although they also found that some demographic groups, such as the less educated and the elderly, were less aware of poor AQ in the city. Similar work was conducted in Nigeria among people living near a cement manufacturing area of Ewokoro and Reno-North Local Government Areas of Ogun State by [20] and noted that people are aware of poor AQ and its adverse health effects. Recently, ref. [21] using an online survey of residents’ perception of AQ in Abuja and Enugu cities, Nigeria, stated that a variety of ‘perceptual’ indicators of poor AQ were employed, and these varied in terms of their relative importance (Table 1). Respondents were aware of their exposure to poor AQ, and they used smoke, dust, and odour as the main perceptual indicators of poor AQ. However, while the use of perceptual indicators of poor AQ has value, according to [16], the use of such tools should be seen as providing a “supplementary” approach alongside data from monitoring instruments.
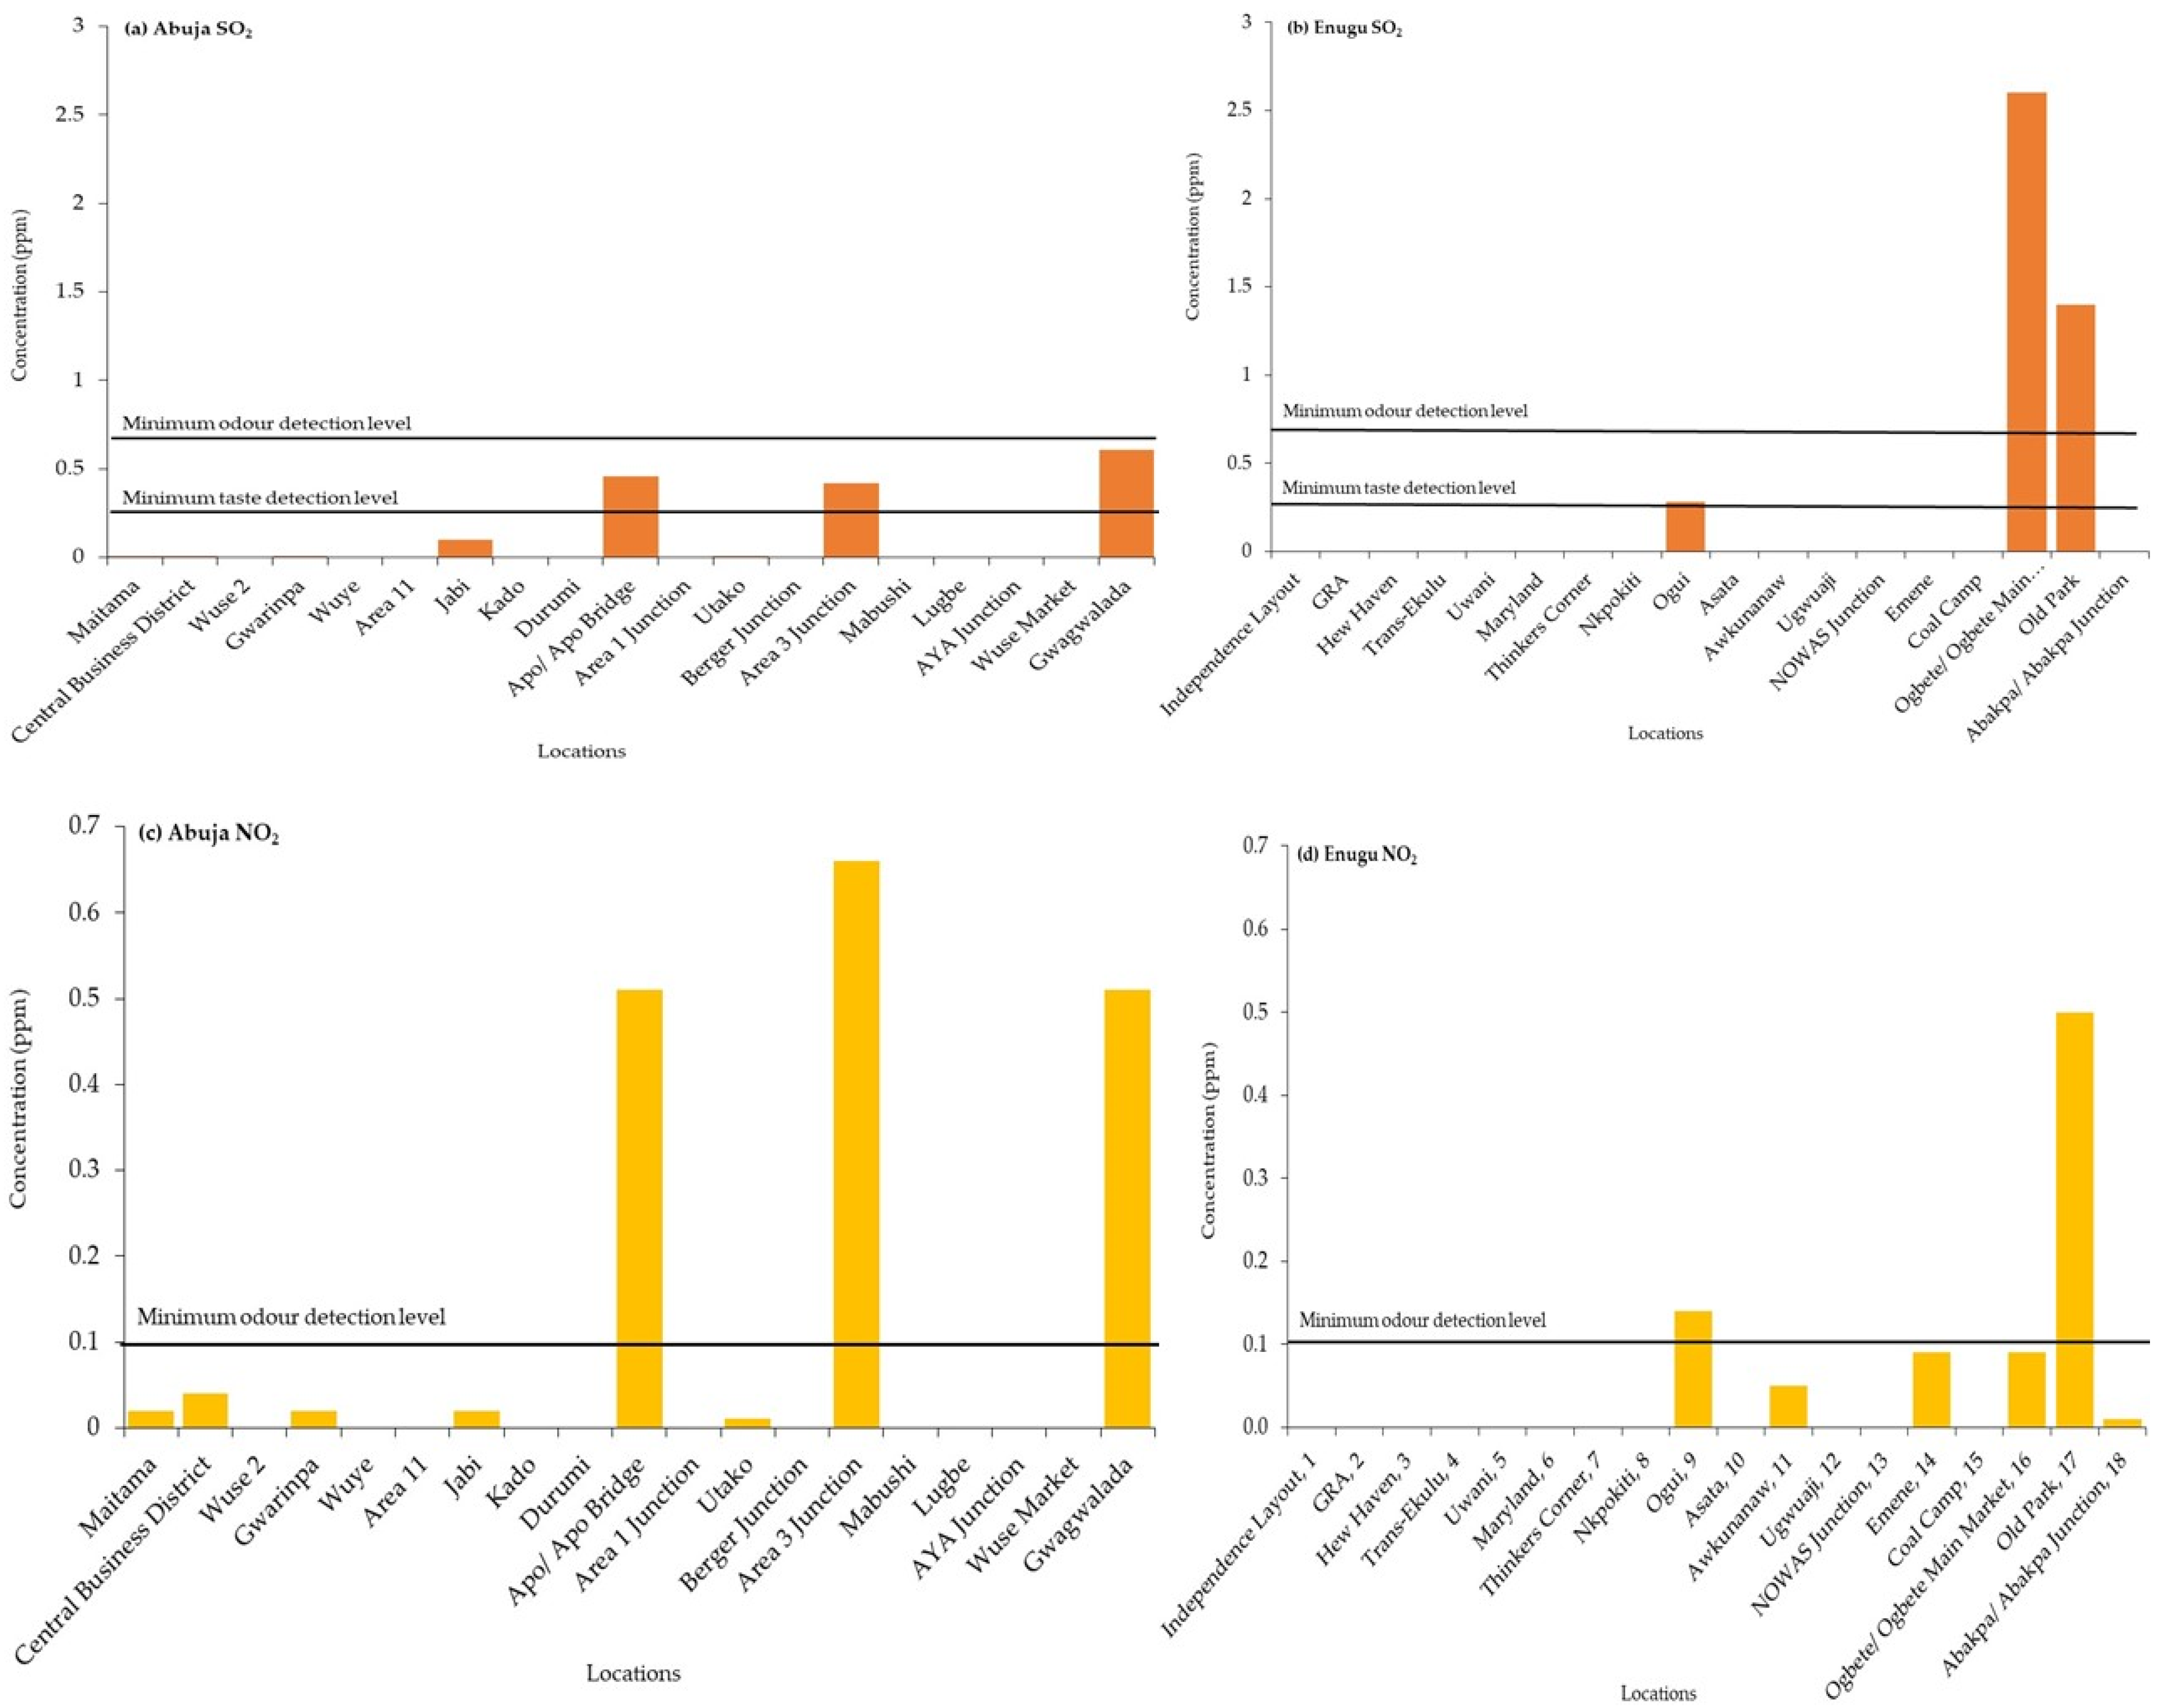
One of the issues with using perceptual indicators is that much is likely to depend on the biological ability of humans to detect pollutants. For the particulate matter (PM)-based indicators, such as smoke and dust, the detection may be relatively straightforward as people can see smoke as well as dirt on skin, clothes and surfaces, and indeed this may well explain their relatively high ranking in Table 1. Gaseous pollutants such as SO2 and NO2 are typically detected by people through odour and taste. The colourless gas SO2 can be detected by taste at concentrations of 0.35 to 1.05 ppm and has an irritating odour with a threshold in the range of 0.67–4.75 ppm, depending upon the individual [22]. An odour threshold range of 0.1 to 0.4 ppm for NO2 is cited by [23]. On the other hand, CO is both a colourless and odourless gas that humans cannot so readily detect. Hence, while odour and even taste are important perceptual indicators, as noted in Table 1, some pollutants may not be detectable if concentrations are below a threshold, while others may not be detectable unless levels are so high that they cause effects such as difficulty in breathing. It is also conceivable that the ability to detect pollutants may vary depending on factors such as age, health and education, and there is also the possibility that experience of exposure to poor AQ could be important. Finally, it is also likely that people’s perceptions of poor AQ may be framed by assumptions based on the prevalence of causes such as traffic or indeed influenced by the views of others. Therefore, while public perceptions of AQ have been explored by researchers, albeit to a much lesser extent in urban areas of the developing than the developed world, there are important questions to ask about how well such perceptions match results obtained using instruments.
Some studies have suggested that perceived AQ can match well with instrument-measured and model-based results, although many of these have been conducted in urban contexts in the developed world [24]. A study by [25] noted that smells reported by individuals were significantly associated with modelled NO2 and SO2 concentrations, and in their study of public perceptions of AQ in Chinese cities, ref. [26] noted that perceptions can match results based on reference equipment. However, others have noted that perceptual indicators of poor AQ may not necessarily tally with instrument-based measurements [27,28,29]. For example, ref. [30] found an insignificant relationship between perceived and measured AQ in Seoul, South Korea, and in their work in the USA [31] found perceived AQ to be getting worse while instrumentally obtained information showed there had been an improvement. In Texas, United States of America, ref. [32] found only a weak relationship between perceived AQ made by locals and that measured via instruments.
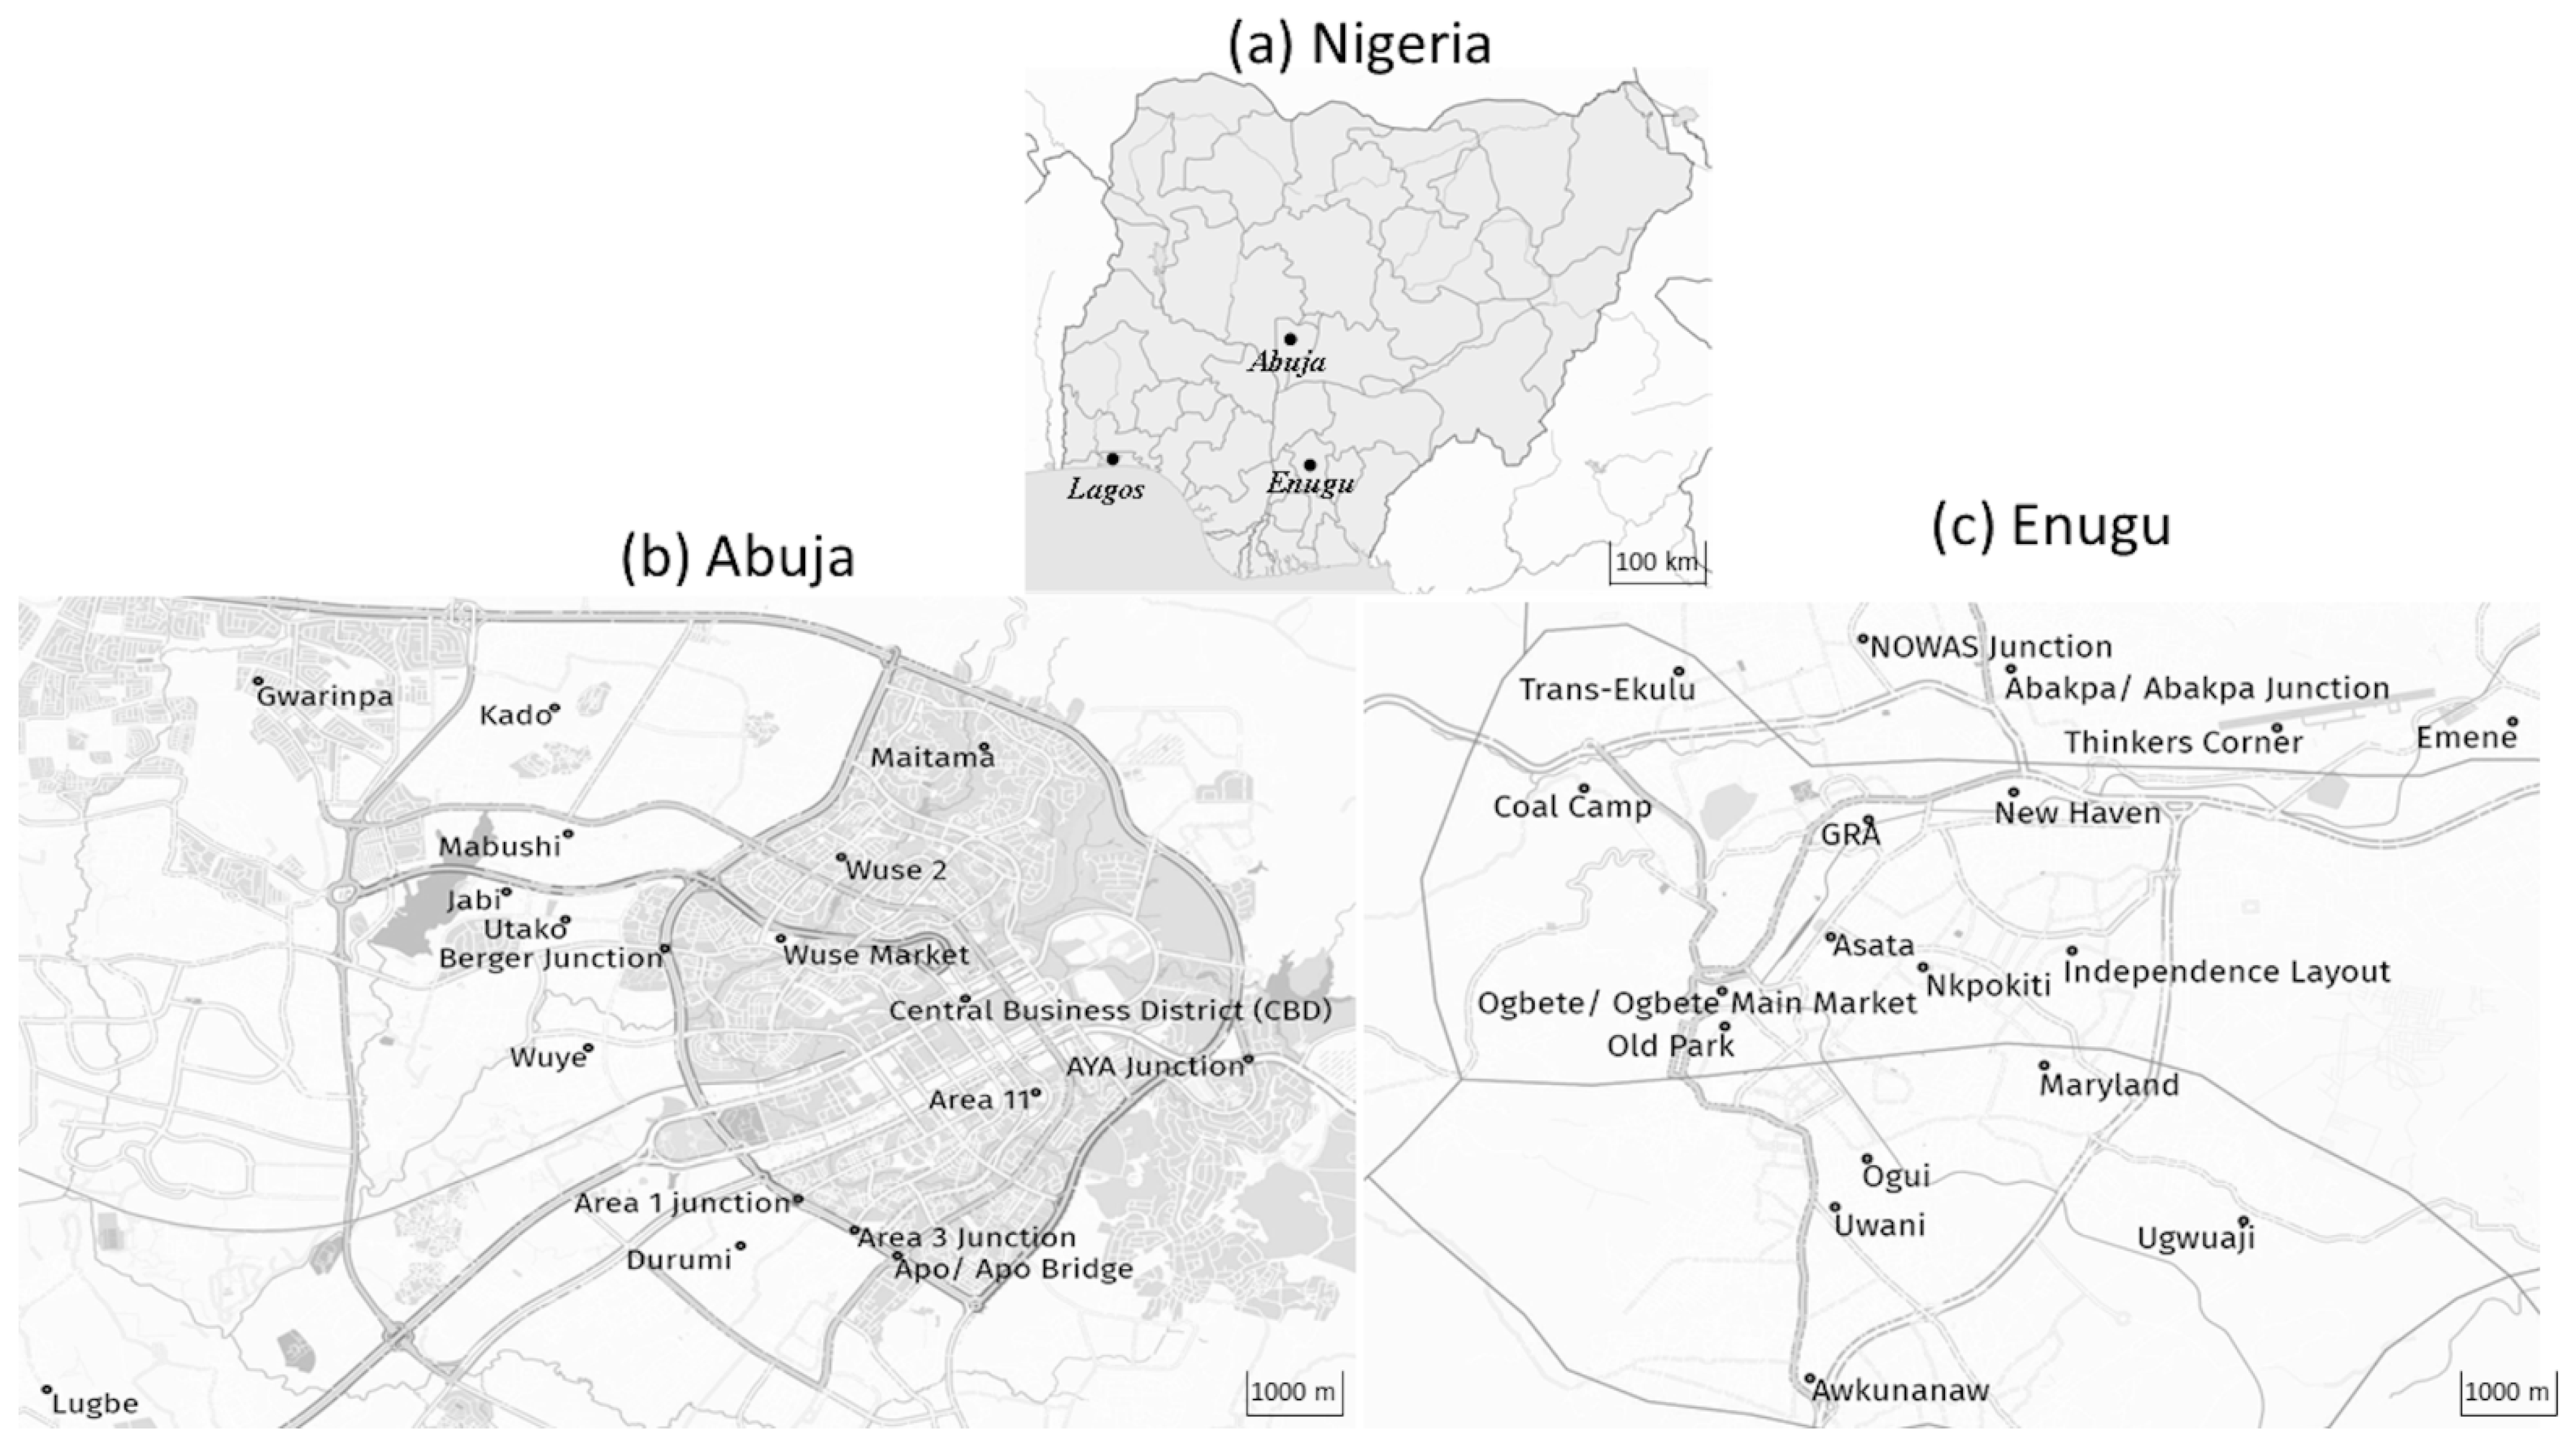
However, there remains a dearth of such comparative studies from urban areas of the developing world. Hence, the aim of the research set out in this paper was to explore the link between perceptual indicators of AQ and measurements from instruments in various locations within two cities in Nigeria (Abuja and Enugu) along with whether various demographic factors influenced perceptions of AQ in those locations. The two cities were chosen for their contrasting geographical and socio-economic situations (summarised below), although the intention was not to compare the two cities per se. Instead, the choice of such contrasting urban contexts was intended to provide the basis for a robust comparison between perceptual and instrument-based analysis of AQ.

2. Materials and Methods

2.1. Research Locations

Nigeria, the most populous country in Africa, is situated on the West African coast, with Benin, Niger, Chad, and Cameroon as border countries (Figure 1). The country comprises 36 states, including Enugu state in the south which has Enugu city as the capital. The country also has Abuja, the country’s capital city, located in the Federal Capital Territory (FCT) at the geographical centre of the country. Nigeria’s population in 2021 was estimated to be 211.4 million which makes the country the most populous country in Africa [33], with over half the population living in cities [34,35].
Abuja city sits at an elevation of 840 m above sea level at 9°4′ N 7°29′ E and has an annual rainfall of between 305 mm to 762 mm and a daily mean temperature of 32.5 °C [36]. In 2010, the United Nations regarded the city as the world’s fastest-growing, with a 140% increase in 10 years (2000–2010) [37]. Nigeria’s National Bureau for Statistics 2016 estimated the population of FCT to be 3.5 million using the annual growth rate of 9.3% from the country’s 2006 population census, with Abuja metropolis having a projected population of roughly 1.9 million [38]. Abuja, which replaced the older and more densely populated city of Lagos as the capital of Nigeria in December 1991, is a planned city with wide roads and districts mapped out for residential houses, governmental buildings, and commercial activities. Abuja’s economy is dominated by the financial service sector, retail and real estate, although there is some manufacturing that takes place in the Idu industrial area.
Enugu city is the capital of the Nigerian south-eastern state of Enugu (Figure 1). The city is located at approximately 223 m above sea level at 6°27′10″ N 7°30′40″ E and has an annual rainfall of approximately 2000 mm and a daily mean temperature of 26.7 °C [39,40]. Enugu city’s population was estimated to be 773,000 in 2019 [41]. Unlike Abuja, which is a more recent construct from the 1970s, Enugu existed long before Nigerian independence in 1960 and is not a “planned” city. Without formal zoning, the road system has evolved with the city’s growth, and manufacturing and business activities are intermixed with residential locations.

2.2. Sample Participants and Demographics

The research employed a questionnaire-based survey of residents in Abuja (137 respondents) and Enugu (125 respondents), and the sample was stratified to guarantee adequate demographic to reflect the population profile in the two cities (Table 2). The result of the stratification was an approximately 50:50 gender balance in both cities. Age was categorised into two groups: 18–34 years and 35 years or over-covering 45% and 55% of respondents, respectively, in the two cities. The categorisation of age into two groups allowed an alignment with the official classification into adults and youth in Nigeria [42]. The minimum age of 18 years was designed to broadly comply with the research ethic protocols of the research organisation (University of Surrey). The income level was divided into three categories of no income/low income, mid-income, and higher income. There was a higher proportion of higher-income earners in the Abuja sample (40% of respondents) compared with Enugu (15% of respondents). Additionally, more respondents have higher education (PhD/masters or equivalent) in Abuja (36% of respondents) than in Enugu (18% of respondents). The three categories of income were chosen to allow for adequate numbers within each category to facilitate statistical analysis. The three categories are linked to the levels of income (lower income, middle income, and upper income) used by [43] in the USA. Similarly, the respondents were divided into three groups based on the highest level of education to allow for adequate numbers in each group to facilitate statistical analysis. The education and income levels employed here are similar to those of [19] in their study on perceptual AQ in Accra, Ghana.
The gathering of survey data was undertaken between October 2020 and March 2021 during the COVID-19 pandemic. The questionnaires were provided online via the QUALTRICSXM® Platform, although hard copies were also distributed to help some respondents who lacked access to an electronic device. The research was facilitated by carefully chosen, trained, and monitored local field assistants. Incentives were provided to the eight field assistants at 7808 (USD 14) each over the data collection period, and the respondents were paid 1672 (USD 3) each per properly finished survey form. The field assistants helped assure appropriate stratification, exclusion of children due to ethical reasons, and minimisation of the impacts of the COVID-19 pandemic in the demographic categories in Table 2.

2.3. Questionnaire Design, Scoring, and Statistical Analysis

The survey participants were asked to provide demographic information and to score locations within the two cities in terms of their AQ (see Appendix A for the questionnaire format). The locations included in the questionnaire were based on those identified by some key informants during fieldwork undertaken in May and June 2019 and are listed in Table 3 and Table 4, along with some brief descriptive notes based on the experience of the authors. The key informants (12 in number) were from the Federal Ministry of Environment (FME), Abuja Environmental Protection Board (AEPB), Nigeria Meteorological Agency (NIMET), National Orientation Agency (NOA), National Environmental Standards and Regulations and Enforcement Agency (NESREA), National Space Research and Development Agency (NASRDA), and a private construction and other individuals from the cities. They were asked to identify the locations (Table 3 and Table 4) they considered to be useful for comparison in terms of AQ within Abuja and Enugu. They would often mention a location they regarded as likely to have poor AQ and suggested other locations they suspected to have better AQ to provide a comparison. These locations were subsequently included in the survey questionnaire.
Survey respondents were asked to score their overall perception of AQ only for the locations within the city in which they resided using a Likert scale of 1 to 5, where 1 is very good, 2 is good, 3 is neutral (neither good nor poor), 4 is poor, and 5 is very poor. These overall perceptual AQ scores were used in the ranking of the location, as shown in Figure 2.
SPSS® v28.0 software was used for the statistical analysis. Differences in scores between locations and demographic groups were tested using the Kruskal–Wallis and the Hochberg post hoc tests to identify statistically homogenous groupings at p < 0.05 [44,45].
Numbers next to locations on the x-axis are the rank order based on the y-axis data. Error bars are the 95% confidence interval for the means. Numbered horizontal bars (A = Abuja, E = Enugu) are the groupings identified from the Hochberg post hoc test at p < 0.05.

2.4. Instrument-Measured Air Quality Assessment

The authors made use of existing published data for instrument measurements of AQ at the locations in the two cities. This was to be consistent with the available existing data and to minimise constraints due to logistical issues during the Covid 19 pandemic. A desk study (using the search engines Surrey Search, Google and Google Scholar) retrieved 40 published studies from a wide range of sources and date periods on air pollutant concentrations covering Abuja and Enugu. The search was further narrowed by only including those reported in referred academic journals spanning the period 2014 to 2020, giving four sources for Abuja [46,47,48,49] and two sources for Enugu [50,51] (see Tables S4 and S5 (Supplementary Material)). The period chosen for the journal search (2014–2020) allowed for the best match possible with the time of the survey (end 2020/early 2021).
Of the four sources for Abuja, the one with the best coverage in terms of the number of locations was [46], and the other three sources could be used to fill gaps, such as Gwagwalada. For Enugu, both sources were used to cover the locations. One of the issues here is that all the sources used different methods and approaches to assess AQ, and full details of the methods, including instruments, used can be found in the sources listed in Tables S4 and S5. However, as an illustration of this variation, a summary is provided here for [46,50]. The source [46], the one mostly used for the Abuja locations, measured PM2.5 and PM10 using a handheld China Way CW-HAT200 aerosol sampler or counters, with the instrument held 2 m above ground level. Each location was randomly monitored hourly between 06.00 to 12.00 for dry (11–15 February 2019) and wet (17–21 June 2019) seasons. These data were used to calculate the daily mean levels of PM. For SO2, NO2 and CO, a BOSEAN portable gaseous emission analyser was used to determine the ppm. Source [50] focussed on measuring AQ in around three major and two minor roads in Enugu. These researchers employed air samples randomly collected and monitored in periods of high vehicle density, 8:30 am–10:30 am and 4:30 pm–6:30 pm. Data collection took place over three days in the week (Monday, Wednesday and Friday) and twice monthly during September and November 2017. Concentrations of CO, NO2 and SO2 were determined using a 350XL Emission Analyzer. These data were used to calculate the mean daily concentrations of the pollutants.
To address the issue of varying methods and approaches taken across the published studies, source [46] was employed wherever possible for Abuja, and thus if multiple sources reported data for a location, then only [46] was employed. The other sources [49] were only used to fill locations not covered by [46]. In Enugu, the same method was applied. Most of the data came from sources [51] as this is the one with the highest level of coverage across locations, followed by source [50]. Again, if multiple sources were available for a location, then [51] was used as the “default”. Other sources with limited data which are not in the graphs are [52,53,54] for Abuja (Table S4) and [55,56] for Enugu (Table S5), and they identified some locations in both cities to be of high concentration of air pollutants instrumentally obtained.

3. Results

3.1. Perceptual Air Quality of Locations in Abuja and Enugu

The mean scores and 95% confidence intervals of the AQ in the selected locations in Abuja and Enugu are shown in Figure 2, with higher number scores meaning poorer perceived AQ. The locations are ordered so that those with the worst perceived AQ scores are on the right-hand end of the x-axes of Figure 2, while those having the best scores are on the far left. While the perceptions of AQ varied across locations within both cities, it is not possible to use these data to make a more general comparison of AQ between the cities.
Using the Hochberg post hoc test, the locations were divided into statistically homogenous groups (p < 0.05); six groups from the nineteen locations in Abuja and seven groups for the eighteen locations in Enugu. These are labelled A1 to A6 for Abuja and E1 to E7 for Enugu in Figure 2. In Abuja (Figure 2a), the locations with the worst AQ are Gwagwalada and Wuse Market, while the better AQ locations are those in group A1 (Maitama, Central Business District (Central Area), Wuse 2, and Gwarinpa). Maitama is the only location with an AQ viewed as very good by the respondents (Figure 2a). Figure 2a also illustrates locations in group A6 which are Apo/Apo Bridge, Area 1 Junction, Utako, Berger Junction, Area 3 Junction, Mabushi, Lugbe, and AYA junction in Asokoro, which are rated similarly, with Gwagwalada and Wuse Market being the worst AQ locations. In between the better locations and the worst locations are Wuye, Area 11, Jabi, Kado and Durumi. In Enugu (Figure 2b), group E7 which includes Coal Camp, Ogbete/Ogbete Main Market, Old Park and Abakpa/Abakpa Junction are the locations with the worst perceived AQ. The location with the worst AQ in Enugu is Abakpa/Abakpa Junction. Emene, Ugwuaji, and NOWAS Junction are other locations with perceived poorer air quality that also have Nkpokiti, Ogui, Asata, and Awkunanaw in the same group. The locations with the cleanest air in Enugu are Independence Layout and GRA in group E1 with equal scores, followed by New Haven and Trans-Ekulu.
Table 5 and Table 6 present the results of Kruskal–Wallis tests designed to explore differences between demographic groups in terms of their scoring of the AQ of the locations. In each of the two tables, the locations have been ordered so that those having the best AQ are towards the top and those with the worst are towards the bottom of the table. Shaded cells represent those that are statistically significant. There were relatively few statistically significant differences between the demographic groups (29 out of 114 in Abuja and 16 out of 108 in Enugu). Gender was of little, if any, significance in either city, suggesting that males and females broadly agree with the perceptual scoring of the locations, but there were some intriguing differences in other demographics between the cities. In Abuja, for example, there were many significant differences in scoring locations between the income-education group of demographics, especially for those locations towards the bottom half of the table (i.e., those locations with the worst perceived AQ). Income and education are expected to be related as people in jobs with higher incomes tend to have higher education levels. Interestingly, this “income-education-occupation” grouping does not seem to be so important in the scoring of locations in Enugu. Similarly, age seems to influence the relative scoring of locations within Enugu, especially for locations towards the lower half of the table, but not in Abuja. Why these demographic factors in the two cities should influence scoring and why it is that income-education is important in Abuja (but not Enugu) and age is important in Enugu (and not Abuja) is intriguing and some possible explanations are discussed below.

3.2. Instrument-Measured Air Quality

Figure 3 summarises the published data for instrument-measured PM, CO, and NO2 concentrations in some of the locations within the cities (full data are presented in Tables S4 and S5). It can be seen that there is significant variation in concentrations of pollutants across the locations in both cities. Levels of CO were highest (~20 ppm) in the Abuja locations of Apo/Apo Bridge and Area 3 Junction, while in Enugu, the Ogbete/Ogbete Main Market and Old Park locations had comparatively high levels of CO and SO2. Areas with the best AQ were Maitama and the Central Business district in Abuja and Independence Layout and the GRA (Government Residential Area) in Enugu. The published data have gaps for some locations as, for example, there were no data in Wuye, Area 11, Kado, Area 1 Junction, Berger Junction, Mabushi, Lugbe, AYA Junction, and Wuse Market in Abuja. In Enugu, there are no published data for Nkpokiti, Ugwuaji, NOWAS Junction, and Coal Camp.

3.3. Comparing Perceptual and Instrument-Based Assessments

In terms of comparing the overall perceptions of AQ (based on the mean scores) with measurements from instruments, the instrument-measured concentrations of SO2, NO2 and CO for the cities are higher in the locations on the right sides of Figure 3. As the locations in Figure 3 are ranked from left to right based on the scores of respondents, this suggests that the perceptions of the respondents broadly match the AQ as recorded via instruments. The PM data for Abuja are sparse, but the few that are available also have this pattern. In Enugu, the PM concentrations appear to be consistent across all the locations, but there is a suggestion that the areas deemed by respondents to have the best AQ (left-hand side of Figure 3b) do have the lowest PM concentrations. For SO2, NO2, and to a lesser extent CO, the data in Enugu match well with perceived AQ, with the highest concentrations of the pollutants being found in locations where respondents scored the worst.
While the instrument-based measurements of the pollutants matched the perceptions of AQ provided by the respondents, it is important to consider the levels at which humans may detect these pollutants either by odour or taste. Figure 4 presents the instrument-measured concentrations of SO2 and NO2 in locations of the two cities alongside the minimum detectable odour and taste levels found in the literature. The SO2 data for some locations in Abuja (Figure 4a) show recorded concentrations below the odour but above the taste thresholds that can be detected by humans. However, in Enugu (Figure 4b), the SO2 concentrations are well above the minimum taste and odour levels at Ogbete/Ogbete Main Market locations, suggesting that they may be readily detected by humans. In both cities, it is interesting to note how the locations that have levels above the minimum detectable by humans tend to be those locations that scored worse for AQ by the survey respondents. For NO2, the concentrations in Abuja (Figure 4c) and to a lesser extent Enugu (Figure 4d) are well above the detectable (by odour) levels for some locations towards the right-hand side of the graph—those that scored worse by the respondents. Nonetheless, it does need to be noted that the survey respondents are likely to have used additional clues, such as the presence of smoke, dust, and perhaps the odour of a “cocktail” of pollutants (including hydrocarbons), to frame their scoring rather than just direct sensing via odour or taste of SO2 and NO2.
The results can be likened to those of [24], who found congruence between instrument-based measurements of AQ (actual AQ) and perceived AQ in China and a relationship between perceived and instrument-measured AQ in Texas, USA [31]. Using Volunteered Geographic Information Service, ref. [57] also found an association between perceived AQ and actual AQ obtained using the high-resolution model EPISODE. Conversely, ref. [58] in their study in London stated that perceived AQ is not a reliable gauge for actual AQ. This finding can be likened to the works of [30,31] on the relationship between actual and perceptual AQ.

4. Discussion

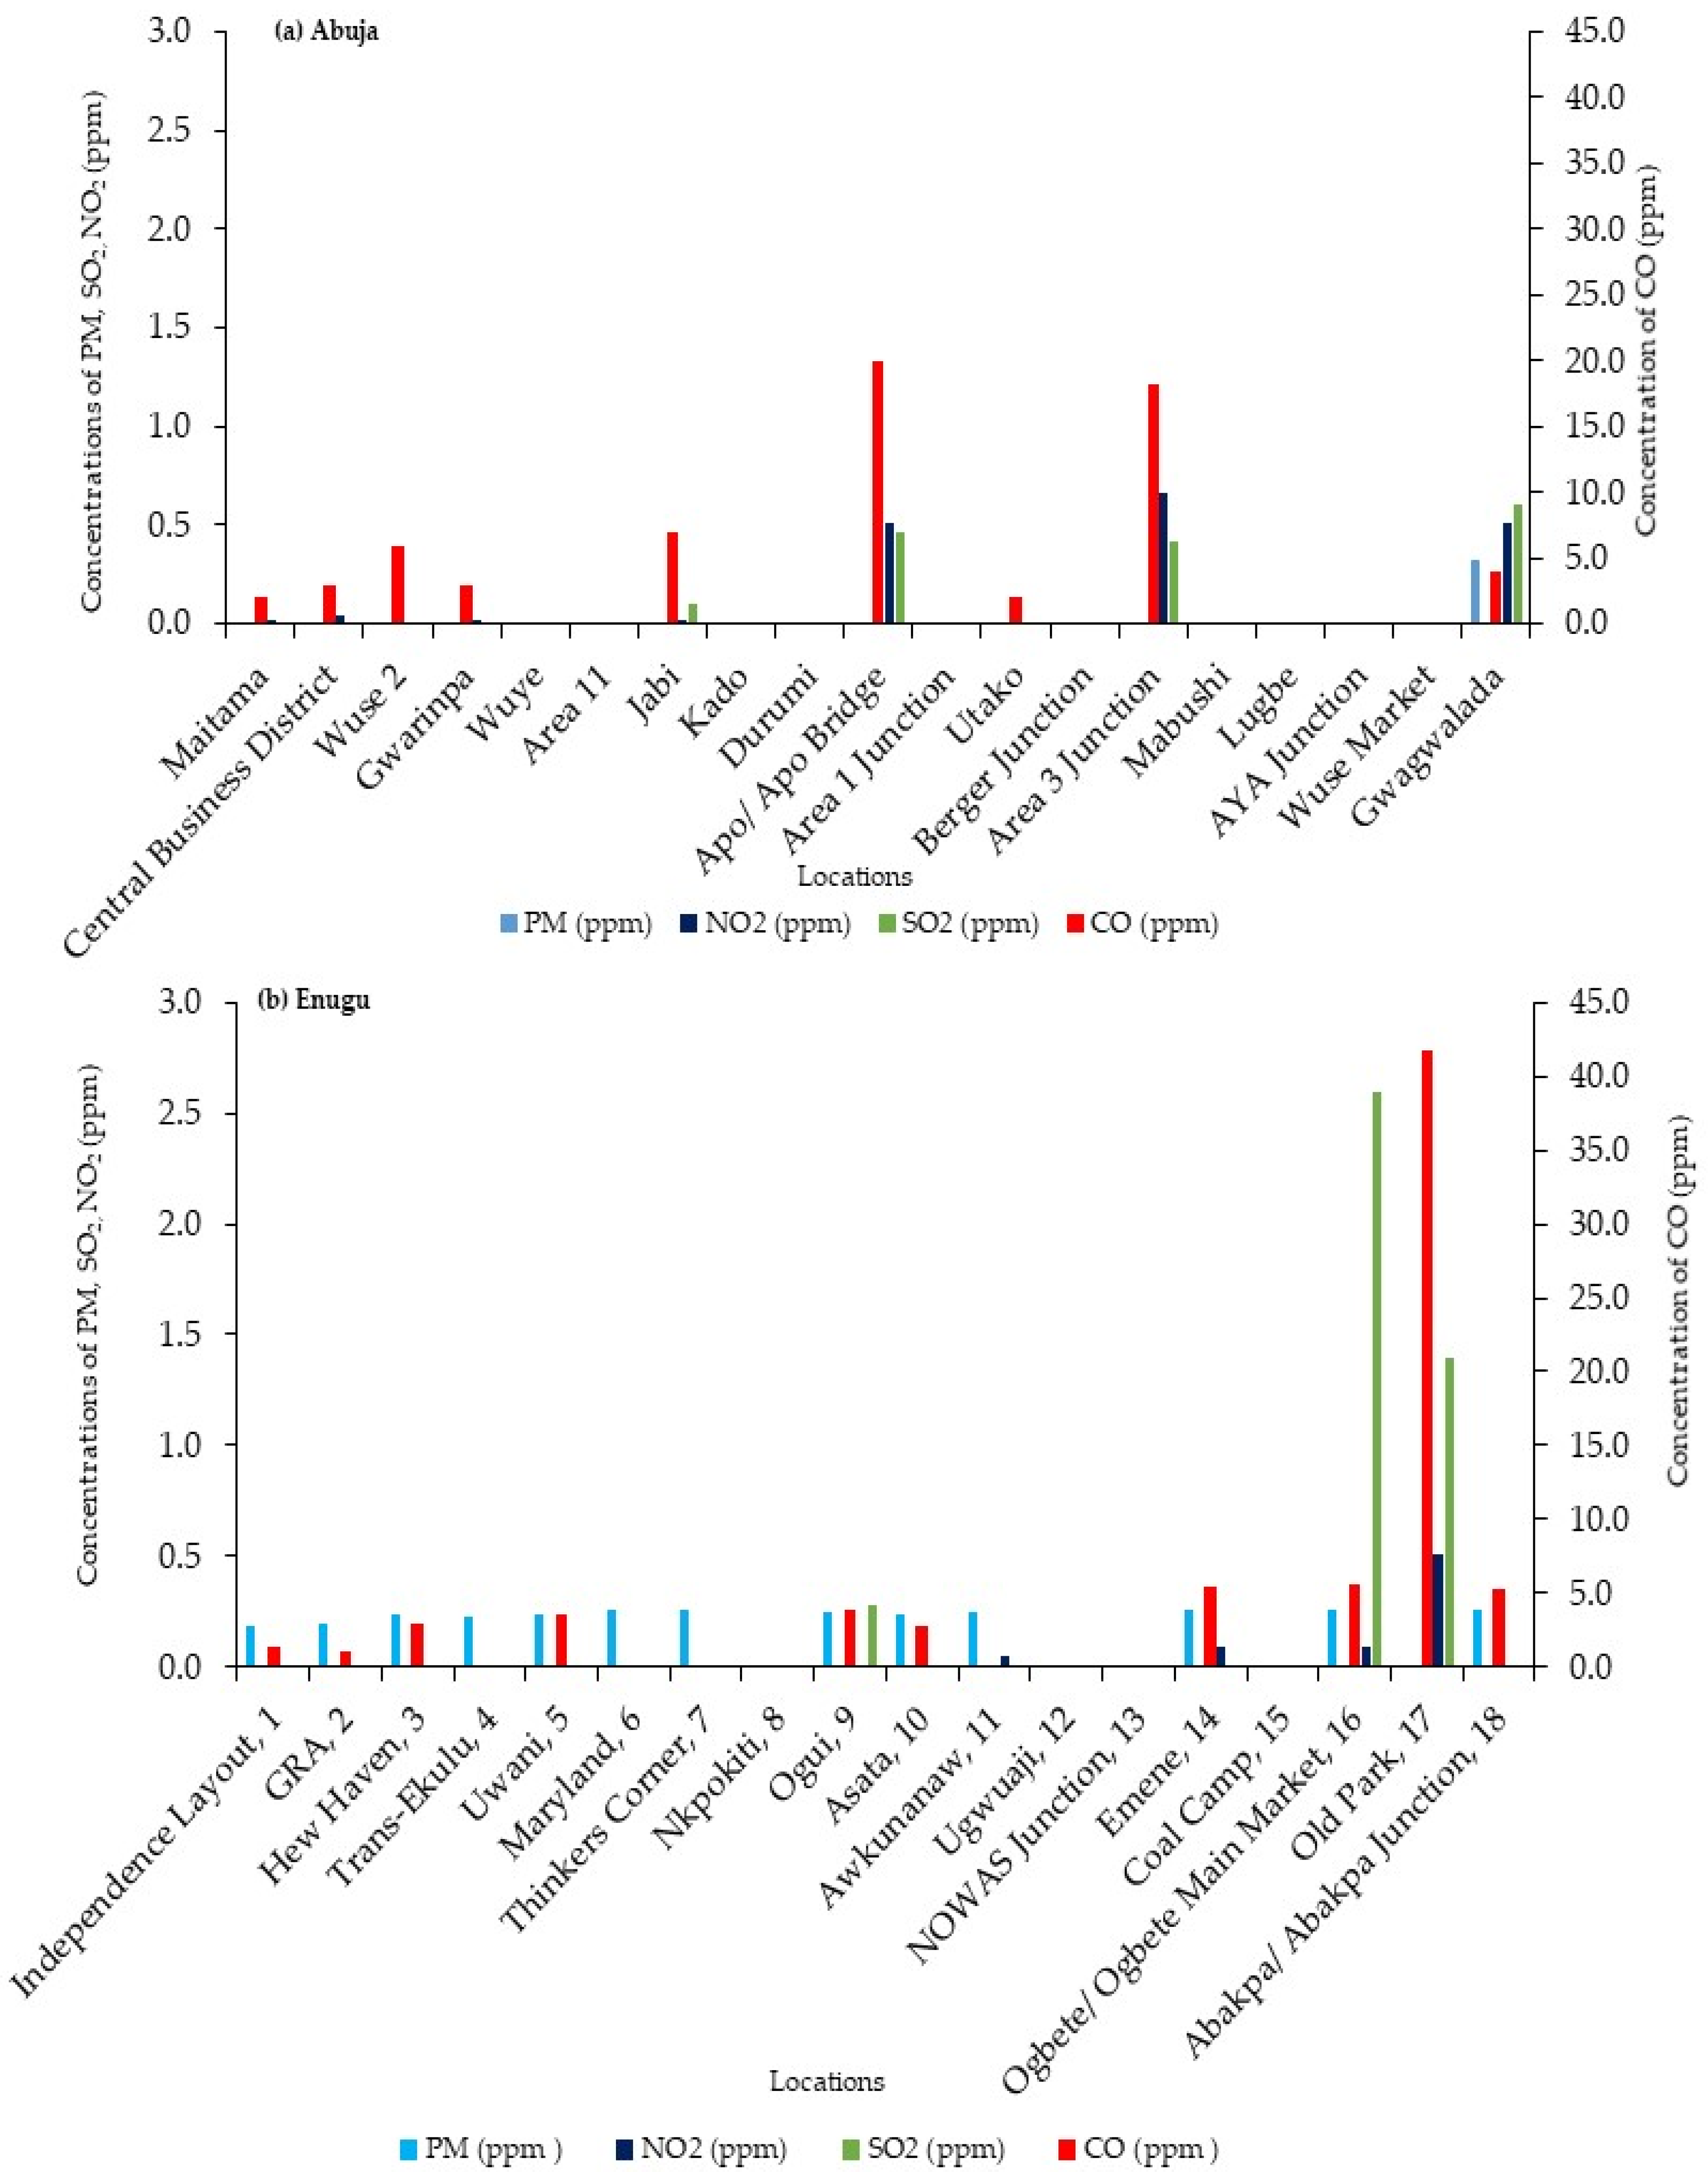
The research described in this paper was designed to explore whether the perceptions of AQ align with those provided by instruments. Based on published results in the literature, it does indeed appear to be the case that the locations in both cities vary significantly in terms of the concentration of some pollutants in the air. However, it does need to be noted that comparisons between the two cities are challenging, as much depends on the choice of location within them as well as differences in methods adopted by the researchers to measure pollutant concentrations. Nonetheless, the findings suggest that perceptions of AQ do appear to be associated with instrument-based measurements as those locations in Abuja and Enugu that people perceive to have the worst AQ are those that instrument-based studies have shown to have the highest concentrations of pollutants such as PM, SO2, NO2, and CO. This intriguing and important finding, however, does have some important caveats.
Firstly, there were significant differences between demographic groups in how they perceived AQ. Gender was not important in either city, but there were differences in terms of the income-education demographics in Abuja (but not Enugu) and age in Enugu (but not Abuja). In both cases, the differences between demographic groups were most marked for locations that had poorer AQ (i.e., locations in the lower parts of Table 5 and Table 6). Why should this be so? The differences between age groups in Enugu were noted in previous research [21], where the younger demographic (18–34 years old) was more positive about measures to control AQ and the need for action by agencies such as state and local government. This may be associated with youth identity and activism in the Igbo (the dominant ethnic group in Enugu) compared with the much more multi-ethnic and multi-cultural nature of the Abuja respondents from Tiv, Yoruba, Igbo, Hausa, Fulani, Edo, Idoma, Igala, Efik, Ibibio, Gbagyi, Ijaw, Eggon, and Berom [21]. However, the importance of the income-education demographics in Abuja (but not Enugu) is intriguing. One possibility may be linked to the greater wealth and income levels of respondents in the Abuja sample; 58% of Abuja respondents had annual incomes of about 51,000 compared with 46% for Enugu. Differences in income levels can generate segregation between rich and poor neighbourhoods, as seen, in the most extreme cases, with “gated” communities that have been on the rise throughout Sub-Saharan Africa and which are known to generate spatial fragmentation and urban segregation [59]. Their popularity is partly driven by a desire for better security, and they exist in Abuja and Enugu. Segregation between richer and poorer neighbourhoods, with the former tending to be more distant from causes of pollution [60], may engender a more polarised view of AQ. A further factor is that people living in low-income neighbourhoods tend to have more negative views of their environment than do those from wealthier neighbourhoods [61].
Secondly, while there is an apparent link between perceptions of AQ and measurements of pollutant concentrations in both cities, this may not necessarily mean that people can detect the pollutants directly. For SO2 in Abuja and NO2 in Enugu, the concentrations were indeed higher in locations perceived to have the worst AQ, but these concentrations were below the thresholds at which the pollutants could be detected via the senses of smell and taste. It would appear more likely that respondents were basing their views of AQ on the presence of more visible “clues”, such as smoke and dust, and while the odour is an important indicator (Table 1), it may be that it reflects a “cocktail” of pollutants in the air including hydrocarbons. These clues may well be positively correlated with concentrations of SO2 and NO2. In addition, respondents may also have framed their scoring of locations, at least in part, on the presence of causes of poor AQ. This possibility resonates with the work of [62], who analysed data from the Third European Quality of Life Survey undertaken between 2011 and 2012. They concluded that perceived exposure to air pollution is formed based on sensory awareness as well as what they refer to as a “cognitive component”, which is framed using knowledge of exposure to sources of air pollution (e.g., presence of traffic), perceived ability to cope with that exposure, and the perception of health risks. Moreover, an earlier study by [63] shows that odour annoyance is more perceived to exist in locations that have higher levels of traffic. This study and the study of [64] illustrated that the detection of air quality by people could be because of the extent or duration of the situation which causes poor air quality. The work of [64] also found that people perceive traffic as one of the main sources of poor AQ. Social discourse such as views from people via online social sites can also influence perceptions of environmental issues including AQ [65].
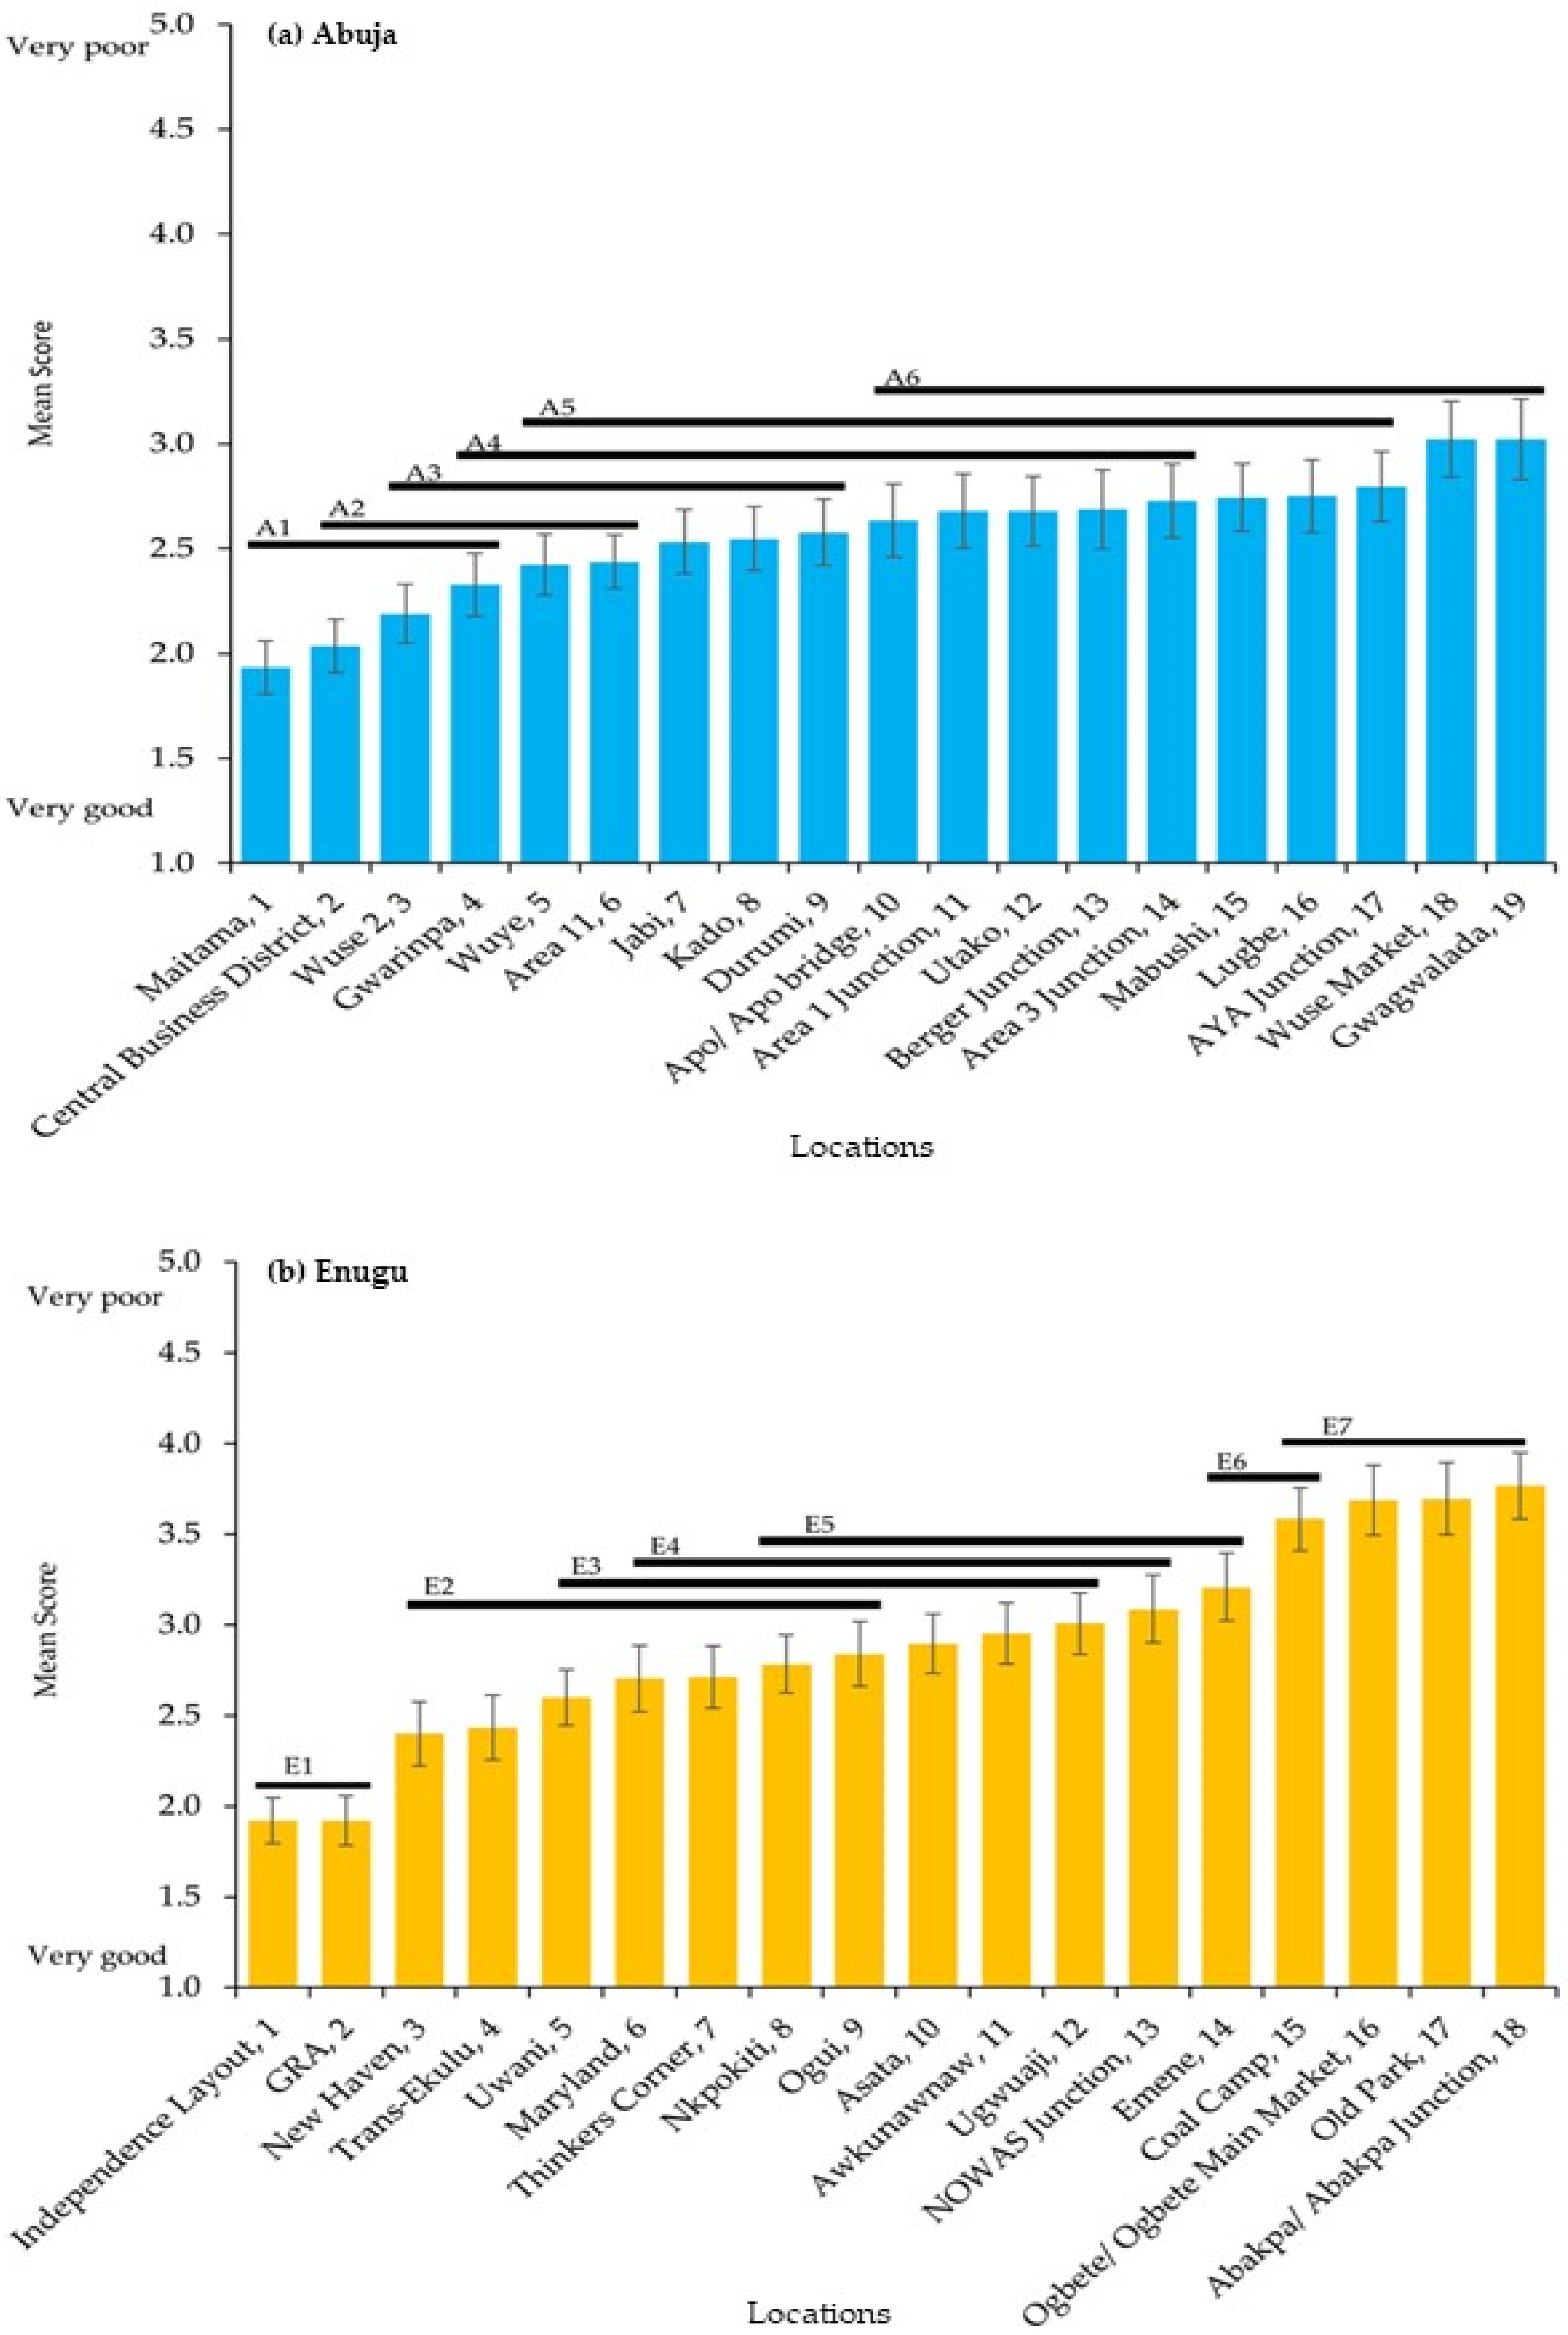
The results, both perceptions and measurements, do indeed point to differences between the AQ of locations in the two cities. The locations for comparison in the survey were selected using the advice provided by key informants, and some locations were known to have issues with AQ. In general, the AQ in government reserved areas (GRA or areas resided by higher-income earners) and administrative locations were better than market locations, busy junctions, and lower-income earners’ residential locations, which are mainly mixed with other functions such as manufacturing and retailing with a high density of inhabitants (Table 4). In Abuja, Maitama is perceived to be the cleanest among the selected locations, and this location is mainly inhabited by prominent people and political office holders, while the AQ at Wuse Market and Gwagwalada is scored more poorly. This result is similar to the work of [54], where they found that locations with major vehicular traffic junctions, such as AYA Junction, Area 1 Junction, Area 3 Junction, Gwagwalada, Wuse Market, and Mabushi Roundabout, have poorer AQ compared with locations with lower vehicular traffic. For Enugu, the results show that Independence Layout and GRA (mainly higher-income earners residential areas) are jointly ranked as those having the best AQ, while seven locations (Ugwuaji, NOWAS Junction, Emene, Coal Camp, Ogbete/Ogbete Main Market, Old Park, and Abakpa/Abakpa Junction) (mixed-use, commercial and transportation locations) that are rated above neutral are the locations with the worst AQ.
The assessment of AQ, especially within the developing world, has, to date, mainly been achieved using monitoring equipment and models, but issues including inadequate funds and technical know-how have been limiting their use. These limitations could be alleviated by using a participatory approach, such as the one used in the present research to draw upon people’s perceptions of AQ. While perceptions of AQ are framed by perceptual indicators, such as odour and dust, there may well be other factors at play such as the “cognitive component” identified by [62] and framing via social discourse [65]. Hence, while the research reported here has shown a link between the perceived AQ of locations in Abuja and Enugu and the measured levels of pollutants, it is perhaps understandable that this may not always be the case as reflected in the spectrum of published evidence that falls in both camps [25,26,30,31,32]. More research is certainly needed in this important field, especially for urban centres in the developing world. Nonetheless, we suggest that the use of perception in monitoring AQ should be globally accepted as a complementary approach to the use of instruments. Perceptual-based approaches cannot substitute for instrument-based approaches, but the authors are very much in agreement with [16] that perceptual-based approaches can be a useful supplement. Perceptual indicators and monitoring not only serve as a form of assessment but also as a form of awareness-raising of AQ and related environmental phenomena.

5. Conclusions

We draw the following conclusions from this research:
  • Based on a set of perceptual indicators, residents’ views on AQ are similar to equipment-measured information on AQ level, and this shows that perceptual AQ monitoring can be a useful supplement to instrument-based AQ assessment;
  • The perceptions of AQ in the locations may have been framed, at least in part, on factors, such as “cognitive” components and indeed social discourse, that extend beyond the set of perceptual indicators used in this research;
  • Both perceptual indicators and instrument measurements rated government reserved locations and locations inhabited by high-income earners better in AQ terms than the residential locations of lower-income earners, and locations with fewer vehicular movements have better AQ than those with more vehicular movements;
  • Income and education in Abuja and age in Enugu were demographic influences that affected the perceptual indicator scoring of AQ.
Finally, published accounts of the perceptual approach to assessing AQ are still relatively rare for cities of the developing world, especially for those in Sub-Saharan Africa. This study has helped to address that important gap, but more work is needed to help ensure better assessment and management of AQ and other environmental issues in cities of developed and developing countries. Indeed, more use of people’s perceptions of AQ will not only enlighten them on the quality of air in their vicinities but will also compliment the instrument mode of assessing AQ. Given the difficulties in establishing and maintaining instrument networks for AQ measurement in urban settings in the developing world, we would encourage policy- and decision-makers to adopt the use of perceptual indicators as a readily-available means of making progress on this important issue.

Supplementary Materials

The following supporting information can be downloaded at: https://www.mdpi.com/article/10.3390/su14095403/s1, Table S1: Mean Scores, standard deviations (SD) and Kruskal-Wallis (KW) test results for income and AQ level for Abuja; Table S2: Mean Scores, standard deviations (SD) and Kruskal-Wallis (KW) test results for education and AQ level for Abuja; Table S3: Mean Scores, standard deviations (SD) and Kruskal-Wallis (KW) test results for age and AQ level for Enugu. Table S4: The instrument measured air quality data in some locations in Abuja. Table S5: Instrument measured air quality dada in some locations in Enugu.

Author Contributions

Conceptualisation, T.M.C., S.M. and R.J.M.; methodology, T.M.C., S.M. and R.J.M.; formal analysis, T.M.C., S.M. and R.J.M.; investigation, T.M.C.; resources, T.M.C., S.M. and R.J.M.; data curation, T.M.C.; writing—original draft preparation, T.M.C.; writing—review and editing, T.M.C., S.M. and R.J.M.; supervision, S.M. and R.J.M.; project administration, S.M.; funding acquisition, T.M.C., S.M. and R.J.M. All authors have read and agreed to the published version of the manuscript.

Funding

The authors are grateful for the financial and related support provided to the PhD programme of the first author by the Faculty of Engineering & Physical Sciences and the University of Surrey.

Institutional Review Board Statement

Not applicable.

Informed Consent Statement

Not applicable.

Data Availability Statement

Data presented in this study are available on request from the corresponding author.

Acknowledgments

The authors would like to thank all our key informants, field assistants, and the questionnaire respondents for their participation in this research.

Conflicts of Interest

The authors declare no conflict of interest.

Appendix A

Survey Questionnaire
Section A: Demographic
What is your gender?
MaleFemale
What is your age?
18–34 years35 years or older
Which one of the following categories best describes your monthly income in Naira?
0–50,00051,000–100,000Above 100,000
What is the highest level of education you achieved?
Secondary/equivalent or belowBachelor/Diploma or equivalentPhD/Master or equivalent
Section B: Air Quality Levels
How do you rate these areas of Abuja in terms of their air quality?
Very GoodGoodNeutralPoorVery Poor
Area 1
Maitama
Area 3 Junction
Wuse Market
AYA Junction
Utako
Jabi
Wuye
Lugbe
Gwagwalada
Central Business District
Apo/Apo Bridge
Durumi
Area 11
Berger Junction
Wuse 2
Kado
Mabushi
Gwarinpa
How do you rate these areas of Enugu in terms of their air quality?
Very GoodGoodNeutralPoorVery Poor
Ogbete/Main Market
Abakpa/Abakpa junction
Ogui
Emene
Trans-Ekulu
Uwani
Coal Camp
Independence Layout
Asata
Awkunawnaw
Thinkers Corner
NOWAS Junction
GRA
Maryland
Ugwuaji
New Haven
Old Park
Nkpokiti

References

  1. World Health Organization. WHO Global Air Quality Guidelines: Particulate Matter (PM2.5 and PM10), Ozone, Nitrogen Dioxide, Sulfur Dioxide and Carbon Monoxide; World Health Organization: Geneva, Switzerland, 2021.
  2. World Health Organization. Burden of Disease from Ambient Air Pollution for 2016, Version 2; World Health Organization: Geneva, Switzerland, 2018. Available online: https://www.who.int/airpollution/data/AAP_BoD_results_May2018_final.pdf?ua=1 (accessed on 30 December 2021).
  3. European Environment Agency (EEA). Air Quality in Europe—2020 Report; European Environment Agency (EEA): Copenhagen, Denmark, 2020. [CrossRef]
  4. Chiarini, B.; D’Agostino, A.; Marzano, E.; Regoli, A. The perception of air pollution and noise in urban environments: A subjective indicator across European countries. J. Environ. Manag. 2020, 263, 110272. [Google Scholar] [CrossRef] [PubMed]
  5. European Environment Agency (EEA). European Air Quality Index. About the European Air Quality Index. Available online: https://airindex.eea.europa.eu/Map/AQI/Viewer/# (accessed on 30 December 2021).
  6. Jia, Q. Urban air quality assessment method based on GIS technology. Appl. Ecol. Environ. Res. 2019, 17, 9367–9375. [Google Scholar] [CrossRef]
  7. Lewis, A.; Richard, P.W.; von Schneidemesser, E. Low-Cost Sensors for the Measurement of Atmospheric Composition: Overview of Topic and Future Applications. 2018. Available online: https://eprints.whiterose.ac.uk/ (accessed on 25 December 2021).
  8. Environment Protection Authority. Approved Methods for the Modelling and Assessment of Air Pollutants in New South Wales. 2016. Available online: www.epa.nsw.gov.au (accessed on 10 January 2022).
  9. Kamińska, J.; Lucena-Sánchez, E.; Sciavicco, G. Temporal Aspects in Air Quality Modelling—A Case Study in Wrocław. Air Soil Water Res. 2020, 13, 1178622120975829. [Google Scholar] [CrossRef]
  10. Wolf, T.; Pettersson, L.H.; Esau, I. A very high-resolution assessment and modelling of urban air quality. Atmos. Chem. Phys. 2020, 20, 625–647. [Google Scholar] [CrossRef] [Green Version]
  11. Pinder, R.W.; Klopp, J.M.; Kleiman, G.; Hagler GS, W.; Awe, Y.; Terry, S. Opportunities and Challenges for Filling the Air Quality Data Gap in Low- and Middle-Income Countries. Atmos. Environ. 2019, 215, 116794. [Google Scholar] [CrossRef]
  12. Schwela, D.H.; Haq, G. Strengths and Weaknesses of the WHO Global Ambient Air Quality Database. Aerosol Air Qual. Res. 2020, 20, 1026–1037. [Google Scholar] [CrossRef] [Green Version]
  13. Fagbeja, M.; Olumide, O.; Rabiu, B. An Overview of AQ Monitoring and Prediction in Nigeria; World Meteorological Organization: Geneva, Switzerland, 2017; Available online: https://www.wmo.int/pages/prog/arep/gaw/documents/1_BRabiu_Nigeria_AQ.pdf (accessed on 20 January 2022).
  14. Avis, W.; Bartington, S. Monitoring Air Quality in Low-Income and Lower Middle-Income Countries. 2020. Available online: https://opendocs.ids.ac.uk/opendocs/bitstream/handle/20.500.12413/15694/776_Monitoring_Air_Quality_in_Low_Income_and_Lower_Middle_Income_Countries.pdf?sequence=7&isAllowed=y (accessed on 10 January 2022).
  15. Lewis, A.; Edwards, P. Validate personal air-pollution sensors. Nature 2018, 535, 29–31. [Google Scholar] [CrossRef] [Green Version]
  16. Mally, K.V. Perceptions of air quality in Ljubljana. Dela 2016, 46, 77–88. [Google Scholar] [CrossRef] [Green Version]
  17. Veloz, D.; Gonzalez, M.; Brown, P.; Gharibi, H.; Cisneros, R. Perceptions about air quality of individuals who work outdoors in the San Joaquin Valley, California. Atmos. Pollut. Res. 2020, 11, 825–830. [Google Scholar] [CrossRef]
  18. Okello, N.O.; Okello, T.W.; Zunckel, M. Public perceptions of air quality status and suggestions for improvement: The case of Richards Bay and its surroundings, uMhlathuze Local Municipality, South Africa. Clean Air J. 2020, 30, 1–10. [Google Scholar] [CrossRef]
  19. Odonkor, S.T.; Mahami, T. Knowledge, Attitudes, and Perceptions of Air Pollution in Accra, Ghana: A Critical Survey. J. Environ. Public Health 2020, 2020, 3657161. [Google Scholar] [CrossRef] [PubMed]
  20. Nwanakwere, J.T.; Oyedokun, J.I. Community perception on air pollution and public health: A case of Ewekoro and Remo-north communities in Ogun State, Nigeria. Int. J. Environ. Pollut. Res. 2020, 8, 1–16. [Google Scholar]
  21. Chukwu, T.M.; Morse, S.; Murphy, R. Poor Air Quality in Urban Settings: A Comparison of Perceptual Indicators, Causes and Management in Two Cities. Sustainability 2022, 14, 1438. [Google Scholar] [CrossRef]
  22. National Research Council (US) Committee on Acute Exposure Guideline Levels. Sulfur Dioxide Acute Exposure Guideline Levels: Acute Exposure Guideline Levels for Selected Airborne Chemicals; National Academies Press (US): Washington, DC, USA, 2010. Available online: https://www.ncbi.nlm.nih.gov/books/NBK219999/ (accessed on 4 February 2022).
  23. European Commission. Recommendation from the Scientific Committee on Occupational Exposure Limits for Nitrogen Dioxide. SCOEl/SUM/53. 2014. Available online: https://www.google.com/url?sa=t&rct=j&q=&esrc=s&source=web&cd=&ved=2ahUKEwi26YOdmOb1AhXRoVwKHfcOBOoQFnoECAUQAQ&url=https%3A%2F%2Fec.europa.eu%2Fsocial%2FBlobServlet%3FdocId%3D12431%26langId%3Den&usg=AOvVaw2HDzHL1HDfMjiNMuw2X355 (accessed on 4 January 2022).
  24. Peng, M.; Zhang, H.; Evans, R.; Zhong, X.; Yang, K. Actual Air Pollution, Environmental Transparency, and the Perception of Air Pollution in China. J. Environ. Dev. 2019, 28, 78–105. [Google Scholar] [CrossRef] [Green Version]
  25. Atari, D.; Luginaah, I.; Fung, K. The Relationship between Odour Annoyance Scores and Modelled Ambient Air Pollution in Sarnia, “Chemical Valley”, Ontario. Int. J. Environ. Res. Public Health 2009, 6, 2655–2675. [Google Scholar] [CrossRef] [Green Version]
  26. Sun, Z.; Li, J. Citizens’ Satisfaction with Air Quality and Key Factors in China—Using the Anchoring Vignettes Method. Sustainability 2019, 11, 2206. [Google Scholar] [CrossRef] [Green Version]
  27. Semenza, J.C.; Wilson, D.J.; Parra, J.; Bontempo, B.D.; Hart, M.; Sailor, D.J.; George, L.A. Public perception and behavior change in relationship to hot weather and air pollution. Environ. Res. 2008, 107, 401–411. [Google Scholar] [CrossRef]
  28. Egondi, T.; Kyobutungi, C.; Ng, N.; Muindi, K.; Oti, S.; Vijver, S.V.d.; Ettarh, R.; Rocklöv, J. Community Perceptions of Air Pollution and Related Health Risks in Nairobi Slums. Int. J. Environ. Res. Public Health 2013, 10, 4851–4868. [Google Scholar] [CrossRef] [Green Version]
  29. Guo, Y.; Liu, F.; Lu, Y.; Mao, Z.; Lu, H.; Wu, Y.; Chu, Y.; Yu, L.; Liu, Y.; Ren, M.; et al. Factors Affecting Parent’s Perception on Air Quality—From the Individual to the Community Level. Int. J. Environ. Res. Public Health 2016, 13, 493. [Google Scholar] [CrossRef]
  30. Kim, M.; Yi, O.; Kim, H. The role of differences in individual and community attributes in perceived air quality. Sci. Total Environ. 2012, 425, 20–26. [Google Scholar] [CrossRef]
  31. Graves, P. Environmental perceptions and environmental reality: When more is less? Environ. Plan. 2013, 35, 951–954. [Google Scholar] [CrossRef]
  32. Brody, S.; Peck, B.; Highfield, W. Examining Localized Patterns of Air Quality Perception in Texas: A Spatial and Statistical Analysis. Risk Anal. 2004, 24, 1561–1574. [Google Scholar] [CrossRef] [PubMed]
  33. United Nations Population Fund. World Population Dashboard Nigeria. 2021. Available online: https://www.unfpa.org/data/world-population/NG (accessed on 30 December 2021).
  34. World Bank. Urban Development. 2020. Available online: https://www.worldbank.org/en/topic/urbandevelopment/overview#1 (accessed on 25 January 2022).
  35. World Bank. Urban Population Growth (Annual)—Nigeria. 2018. Available online: https://data.worldbank.org/indicator/SP.URB.GROW?locations=NG (accessed on 25 January 2022).
  36. Ayegba, A.; Yusuf, Y.; Simeon, A.U.; Justin, I.O.; Augustine, O.E.; Suleiman, A.O.; Joshua, A.; Chioma, O.R. A Study of the Daily Weather Variation of Abuja, North Central, Nigeria. 2019. Available online: https://www.ijeas.org/download_data/IJEAS0608032.pdf (accessed on 28 February 2022).
  37. Boumphery, S. World’s fastest growing cities in Asia and Africa. Euromonitor International. 2010. Available online: https://www.euromonitor.com/article/special-report-worlds-fastest-growing-cities-are-in-asia-and-africa (accessed on 28 November 2021).
  38. National Bureau for Statistics. Population 2006—2016. 2016. Available online: https://nigerianstat.gov.ng/elibrary?queries[search]=population (accessed on 25 December 2021).
  39. Okwu-Delunzu, V.U.; Oweifighe, W.J.; Ugochukwu, U.C. Assessment of air quality levels in heavy traffic areas in Enugu urban, Nigeria. In Monograph of Atmospheric Research 2018; Centre for Atmospheric Research: Boulder, CO, USA, 2018; Available online: https://carnasrda.com/wp-content/uploads/2019/06/Okwu-et-al.pdf (accessed on 12 January 2022).
  40. Agu, A.; Tukur, K.; Omede, H. An Assessment of Heatwave Impact in Enugu Metropolis of Enugu State. 2020. preprint. [CrossRef]
  41. Metrotrends. Enugu, Nigeria Metro Area Population 1950–2020. 2020. Available online: https://www.macrotrends.net/cities/21986/enugu/population (accessed on 11 January 2022).
  42. Federal Ministry of Youths and Sports. National Youth Policy. Enhancing Youth Development and Participation in the Context of Sustainable Development. 2019. Available online: https://www.prb.org/wp-content/uploads/2020/06/Nigeria-National-Youth-Policy-2019-2023.pdf (accessed on 7 November 2021).
  43. Evans, G.W.; Jacobs, S.V.; Frager, N.B. Adaptation to air pollution. J. Environ. Psychol. 1982, 2, 99–108. [Google Scholar] [CrossRef]
  44. Wiedmaier, B. Post Hoc Tests. In The SAGE Encyclopedia of Communication Research Methods; SAGE: Thousand Oaks, CA, USA, 2017. [Google Scholar] [CrossRef]
  45. Xia, Y. Correlation, and association analyses in microbiome study integrating multiomics in health and disease. Prog. Mol. Biol. Transl. Sci. 2020, 171, 309–491. [Google Scholar] [CrossRef]
  46. Kanee, R.B.; Adeyemi, A.; Edokpa, D.O.; Ede, P.N. Particulate Matter-Based Air Quality Index Estimate for Abuja, Nigeria: Implications for Health. J. Geosci. Environ. Prot. 2020, 8, 313–321. [Google Scholar] [CrossRef]
  47. Otse, M.O.; Agbaji, E.B.; Nwokem, N.C.; Funtua, A.M. Assessment of Level of Air Pollutants and Particulate Matter Within Abuja Metropolis, Nigeria. Niger. Res. J. Chem. Sci. 2020, 8, 28–37. Available online: http://www.unn.edu.ng/nigerian-research-journal-of-chemical-sciences/ (accessed on 11 January 2022).
  48. Ishaya, S.; Adakayi, P.E.; Ojie, A.F. Assessment of Air Quality along Urbanization Gradient in Apo District of the Federal Capital Territory of Nigeria. Ann. Ecol. Environ. Sci. 2017, 1, 76. [Google Scholar]
  49. Magaji, J.; Hassan, S.M. An Assessment of Air Quality in and around Gwagwalada Abattoir, Gwagwalada, Abuja, Fct. 2015. Available online: https://www.researchgate.net/publication/344430169_An_Assessment_of_Air_Quality_in_and_around_Gwagwalada_Abattoir_Gwagwalada_Abuja_Fct?enrichId=rgreq-f1b574bb51f0a42203bfcff288cc0218-XXX&enrichSource=Y292ZXJQYWdlOzM0NDQzMDE2OTtBUzo5NDE0MzY2OTAyNDc2ODZAMTYwMTQ2NzQwNjczMw%3D%3D&el=1_x_2&_esc=publicationCoverPdf (accessed on 11 January 2022).
  50. Eze, C.T.; Ugwoke, J.L.; Ugwoke, J.J. Road traffic congestion and vehicular emission in Enugu urban Nigeria. Environ. Biotechnol. J. 2019, 38, 1–8. [Google Scholar]
  51. Emodi, E.E. Environmental quality of Enugu, Nigeria as impacted by the primary air pollutants in the area. Int. J. Environ. Pollut. Res. 2020, 8, 1–20. [Google Scholar]
  52. Okobia, E.L.; Makwe, E.; Mgbanyi, L.L. Air Pollution and Human Health Implications in Urban Settlements of Abuja, Nigeria. 2021. Available online: https://www.researchgate.net/publication/354381904 (accessed on 10 January 2022).
  53. Shehu, M.S.; Umaru, I.; Tukura, B.W. Health Impact Analysis of Some Outdoor Atmospheric Aerosols (PM2.5, SO2, CO & CH4) in F.C.T Abuja and Environs. Am. J. Public Health Res. 2019, 7, 1–8. [Google Scholar] [CrossRef]
  54. Umaru, I.; Adedeji, O.; Mundi, A.A.; Lawal, R.S. Theoretical Confirmation of Seasonal and Solar Radiation Impacts on Outdoor Atmospheric Aerosols (PM2.5, SO2 and CO) in FCT Abuja, Nigeria. Int. J. Innov. Sci. Res. 2019, 44, 186–194. Available online: http://www.ijisr.issr-journals.org/abstract.php?article=IJISR-19-017-02 (accessed on 9 March 2022).
  55. Awokola, B.I.; Okello, G.; Mortimer, K.J.; Jewell, C.P.; Erhart, A.; Semple, S. Measuring air quality for advocacy in Africa (MA3): Feasibility and practicality of longitudinal ambient PM2.5 measurement using low-cost sensors. Int. J. Environ. Res. Public Health 2020, 17, 7243. [Google Scholar] [CrossRef] [PubMed]
  56. Ngele, S.O. Variation of Carbon Monoxide (CO) Levels in Enugu-a Comparison of High Traffic and Industrial Sites Measurements. Am. J. Eng. Res. 2014, 3, 159–166. Available online: https://www.ajer.org/papers/v3/U03901590166.pdf (accessed on 15 January 2022).
  57. Grossberndt, S.; Schneider, P.; Liu, H.Y.; Fredriksen, M.F.; Castell, N.; Syropoulou, P.; Bartoňová, A. Public Perception of Urban Air Quality Using Volunteered Geographic Information Services. Urban Plan. 2020, 5, 45–58. [Google Scholar] [CrossRef]
  58. Williams, I.D.; Bird, A. Public perceptions of air quality and quality of life in urban and suburban areas of London. J. Environ. Monit. 2003, 5, 253–259. [Google Scholar] [CrossRef]
  59. Bandauko, E.; Arku, G.; Nyantakyi-Frimpong, H. A systematic review of gated communities and the challenge of urban transformation in African cities. J. Hous. Built Environ. 2022, 37, 339–368. [Google Scholar] [CrossRef]
  60. Kuddus, M.A.; Tynan, E.; McBryde, E. Urbanization: A problem for the rich and the poor? Public Health Rev. 2020, 41, 1. [Google Scholar] [CrossRef]
  61. Lee, S.M.; Conway, T.L.; Frank, L.D.; Sealens, B.E.; Cain, K.L.; Sallis, J.F. The Relation of Perceived and Objective Environment Attributes to Neighborhood Satisfaction. Environ. Behav. 2017, 49, 136–160. [Google Scholar] [CrossRef]
  62. Dimitrova, D.D.; Dzambov, A.M. Perceived access to recreational/ green areas as an effect modifier of the relationship between health and neighborhood noise/ air quality: Results from the 3rd European Quality of Life Survey (EQLS, 2011–2012). Urban For. Urban Green. 2017, 23, 54–60. [Google Scholar] [CrossRef]
  63. Nordin, S.; Lidén, E. Environmental odour annoyance from air pollution from steel industry and bio-fuel processing. J. Environ. Psychol. 2006, 26, 141–145. [Google Scholar] [CrossRef]
  64. Maione, M.; Mocca, E.; Eisfeld, K.; Kazepov, Y.; Fuzzi, S. Public perception of air pollution sources across Europe. Ambio 2021, 50, 1150–1158. [Google Scholar] [CrossRef] [PubMed]
  65. Begueria, A.; Larrea, C.; Muñoz, A.; Zafra, E.; Mascaró-Pons, J.; Porta, M. Social discourse concerning pollution and contamination in Spain: Analysis of online comments by digital press readers. Contrib. Sci. 2014, 10, 35–47. [Google Scholar] [CrossRef]
Figure 1. (a) Location of Abuja and Enugu in Nigeria. (b) Study locations in Abuja. (c) Study locations in Enugu.
Sustainability 14 05403 g001
Figure 2. (a) Mean score for perceptual AQ indicators in Abuja. (b) Mean score for perceptual AQ indicators in Enugu.
Sustainability 14 05403 g002
Figure 3. (a) Instrument-based measurement of PAQ in Abuja based on results reported by [46,47,48,49]. (b) Instrument-based measurement of PAQ in Enugu based on results reported by [50,51]. Figures are the mean daily concentrations of the pollutants, and locations have been ordered from the best AQ based on respondent scores on the left-hand side to the worst AQ based on respondent scores on the right-hand side as in Figure 2.
Sustainability 14 05403 g003
Figure 4. (a) Instrument-measured SO2 with taste and odour detection levels in Abuja based on sources [46,47,48,49]. (b) Instrument-measured SO2 with taste and odour detection levels in Enugu based on source [50]. (c) Instrument-measured NO2 with odour detection levels in Abuja based on [46,47,48,49]. (d) Instrument-measured NO2 with odour detection level in Enugu based on sources [50,51]. Figures are the mean daily concentrations for the pollutants.
Sustainability 14 05403 g004
Table 1. Perceptual indicators of air quality in Abuja and Enugu with their ranks: 1 = most important; 9 = least important (after [21]).
AbujaEnugu
IndicatorsRankIndicatorsRank
Dust in the air1Smoke1
Smoke2Smell/odour2
Smell/odour3Dust in the air3
Dirt on skin and clothes4Sneezing and coughing4
Dirt on surfaces such as buildings5Watery/irritated eyes5
Visibility6Dirt on skin and clothes6
Sneezing and coughing7Dirt on surfaces such as building7
Watering/irritated eyes8Visibility8
Skin irritation9Skin irritation9
Table 2. Absolute numbers (and percentage) of respondents by demographic characteristics.
CharacteristicAbuja (n = 137)Enugu (n = 125)
Gender
Male76 (55%)63 (50%)
Female61 (45%)62 (50%)
Age (cohort)
18–34 years61 (45%)60 (45%)
≥35 years 76 (55%)65 (55%)
Average monthly income
No income/low income (0–50,000)57 (42%)68 (54%)
Middle income (51,000–100,000)24 (18%)39 (31%)
Upper income (≥101,000)56 (40%)18 (15%)
Highest education qualification
≥Secondary/equivalent 28 (21%)25 (20%)
Bachelor/Diploma or equivalent59 (43%)78 (62%)
PhD/Master or equivalent50 (36%)22 (18%)
Table 3. Summary of the Abuja study locations and some of their main characteristics.
LocationNotes
Apo/Apo BridgeMixed-use: Mixed-use location with a retail market, residential areas and transportation hub.
Area 1 JunctionTransportation: Busy transport location with bus stops.
Area 11Residential: Mostly residential area with some offices.
Area 3 JunctionTransportation: Busy transport location with bus stops.
AYA JunctionTransportation: Busy transport location with bus stops.
Berger JunctionTransportation: Transportation hub with roundabout and bus stops.
Central Business DistrictAdministrative: Also known as Central Area, comprising mainly of government and diplomatic offices.
GwagwaladaMixed-use: Separate town to Abuja but housing many commuters, commercial activities and part of the University of Abuja and its teaching hospital.
GwarinpaResidential: Mostly a residential location with some commercial activities, retail shops etc.
JabiMixed-use: Very busy area with a mixture of transportation, retail and offices.
KadoMixed-use: Comprises housing, retail, recreation and transportation hub.
LugbeMixed-use. Mostly mid-income residents and retail with busy transportation points. A suburb of the metropolis.
MabushiMixed-use: Comprises government offices, commercial, and transportation activities.
MaitamaResidential: Government reserved residential location mainly for higher-income earners.
UtakoMixed-use: Busy location with a mixture of transportation, residential and retail.
Wuse 2Residential: Mainly residential area with shops and offices.
Wuse MarketCommercial: Very busy retail location with many shops.
WuyeResidential: Mostly higher-income residential location with an ultra-modern market.
Table 4. Summary of the Enugu study locations and some of their main characteristics.
LocationNotes
Abakpa/Abakpa JunctionMixed-use: Comprises residential, retail and transportation functions.
AsataMixed-use: Location with mixed residential, transportation and retail functions.
AwkunanawMixed-use: Busy location with transportation, commercial and residential characteristics.
Coal CampMixed-use: Residential area (mainly for lower-income earners) with commercial activities.
EmeneMixed-use: Residential area, retail outlets, manufacturing industries and an airport.
GRAResidential: Mostly inhabited by government workers and higher-income earners.
Independence LayoutResidential: Mostly residential location with some retail activities.
Maryland.Mixed-use: Residential area with retail activities.
New HavenMixed-use: Higher-income residential location with retail activities
NkpokitiTransportation. Transportation hub and includes a major road junction.
NOWAS JunctionTransportation: Transportation hub with bus stops and a gasoline filling station.
Ogbete/Ogbete Main MarketCommercial: Market location with transportation activities.
OguiMixed-use: Mostly transportation and commercial activities but with some residential.
Old ParkMixed-use: Mostly transportation and commercial activities but with some residential.
Thinkers CornerMixed-use: Suburb with mostly residential and retail activities.
Trans-EkuluResidential: Residential location with a few retail shops.
UgwuajiMixed-use: Residential, commercial and transportation activities
UwaniMixed-use: Mostly transportation and commercial activities but with some residential.
Table 5. Kruskal–Wallis test results for demographics and AQ mean scores at locations in Abuja.
LocationsGenderAgeIncomeEducation
Maitama2.03 ns1.779 ns2.268 ns1.249 ns
Central Business District0.002 ns0.252 ns0.544 ns0.648 ns
Wuse 21.612 ns0.273 ns5.301 ns3.105 ns
Gwarinpa0.005 ns1.553 ns4.501 ns3.764 ns
Wuye0.033 ns1.004 ns0.808 ns0.291 ns
Area 110.891 ns0.004 ns2.782 ns1.607 ns
Jabi3.141 ns0.460 ns7.180 *11.553 **
Kado1.749 ns3.767 ns0.475 ns4.370 ns
Durumi0.195 ns0.005 ns8.368 **10.138 **
Apo/Apo Bridge0.163 ns2.911 ns8.166 **2.671 ns
Area 1 Junction0.028 ns0.061 ns18.292 ***14.636 ***
Utako0.025 ns0.116 ns10.078 **6.706 *
Berger Junction0.024 ns0.319 ns18.391 ***14.173 ***
Area 3 Junction1.523 ns0.452 ns8.660 **5.746 ns
Mabushi0.415 ns1.733 ns1.649 ns0.047 ns
Lugbe1.080 ns2.075 ns12.938 **7.382 *
AYA Junction0.235 ns5.246 *4.327 ns8.236 **
Wuse Market6.062 *2.178 ns10.417 **9.115 **
Gwagwalada0.223 ns2.029 ns9.041 **2.948 ns
Note: The locations having the perceived best AQ are at the top of the table, while those with the perceived worst AQ are at the bottom. Values shown are the Kruskal–Wallis statistic and * p ≤ 0.05; ** p ≤ 0.01; *** p ≤ 0.001; ns = not significant. Highlighted cells indicate the presence of significant differences within the demographic group.
Table 6. Kruskal–Wallis test results for demographics and AQ mean scores for locations in Enugu.
LocationsGenderAgeIncomeEducation
Independence Layout0.58 ns0.011 ns1.474 ns1.277 ns
GRA0.407 ns0.419 ns1.179 ns1.078 ns
New Haven0.281 ns1.565 ns3.916 ns0.216 ns
Trans-Ekulu1.444 ns0.349 ns0.230 ns2.866 ns
Uwani0.068 ns0.747 ns1.083 ns1.954 ns
Maryland0.040 ns3.568 ns4.954 ns1.787 ns
Thinkers Corner0.011 ns6.469 **0.318 ns3.348 ns
Nkpokiti0.660 ns0.039 ns0.473 ns0.839 ns
Ogui0.056 ns5.298 *2.563 ns0.294 ns
Asata0.030 ns5.629 **2.689 ns0.412 ns
Awkunawnaw0.014 ns4.233 *0.027 ns0.305 ns
Ugwuaji0.615 ns1.927 ns15.271 ***2.828 ns
NOWAS Junction0.532 ns0.295 ns3.068 ns2.382 ns
Emene3.487 ns4.723 *1.057 ns0.087 ns
Coal Camp3.990 *6.889 **3.916 ns1.384 ns
Ogbete/Ogbete Main Market0.059 ns1.049 ns2.722 ns1.725 ns
Old Park0.456 ns3.535 ns1.236 ns2.157 ns
Abakpa/Abakpa Junction0.937 ns3.344 ns3.637 ns1.278 ns
Note: The locations having the perceived best AQ are at the top of the table, while those with the perceived worst AQ are at the bottom. Values shown are the Kruskal–Wallis statistic and * p ≤ 0.05; ** p ≤ 0.01; *** p ≤ 0.001; ns = not significant. Highlighted cells indicate the presence of significant differences within the demographic group.
Publisher’s Note: MDPI stays neutral with regard to jurisdictional claims in published maps and institutional affiliations.

