
Age Discrimination and Employability in Healthcare Work: A Double-Edged Sword for Older Workers?


Abstract
:1. Introduction
1.1. Age Discrimination
1.2. Internal Employability
1.3. Age Discrimination and Internal Employability
1.4. Age Differences in the Relationship between Age Discrimination and Internal Employability
2. Materials and Methods
2.1. Study Design and Procedure
2.2. Participants
2.3. Measures
2.3.1. Internal Employability
2.3.2. Age Discrimination
2.3.3. Age
2.4. Analysis
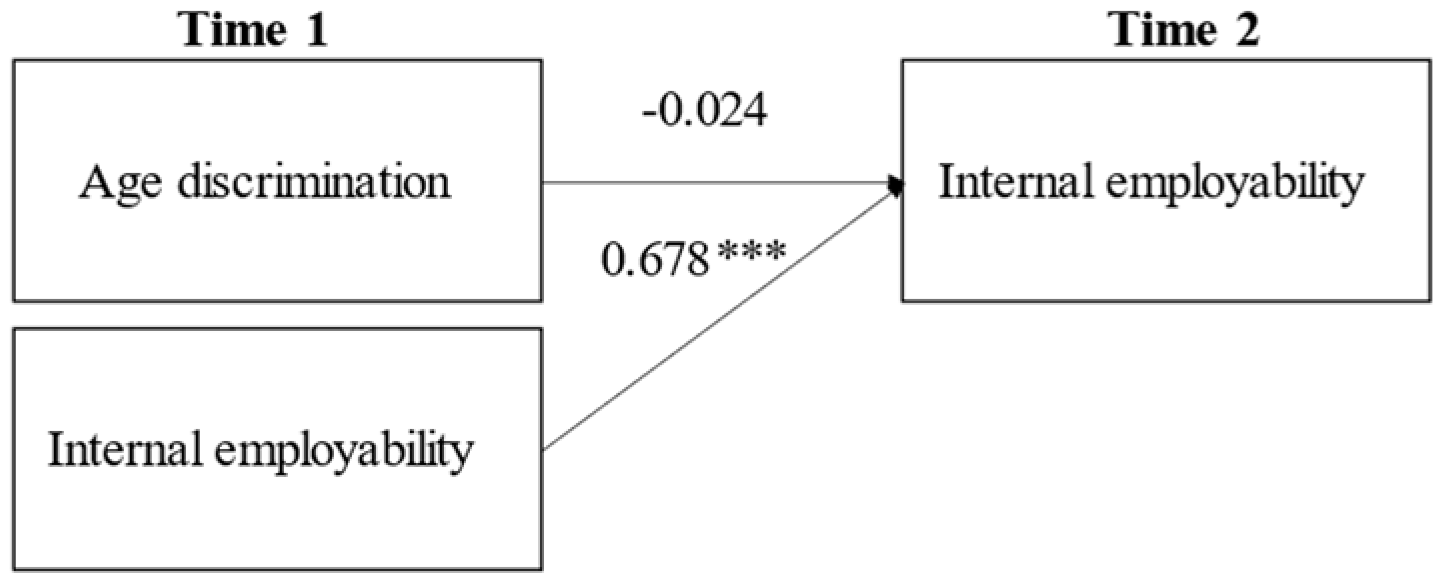
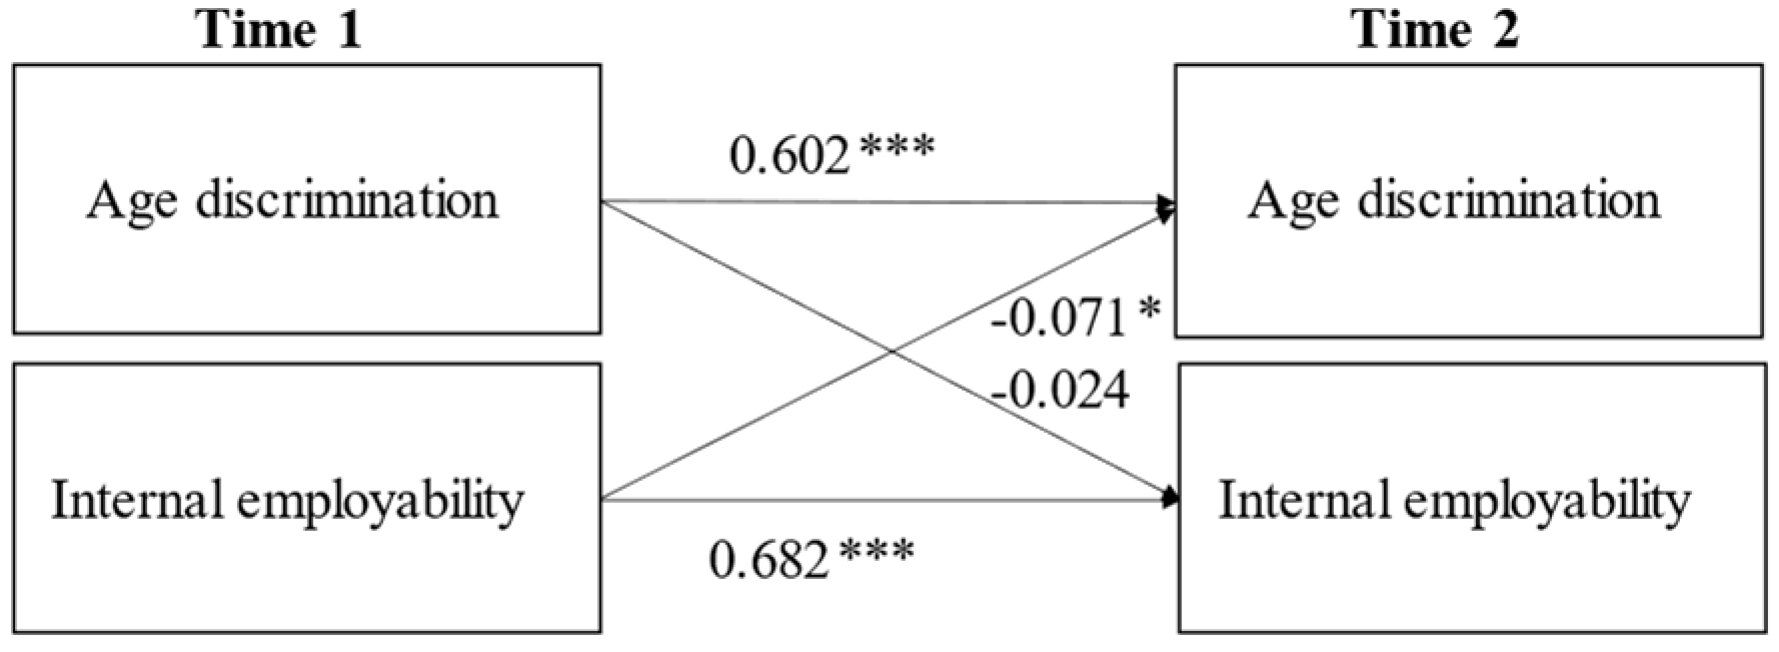
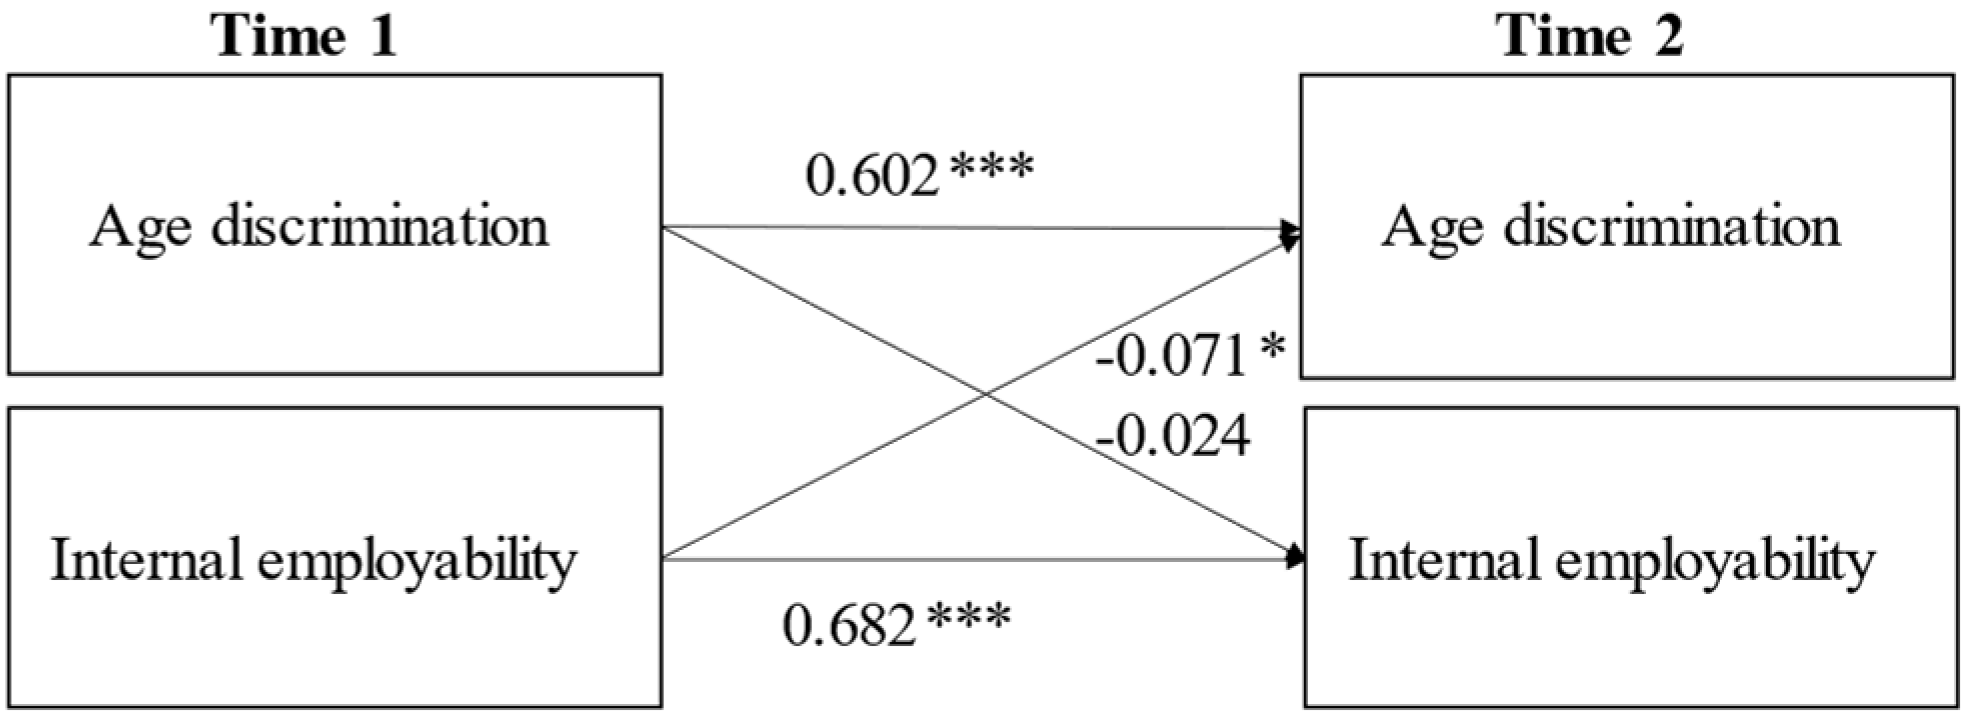
3. Results
4. Discussion and Conclusions
4.1. Limitations and Suggestions for Future Research
4.2. Practical Implications
Author Contributions
Funding
Institutional Review Board Statement
Informed Consent Statement
Data Availability Statement
Conflicts of Interest
References
- Zacher, H.; Kooij, T.; Beier, M. Active ageing at work: Contributing factors and implications for organizations. Organ. Dyn. 2018, 47, 37–45. [Google Scholar] [CrossRef]
- Van Dam, K.; Van Vuuren, T.; Kemps, S. Sustainable employment: The importance of intrinsically valuable work and an age-supportive climate. Int. J. Hum. Resour. Manag. 2017, 28, 2449–2472. [Google Scholar] [CrossRef] [Green Version]
- Hasselhorn, H.-M.; Tackenberg, P.; Müller, B.H. Working Conditions and Intent to Leave the Profession among Nursing Staff in Europe; National Institute for Working Life: Stockholm, Sweden, 2003. [Google Scholar]
- Campbell, J.; Dussault, G.; Buchan, J.; Pozo-Martin, F.; Arias, M.G.; Leone, C. A Universal Truth: No Health without a Workforce; World Health Organization: Geneva, Switzerland, 2013. [Google Scholar]
- Ng, T.W.; Feldman, D.C. The relationship of age to ten dimensions of job performance. J. Appl. Psychol. 2008, 93, 392–423. [Google Scholar] [CrossRef] [PubMed]
- Ng, T.W.H.; Feldman, D.C. How do within-person changes due to aging affect job performance? J. Vocat. Behav. 2013, 83, 500–513. [Google Scholar] [CrossRef]
- Posthuma, R.A.; Campion, M.A. Age Stereotypes in the Workplace: Common Stereotypes, Moderators, and Future Research Directions. J. Manag. 2009, 35, 158–188. [Google Scholar] [CrossRef] [Green Version]
- Babeľová, Z.G.; Stareček, A.; Vraňaková, N.; Császár, M.; Šarmír, M.; Sakál, P.; Cagáňová, D. Age Discrimination, Release of Employees and Sustainable Law Strategy in Industrial Enterprises. Res. Pap. Fac. Mater. Sci. Technol. Slovak Univ. Technol. 2019, 27, 25–33. [Google Scholar] [CrossRef] [Green Version]
- Ahmed, A.M.; Andersson, L.; Hammarstedt, M. Does age matter for employability? A field experiment on ageism in the Swedish labour market. Appl. Econ. Lett. 2012, 19, 403–406. [Google Scholar] [CrossRef]
- Peters, P.; Van Der Heijden, B.; Spurk, D.; De Vos, A.; Klaassen, R. Please Don’t Look at Me that Way. An Empirical Study into the Effects of Age-Based (Meta-) Stereotyping on Employability Enhancement among Supermarket Workers. Front. Psychol. 2019, 10, 249. [Google Scholar] [CrossRef]
- Wood, G.; Wilkinson, A.; Harcourt, M. Age discrimination and working life: Perspectives and contestations—A review of the contemporary literature. Int. J. Manag. Rev. 2008, 10, 425–442. [Google Scholar] [CrossRef] [Green Version]
- Iversen, T.N.; Larsen, L.; Solem, P.E. A conceptual analysis of ageism. Nord. Psychol. 2009, 61, 4–22. [Google Scholar] [CrossRef]
- Solem, P.E. The affective component of ageism needs attention. Int. J. Manpow. 2020, 41, 583–594. [Google Scholar] [CrossRef]
- Bayl-Smith, P.H.; Griffin, B. Age discrimination in the workplace: Identifying as a late-career worker and its relationship with engagement and intended retirement age. J. Appl. Soc. Psychol. 2014, 44, 588–599. [Google Scholar] [CrossRef]
- Palmore, E.B. Definitions. In Encyclopedia of Ageism; Palmore, E.B., Branch, L., Harris, D.K., Eds.; Haworth Pastoral Press: New York, NY, USA, 2005; pp. 96–99. [Google Scholar]
- Corrington, A.; Ng, L.C.; Phetmisy, C.N.; Watson, I.; Wu, F.Y.; Hebl, M. How bias thwarts successful aging at work. Ind. Organ. Psychol. 2020, 13, 413–416. [Google Scholar] [CrossRef]
- De Lange, A.H.; Van der Heijden, B.I.J.M.; Van Vuuren, T.; Furunes, T.; De Lange, C.; Dikkers, J. Employable as we age? A systematic review of relationships between age conceptualizations and employability. Front. Psychol. 2020, 11, 3969. [Google Scholar] [CrossRef]
- Ruggs, E.N.; Hebl, M.R.; Law, C.; Cox, C.B.; Roehling, M.V.; Wiener, R.L. Gone fishing: I–O psychologists’ missed opportunities to understand marginalized employees’ experiences with discrimination. Ind. Organ. Psychol. 2013, 6, 39–60. [Google Scholar] [CrossRef] [Green Version]
- Marchiondo, L.A.; Gonzales, E.; Williams, L.J. Trajectories of perceived workplace age discrimination and long-term associations with mental, self-rated, and occupational health. J. Gerontol. Ser. B 2017, 74, 655–663. [Google Scholar] [CrossRef] [Green Version]
- Marchiondo, L.A.; Gonzales, E.; Ran, S. Development and validation of the workplace age discrimination scale. J. Bus. Psychol. 2016, 31, 493–513. [Google Scholar] [CrossRef]
- Kearney, M.W. Cross lagged panel analysis. In The SAGE Encyclopedia of Communication Research Methods; SAGE Publications: Thousand Oaks, CA, USA, 2017; pp. 312–314. [Google Scholar]
- Furunes, T.; Mykletun, R.J. Age discrimination in the workplace: Validation of the Nordic Age Discrimination Scale (NADS). Scand. J. Psychol. 2010, 51, 23–30. [Google Scholar]
- Boehm, S.A.; Kunze, F.; Bruch, H. Spotlight on Age-Diversity Climate: The Impact of Age-Inclusive HR Practices on Firm-Level Outcomes. Pers. Psychol. 2013, 67, 667–704. [Google Scholar] [CrossRef] [Green Version]
- Schermuly, C.C.; Deller, J.; Büsch, V. A research note on age discrimination and the desire to retire: The mediating effect of psychological empowerment. Res. Aging 2014, 36, 382–393. [Google Scholar] [CrossRef]
- Wilson, D.M.; Errasti-Ibarrondo, B.; Low, G. Where are we now in relation to determining the prevalence of ageism in this era of escalating population ageing? Ageing Res. Rev. 2019, 51, 78–84. [Google Scholar] [CrossRef] [PubMed]
- Gibson, K.J.; Zerbe, W.J.; Franken, R.E. The influence of rater and ratee age on judgments of work-related attributes. J. Psychol. Interdiscip. Appl. 1993, 127, 271–280. [Google Scholar] [CrossRef]
- Furunes, T.; Mykletun, R.J. Why diversity management fails: Metaphor analyses unveil manager attitudes. Int. J. Hosp. Manag. 2007, 26, 974–990. [Google Scholar] [CrossRef]
- Van Der Heijde, C.M.; Van der Heijden, B.I.J.M. A competence-based and multidimensional operationalization and measurement of employability. Hum. Resour. Manag. 2006, 45, 449–476. [Google Scholar] [CrossRef] [Green Version]
- Fugate, M.; Kinicki, A.J. A dispositional approach to employability: Development of a measure and test of implications for employee reactions to organizational change. J. Occup. Organ. Psychol. 2008, 81, 503–527. [Google Scholar] [CrossRef]
- Vanhercke, D.; De Cuyper, N.; Peeters, E.; De Witte, H. Defining perceived employability: A psychological approach. Pers. Rev. 2014, 43, 592–605. [Google Scholar] [CrossRef]
- Van der Heijden, B.I.; de Lange, A.H.; Demerouti, E.; Van der Heijde, C.M. Age effects on the employability–career success relationship. J. Vocat. Behav. 2009, 74, 156–164. [Google Scholar] [CrossRef]
- Le Blanc, P.M.; Van der Heijden, B.I.; Van Vuuren, T. “I WILL SURVIVE” A Construct Validation Study on the Measurement of Sustainable Employability Using Different Age Conceptualizations. Front. Psychol. 2017, 8, 1690. [Google Scholar] [CrossRef] [Green Version]
- Fleuren, B.P.; van Amelsvoort, L.G.; de Grip, A.; Zijlstra, F.R.; Kant, I. Time takes us all? A two-wave observational study of age and time effects on sustainable employability. Scand. J. Work. Environ. Health 2018, 44, 475–484. [Google Scholar] [CrossRef]
- Stengård, J.; Bernhard-Oettel, C.; Berntson, E.; Leineweber, C.; Aronsson, G. Stuck in a job: Being “locked-in” or at risk of becoming locked-in at the workplace and well-being over time. Work Stress 2016, 30, 152–172. [Google Scholar] [CrossRef] [Green Version]
- Berntson, E.; Marklund, S. The relationship between perceived employability and subsequent health. Work Stress 2007, 21, 279–292. [Google Scholar] [CrossRef]
- Baltes, P.B.; Staudinger, U.M.; Lindenberger, U. Lifespan psychology: Theory and application to intellectual functioning. Annu. Rev. Psychol. 1999, 50, 471–507. [Google Scholar] [CrossRef] [PubMed] [Green Version]
- Kooij, D.T.A.M.; de Lange, A.H.; Jansen, P.G.W.; Kanfer, R.; Dikkers, J.S.E. Age and work-related motives: Results of a meta-analysis. J. Organ. Behav. 2011, 32, 197–225. [Google Scholar] [CrossRef] [Green Version]
- Mazzetti, G.; Vignoli, M.; Guglielmi, D.; Van der Heijden, B.I.J.M.; Evers, A.T. You’re not old as long as you’re learning: Ageism, burnout, and development among Italian teachers. J. Career Dev. 2020, 49, 427–442. [Google Scholar] [CrossRef]
- Rynes, S.L. Recruitment, job choice, and post-hire consequences: A call for new research directions. In Handbook of Industrial and Organizational Psychology; Dunnette, M.D., Hough, L.M., Eds.; Consulting Psychologists Press: Palo Alto, CA, USA, 1989; Volume 2, pp. 399–444. [Google Scholar]
- Froehlich, D.E.; Beausaert, S.; Segers, M.; Gerken, M. Learning to stay employable. Career Dev. Int. 2014, 19, 508–525. [Google Scholar] [CrossRef] [Green Version]
- Levy, B.R.; Leifheit-Limson, E. The stereotype-matching effect: Greater influence on functioning when age stereotypes correspond to outcomes. Psychol. Aging 2009, 24, 230. [Google Scholar] [CrossRef] [PubMed] [Green Version]
- Gruenewald, T.L.; Karlamangla, A.S.; Greendale, G.A.; Singer, B.H.; Seeman, T.E. Feelings of usefulness to others, disability, and mortality in older adults: The MacArthur study of successful aging. J. Gerontol. Ser. B Psychol. Sci. Soc. Sci. 2007, 62, P28–P37. [Google Scholar] [CrossRef] [Green Version]
- Johnson, R.W.; Neumark, D. Age discrimination, job separation, and employment status of older workers: Evidence from self-reports. J. Hum. Resour. 1996, 32, 779–811. [Google Scholar] [CrossRef]
- De Lange, A.H.; Taris, T.W.; Kompier, M.A.; Houtman, I.L.; Bongers, P.M. The relationships between work characteristics and mental health: Examining normal, reversed and reciprocal relationships in a 4-wave study. Work Stress 2004, 18, 149–166. [Google Scholar] [CrossRef] [Green Version]
- Taris, T.W.; Kompier, M.A.; Geurts, S.A.; Houtman, I.L.; Van Den Heuvel, F.F. Professional efficacy, exhaustion, and work characteristics among police officers: A longitudinal test of the learning-related predictions of the demand-control model. J. Occup. Organ. Psychol. 2010, 83, 455–474. [Google Scholar] [CrossRef]
- Van Der Heijden, B.I.J.M.; Demerouti, E.; Bakker, A.B.; Hasselhorn, H.-M. Work-home interference among nurses: Reciprocal relationships with job demands and health. J. Adv. Nurs. 2008, 62, 572–584. [Google Scholar] [CrossRef] [PubMed]
- Ângelo, R.; Chambel, M.J. The reciprocal relationship between work characteristics and employee burnout and engagement: A longitudinal study of firefighters. Stress Health 2015, 31, 106–114. [Google Scholar] [CrossRef] [PubMed]
- Lesener, T.; Gusy, B.; Wolter, C. The job demands-resources model: A meta-analytic review of longitudinal studies. Work Stress 2019, 33, 76–103. [Google Scholar] [CrossRef]
- Nielsen, M.B.; Skogstad, A.; Gjerstad, J.; Einarsen, S.V. Are transformational and laissez-faire leadership related to state anxiety among subordinates? A two-wave prospective study of forward and reverse associations. Work Stress 2019, 33, 137–155. [Google Scholar] [CrossRef]
- Xanthopoulou, D.; Bakker, A.B.; Demerouti, E.; Schaufeli, W.B. Reciprocal relationships between job resources, personal resources, and work engagement. J. Vocat. Behav. 2009, 74, 235–244. [Google Scholar] [CrossRef] [Green Version]
- Frese, M.; Garst, H.; Fay, D. Making things happen: Reciprocal relationships between work characteristics and personal initiative in a four-wave longitudinal structural equation model. J. Appl. Psychol. 2007, 92, 1084–1102. [Google Scholar] [CrossRef] [Green Version]
- De Lange, A.H.; Taris, T.W.; Jansen, P.; Kompier, M.A.; Houtman, I.L.; Bongers, P.M. On the relationships among work characteristics and learning-related behavior: Does age matter? J. Organ. Behav. 2010, 31, 925–950. [Google Scholar] [CrossRef] [Green Version]
- Warr, P. Job performance and the ageing workforce. In Introduction to Work and Organizational Psychology: A European Perspective; Chmiel, N., Ed.; Blackwell Publishing: Oxford, UK, 2000; pp. 407–423. [Google Scholar]
- Ilmarinen, J. Aging workers. Occup. Environ. Med. 2001, 58, 546–552. [Google Scholar] [CrossRef] [Green Version]
- Ford, M.T.; Matthews, R.A.; Wooldridge, J.D.; Mishra, V.; Kakar, U.M.; Strahan, S.R. How do occupational stressor-strain effects vary with time? A review and meta-analysis of the relevance of time lags in longitudinal studies. Work Stress 2014, 28, 9–30. [Google Scholar] [CrossRef]
- De Lange, A.H.; Pak, K.; Osagie, E.; van Dam, K.; Christensen, M.; Furunes, T.; Løvseth, L.T.; Detaille, S. An open time perspective and social support to sustain in healthcare work: Results of a two-wave complete panel study. Front. Psychol. 2020, 11, 1308. [Google Scholar] [CrossRef]
- Akkermans, J.; Brenninkmeijer, V.; Huibers, M.; Blonk, R.W.B. Competencies for the Contemporary Career: Development and Preliminary Validation of the Career Competencies Questionnaire. J. Career Dev. 2013, 40, 245–267. [Google Scholar] [CrossRef] [Green Version]
- Bentler, P.M. Comparative fit indexes in structural models. Psychol. Bull. 1990, 107, 238. [Google Scholar] [CrossRef] [PubMed]
- Tucker, L.R.; Lewis, C. A reliability coefficient for maximum likelihood factor analysis. Psychometrika 1973, 38, 1–10. [Google Scholar] [CrossRef]
- Steiger, J.H.; Lind, J.C. Statistically based tests for the number of common factors. In Proceedings of the Annual Meeting of the Psychometric Society, Iowa City, IA, USA, 28 May 1980; pp. 424–453. [Google Scholar]
- Hu, L.T.; Bentler, P.M. Evaluating model fit. In Structural Equation Modeling: Concepts, Issues, and Applications; Hoyle, R.H., Ed.; Sage: Thousand Oaks, CA, USA, 1995; pp. 76–99. [Google Scholar]
- Hu, L.T.; Bentler, P.M. Cutoff criteria for fit indexes in covariance structure analysis: Conventional criteria versus new alternatives. Struct. Equ. Model. Multidiscip. J. 1999, 6, 1–55. [Google Scholar] [CrossRef]
- Van de Schoot, R.; Lugtig, P.; Hox, J. A checklist for testing measurement invariance. Eur. J. Dev. Psychol. 2012, 9, 486–492. [Google Scholar] [CrossRef]
- Chen, F.F. Sensitivity of goodness of fit indexes to lack of measurement invariance. Struct. Equ. Model. Multidiscip. J. 2007, 14, 464–504. [Google Scholar] [CrossRef]
- Bohlmann, C.; Rudolph, C.W.; Zacher, H. Methodological recommendations to move research on work and aging forward. Work Aging Retire. 2018, 4, 225–237. [Google Scholar] [CrossRef]
- Truxillo, D.M.; Finkelstein, L.M.; Pytlovany, A.C.; Jenkins, J.S. Age discrimination at work: A review of the research and recommendations for the future. In The Oxford Handbook of Workplace Discrimination; Oxford University Press: New York, NY, USA, 2015; Volume 1, pp. 129–142. [Google Scholar]
- Herzberg, F.I. Work and the Nature of Man; Thomas Y. Crowell Co.: New York, NY, USA, 1966. [Google Scholar]
- Herzberg, F. One More Time: How Do You Motivate Employees; Harvard Business Review: Boston, MA, USA, 1968; pp. 53–65. [Google Scholar]
- Zapf, D.; Dormann, C.; Frese, M. Longitudinal studies in organizational stress research: A review of the literature with reference to methodological issues. J. Occup. Health Psychol. 1996, 1, 145. [Google Scholar] [CrossRef]
- Podsakoff, P.M.; MacKenzie, S.B.; Lee, J.-Y.; Podsakoff, N.P. Common method biases in behavioral research: A critical review of the literature and recommended remedies. J. Appl. Psychol. 2003, 88, 879–903. [Google Scholar] [CrossRef]
- Katz, D.; Kahn, R. The Social Psychology of Organizations; Wiley: New York, NY, USA, 1978. [Google Scholar]
- Reeves, M.D.; Fritzsche, B.A.; Marcus, J.; Smith, N.A.; Ng, Y.L. “Beware the young doctor and the old barber”: Development and validation of a job age-type spectrum. J. Vocat. Behav. 2021, 129, 103616. [Google Scholar] [CrossRef]
- De Lange, A.; Furunes, T.; Buckens, A. Older workers’ self management and sustainable employability at work: Lessons learned from science and practice. In Handbook of Work and Aging; Fideler, E., Ed.; Rowman & Littlefield Publishers: Lanham, MD, USA, 2021. [Google Scholar]
- Urick, M. Adapting training to meet the preferred learning styles of different generations. Int. J. Train. Dev. 2017, 21, 53–59. [Google Scholar] [CrossRef]
- Allport, G.W. The Nature of Prejudice; Addison-Wesley: Reading, MA, USA, 1954. [Google Scholar]
- Kunze, F.; Boehm, S.A.; Bruch, H. Age diversity, age discrimination climate and performance consequences—A cross organizational study. J. Organ. Behav. 2011, 32, 264–290. [Google Scholar] [CrossRef] [Green Version]
- De Prins, P.; De Vos, A.; Van Beirendonck, L.; Segers, J. Sustainable HRM for sustainable careers: Introducing the ‘Respect Openness Continuity (ROC) model’. In Handbook of Research on Sustainable Careers; Edward Elgar Publishing: Northampton, MA, USA, 2015; pp. 319–334. [Google Scholar]
- Liu, S.; Liu, P.; Wang, M.; Zhang, B. Effectiveness of stereotype threat interventions: A meta-analytic review. J. Appl. Psychol. 2021, 106, 921. [Google Scholar] [CrossRef] [PubMed]

| Education Level | % (N) |
|---|---|
| Master | 11.6% (N = 172) |
| Bachelor | 35.7% (N = 527) |
| Vocational education | 37.8% (N = 558) |
| High school | 14.3% (N = 210) |
| Primary school | 0.7% (N = 11) |
| CR | AVE | |
|---|---|---|
| Internal employability T1 | 0.752 | 0.692 |
| Internal employability T2 | 0.761 | 0.693 |
| Age discrimination T1 | 0.798 | 0.674 |
| Age discrimination T2 | 0.793 | 0.682 |
| Variable | Type | χ2 | df | CFI | RMSEA | Δχ2 | Δdf | p | ΔCFI | ΔRMSEA |
|---|---|---|---|---|---|---|---|---|---|---|
| Age discrimination over time | Configural | 238.079 | 53 | 0.968 | 0.049 | 0 | 0 | 1 | 0 | 0 |
| Metric | 238.079 | 53 | 0.968 | 0.049 | 6.884 | 5 | 0.229 | 0 | 0.002 | |
| Scalar | 244.963 | 58 | 0.968 | 0.047 | ||||||
| Employability over time | Configural | 63.275 | 19 | 0.988 | 0.041 | 0 | 0 | 1 | 0 | 0 |
| Metric | 63.275 | 19 | 0.988 | 0.041 | 1.993 | 3 | 0.574 | 0 | 0.003 | |
| Scalar | 65.268 | 22 | 0.988 | 0.038 |
| Variable | Type | χ2 | df | CFI | RMSEA | Δχ2 | Δdf | p | ΔCFI | ΔRMSEA |
|---|---|---|---|---|---|---|---|---|---|---|
| Measurement invariance across groups | Configural | 1778.454 | 492 | 0.864 | 0.073 | 66.73 | 32 | 0.001 | 0.005 | 0.001 |
| Metric | 1855.184 | 524 | 0.859 | 0.072 | 183.51 | 32 | 0.000 | 0.014 | −0.002 | |
| Scalar | 2038.698 | 556 | 0.843 | 0.074 |
| M. | SD. | 1. | 2. | 3. | 4. | |
|---|---|---|---|---|---|---|
| 1. Internal employability T1 | 3.18 | 0.71 | ||||
| 2. Age discrimination T1 | 2.32 | 0.58 | −0.12 ** | |||
| 3. Internal employability T2 | 3.20 | 0.71 | 0.61 ** | −0.11 ** | ||
| 4. Age discrimination T2 | 3.68 | 0.59 | −0.14 ** | 0.54 ** | −0.15 ** | |
| 5. Age | 46.79 | 11.06 | −0.28 ** | −0.01 | −0.27 ** | 0.03 |
| X2 | Df | p | CFI | TLI | RMSEA | SRMR | |
|---|---|---|---|---|---|---|---|
| Model 0 | 718.374 | 174 | 0.001 | 0.945 | 0.933 | 0.046 | 0.050 |
| Model 1 | 717.601 | 173 | 0.001 | 0.945 | 0.933 | 0.046 | 0.049 |
| Model 2 | 712.541 | 173 | 0.001 | 0.945 | 0.933 | 0.046 | 0.048 |
| Model 3 | 711.800 | 172 | 0.001 | 0.945 | 0.933 | 0.046 | 0.048 |
| X2 | Df | p | ΔX2 | ΔDf | Δp | |
|---|---|---|---|---|---|---|
| Constrained model | 421.641 | 14 | 0.001 | 421.641 | 14 | 0.000 |
| Non-constrained model | 0.000 | 0 | 0.001 |
Publisher’s Note: MDPI stays neutral with regard to jurisdictional claims in published maps and institutional affiliations. |
© 2022 by the authors. Licensee MDPI, Basel, Switzerland. This article is an open access article distributed under the terms and conditions of the Creative Commons Attribution (CC BY) license (https://creativecommons.org/licenses/by/4.0/).
Share and Cite
Pak, K.; Furunes, T.; De Lange, A.H. Age Discrimination and Employability in Healthcare Work: A Double-Edged Sword for Older Workers? Sustainability 2022, 14, 5385. https://doi.org/10.3390/su14095385
Pak K, Furunes T, De Lange AH. Age Discrimination and Employability in Healthcare Work: A Double-Edged Sword for Older Workers? Sustainability. 2022; 14(9):5385. https://doi.org/10.3390/su14095385
Chicago/Turabian StylePak, Karen, Trude Furunes, and Annet H. De Lange. 2022. "Age Discrimination and Employability in Healthcare Work: A Double-Edged Sword for Older Workers?" Sustainability 14, no. 9: 5385. https://doi.org/10.3390/su14095385
APA StylePak, K., Furunes, T., & De Lange, A. H. (2022). Age Discrimination and Employability in Healthcare Work: A Double-Edged Sword for Older Workers? Sustainability, 14(9), 5385. https://doi.org/10.3390/su14095385