Article

Regional Ecological Security Pattern Construction Based on Ecological Barriers: A Case Study of the Bohai Bay Terrestrial Ecosystem

1
College of Environmental Science and Engineering, Nankai University, #38 Tongyan Road, Haihe Education Park, Jinnan District, Tianjin 300350, China
2
School of Ecology and Environment, Inner Mongolia University, #235 University West Street, Saihan District, Huhhot 010021, China
*
Authors to whom correspondence should be addressed.
Sustainability 2022, 14(9), 5384; https://doi.org/10.3390/su14095384
Submission received: 18 March 2022 / Revised: 24 April 2022 / Accepted: 27 April 2022 / Published: 29 April 2022
(This article belongs to the Special Issue Hydrological Response to Climate Change in Arid Land)

Abstract

:
The construction of ecological barriers and ecological security patterns is an important way of maintaining regional ecological security in landscape ecology. However, there is still no consensus on the concept and connotation of ecological barriers, and the zoning and adaptive management of ecological sources are rarely considered in the construction of ecological security patterns. This study uses the terrestrial ecosystem of Bohai Bay, China as a study area, and the identification and zoning of ecological sources in the ecological security pattern are achieved by combining an ecosystem service assessment with an ecological risk assessment, and on this basis, ecological barriers are identified to optimize the structure and function of ecological sources. The minimum cumulative resistance model is used to identify ecological corridors and ecological strategic nodes and to construct an ecological security pattern based on the modified ecological sources. The results demonstrate that firstly, 2873.25 km2 was identified as the ecological source, accounting for 14.28% of the total. Secondly, there are three large ecological barrier zones and nine ecological barrier cells with a total area of 1173.06 km2, accounting for 40.83% of the ecological sources. Thirdly, a total of 35 ecological corridors were extracted, and 32 ecological strategic nodes were marked, mainly distributed at the intersection and branches of important ecological corridors. An ecological security pattern construction system was formed with the collection of ecological source selection, ecological barrier identification, ecological resistance surface construction, and ecological corridor extraction. Fourthly, the concept and connotation of ecological barriers was analyzed, and the complementary relationship between ecological barriers and ecological security patterns in terms of structure and function is discussed. This study enriches the definition and connotation of ecological barriers, provides a new framework for identifying the ecological security patterns, and provides scientific guidance for ecological protection and management in coastal areas.

1. Introduction

As urbanization accelerates, the ecological services (ESs) that ecosystems can provide are gradually becoming more and more homogeneous, and ecological security is under serious threat [1]. Building ecological security patterns (ESPs) is an important way to maintain the structure and function of ecosystems, ensure ecological security, and balance the relationship between economic and social development and ecological protection [2,3,4].
The traditional methodology of constructing ESPs can be divided into three steps: identifying ecological sources, constructing ecological resistance surface, and determining elements, such as ecological corridors and ecological strategic nodes [5]. Ecological sources are the basis of ESPs, which can provide multiple ecosystem services. [6,7,8]. Ecosystems provide services to humans through the transmission of ecosystem services and are a prerequisite for ecological security [9,10]. Therefore, the ability of a region to provide ecosystem services is one of the basis for identifying ecological sources. There are three main methods that have been applied to assess ESs: the emergy method, InVEST models, and economic methods [11,12]. In addition to ecosystem service assessment, ecological risk assessment is also considered to be one of the bases for identifying ecological sources and is often included in the assessment of ecosystem services. Jian Peng et al. used degradation risk assessment and ecological importance assessment as secondary indicators of ecosystem services to identify ecological sources, which ensures that ecological sources identified are of low ecological risk [13]. However, areas that provide ecosystem services and are at high ecological risk will not be identified as ecological sources, which can lead to potential ecological sources being neglected. Gong et al. were the first to use ecosystem service assessment and landscape risk assessment as two independent indicators and apply them to the zoning and management of ecosystem service functions [14]. This approach not only identifies ecological functional areas, but also classifies them into risk classes based on risk assessment, providing a scientific basis for regional differentiated ecological management. In the construction of ESPs, the classification of ecological risk levels of ecological sources and the development of adaptive management strategies will contribute to the stability of the structure and function of ESPs. Therefore, assessing the ecological risks of ecological source sites is key to achieving differentiated ecological management in the process of building ecological security patterns.
The InVEST Habitat Risk Assessment (HRA) model is used to assess the risk of stressors related to human activities to habitats [15]. Using the HRA model to evaluate the ecological risk of ecological sources cannot only divide the ecological sources according to the risk, but also make a differential analysis on the risk of ecological sources by using exposure and sensitivity indicators to provide the basis for the adaptive management of ecological sources. HRA takes exposure and sensitivity as the framework to identify the spatial differences of risks by assessing the cumulative risks of multiple human activities to the region [16,17]. The HRA model flexibly incorporates the original literature and expert opinions and has been applied to the division of habitat, the risk analysis of human activities on habitat, and the analysis of landscape connectivity under the human influence [16,18,19,20]. Zhai et al. use the HRA model to evaluate the risks caused by human activities in China’s coastal provinces and provide a reference for large-scale territorial spatial planning and ecosystem protection [21].
The ecological corridor is an exchange channel of ecological service functions between regional ecological sources [22,23]. Ecological corridors are spatial types of ecosystems that are linear or ribbon-like in layout and can connect spatially isolated and dispersed ecological units, allowing for the dispersal, migration, and exchange of species and are an important component in building a complete regional ecosystem [7]. The ecological corridor in ESPs is usually determined by the lowest cost path analysis or circuit theory based on the ecological resistance surface [24,25,26,27]. The land use type, DEM, night light, and impervious surface are usually regarded as the ecological resistance coefficient [24,28]. Ecological strategic nodes are areas that play a decisive role in the connectivity of the regional landscape [29]. They include both areas that play a key linking role for ecosystem services and functions, as well as areas on ecological corridors that are functionally weak and areas on ecological corridors that are most vulnerable to disturbance [28].
Based on the risk zoning of ecological sources, the construction of an ecological barrier area is an effective way to realize the adaptive management of ecological sources. The term ecological barrier first appeared in 1999 and originated from the production practices of Chinese society [30]. As a vague or controversial term, ecological barriers play an important role in China’s ecological protection. Outside of China, ecological barrier is equated with “ecosystem restoration” or “the restoration of protective ecosystem functions” [30]. For twenty years, scholars continued to enrich the basic concept and scientific connotation of ecological barriers. However, an agreement concerning the corresponding scientific questions, including the content of the ecological barrier, the planning scope, and the value evaluation after construction, has not yet been achieved [31]. In this thesis, based on the views of previous studies, an ecological barrier is defined as a complex ecosystem with benign ecological functions that are naturally or artificially modified, has clear protection and defense objects, and is in a specific area, which is a regional ecological security or ecological defense system [32,33]. An ecological barrier has a clear protection target, i.e., an area capable of providing ecological services, and a defense target, i.e., various environmental disturbances and damages caused by human activities. Existing studies have carried out research on the construction of ecological barriers using different methods, such as land use pattern assessment [34], landscape ecological risk assessment [35], and resource and environment carrying capacity index system assessment [36]. In the identification of ESPs, the construction of ecological barriers in the ecological source disturbed by human activities can buffer the adverse impact of human activities and improve the transmission capacity of ESs in the ecological sources.
With the expansion of global human activities from land to sea, the urbanization process of the Bay area rich in natural resources has accelerated, and more than 40% of the population is concentrated in the area less than 100 km away from the coastline [37,38]. The problem of ecological security in the Bay land area is significant [39,40]. Bohai Bay is a densely populated area in China and includes many heavy industrial cities [21]. Reclamation activities are frequent, and the contradiction between economic development and ecological protection is prominent [41]. The construction of ESPs in the land area of Bohai Bay can connect regional ecological patches and promote the maintenance and transmission of regional ESs. It is an important way to realize regional ecological security and promote social sustainable development.
Constructing regional ESPs is an effective measure to maintain regional ecological security [42]. How to optimize the current ESPs to maintain the long-term stability of ecosystem structure and function in the Bay area is an important problem. Therefore, this study used the InVEST-HQ model to analyze the changes of habitat quality in the land area of Bohai Bay over the past 30 years, and selected the ecological sources according to the habitat quality. Considering the instability of ecological source structure and function caused by human activities, the risk of ecological sources was evaluated and graded by the HRA model. And through the identification of ecological barrier zones, ecological source sites are managed differently to guarantee their long-term potential to provide ESs. Ecological sources and ecological barriers are defined as an ecological service supply area. The MCR model was used to extract the regional ecological corridors and ecological strategic nodes to combine with the ecological service supply area to form the optimized ESPs. In order to meet the needs of sustainable human development in the coastal area, this study has theoretical and practical significance for optimizing the process of ecological source identification and establishing ESPs.
Thus, the main objectives of this paper were to: (1) analyze the changes of habitat quality in the terrestrial ecosystem of Bohai Bay over the past 30 years; (2) integrate a risk assessment with an ecosystem service function assessment, modifying ecological source identification and zoning methods and identifying ecological barriers to achieve adaptive an ecological management of ecological sources; (3) build an ESP based on the collection of ecological source selection: ecological barrier identification, ecological resistance surface construction, and ecological corridor extraction; (4) analyze the relationship between ecological barriers and ESPs.

2. Materials and Methods
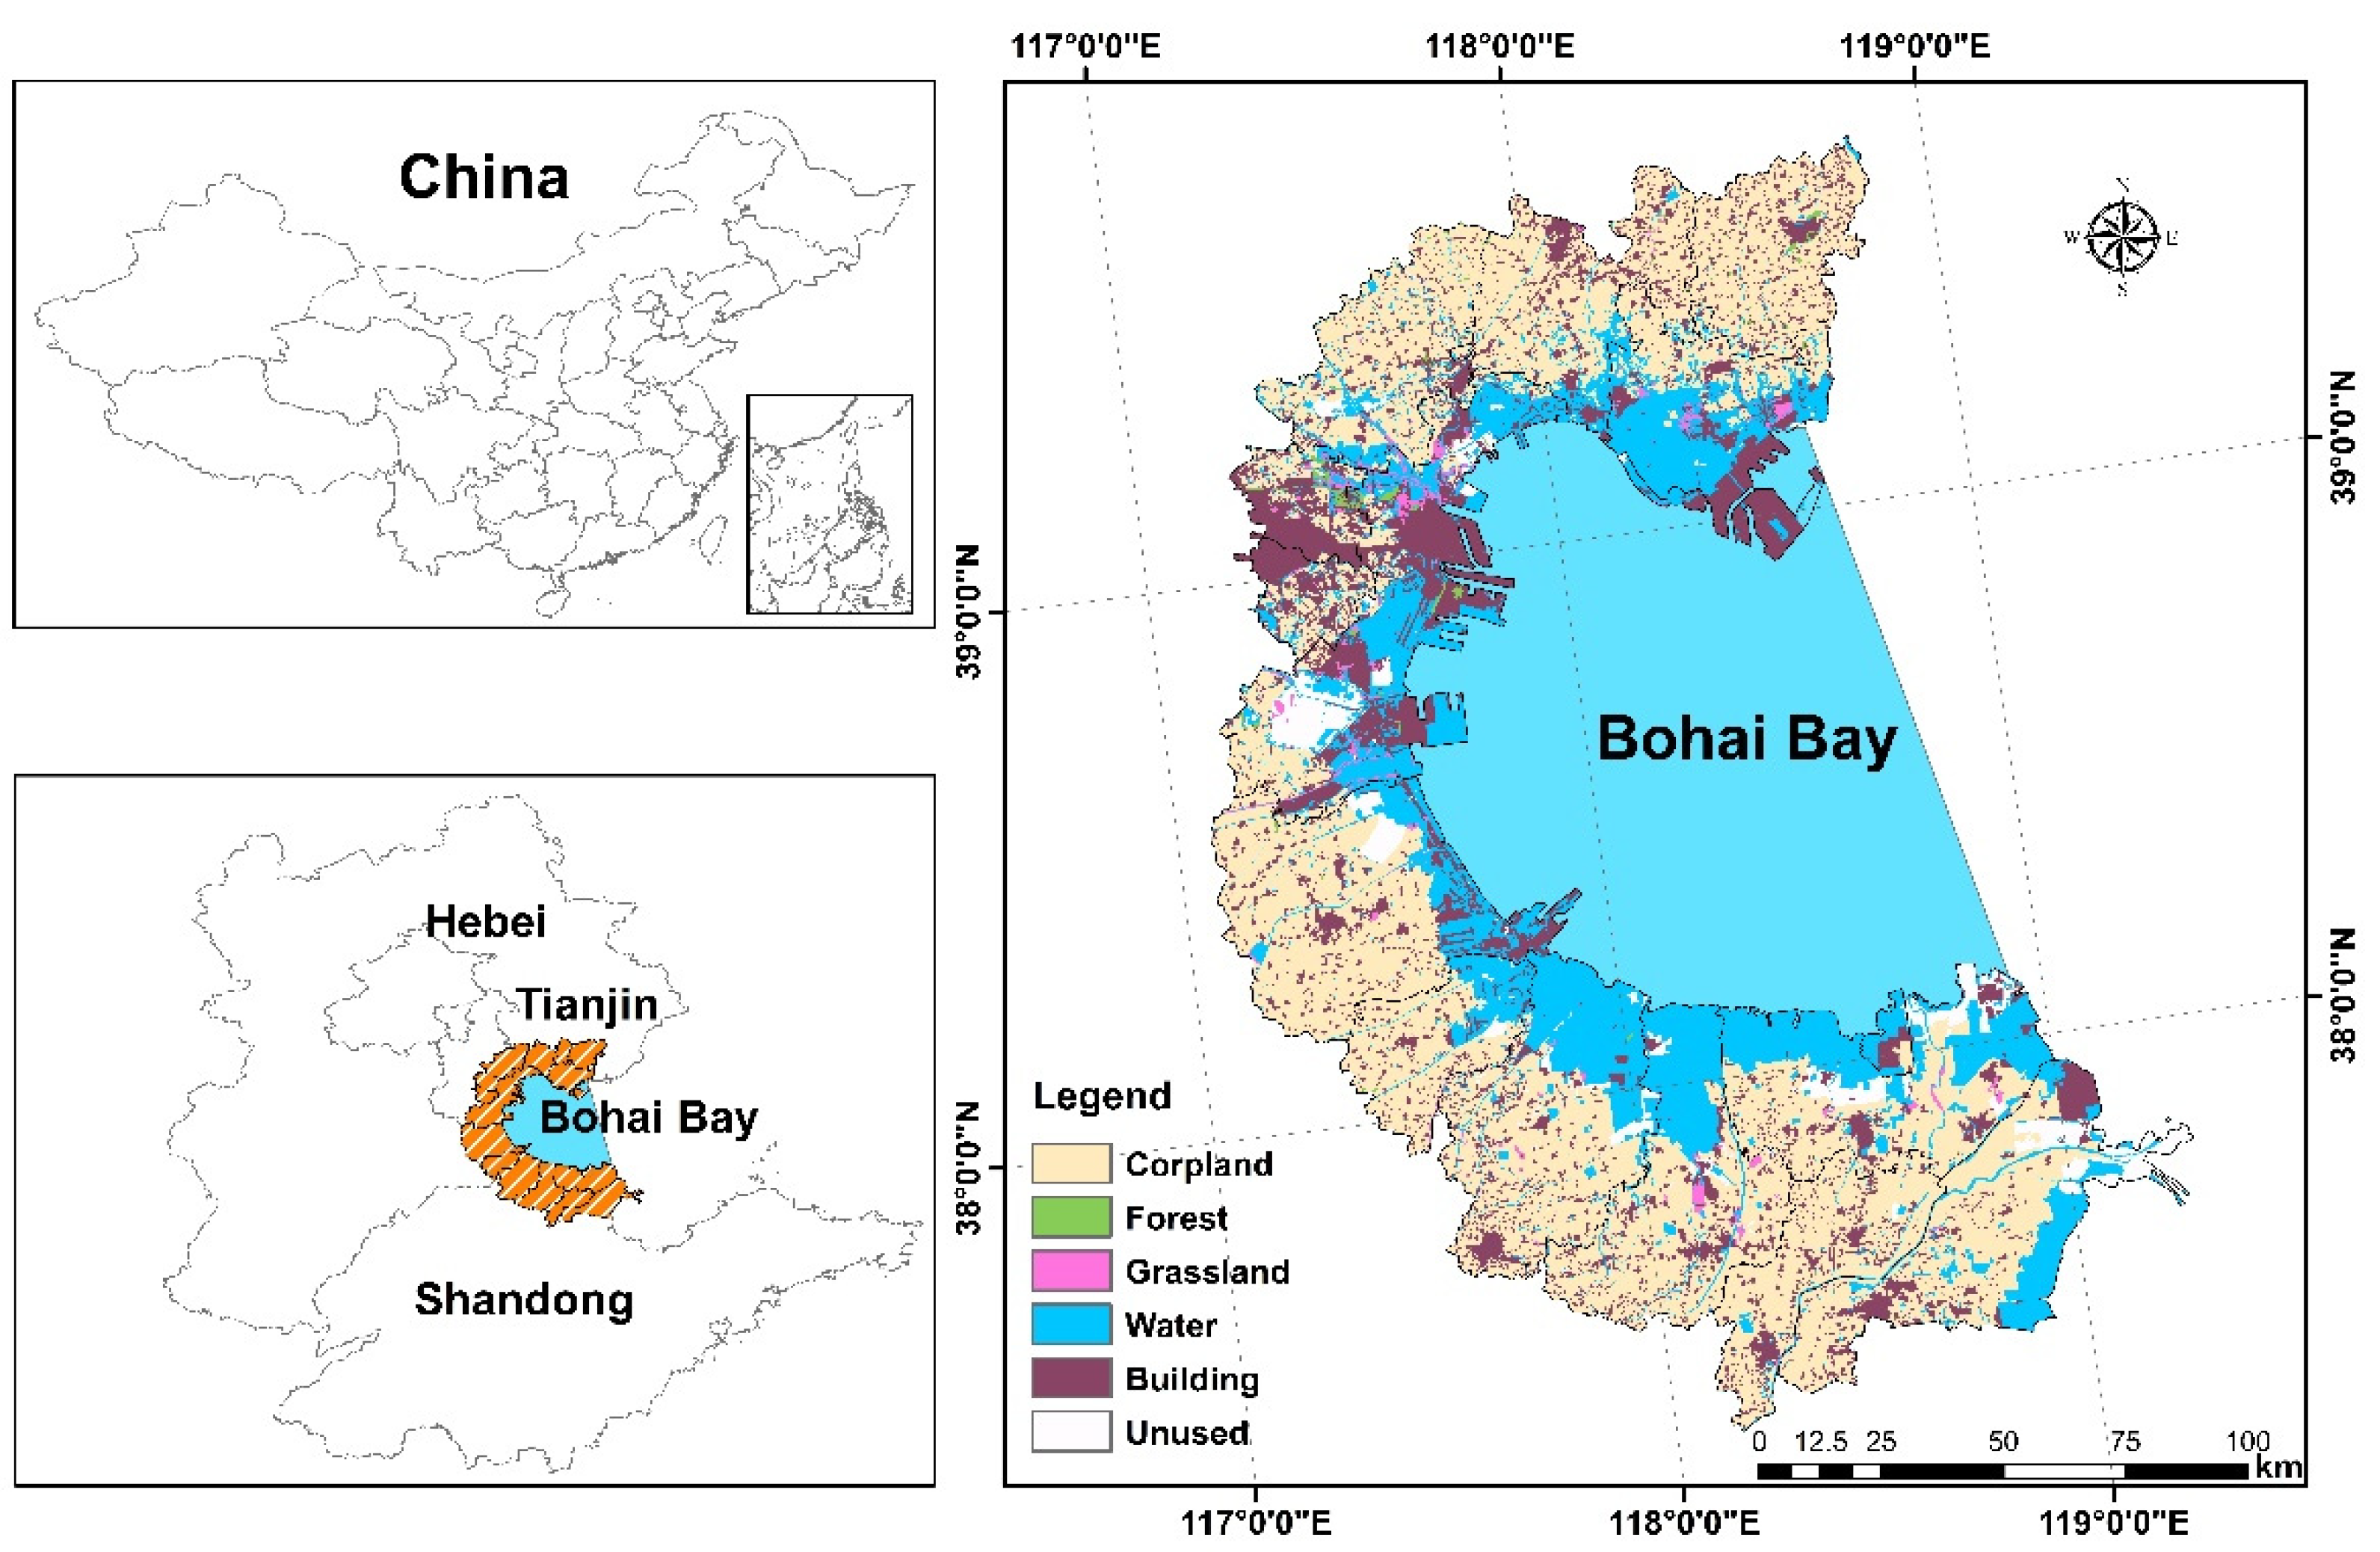
2.1. Study Area

The study area is the Bohai Bay terrestrial ecosystem, which covers 14 coastal districts and counties belonging to Hebei, Shandong, and Tianjin, respectively. Bohai Bay is located at 117°30′–118°51′E, 38°0′–39°15′N, with a width of 111 km from east to west and a length of 130 km from north to south, covering an area of 19,500 km2. The continental monsoon climate is marked by cold winters and hot summers, with four distinct seasons. The area has many rivers, lakes, ponds, reservoirs, estuaries, and shallow mudflats, forming a rich and diverse wetland landscape. The unique geographical location and good wetland environment make it an important distribution area for wetland waterbirds in eastern China, an important feeding and breeding site on the migration route of migratory birds from East Asia to Australasia, and an important refueling station for migratory waterbirds to replenish their energy. Bohai Bay, as an important maritime corridor in the Bohai Economic Circle, is rapidly urbanizing, with exceptionally active human activities and huge pressure on the ecosystem. The study area is shown in Figure 1.

2.2. Data Sources

The land use data of Bohai Bay for 1990, 2000, 2010, and 2018 used in this study were obtained from the Resource and Environment Science and Data Centre of the Chinese Academy of Sciences (https://www.resdc.cn, 13 March 2021. The land use data for 1990, 2000, and 2010 are based on Landsat TM/ETM+ remote sensing images, and the land use data for 2018 are based on Landsat 8 remote sensing images, which were generated by manual visual interpretation. The spatial resolution of the data has a certain impact on the model [43]; in this study, the resolution of the raster data is all unified at 30 m and ensures consistent spatial reference. The land use types include 6 primary types of arable land, forest land, grassland, water, residential land, and unused land and 25 secondary types. In the habitat quality model, the types of land use maps in 1990, 2000, 2010, and 2018 with frequent human activities—arable land, urban land, rural settlements, other construction land, and unused land—were extracted as threat source layers and ecological land—forests, grasslands, rivers, and lakes—were extracted as habitat layers. In the habitat risk assessment of the Boai Bay ecological sources, based on the frequent reclamation activities in the Bohai Bay area, we identified the Bhai Bay reclamation risk layer on the basis of the original threat layers and the etraction function of ArcGIS. Arable land, urban land, rural settlements, other construction land, unused land and reclamation areas were all etracted as the risk source layer; the reclamation areas were extracted as the risk source layer, and the terrestrial ecosystems with high habitat quality in Bohai Bay were taken as the ecological service supply area layer. The software packages used were ArcGIS 10.5 and InVEST 3.8.9.

2.3. Methods

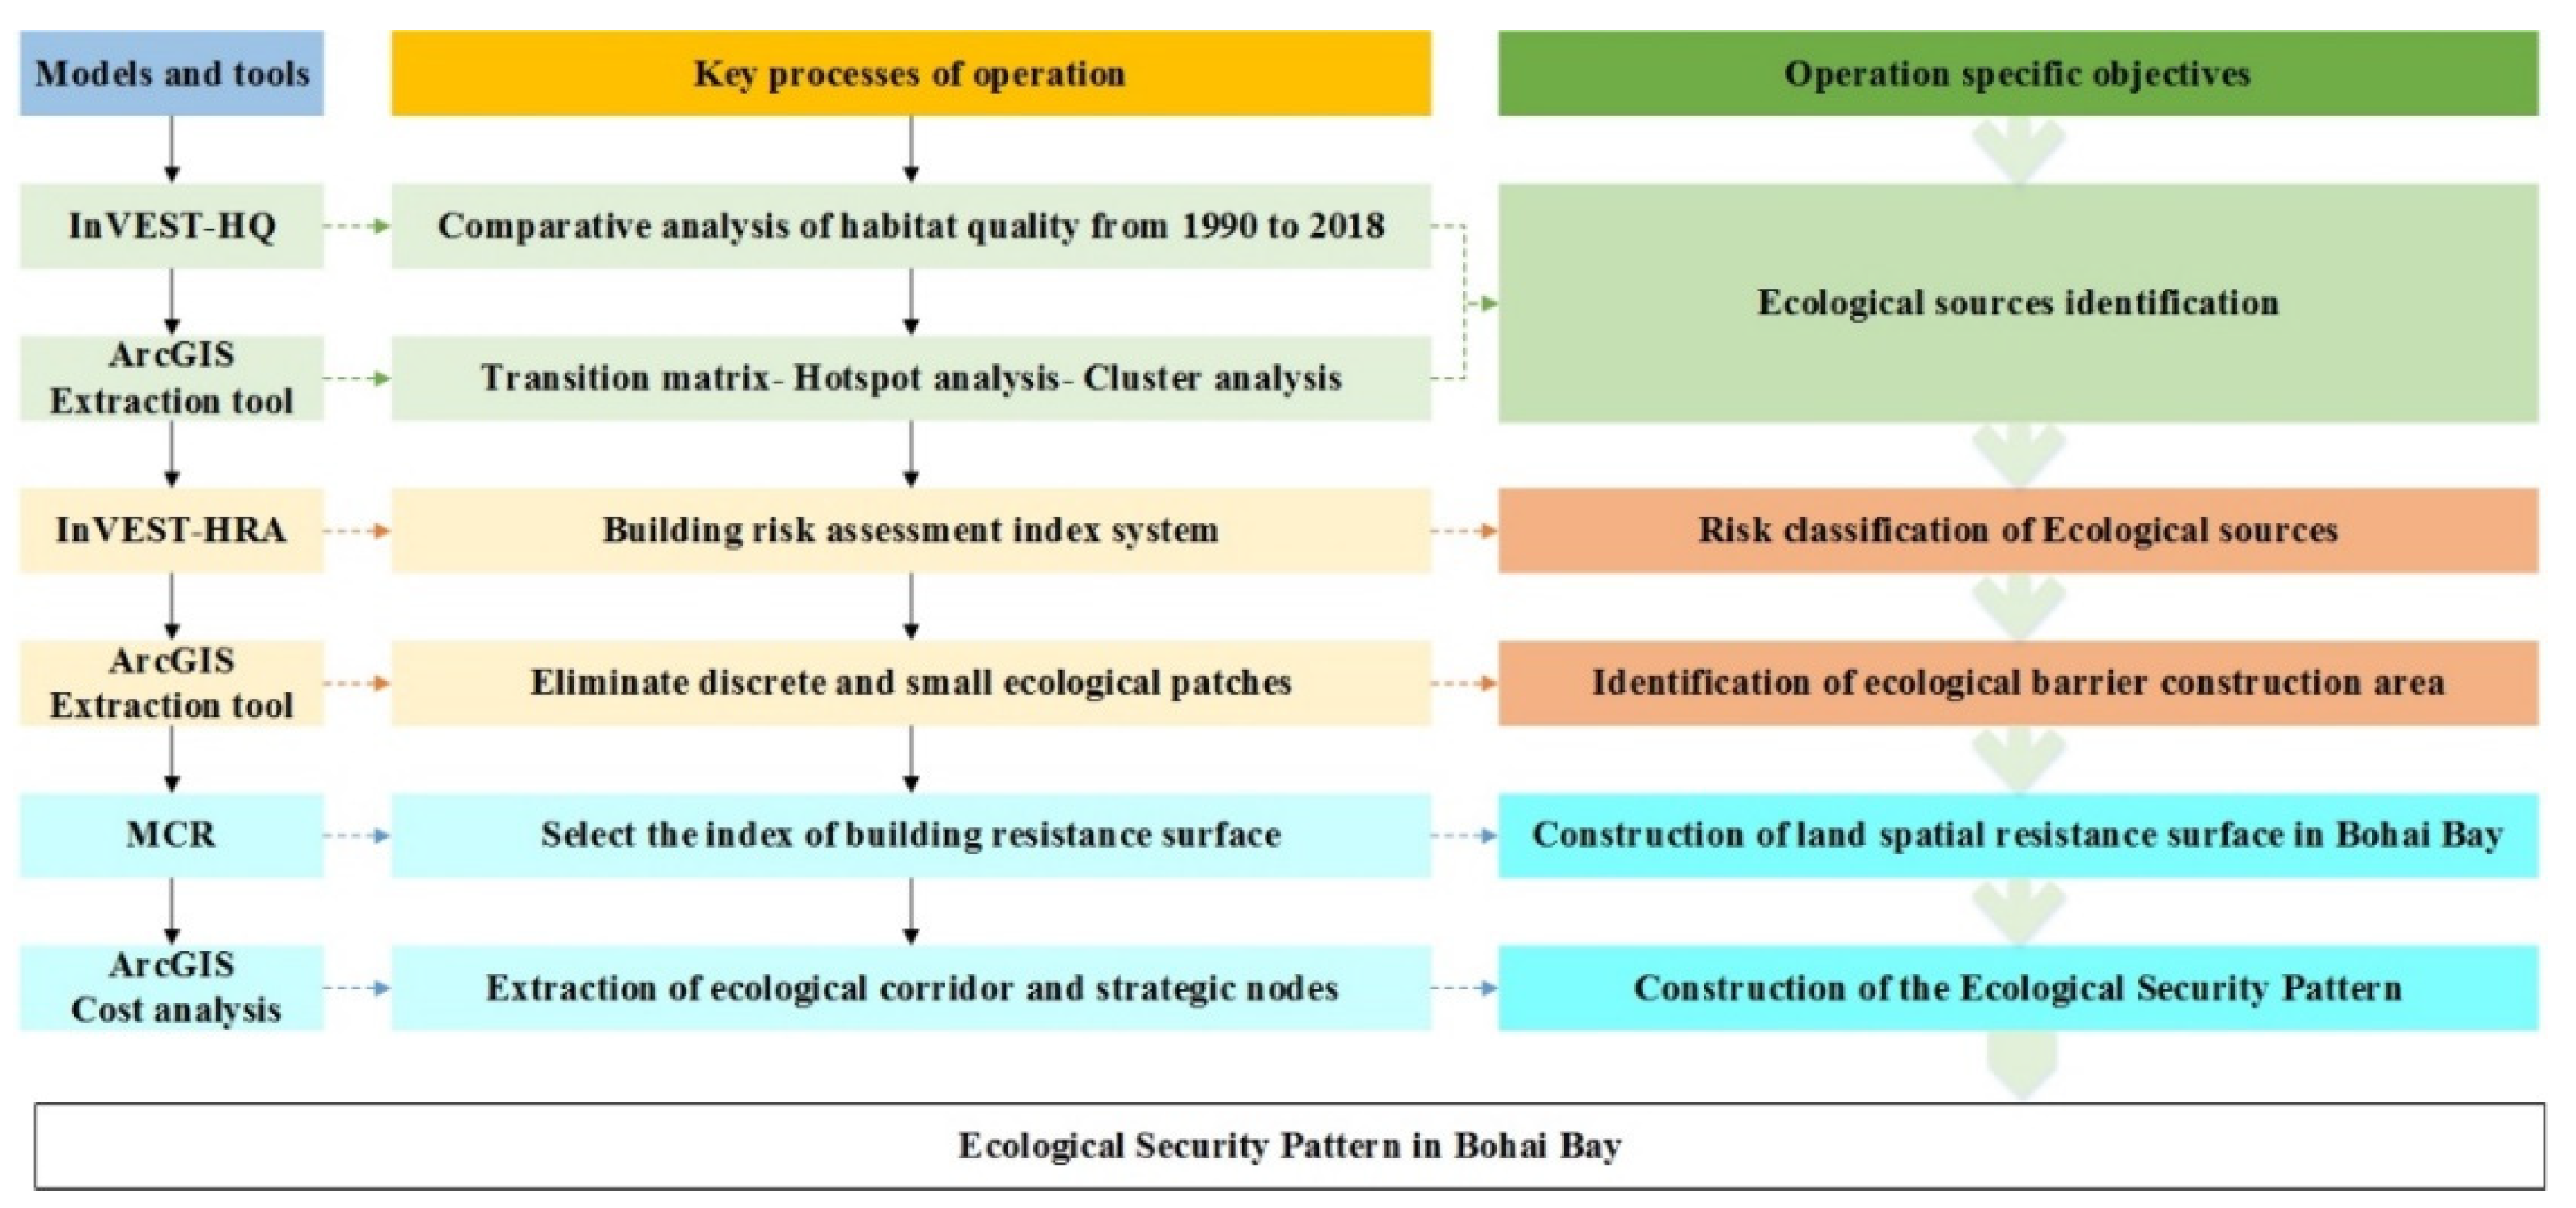
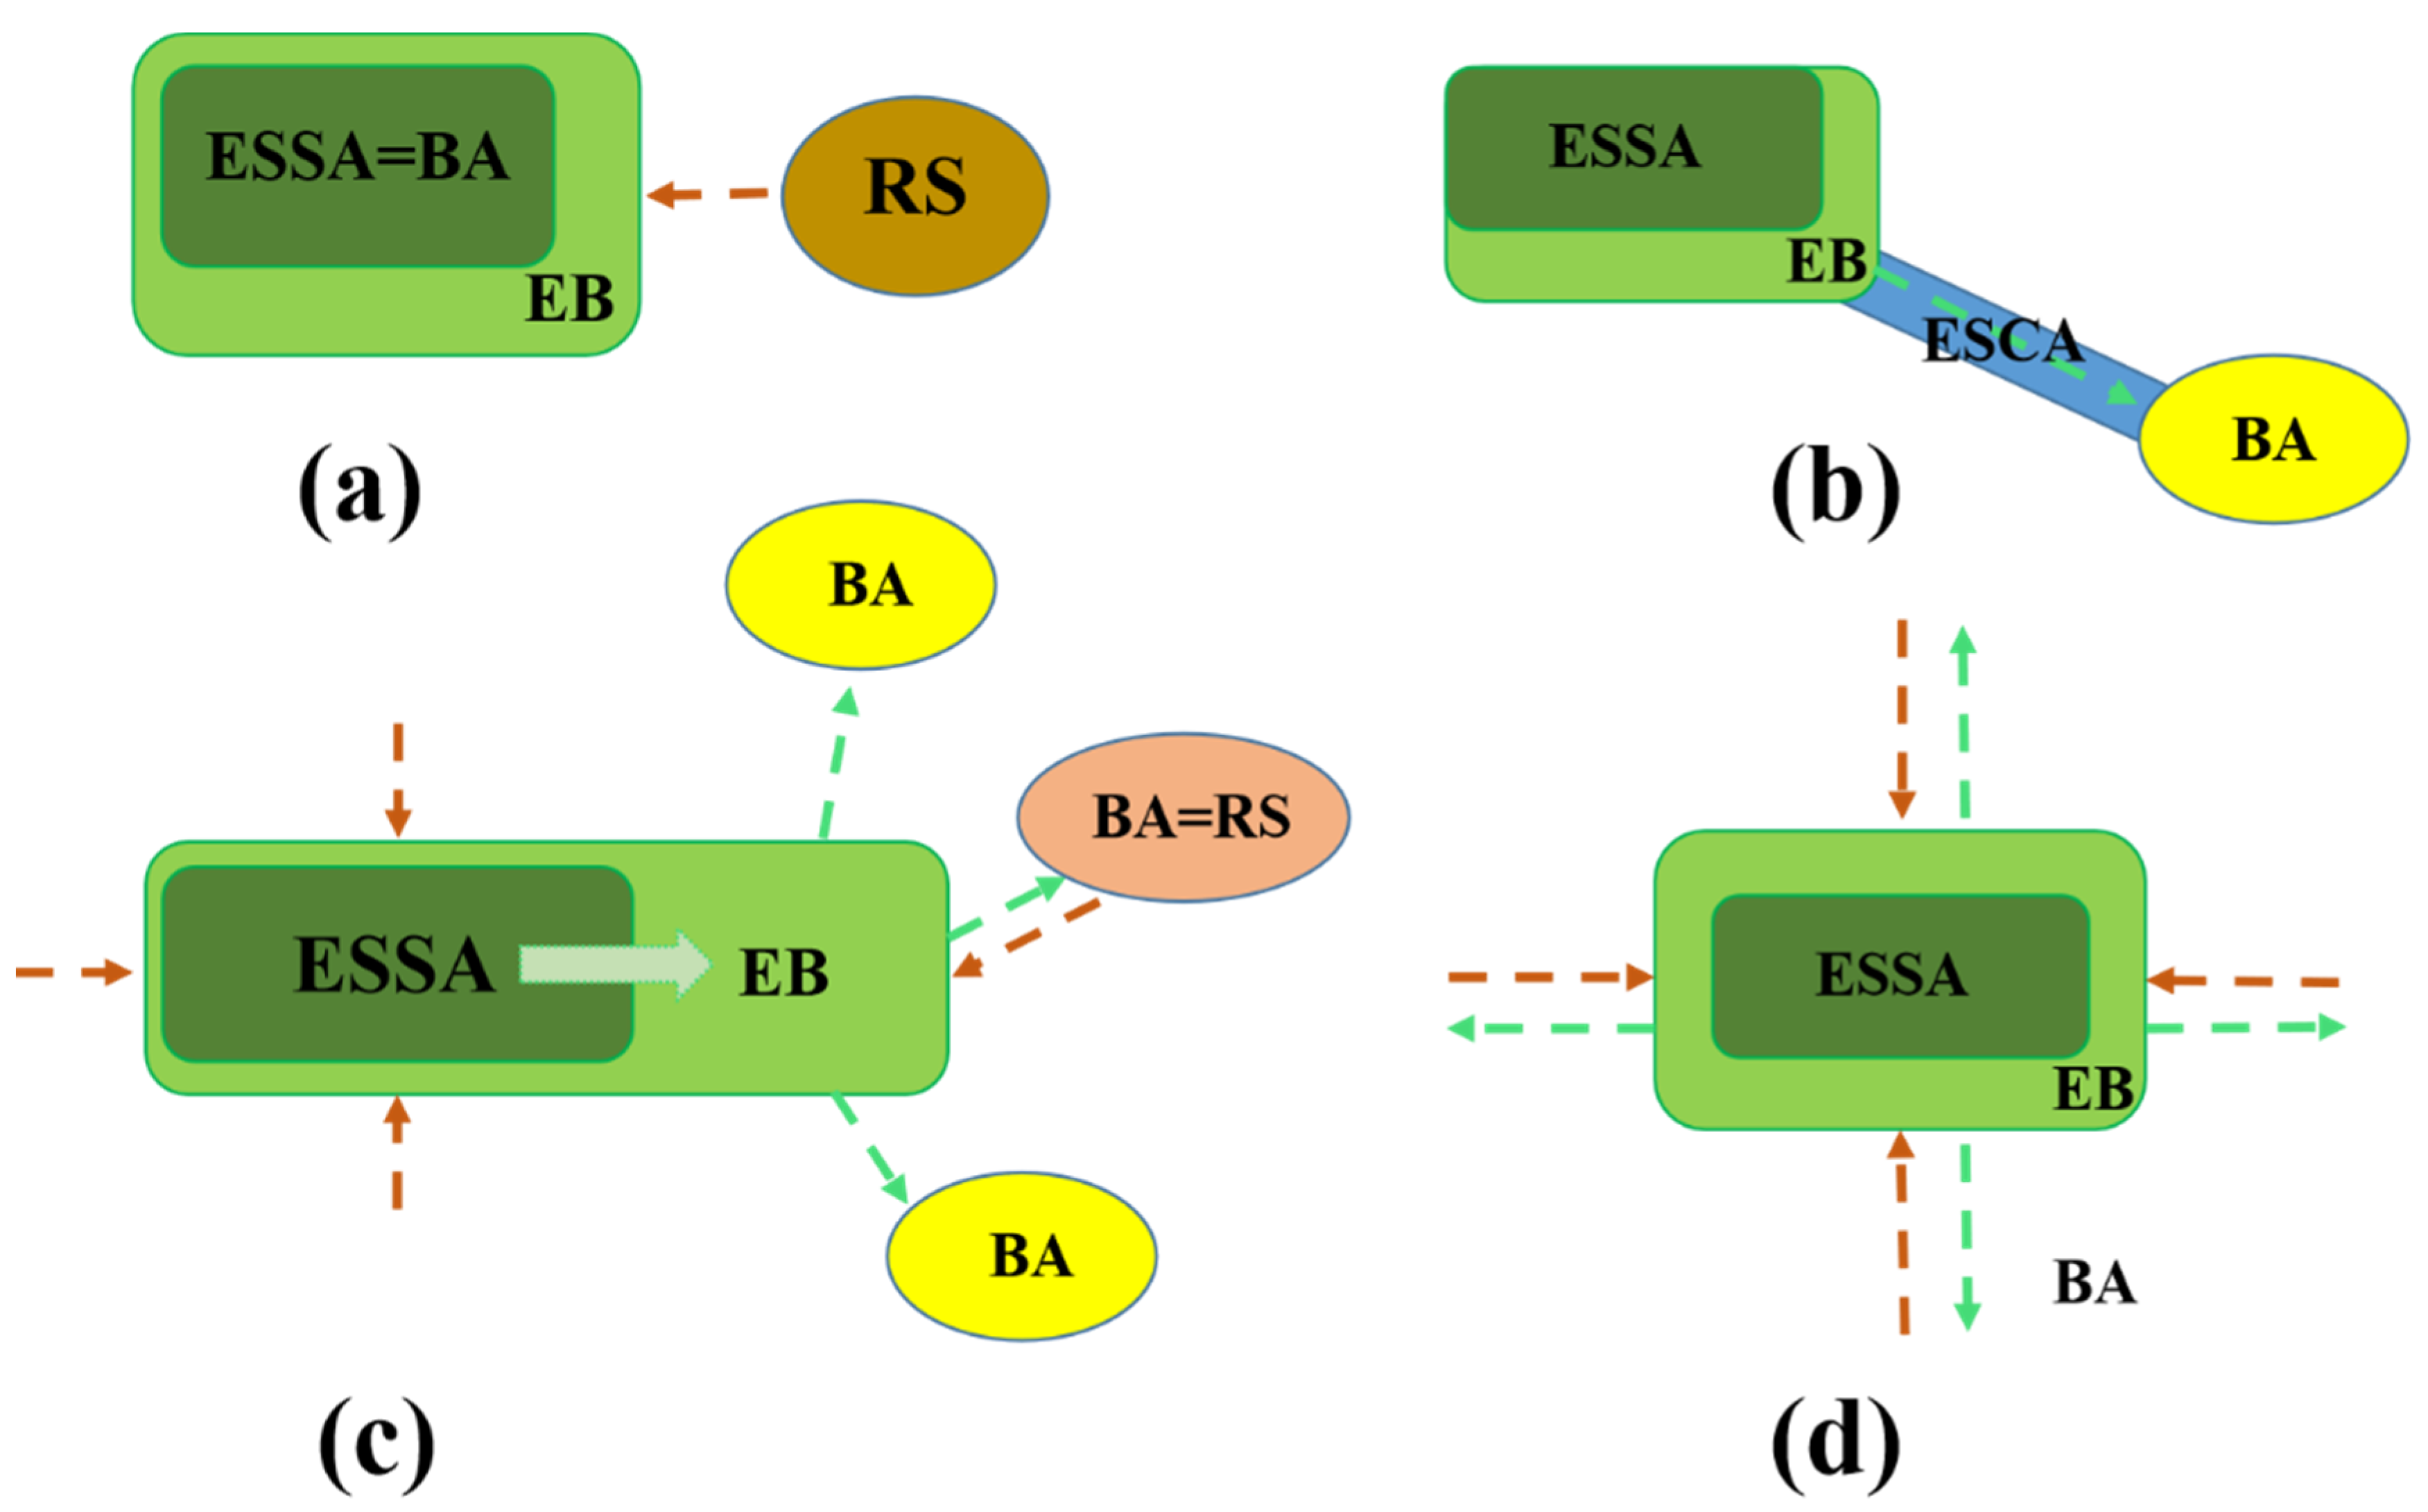
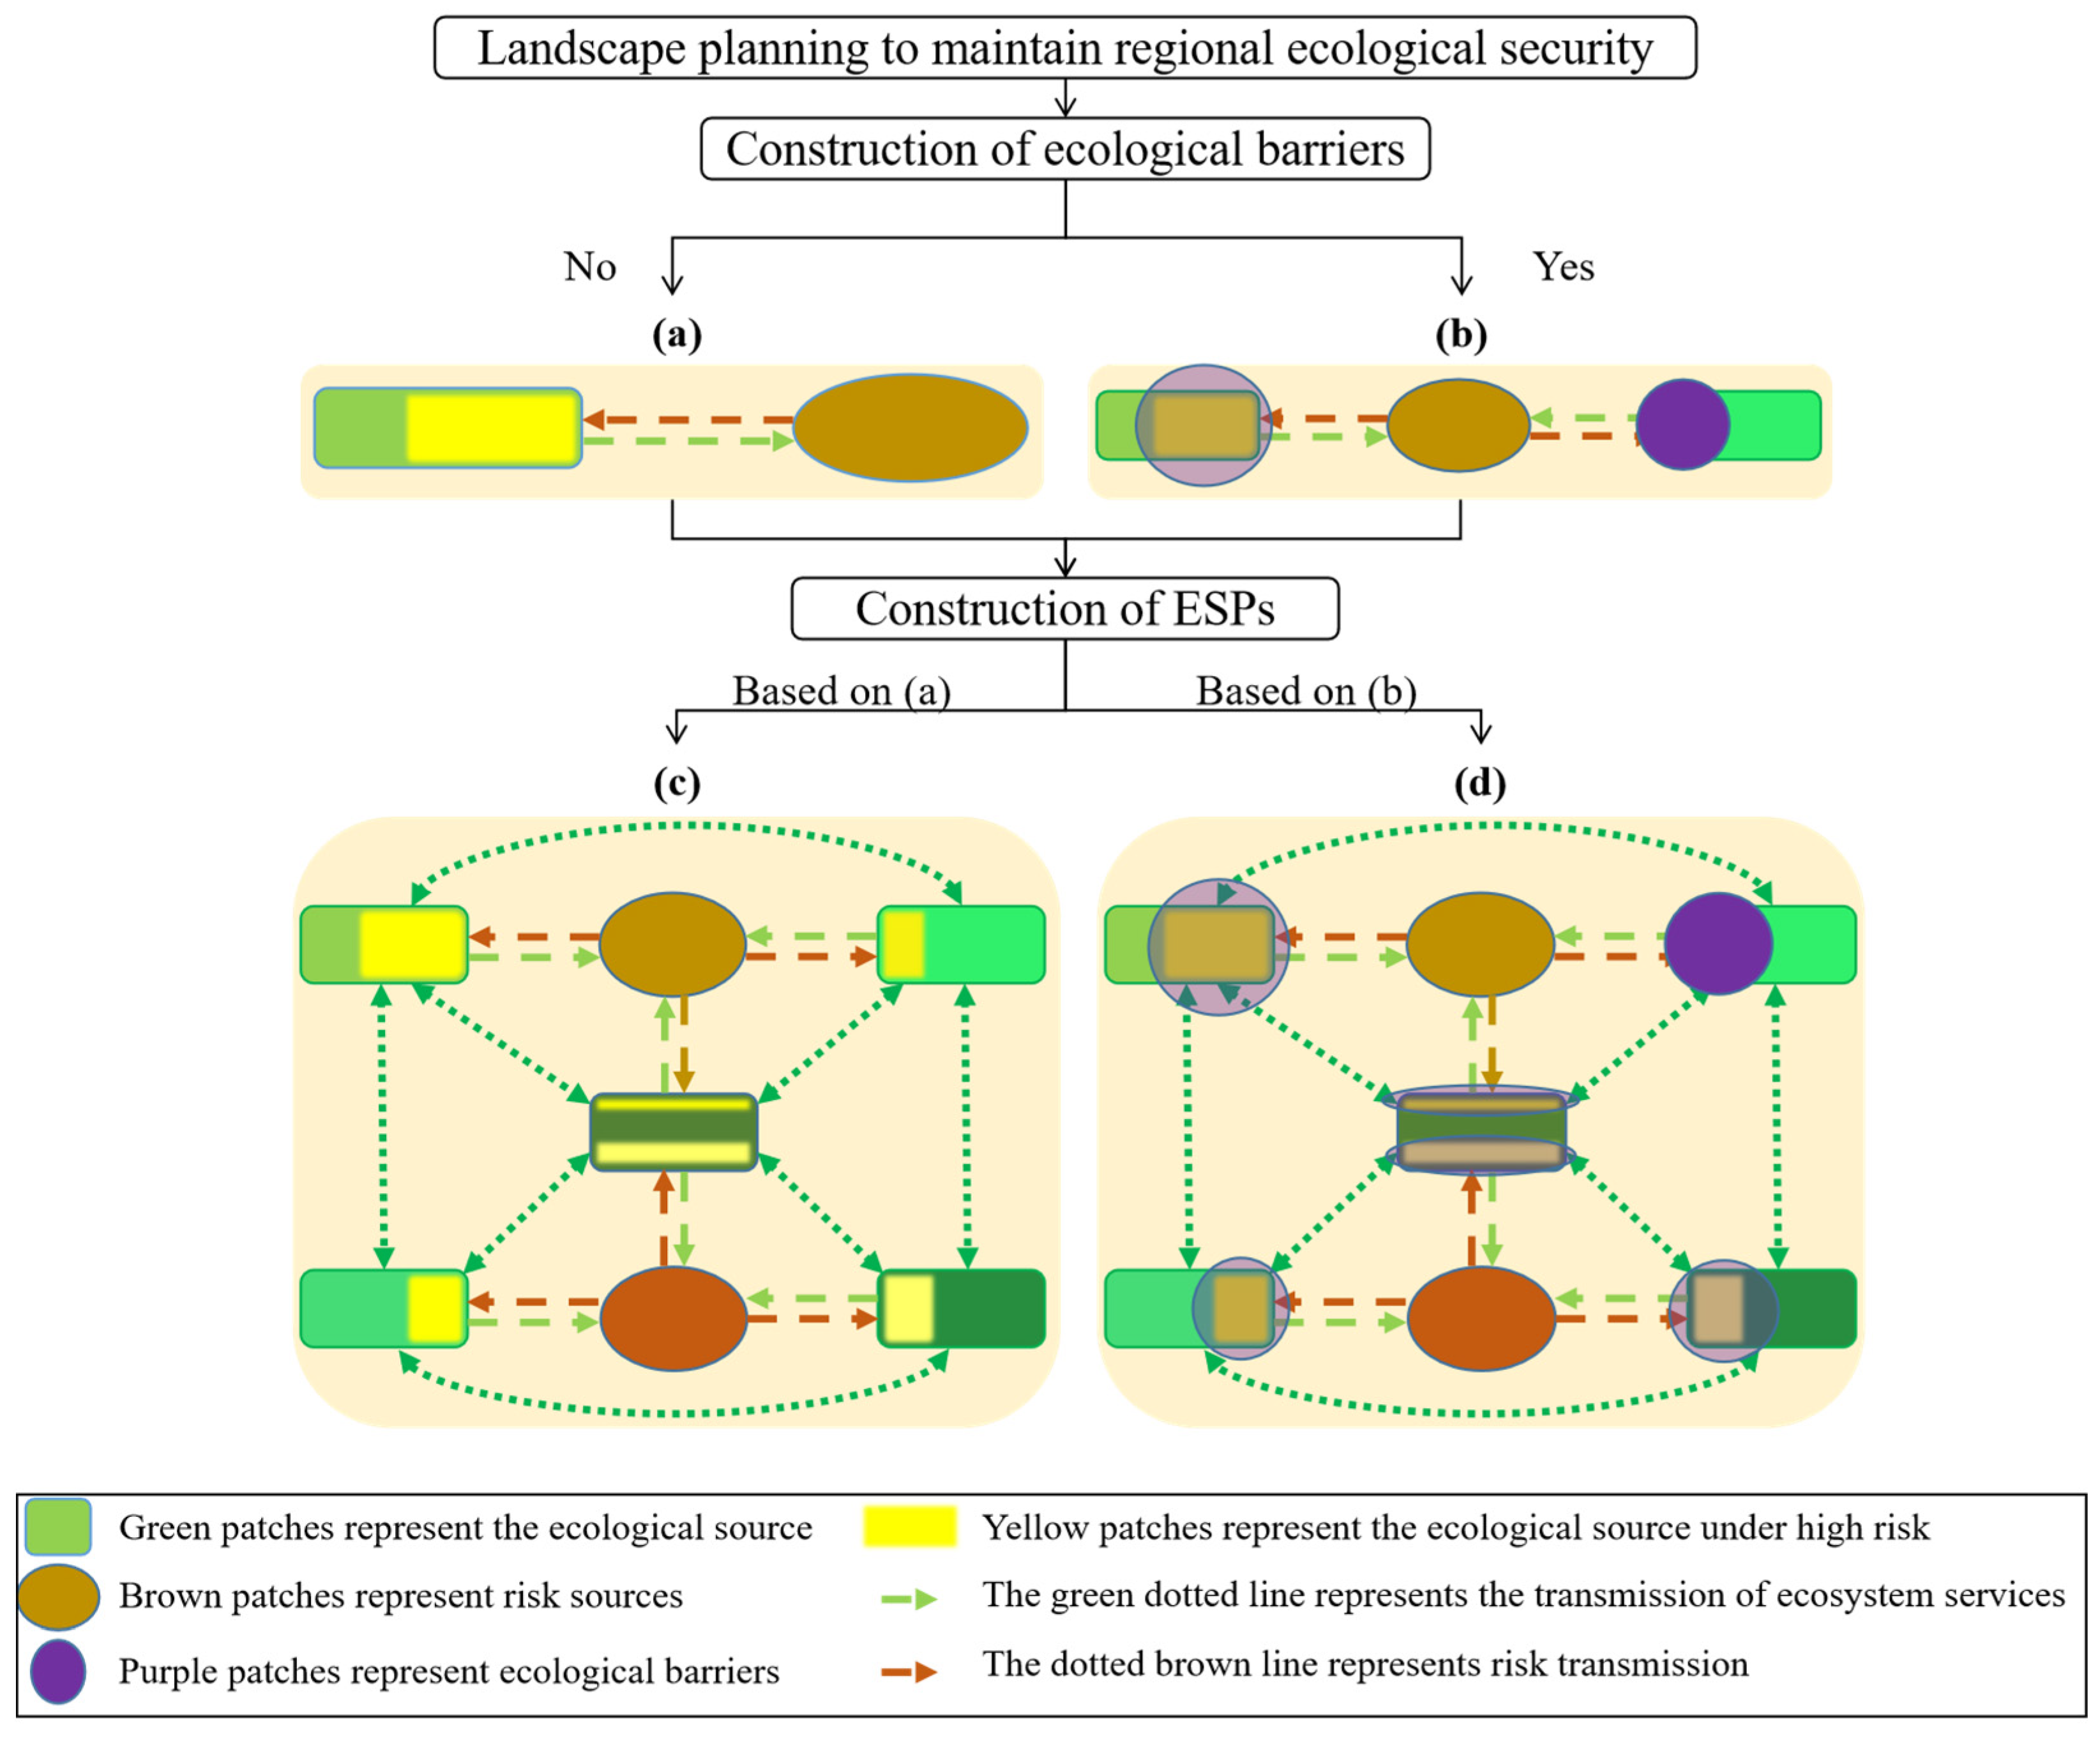
2.3.1. Integrated Framework

This study devised an idea for delineating the scope of the regional ecological barriers and proposes a specific method for optimizing the ESPs. Firstly, the habitat quality of terrestrial ecosystems in Bohai Bay was assessed through the habitat quality module in the InVEST model, and areas with high habitat quality were selected as ecological sources. Using the habitat risk assessment model, the ecological sources were assessed for the risk of degradation caused by human activities. Ecological sources with high risk ratings were defined as areas where ecological barriers should be constructed. The ecological sources and ecological barriers were together referred to as ecological service supply areas. The ESPs of the Bohai Bay land area were then constructed based on the paradigm of “ecological sources—ecological barriers—resistance surface construction—ecological corridor extraction”. This resulted in ESPs based on ESs and ecosystem risks. The research idea is shown in Figure 2 below.

2.3.2. Identifying Ecological Barriers

The Habitat Quality (HQ) model assesses the ESs of an ecosystem and is expressed as the magnitude of the Habitat Quality Index. Habitat quality is calculated as follows:
Q x j = H j ( 1 ( D x j z D x j z + k z ) )
where Qxj is the habitat quality of raster x in land use type j; H is the habitat suitability of land use type j; Dxj is the degree of habitat degradation of raster x in land use type j; z is the normalization constant and takes the value of 2.5, k is the half-saturation constant, and the default value is 0.5.
D x j = r = 1 R y = 1 Y r ( w r r = 1 R w r ) r y i r x y β x S j r
where R denotes the number of threat factors; r is the threat factor of the habitat; Yr denotes the number of rasters on the r threat factor layer; wr denotes the weight of the threat factor; ry denotes the level of influence of the threat factor on habitat y, taking values between 0 and 1; irxy denotes the influence of the habitat with threat factor r in raster x on raster y; βx denotes the approachable level of raster x; Sjr denotes the land use sensitivity of type j to threat factor r.
i r x y = 1 ( d x y d r m a x ) if   linear
i r x y = e x p ( ( 2.99 d r m a x ) d x y ) if   exponential
where dxy is the linear distance between raster x and y; drmax is the maximum action distance of threat r.
In this paper, on the basis of the InVEST model manual and related studies [44,45], the threat factors and threat factor sensitivities were assigned with reference to the economic and social development of the study area, as shown in Table 1 and Table 2.
The degree of risk to ecosystems due to human activities is another important basis for identifying ecological barriers in this study. The Habitat Risk Assessment (HRA) model can be used to assess the risk to ecosystems from human activities and defines risk as the potential for human activities to reduce habitat quality and thus damage ecosystem services [46].
In this study, two indicators, exposure and consequence, were selected for the ecological risk assessment of the terrestrial ecosystem in Bohai Bay, with reference to the index requirements of the HRA model and related studies [16,19,47]. Exposure refers to the extent to which the ecological service supply area is exposed to human activities and is divided into three indicators: the spatial superposition of the ecological service supply area and human activities, the frequency of human activities, and the intensity of disturbance. Consequence refers to the sensitivity of the ecological service supply area to human activities and includes three indicators: habitat heterogeneity, management effectiveness, and habitat loss. Habitat heterogeneity refers to the strength of ESs provided by the ecological service areas, as shown in Table 3.
The specific calculation process for habitat risk is as follows:
R i j = E × C
R i j = ( E 1 ) 2 + ( C 1 ) 2
where Rij denotes the risk to habitat i caused by pressure j, E denotes exposure, and C denotes consequence. The scores for total exposure E and total consequence C are the weighted average of the exposure value ei and consequence value ci for each evaluation indicator i. Each evaluation indicator in this study is equally weighted.
E = i = 1 N e i d i × w i i = 1 N 1 d i × w i    C = i = 1 N c i d i × w i i = 1 N 1 d i × w i
where di represents the data quality score for indicator i, wi represents the importance weight of indicator i, and N represents the number of indicators used to evaluate each habitat.
Finally, the model calculates the cumulative risk to the habitat for all pressures, with the cumulative risk to habitat i being the sum of the risk scores under the influence of each pressure.
R i = j = 1 J R i j
where Ri represents the cumulative risk to habitat i, J represents the number of pressures, and Rij represents the risk to habitat i caused by pressure j.
The identification of ecological barriers was mainly done with the help of ArcGIS extraction analysis tools, and the areas with high habitat quality were independently extracted and defined as ecological sources. Afterward, the areas with median habitat risk and above in the study area were overlaid with the ecological service supply areas to obtain the specific extent of the ecological barriers.

2.3.3. ESP Construction

The study used the Minimum Cumulative Resistance (MCR) model to construct a resistance surface for terrestrial ecosystems in Bohai Bay. The model requires consideration of three factors: the source of ecological service supply, distance, and landscape basal characteristics [48]. The source is the starting point for the outward diffusion of ecological services in the MCR model, with internal homogeneity and the ability to expand or attract in all directions, which in this study refers to the ES supply areas. The basic equation of the MCR model is as follows:
MCR = f j = n i = m ( D i j × R i )
where f represents the positive correlation between the minimum resistance at any point in space and its distance to all sources and the basal characteristics of the landscape. Dij is the spatial distance from source j across a landscape i to a point; Ri is the cumulative resistance that needs to be overcome for the landscape i to extend to the source.
By assigning a value to the degree of vegetation cover for different land use types, the higher the value, the higher the cost of crossing the patch. Referring to previous studies and taking into account the actual situation in Bohai Bay [49,50,51], the resistance values were set as shown in Table 4.
Ecological corridors ensure the exchange of information, energy, and organisms between ecological sources and are an effective way to maintain the continuity of ecological functions and guarantee regional ESPs [52]. The two ends of the ecological corridor are connected to different ecological sources. To make the ecological corridor extraction more accurate, we used the ArcGIS Find Geometric Center tool to convert the faceted ecological sources into point elements (geometric centers of ecological sources). Based on the construction of the minimum cumulative resistance surface, the ecological corridor was extracted by using the ArcGIS minimum cost path analysis tool. This tool identified a potential path of ecosystem service delivery between ecological sources by calculating the cumulative minimum value of the cumulative cost generated by the different resistance of ecological sources through the landscape. The important ecological corridor transmits the ecological services of more than three ecological sources, and the common ecological corridor transmits the ecological services between two ecological sources. Based on the ecological corridor network, the intersections of the ecological corridors were defined as ecological strategic nodes using the element editing function of ArcGIS.

3. Results

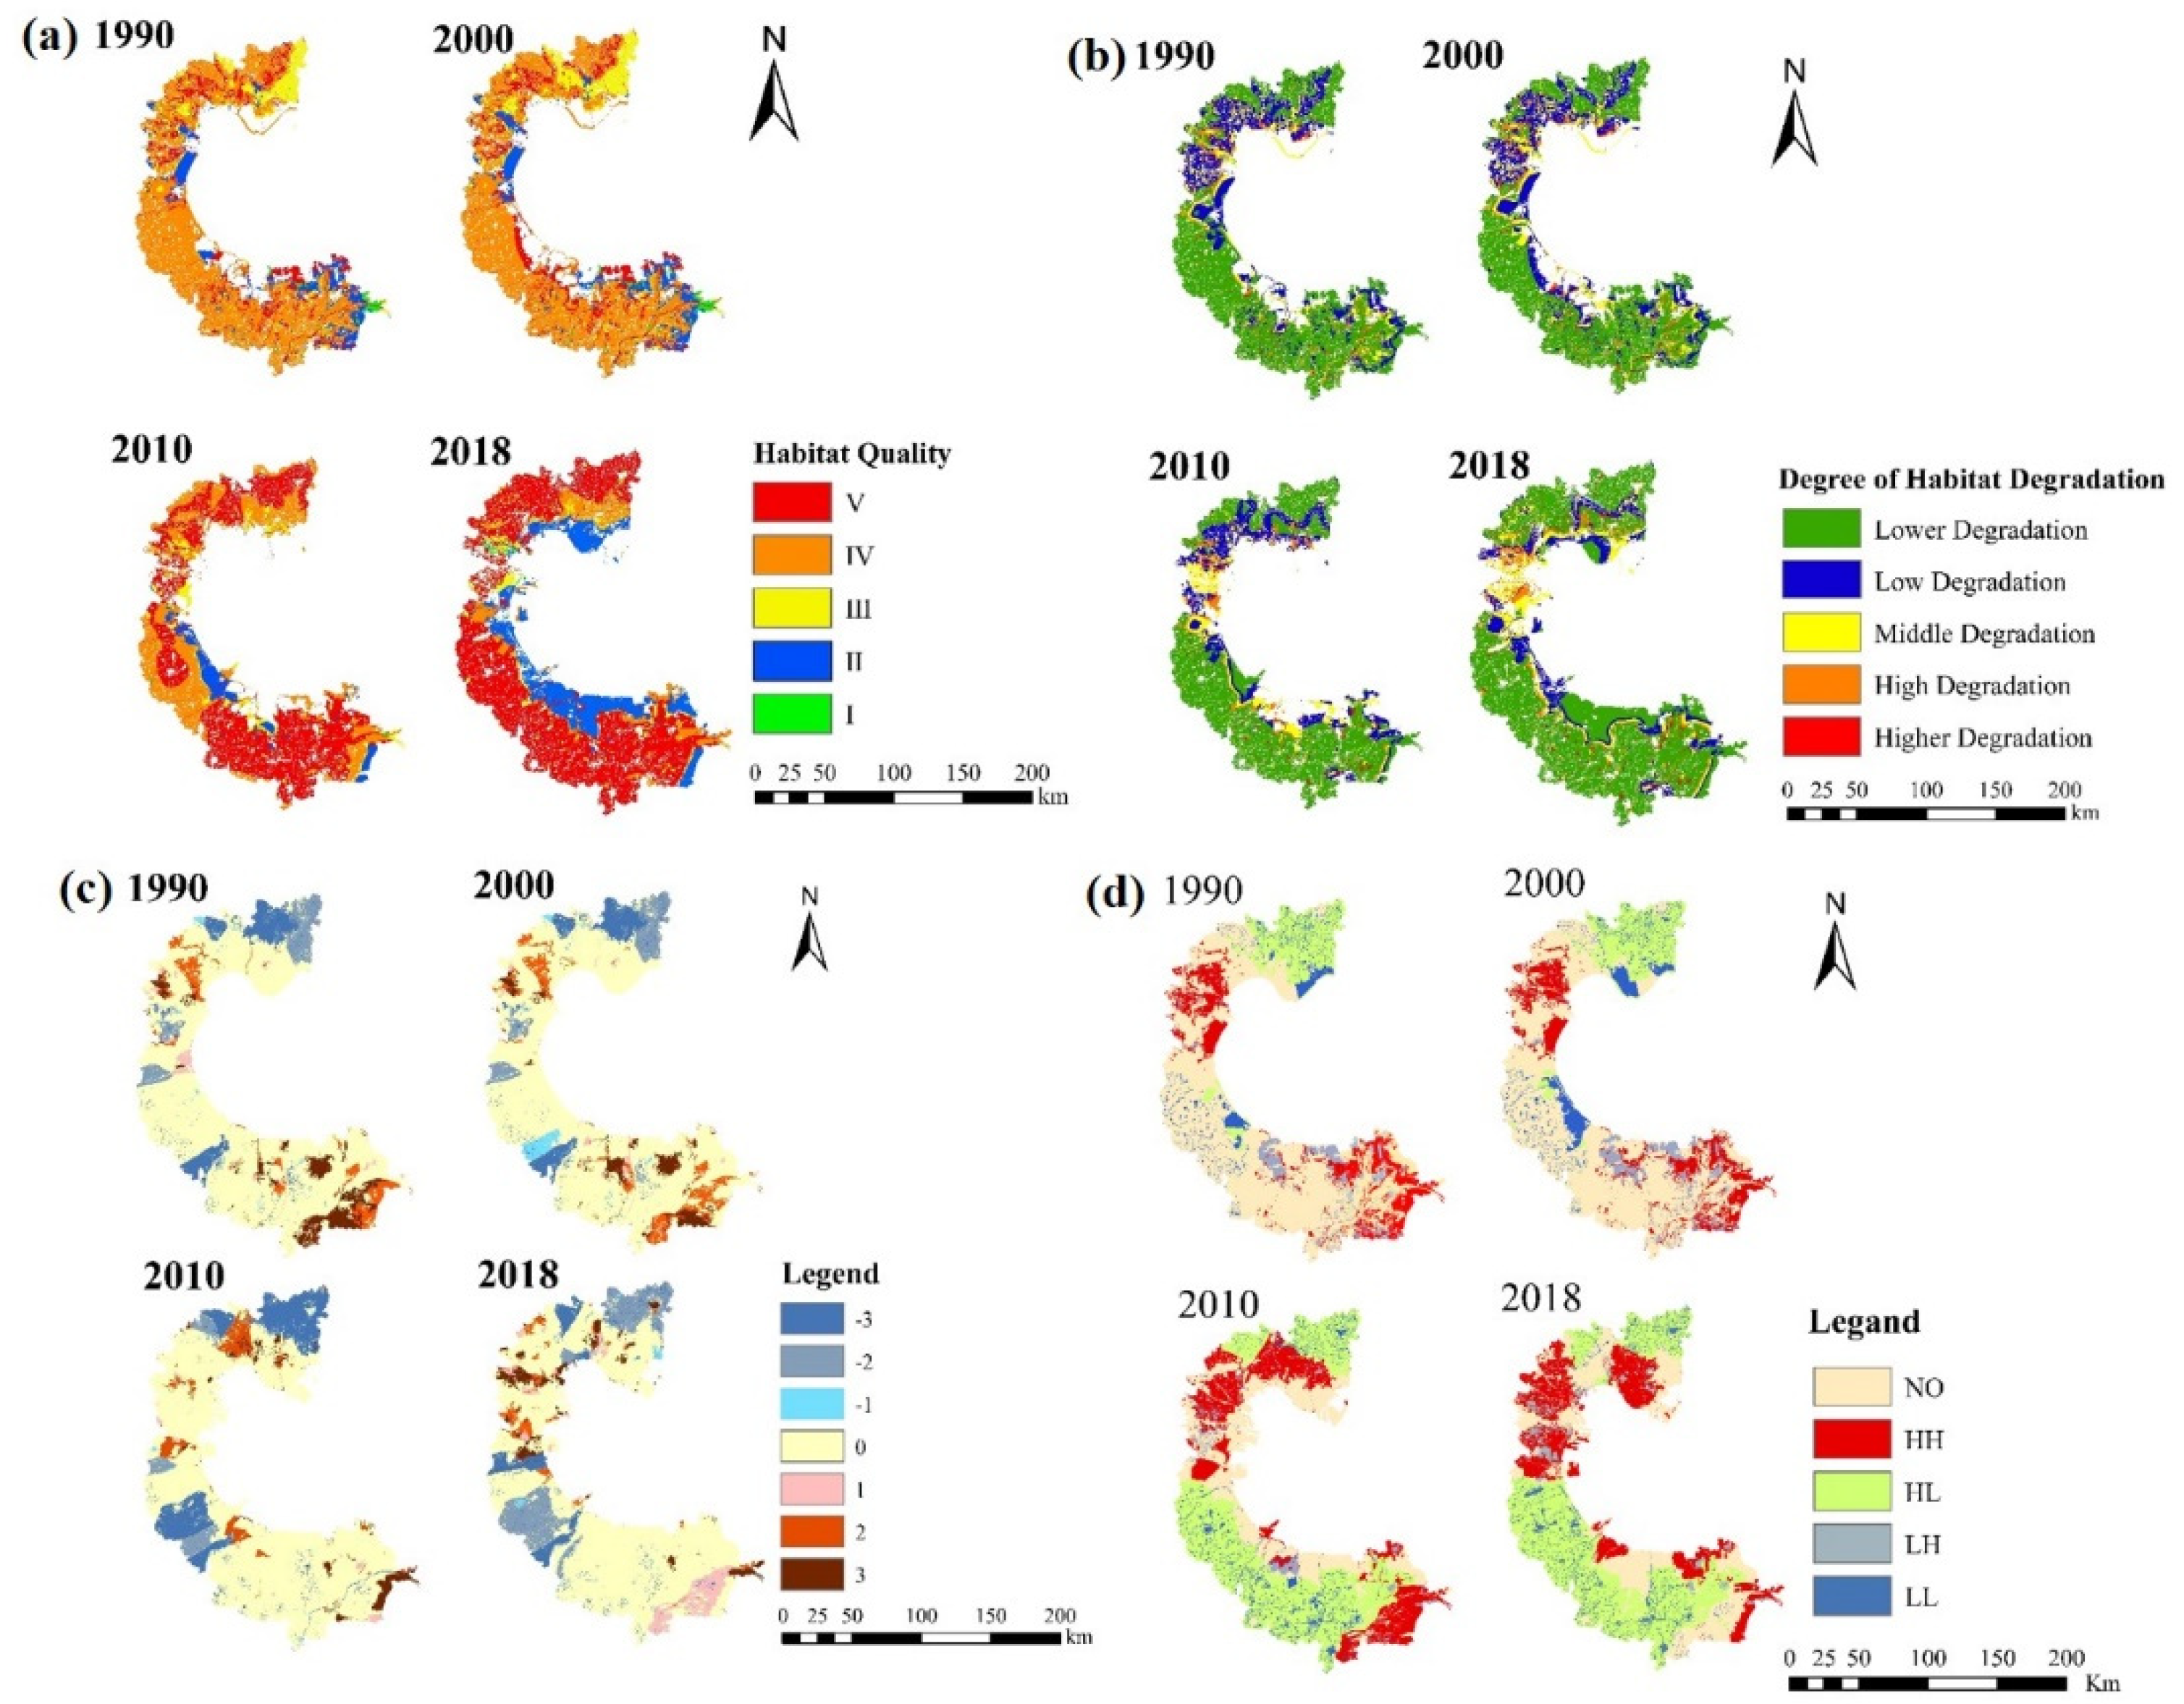
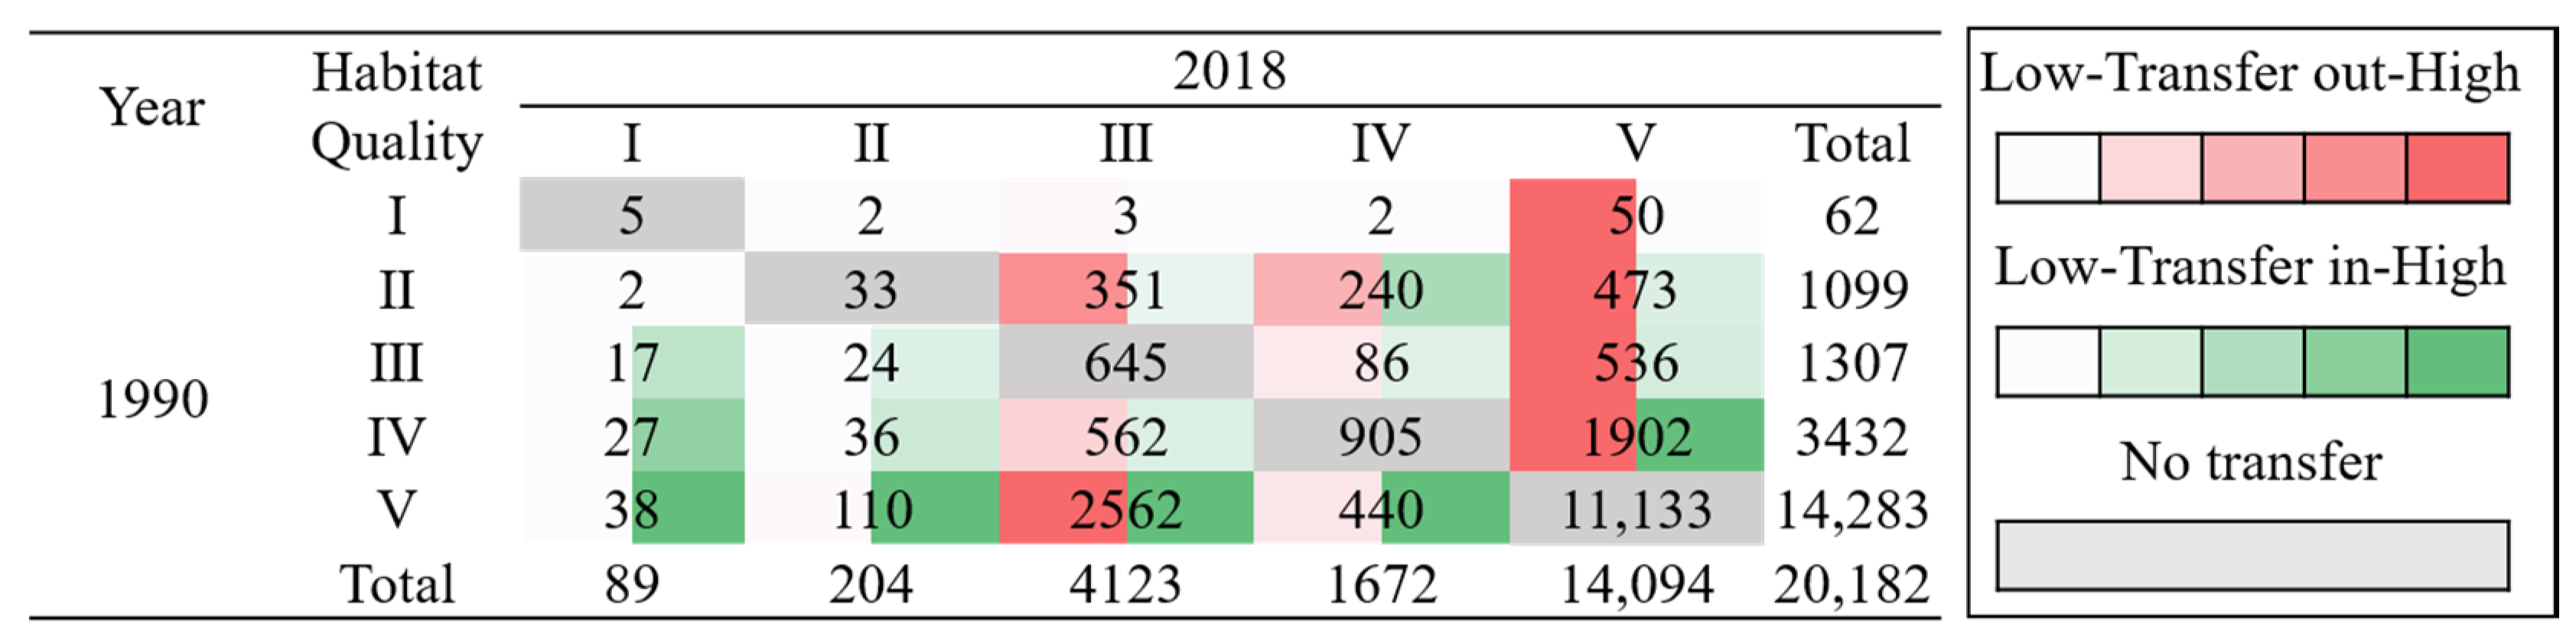
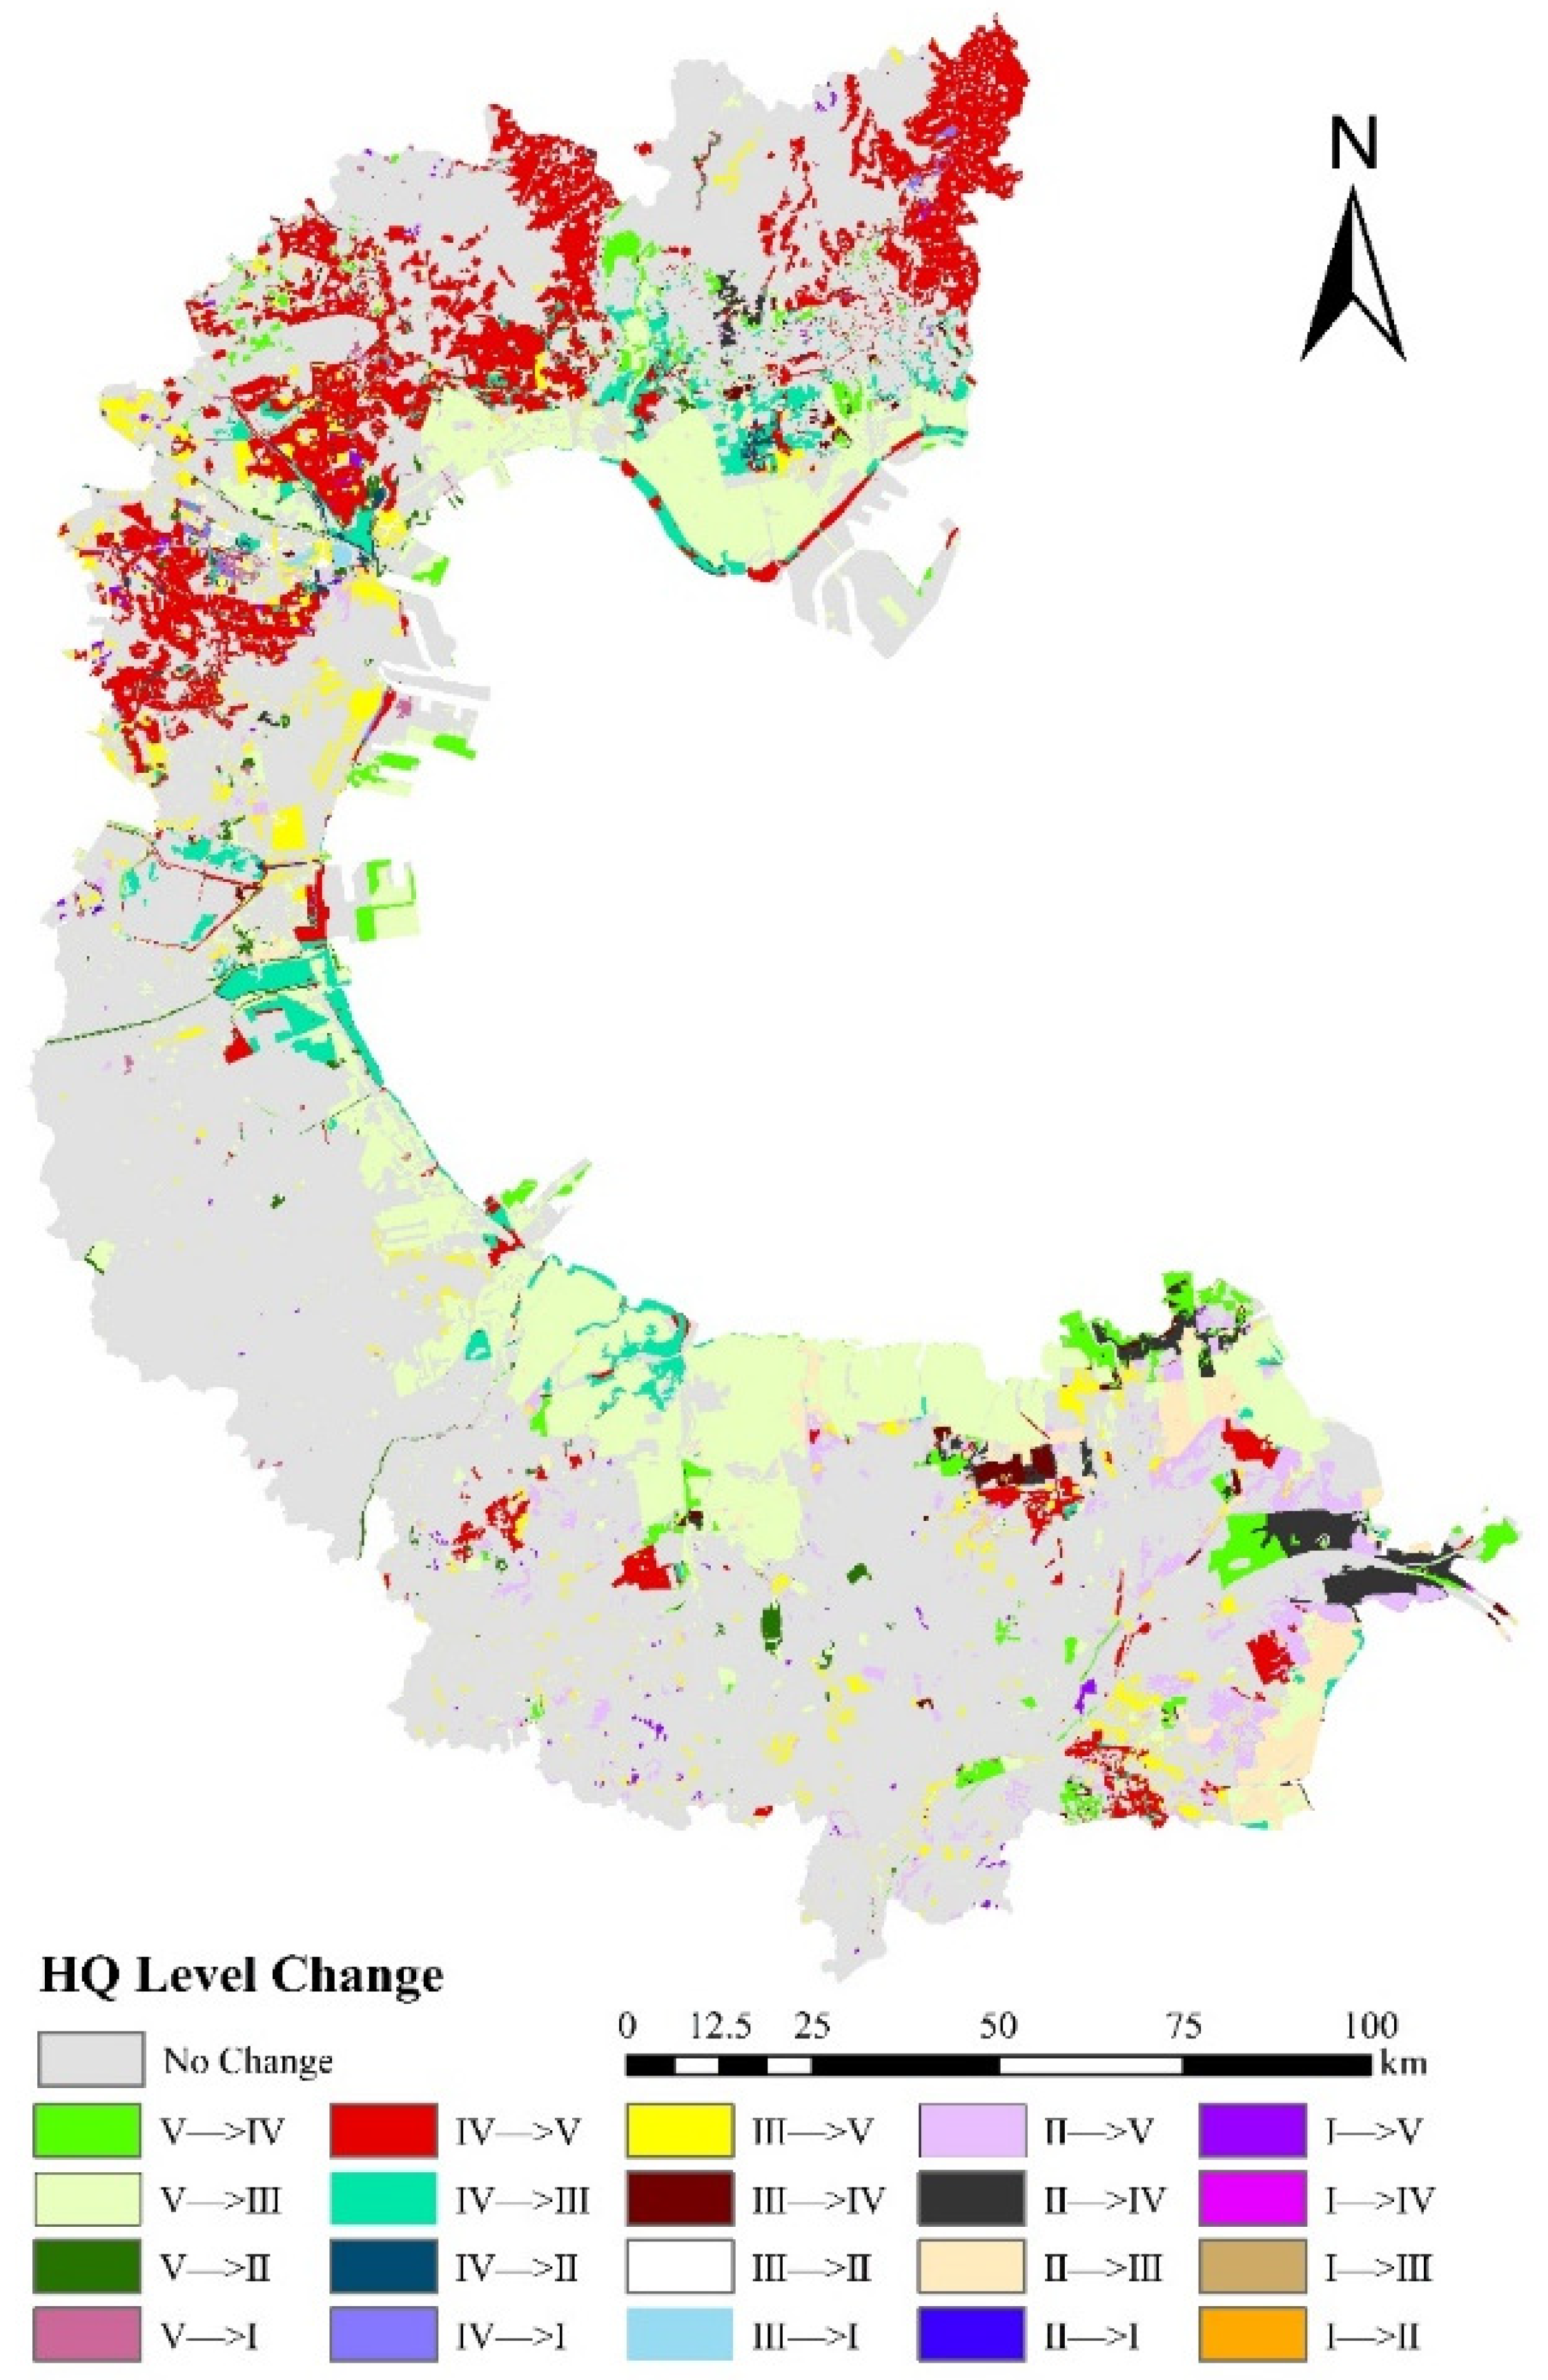
3.1. Habitat Quality in the Terrestrial Ecosystem of Bohai Bay

The habitat quality of terrestrial ecosystems in Bohai Bay was assessed based on the habitat quality module of the InVEST model, and the spatial and temporal evolution patterns of habitat quality and habitat degradation in the study area were investigated, as shown in Figure 3a,b. In general, from 1990 to 2018, the mean value of habitat quality in the study area was 0.2901, and the overall habitat quality was at a low level [53,54,55]. In the three time periods of 1990–2000, 2000–2010, and 2010–2018, habitat quality showed a small increase in the 1990–2000 period, a small increase in the 2000–2010, and 2010–2018 showed a large decrease and a large increase, with the opposite changes in the degree of habitat degradation. The change between habitat quality classes was particularly pronounced from 2000–2010, with large areas of the class IV habitat transforming into class V habitat during this decade. Over the past three decades, the degree of habitat degradation of the terrestrial ecosystem in Bohai Bay has increased by 14.59%, and the increase rate from 1990 to 2010 is low. The high-value area of habitat degradation of the terrestrial ecosystem in Bohai Bay is scattered, mostly concentrated in the south of the study area. The high degradation area is mainly concentrated in the middle of the study area, distributed around urban construction land, and the medium degradation area is distributed in a belt around Bohai Bay, mainly between cultivated land and offshore coast. The reason for such distribution is related to the distribution of land use types. Urban construction land and other construction land are mainly distributed in the middle of the study area; rural residential areas are scattered in the whole study area, and cultivated land is mainly distributed around rural residential areas. These areas have frequent human activities and strong environmental disturbance. Therefore, the degree of habitat degradation around these areas is relatively high, and the habitat quality is relatively low.
In terms of time scale, the mean values of habitat quality in the Bohai Bay terrestrial ecosystem in 1990, 2000, 2010, and 2018 were 0.2931, 0.2943, 0.2685, and 0.3045, respectively, indicating that the habitat quality of the terrestrial ecosystem in Bohai Bay is improving. On a spatial scale, the overall habitat quality of the terrestrial ecosystem in Bohai Bay is roughly distributed as high in the east and low in the west. Habitat quality in Bohai Bay was classified from high to low in categories I–V, with category I habitat quality being the highest and category V habitat quality the lowest, as shown in Figure 3a and Table 5. Specifically, the area of habitat quality category I only accounts for 0.4% of the total area of the region and is scattered in forested areas, such as forest nature reserves. Habitat quality category II areas are mainly located in the eastern part of the study area, along the coast of Bohai Bay, where the land use types are mainly near-coastal wetlands and lakes and reservoirs, including many wetland nature reserves, such as the Yellow River Delta, which are very rich in species diversity. Habitat quality category III areas are scattered throughout the study area, with concentrations in the northeast and central parts, where the land use types are mainly lakes, rivers, and grasslands, with high species diversity. Areas in habitat quality category IV, the largest of all categories, are scattered throughout the study area, with land use types dominated by arable land and rural residential land and heavily influenced by human disturbance, with serious damage to ecological modification and poor species diversity. Habitat quality category V is mainly concentrated in the central and northeastern parts of the study area and is also scattered throughout the study area. The land use types in this area are mainly urban construction land and other construction land, with frequent human activities, strong disturbance, low species diversity, and poor habitat quality.
During the period 1990–2018, there were certain trends in the changes of habitat quality classes in the terrestrial ecosystem of Bohai Bay, as shown in Table 5. In general, the area of categories V and category II habitats in the study area increased by 333.28% and 103.88%, respectively, while the area of category I, category III, and category IV habitats decreased by 56.48%, 33.90%, and 83.09%, respectively. In terms of trends, the area of category I, category III, and category IV habitats showed an overall decreasing trend, while the area of category V and category II habitats showed an overall increasing trend, and the area of category V habitat increased significantly. This indicates that the quality of habitats in the study area is decreasing and polarizing. Figure 4 expresses the transfer into and out of the habitat area of each category, and the horizontal part of the figure represents the transfer out of each category of habitat, and the vertical part represents the transfer into each category of the habitat area. The red and green colors indicate the size of the transfer out and transfer into, respectively, and the larger the amount, the darker the color. The area transferred out of each category of habitat quality in Bohai Bay was ranked from largest to smallest: V > IV > II > III > I. The transferred area of each category of habitat quality in Bohai Bay was ranked from largest to smallest: III > V > IV > II > I. Figure 5 shows the spatial distribution of the transformation of habitat quality category. In the north of Bohai Bay and most coastal areas, the transformation of habitat quality category is relatively frequent. The habitat quality in the northern part of Bohai Bay has deteriorated significantly, while the habitat quality in the southern coastal area has improved.
In this study, Global Moran’s I cluster analysis and hotspot analysis were used to further investigate the spatial distribution characteristics and patterns of habitat quality in the terrestrial ecosystems of Bohai Bay. The Global Moran’s I was used to describe the average degree of association of all spatial units with the surrounding area over the entire region. Moran’s I > 0 indicates a spatial positive correlation. The larger its value, the more obvious the spatial correlation. Moran’s I < 0 indicates spatial negative correlation. The smaller its value, the greater the spatial difference. Otherwise, Moran’s I = 0, and the space is random. This paper used hotspot analysis to identify the spatial location and area changes of high and low habitat quality in Bohai Bay. In Figure 3c, +3 and −3 represent high-value aggregation and low-value aggregation with 99% confidence in this region, respectively, and +2 and −2 represent high-value aggregation and low-value aggregation with 95% confidence in this area, respectively, and +1 and −1 represent high-value aggregation and low-value aggregation with 90% confidence in this area, respectively; 0 represents the regional habitat quality, and the aggregation phenomenon of high value or low value is not obvious. Cluster analysis can be used to analyze the spatial aggregation characteristics of a set of elements. In this study, it was used to analyze the spatial aggregation of high-value and low-value areas of habitat quality in Bohai Bay. In Figure 3d, HH represents habitat quality high-value aggregation areas, and the habitat quality in this area is stable; LL represents habitat quality low-value aggregation areas, and the habitat quality in this area is stable; HL represents the area with high values of habitat quality mainly surrounded by low values, and habitat quality in this region varies significantly; LH represents the area where the low value of habitat quality is mainly surrounded by high values, and habitat quality in this region varies significantly.
According to the spatial autocorrelation analysis of habitat quality, there is some spatial correlation in the distribution of habitat quality in the study area. The Moran’s I increased from 0.0816 in 1990 to 0.1663 in 2018, an increase of 103.80%, which indicates a certain spatial correlation and an increasing trend in the correlation of habitat quality in Bohai Bay, as shown in Table 6. Based on the cluster analysis, the spatial distribution of high habitat quality areas and low habitat quality areas in Bohai Bay can be understood. The proportion of the area of HL and LH areas of terrestrial ecosystem habitat quality in Bohai Bay to the total study area increased significantly in 1990, 2000, 2010, and 2018, with 18.98%, 19.78%, 45.28%, and 45.49%, respectively, which indicates that the mutual conversion between high and low habitat quality areas in Bohai Bay has increased in the last three decades. Based on the habitat quality hotspot analysis from 1990 to 2018, the proportion of cold spot area to the total area of the study area increased from 14.91% to 19.57%, and the proportion of hotspot area to the total area of the study area decreased from 14.48% to 13.31%, which indicates that the area of high habitat quality in the study area is shrinking, while the area of low habitat quality is continuously spreading showing aggregated distribution.

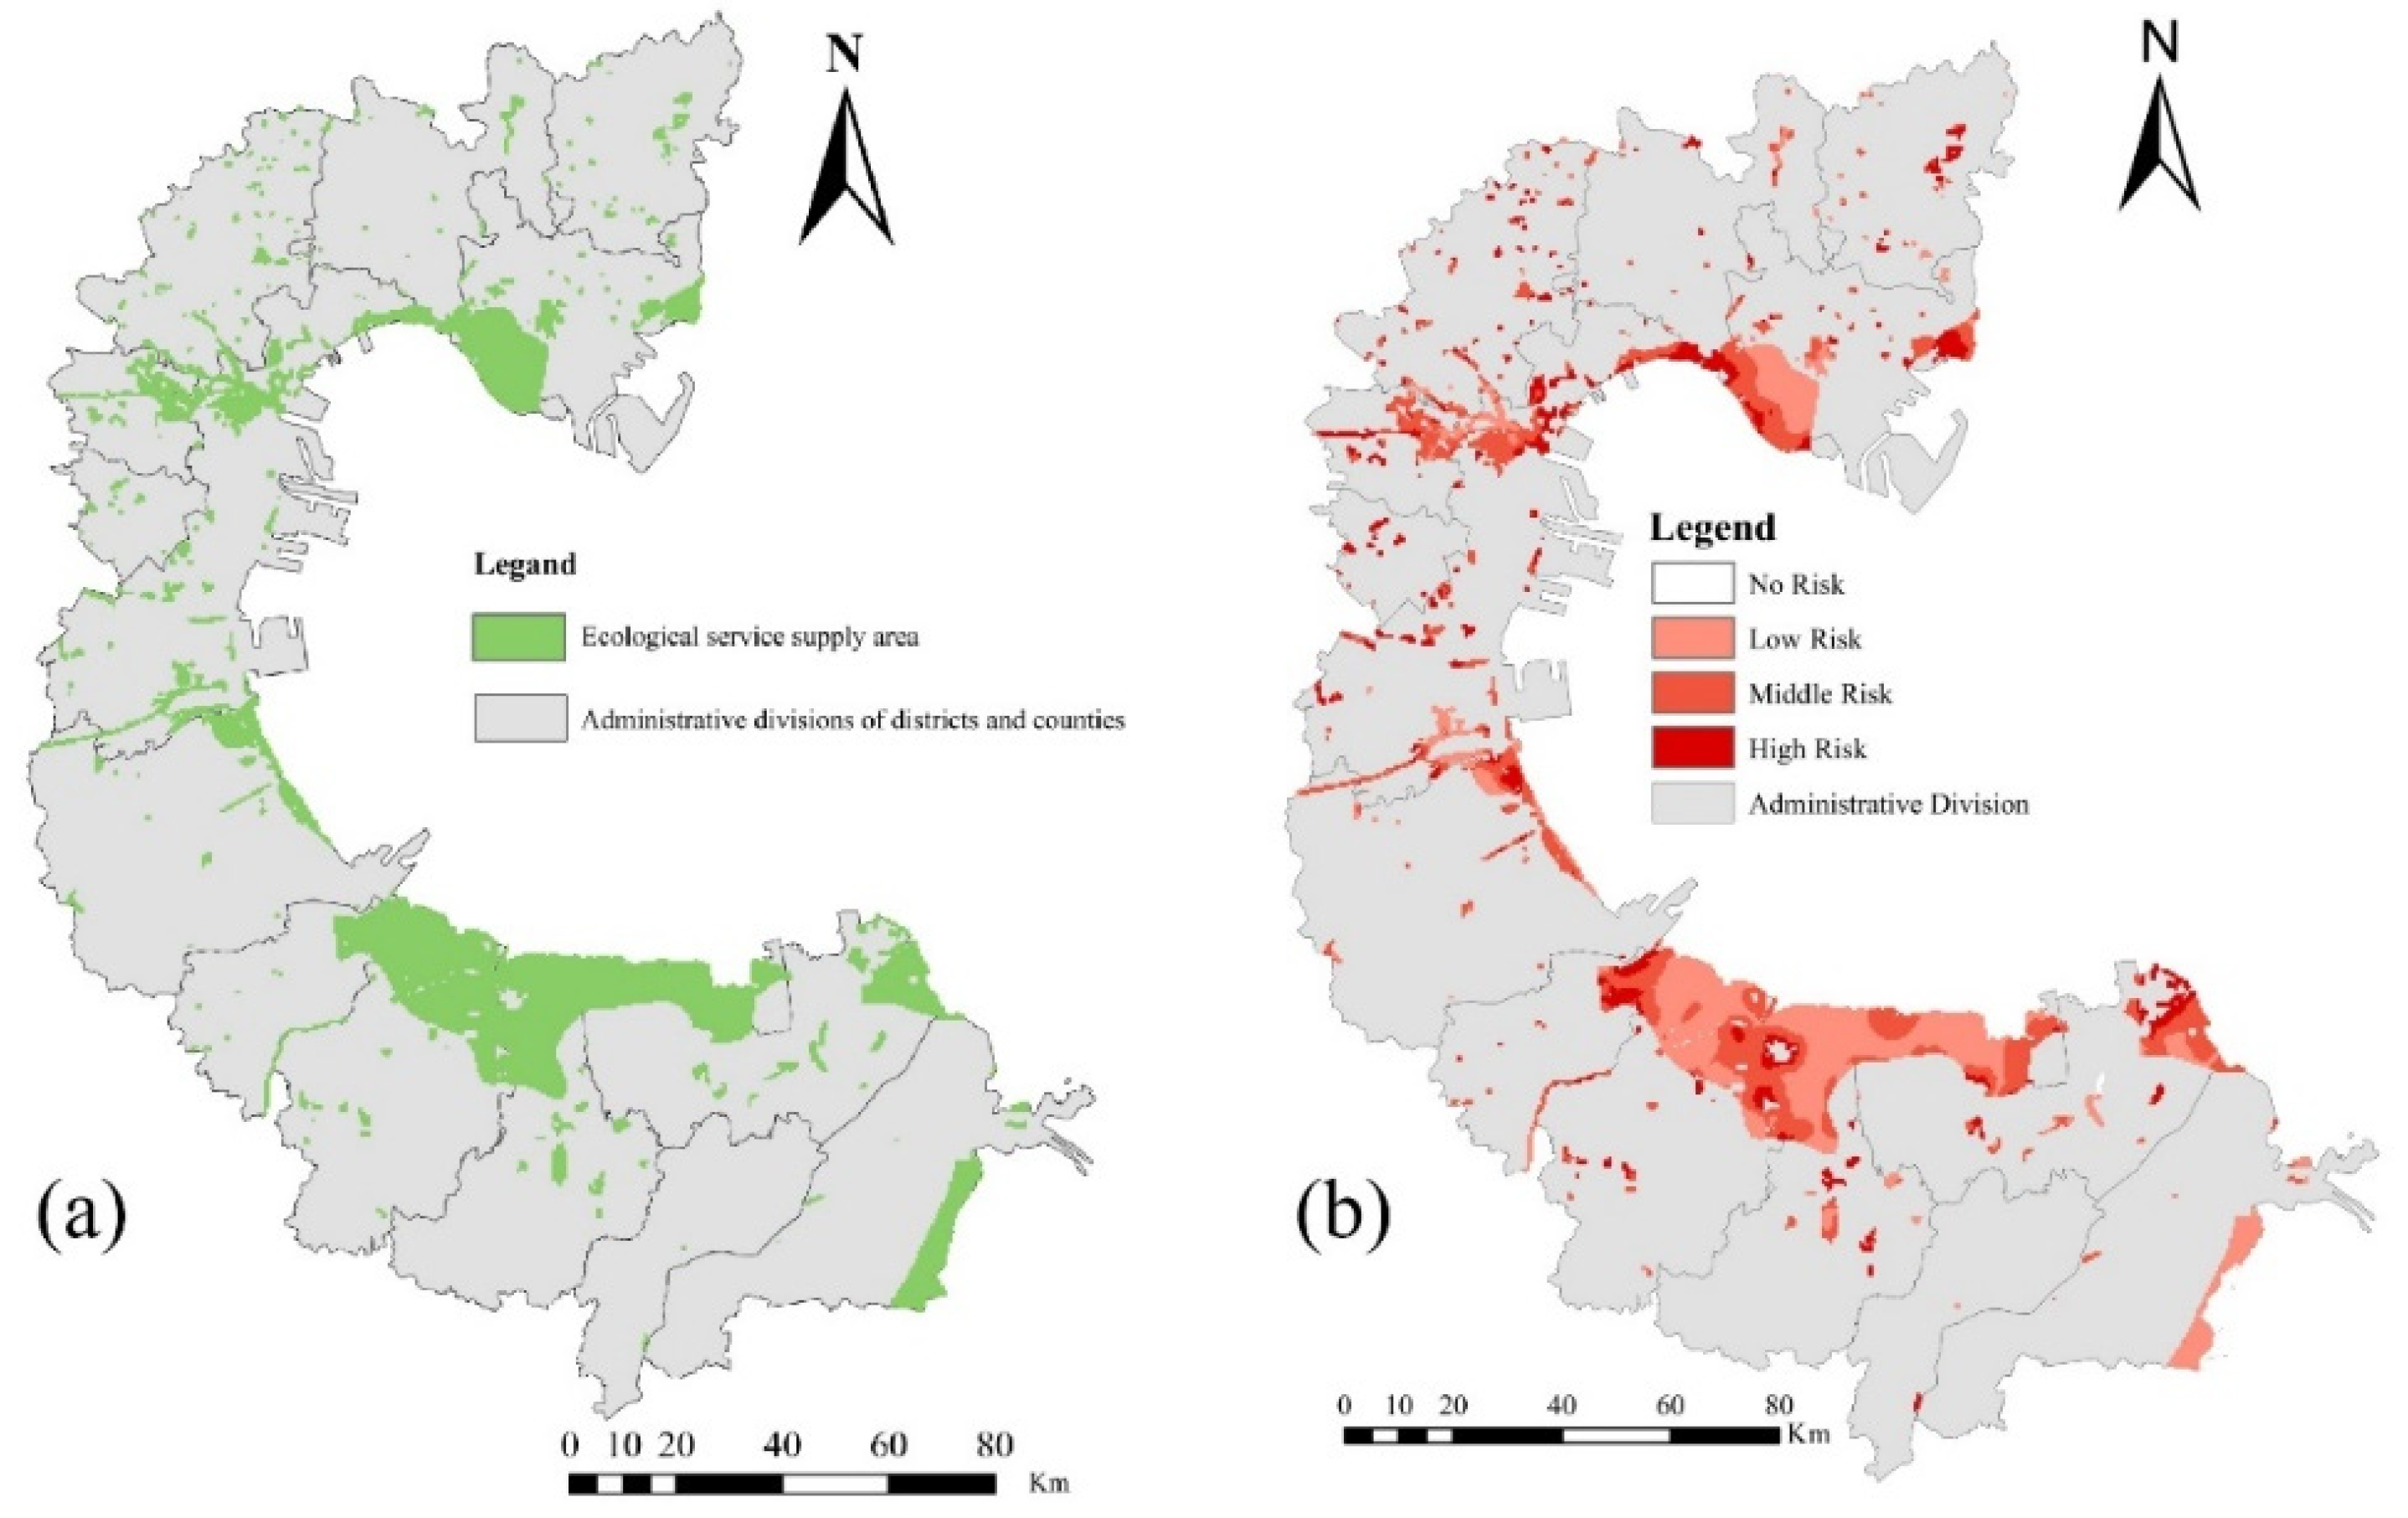
3.2. Habitat Risk Assessment

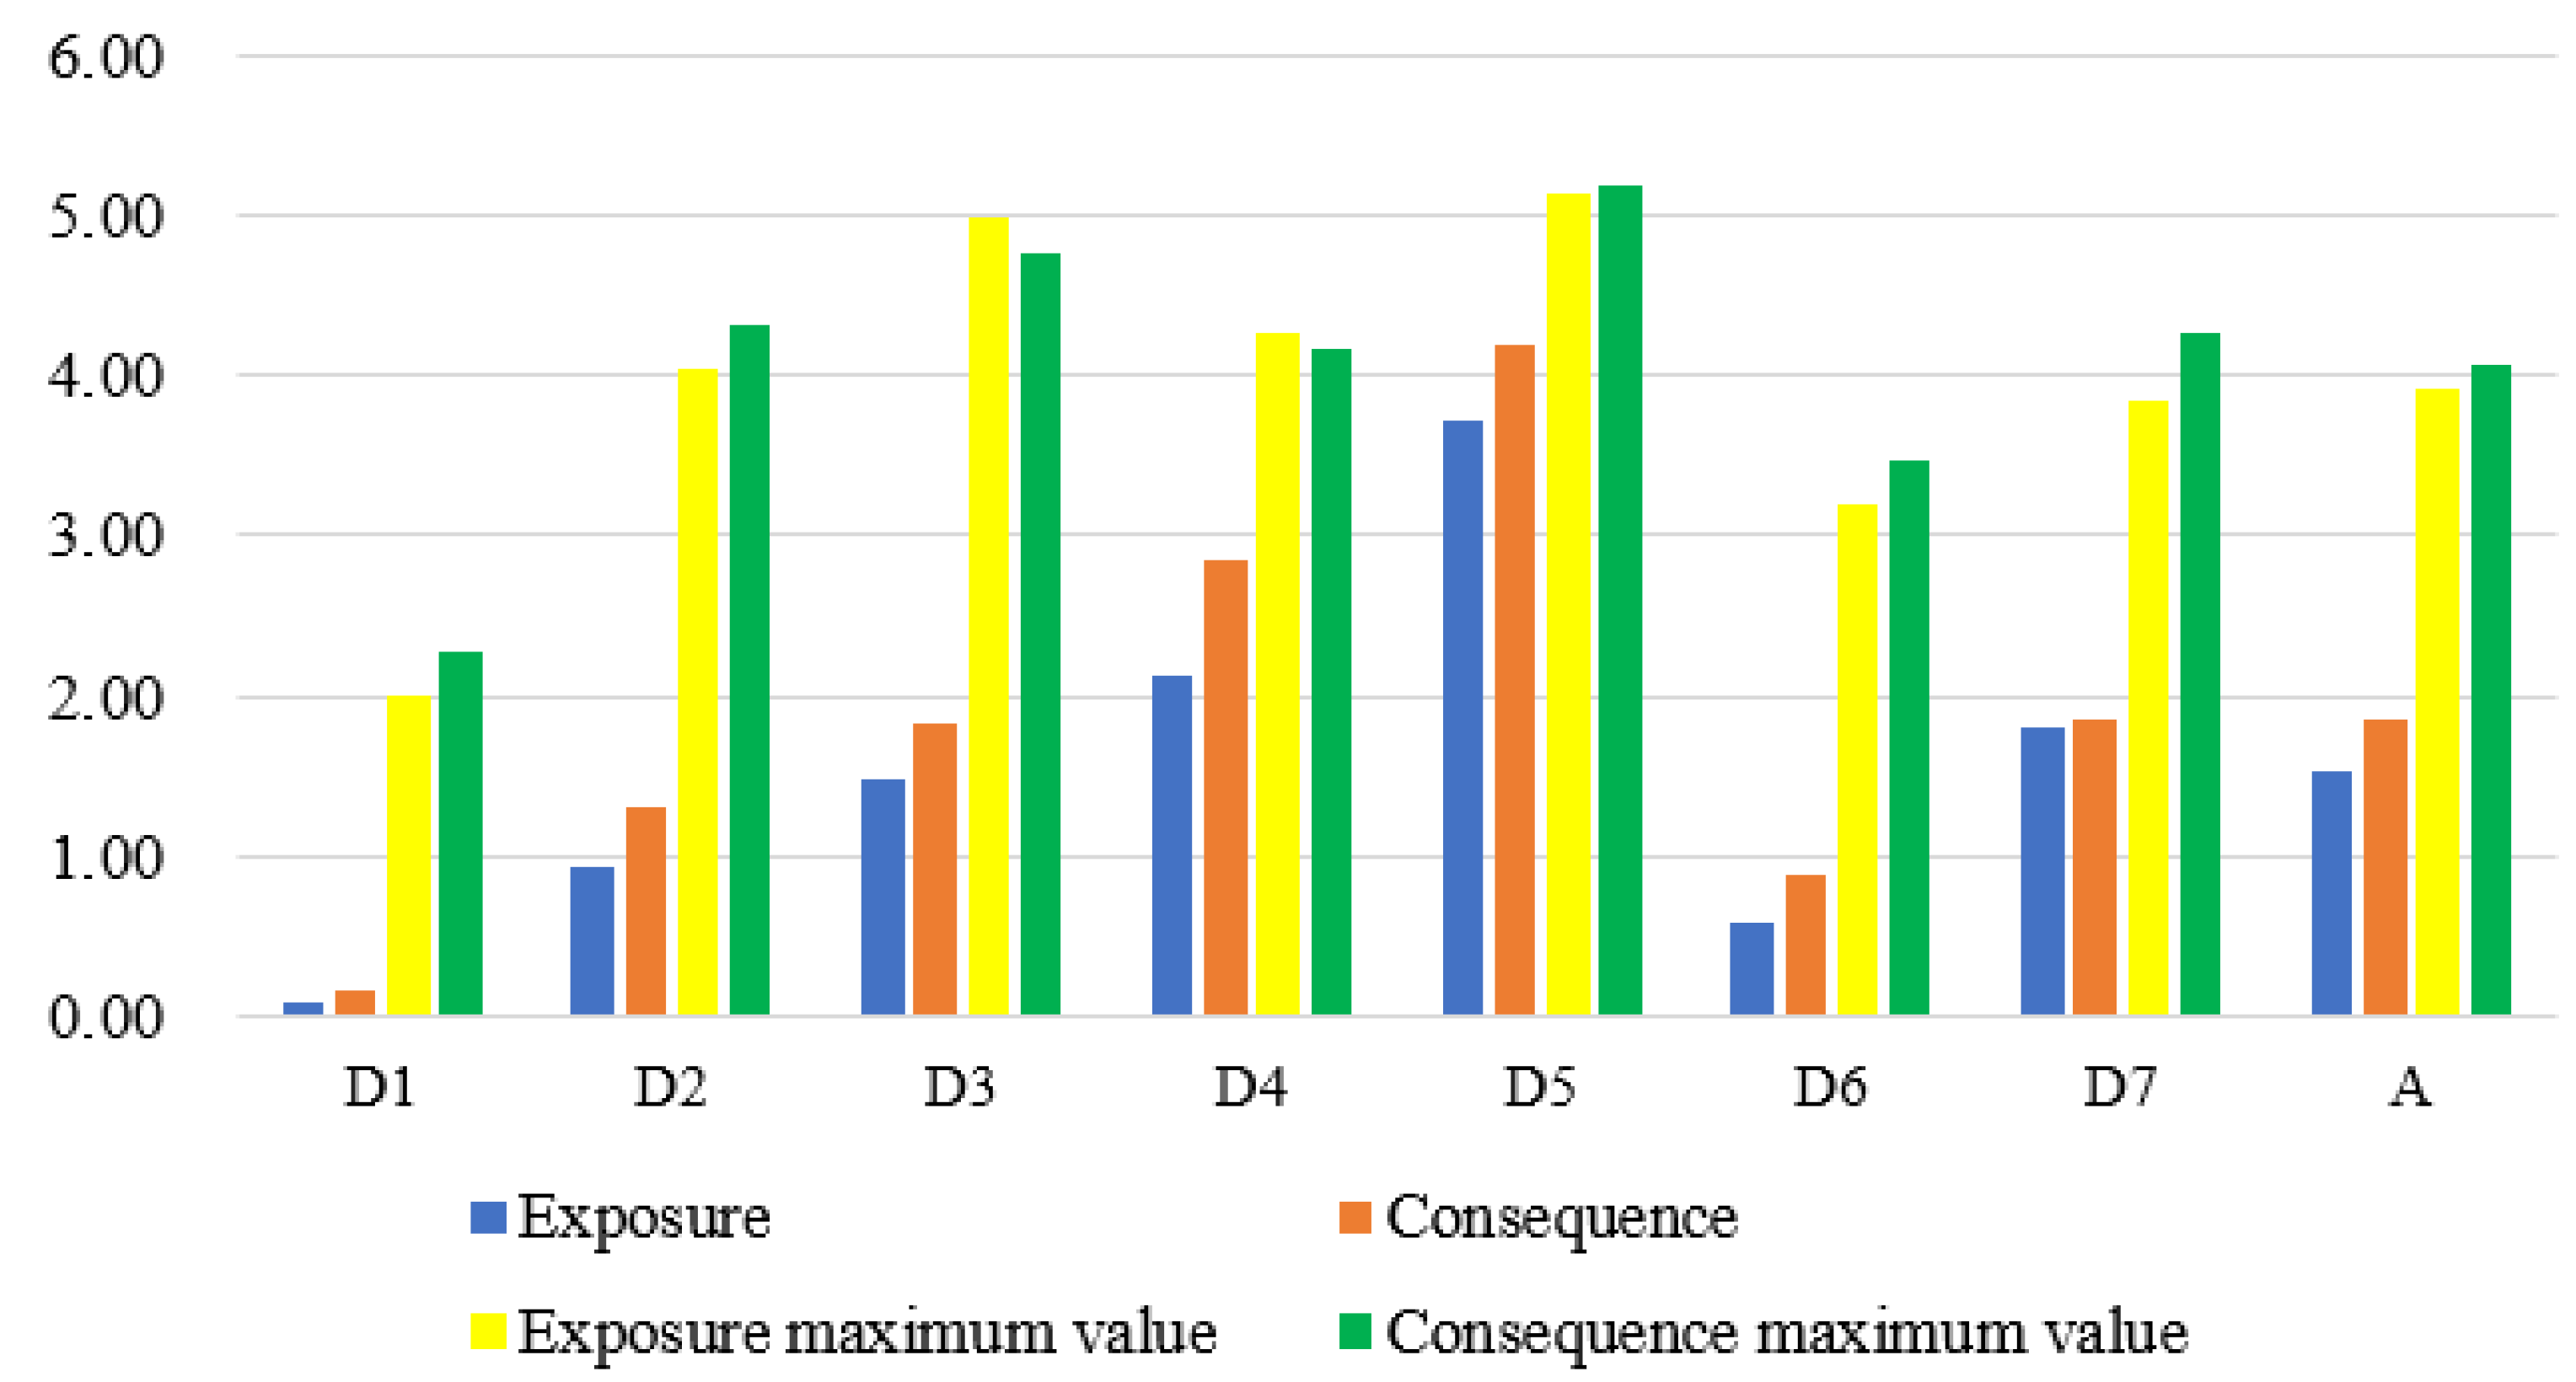
3.2.1. Overall Situation

With the extraction and analysis function of ArcGIS, areas with habitat quality ratings of high in Bohai Bay in 2018 were extracted, and these areas were defined as ecological sources, as shown in Figure 6.
The ecological sources of Bohai Bay are mainly located in the northern and southern parts of the Bay, with a small amount of distribution in the northwestern and southeastern parts of the study area. The land use types in the ecological sources are mainly woodlands, rivers and canals, grasslands, and mudflats. The ecological sources in Tianjin are mainly located in the northern part of the junction of Dongli District and Binhai New Area, with an area of 541.25 km2; the ecological source in Shandong is mainly located in the northeastern part of Dongying City and Binzhou City, with an area of 1546.5 km2; the ecological source in Hebei is mainly located in the southwestern part of Caofeidian, Haixing, and the coastal area of Huanghua, with an area of 785.5 km2.
The total area of the ecological sources in Bohai Bay is 2873.25 km2, accounting for 14.28% of the total area of the study area. Among them, the area at risk is 2821.25 km2, accounting for 98.19% of the total area of the ecological sources, which is mainly medium and low risk. Among the risky areas, the medium-risk area is 1191.5 km2, accounting for 41.47% of the ecological sources; the low-risk area is 1128 km2, accounting for 39.26% of the ecological sources; and the high-risk area is 501.75 km2, accounting for 17.46% of the ecological sources. The risk-free area is very small and is mainly located in the center of the Yellow River Delta Natural Reserve in Shandong Province; the low-risk area is mainly located in the ecological sources of Dongying City and Binzhou City in Shandong Province near the sea side and the ecological sources of Caofeidian City in Hebei Province near the land side; the medium-risk area is mainly located in the northeast of Wudi County in Binzhou City in Shandong Province, in the Hekou District in Dongying City, and in most of the ecological sources of Huanghua County in Hebei Province. The medium-risk areas are mainly located in the northeastern part of Wudi County, Binzhou City, Shandong Province, the northeastern part of Hekou District, Dongying City, and most of Huanghua County in Hebei Province, in the ecological sources.

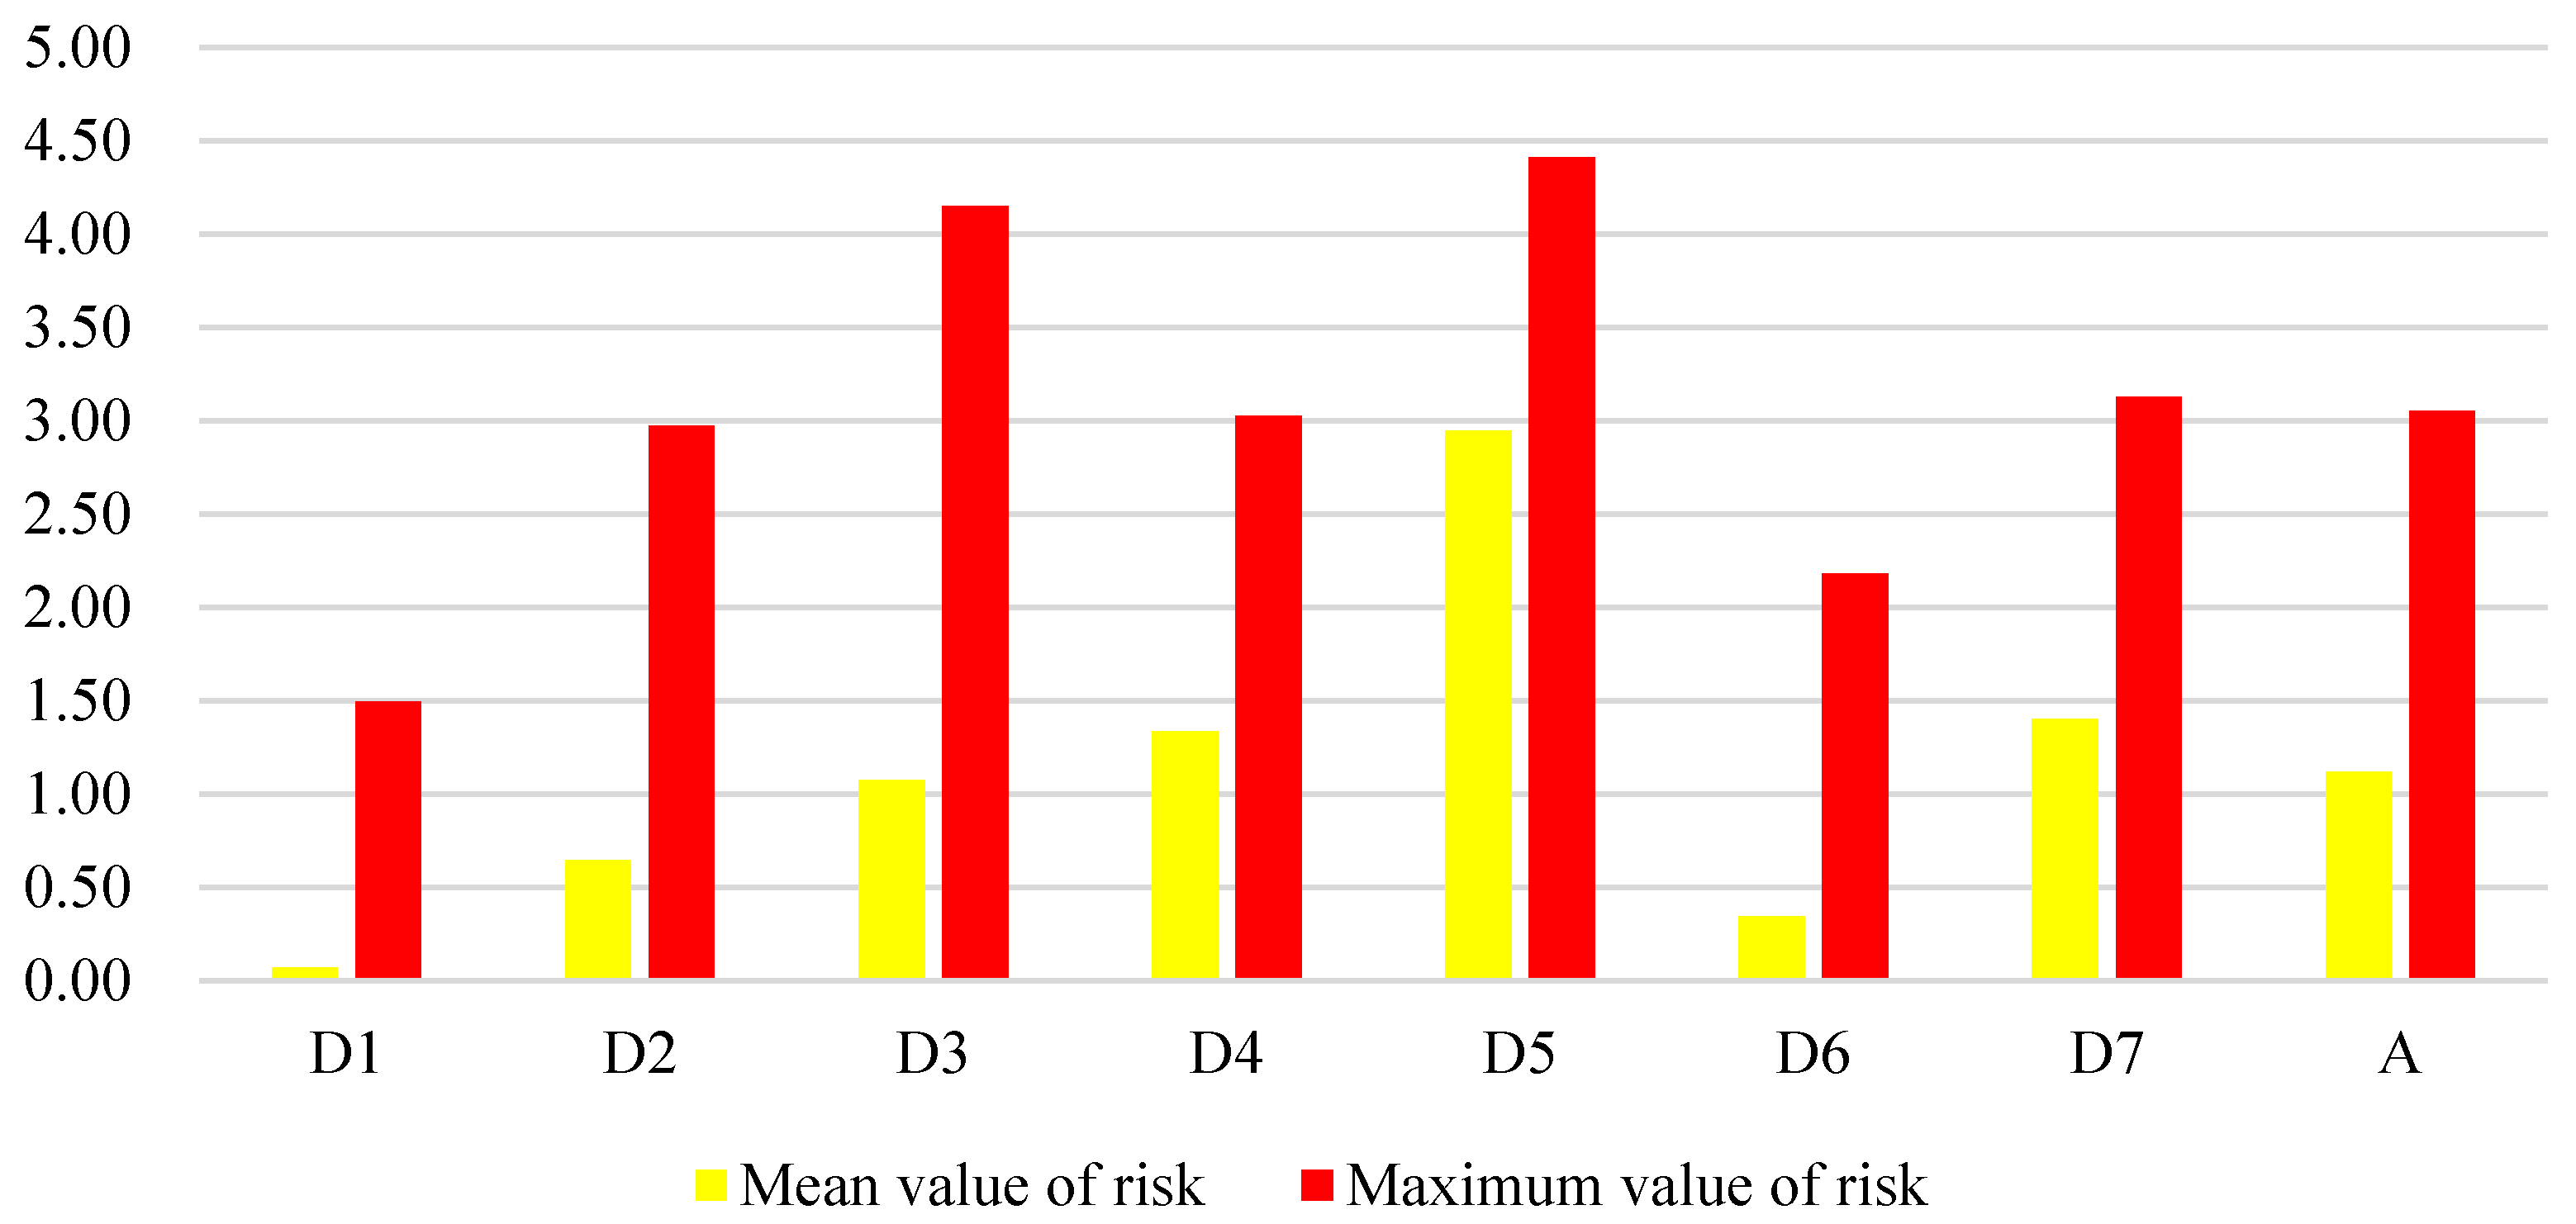
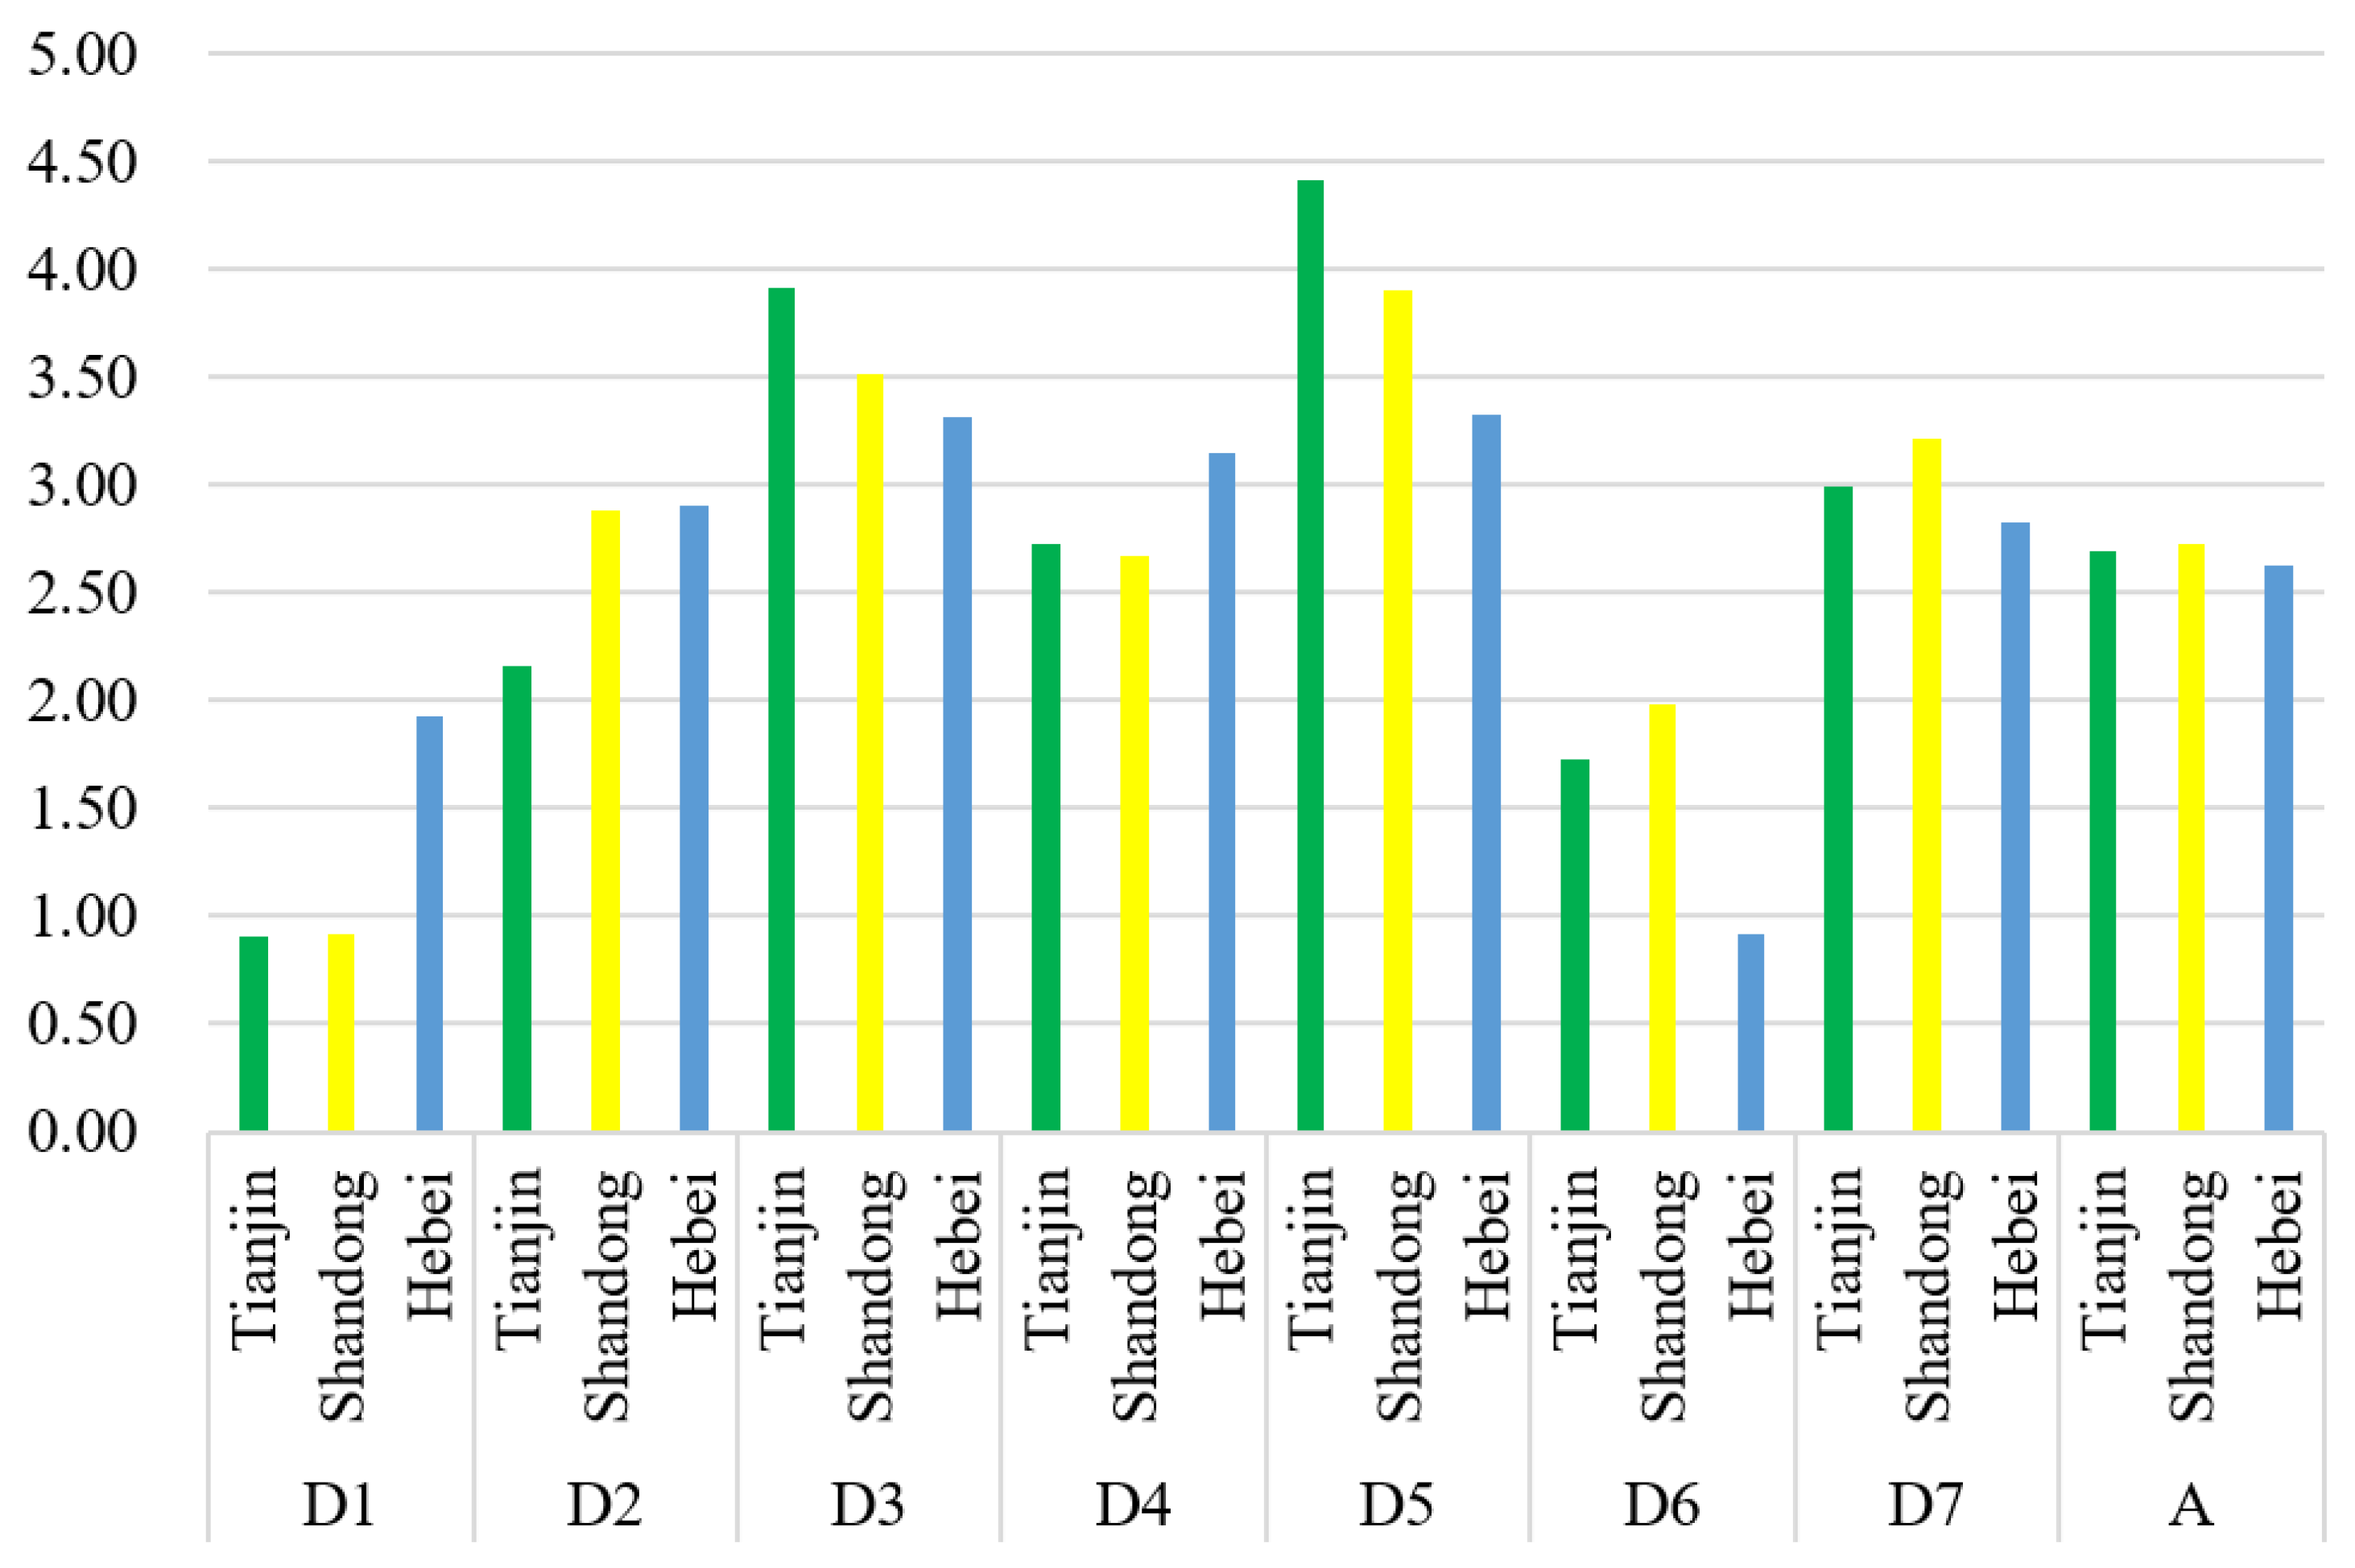
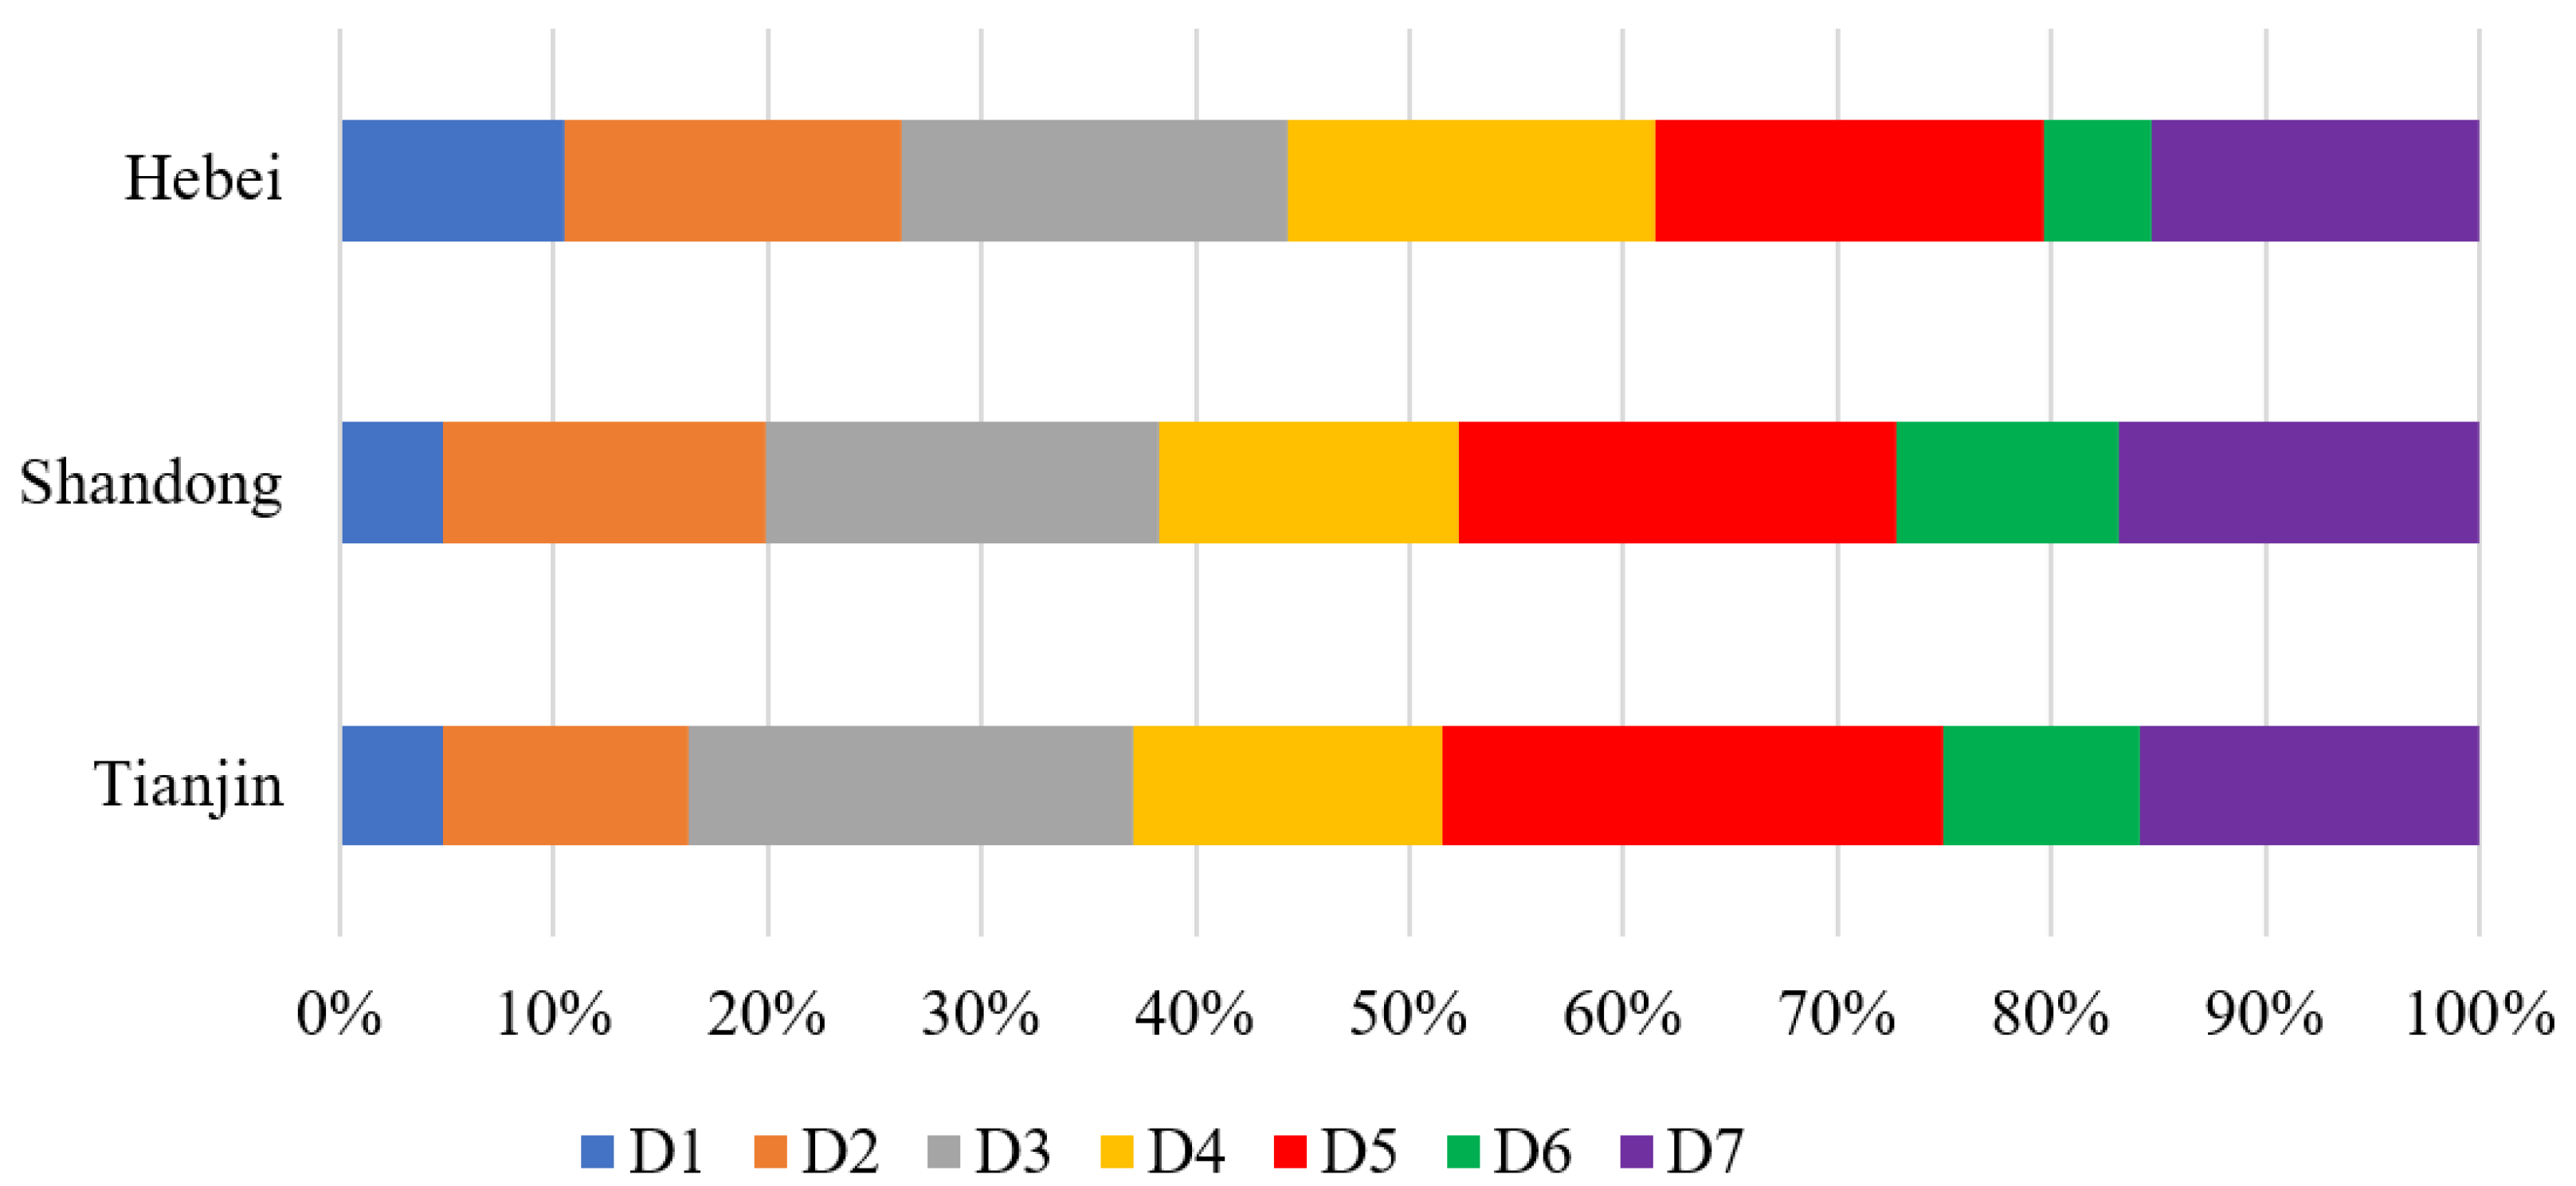
3.2.2. Impact of Different Risk Sources on Ecological Sources

Overall, among the seven sources of risk, industrial and construction land poses the greatest risk to the ecological sources of the terrestrial ecosystem in Bohai Bay, with a mean value of 2.95 and a maximum value of 4.41, while paddy fields pose the least risk, with a mean value of 0.07 and a maximum value of 1.49 (Figure 7).
The risk situation of ecological sources in different provinces of Bohai Bay is as follows (Figure 8): the mean values of risk to ecological sources from human activities in Tianjin, Hebei, and Shandong provinces are very similar, with risk values of 2.69, 2.73, and 2.63, respectively. In Tianjin and Shandong provinces, the three main sources of risk to ecological sources are industrial and construction sites, urban sites, and reclamation areas. In Hebei Province, the three largest sources of risk to ecological sources are industrial and construction sites, urban sites, and rural settlements.
The difference in the risk of regions from the perspective of the contribution of different risk sources to the risk value is shown in Figure 9. The proportion of risk caused by paddy fields to the ecological sources of Hebei in Bohai Bay is the largest at 10.47% of the total risk value, which is much larger than the proportion of risk caused by paddy fields to Shandong and Tianjin at 4.79%. The proportion of risk posed by drylands to the ecological sources in Tianjin is the smallest at 11.47%, which is lower than its risk to Hebei at 15.83%. The proportion of risk posed by urban land to the ecological sources in Tianjin is the largest at 20.78%, while its risk to Hebei is the lowest at 18.06%. The proportion of risk posed by rural settlements to the ecological sources in Hebei is the largest at 17.16%, while its risk to Shandong is the lowest at 14.16%. The proportion of risk posed by industrial and construction land to the ecological sources in Tianjin is very large at 23.43% of the total risk value, while its risk to Hebei is the lowest at 18.11%. The proportion of risk posed by unused land to the ecological sources in Shandong in Bohai Bay is the largest at 10.37% of the total risk value, much larger than its risk to Hebei at 5.00%. The proportion of risk to the ecological sources in Tianjin, Shandong, and Hebei is relatively similar, at 15.87%, 16.83%, and 15.36%, respectively.

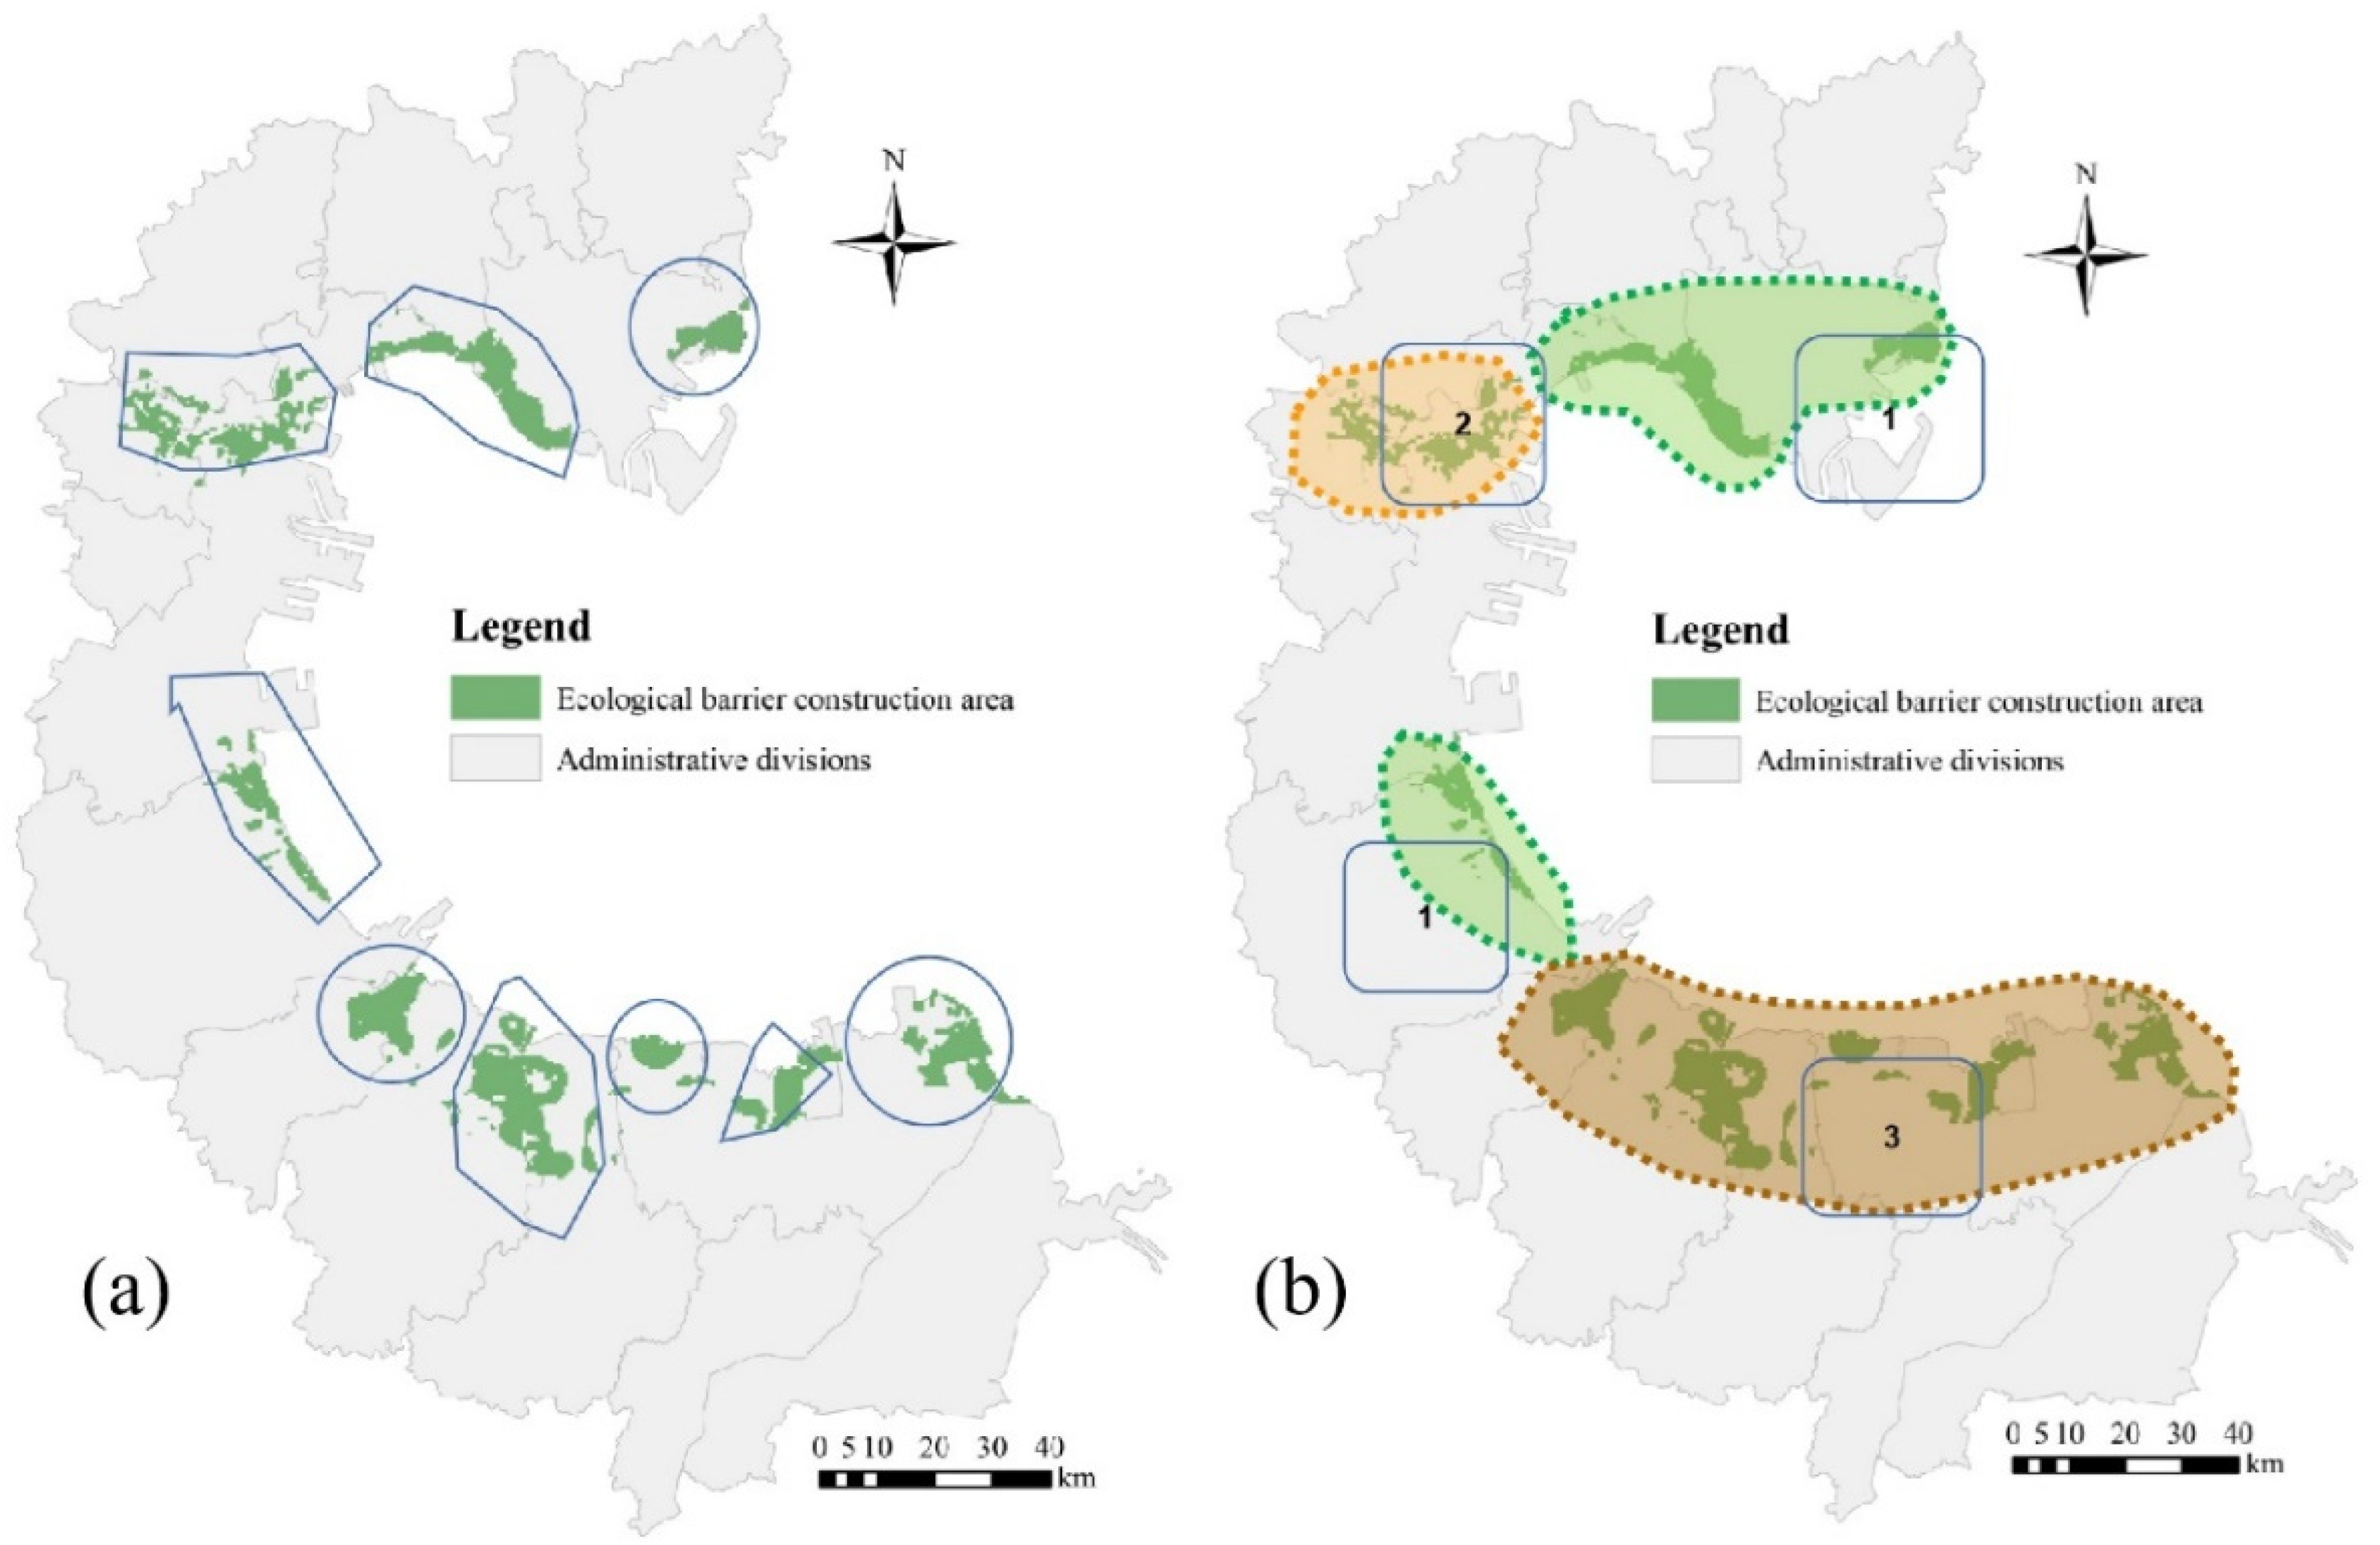
3.2.3. Ecological Barriers Identification

Ecological barriers should be constructed in ecological sources that are at high risk of being affected by human activities. The barrier areas cannot only reduce the interference of human activities with ecological sources, but also help to amplify or transmit ecological services. This study identifies areas suitable for ecological barrier construction with the help of habitat quality and habitat risk models and uses the extraction tool of ArcGIS to eliminate discrete areas to obtain nine ecological barrier construction areas, which are divided into three major zones according to their provinces. Hebei is the first ecological barrier zone with three ecological barriers; Tianjin is the second ecological barrier zone with one ecological barrier, and Shandong is the third ecological barrier zone with five ecological barriers, as shown in Figure 10.
The ecological barriers in Bohai Bay are mainly located in the land–sea intersection on the offshore side of Bohai Bay, with a total area of 1173.06 km2, accounting for 40.83% of the ecological service supply area. The ecological barrier zone 1 in Hebei has an area of 327.72 km2; the ecological barrier zone 2 in Tianjin has an area of 188.45 km2, and the ecological barrier zone 3 in Shandong has an area of 656.89 km2.

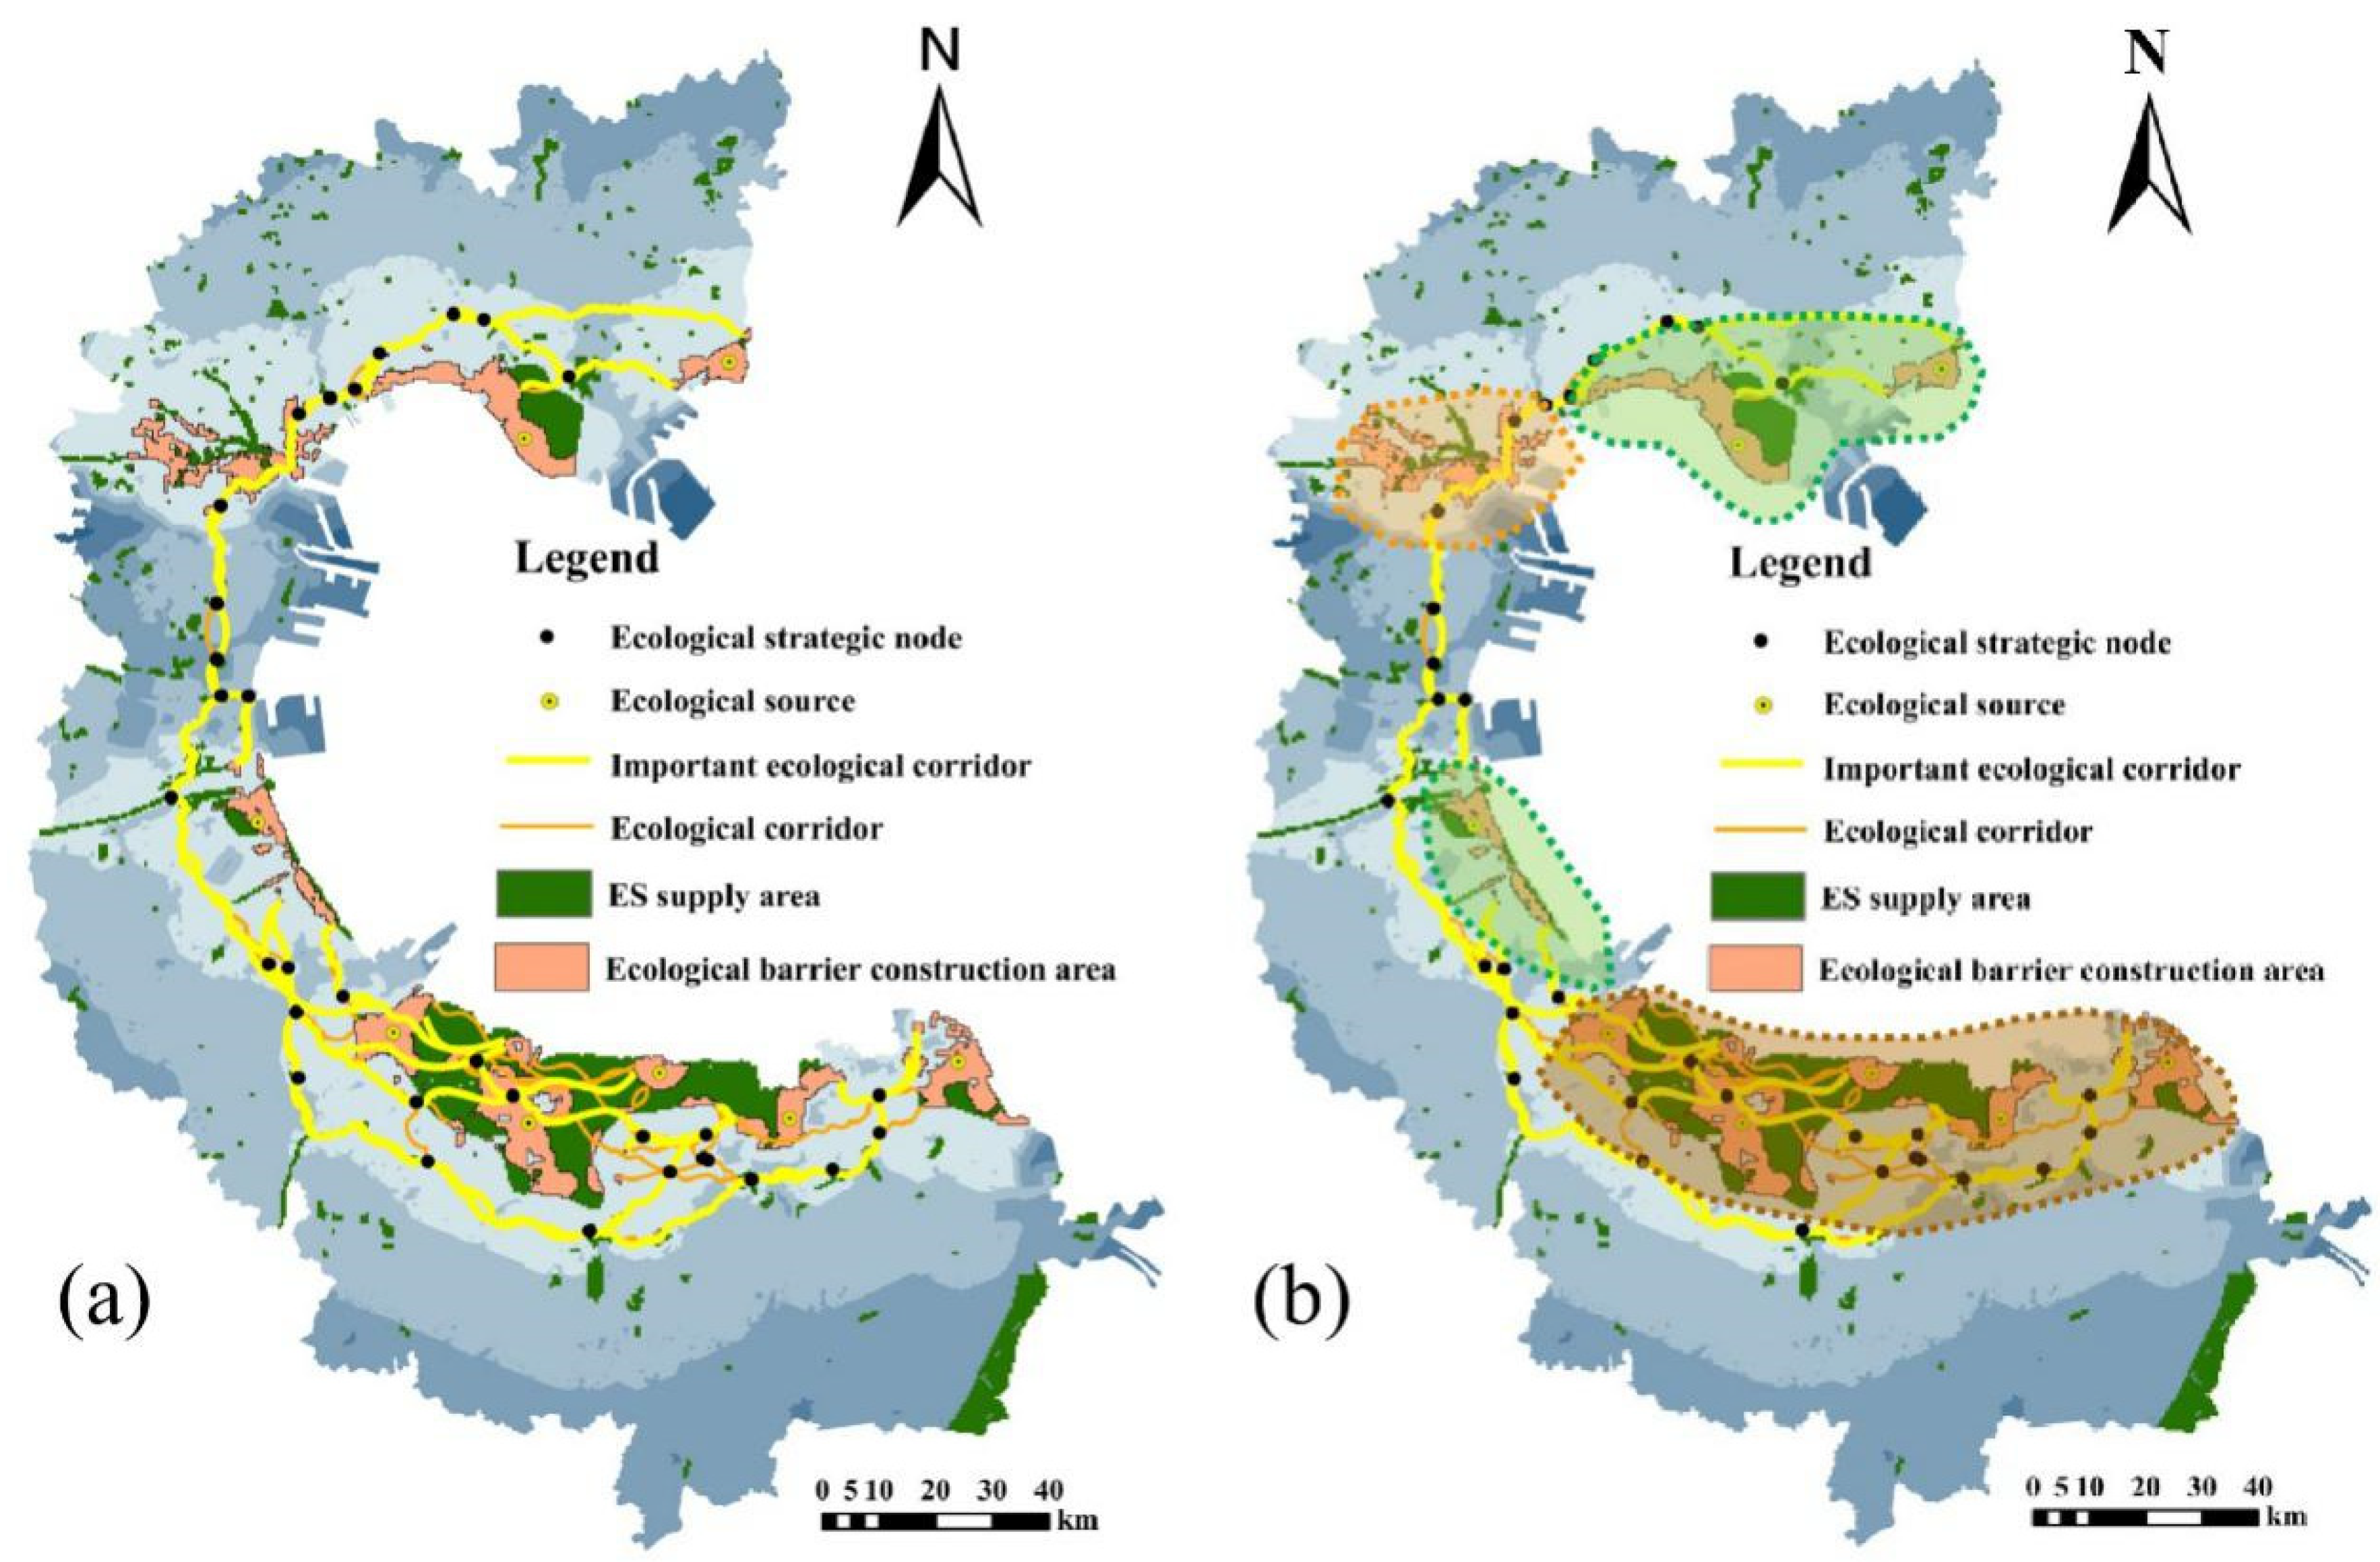
3.2.4. Ecological Security Patterns

The core elements of the ESPs of the Bohai Bay terrestrial ecosystem include the ecological sources, ecological barriers, ecological corridors, and ecological strategic nodes. All the least costly paths were combined and filtered to obtain a total of 35 ecological corridors, which together form the Bohai Bay Ecological Corridor Network, including 16 important ecological corridors and 19 common ecological corridors. Most of the 19 common corridors are located in Binzhou and Dongying in Shandong Province, where the ecological barriers are relatively dense and the corridors are interspersed. Ecological strategic nodes are located mainly at the intersections and branches of important ecological corridors. By combining the ecological sources, ecological barrier construction areas, minimum cumulative resistance surface, ecological corridors, and ecological strategic nodes, the ESPs of Bohai Bay was obtained.
The ecological strategic node is an area that plays a decisive role in regional landscape connectivity. It includes not only the areas that play a key role in connecting ESs and functions, but also the areas with weak functions on the ecological corridor and the areas most vulnerable to interference on the ecological corridor. Based on the ecological corridor network, the intersection of the ecological corridor is defined as the ecological strategy node by using the element editing function of ArcGIS, and 32 nodes were finally determined, as shown in Figure 11.

4. Discussion

4.1. Using Ecological Risk Assessment for Ecological Source Zoning

At present, in the research on the identification of ecological sources, one takes the ecosystem importance assessment as the only basis for the screening of ecological sources, and the other combines the ecosystem importance assessment with the risk assessment of ecosystem degradation [13,56]. It only assesses the importance of regional ecosystems and evaluates the current structure and function of ecosystems, ignoring the interaction of human activities with ecosystems and the long-term potential of the ecological source to provide ESs. Taking the risk of ecosystem degradation as another indicator for the screening of ecological sources, although the screened ecological sources have long-term potential to provide ESs, this source identification method directly ignores the ecological sources that can provide ESs but bears high risks. Taking the importance of ecosystem as the basis for the identification of ecological sources and conducting risk analysis on the identified ecological sources can comprehensively show the current state of ecological sources and the long-term potential of providing ESs. The risk assessment identifies internal differences in ecological sources and reflects them in spatial distribution, allowing for fine-grained and adaptive ecological management. In this study, risk assessment was used to grade the risk of human activities in the terrestrial ecosystems of Bohai Bay. Most of the ecological sources in Bohai Bay are at varying degrees of risk, mainly medium and low risk, while about 20% of the ecological source areas are at high risk. Most of the sporadically distributed ecological sources are at high risk due to their high degree of habitat fragmentation and complex sources of risk, while most of the ecological sources near industrial and construction sites and towns are also at high risk due to the intensity of disturbance and frequent disturbance. Medium-risk areas are mainly located on the marine side of the ecological sources in Caofeidian District, Tangshan City, and in most of the ecological sources in Huanghua County in Hebei Province. Low-risk areas are mainly located in Dongying City and Binzhou City in Shandong Province, near the marine side of the ecological sources. The area of no-risk areas is very small, with only a small area within the Yellow River Delta Nature Reserve. Using the HRA model for risk assessment can evaluate the risk level of ecological sources, identify the risk causes of ecological sources from the perspective of exposure and sensitivity (Figure 12), and provide a basis for formulating corresponding risk mitigation measures. The sources of risk in the ecological sources of Bohai Bay are mainly industrial and construction land, rural settlements, and urban land, which are closely related to the type of land use after the reclamation. Generally speaking, urban construction land poses a greater risk to ecological sources than rural settlements, but in Bohai Bay, as part of the ecological sources are scattered in various areas, they show a staggered distribution with rural settlements, resulting in a wider range of disturbance from rural settlements, while urban construction land is mainly concentrated. Although the extreme value of the risk caused by rural settlements to the ecological sources is not as large as that caused by urban construction land, the average value of the risk caused by rural settlements is larger than urban construction land. The risk to the ecological sources in Bohai Bay is more due to the vulnerability of the ecosystem itself, and the ecological restoration work in Bohai Bay can focus on improving the ability of the area to resist the risk sources. This paper introduces ecological risk assessment to demonstrate the structural and functional differentiation within ecological sources. The ecological sources are divided into high, medium, and low zones according to risk levels, and the exposure and sensitivity analysis of the HRA model provides the basis for adaptive ecological management.

4.2. Identification of Ecological Barrier Construction Areas

Based on the risk zoning of ecological sources and the analysis of the concept and connotation of ecological barriers, this paper presents a differentiated ecological management of ecological sources by identifying ecological barrier zones. The main function of ecological barriers is to resist the adverse impact of risk sources on the ecological service supply area and transfer ESs to the demand area. In Figure 13a, the embedded ecological barrier shows that the beneficiary and supply areas of ESs are in the same location, and the ecological barrier is at the periphery of the beneficiary or supply area, acting as a barrier to undesirable factors. In Figure 13b, a guiding ecological barrier shows that there is a directionality of ESs from the supply area to the beneficiary area, and a connection area is needed so that ESs reach the beneficiary area along the connection area. When there is a spatial mismatch between the ecosystem service supply area and the beneficiary area, there is a connecting area between them, which generates ecosystem service flows, and the connecting area influences the ES flow process. In Figure 13c, a strong transmission ecological barrier indicates that there is an exchange of ESs within the ecosystem service supply area and the ecological barriers, and the ecological barriers have a diffusion effect on the transfer of ESs. In Figure 13d, an external diffusion-type ecological barrier indicates that ESs spread in all directions without direction; the supply and benefit areas are adjacent to each other, and the ecological barriers are around the supply area, acting as a barrier to undesirable factors and facilitating the flow of ESs.
However, existing studies treat ecological barriers more as macroscopic concepts with a huge research scale, making it difficult to analyze their structure and function after identifying the extent of the ecological barriers. In regional or city-scale studies, this way of constructing ecological barriers is similar, that is, based on methods, such as environmental carrying capacity assessment and analysis of ecosystem service functions, and areas with the excellent ecological environment in the region are identified as ecological barrier areas. This research approach neither fulfils the function of ecological barriers in maintaining ecological service supply areas, nor does it reflect the role of ecological barrier areas in facilitating the delivery of ecosystem services. The areas identified in this study for constructing ecological barriers through ecosystem service provisioning area identification and risk assessment can maintain the stability of the structure and function of the ecological service provisioning areas, while facilitating the delivery of ESs.

4.3. The Relationship between Ecological Barriers and Ecological Security Patterns

Both ecological barriers and ESPs are landscape ecological plans to maintain regional ecological security [5,31]. The construction of ecological barriers is to protect the structure and function of ecological sources, and the construction of ESPs is to optimize land spatial planning by using the ESs provided by ecological sources. From the perspective of ecological restoration, ecological source is not only the protection object of ecological barrier, but also the basis of ESPs [6,7]. Ecological barriers and ESPs are complementary in both structure and function. The protection of ecological sources by ecological barriers safeguards the long-term potential of the ESPs to provide ESs, while ecological corridors linking multiple ecological sources in the ESPs complete the ecological barriers to facilitate the exchange and transfer of ESs to ecological service beneficiary areas and other ecological service supply areas. In Figure 14, (c) is the basic ESP construction paradigm, focusing on the identification of ecological elements and the correlation among them. (d) is the optimized ESP construction methods, where the interrelationship between human activities and ecological elements is taken into account through the construction of ecological barriers. In Figure 14, (c) ecological sources not only transmit ESs to ecosystem service demand areas, but also exchange ESs among multiple ecological sources. Ecological sources are not only exporters of ESs, but also receivers of adverse impacts from risk sources, and there is instability in the structure and function of ecological sources when disturbed by risk sources. In Figure 14, (d) ecological barriers are constructed in areas of ecological sources disturbed by risk sources. The use of ecological barriers improves the stability of the structure and function of ecological sources, thus safeguarding the long-term potential of the ESPs to maintain regional ecological security.

5. Conclusions

In rapidly urbanizing developing countries, where economic development and resource conservation are in conflict, ecological barriers and ESPs in regional landscape planning are both practical ways of guarding regional ecological resources and maintaining regional ecological security using ecological bottom-line thinking. In China, the construction of ecological barriers as a vague concept has played a remarkable role in the protection and restoration of ecosystem structure and function. However, most of the existing ecological barrier construction takes megaregions as the research scale, equating areas with the excellent ecological environments as ecological barriers and focusing on the maintenance of ecological security of the whole region. The overly large research object, combined with the complexity of the ecosystem itself, makes the analysis of ecological barrier structures and functions complicated. This study identifies ecological barriers at the scale of ecological patches using habitat quality and habitat risk assessment, focusing on the maintenance of ecological patches and the transmission of ESs by ecological barriers. At the same time, ecological barriers are integrated into the ESPs, and the framework of “ecological sources—ecological barriers—ecological resistance surface—ecological corridors” was used to construct the ESPs.
The results of the habitat quality analysis show that the overall habitat quality of the Bohai Bay land area is at a low level, and the spatial distribution is polarized. The area of ecological sources is decreasing in the Bohai Bay land area. The results of the habitat risk analysis show that the ecological sources in the Bohai Bay land area are mainly of medium-risk and low-risk, and the risk mainly comes from the vulnerability of the ecosystem itself. The ecological sources in the Bohai Bay land area are mainly located in the land–sea interface, and the land use types are mainly woodlands, rivers, and grasslands, accounting for 14.3% of the entire area. A total of nine ecological barrier construction cells were identified, accounting for 40.8% of the ecological sources and were divided into three major zones according to the provinces they belonged to. A total of 35 ecological corridors and 32 ecological strategic nodes with rivers and woodlands as the main land types were obtained, including 16 important ecological corridors and 19 general ecological corridors.
However, there are still many problems in the study of ESPs. Although land use is a comprehensive indicator of the structure and function of regional ecosystems and has been used as the basis for most studies on ESs, the link between land cover and ESs behind land use has not been fully resolved. This study focuses on the specific scope and relative capacity of the study area to provide ESs, but does not consider the types of ESs that can be provided in the ecosystem service supply area. Moreover, there is a lack of evaluation on the effectiveness of ecological barriers and ESPs. Therefore, more research is needed to deal with these problems.

Author Contributions

Conceptualization, J.Z., I.-S.C., and J.W.; methodology, J.Z.; software, J.Z.; validation, J.Z., J.W., and Y.C.; formal analysis, J.Z.; resources, J.Z. and F.D.; data curation, J.Z.; writing—original draft preparation, J.Z.; writing—review and editing, J.Z., J.W., F.D., I.-S.C., and Y.C.; visualization, J.Z. and F.D.; supervision, J.W.; project administration, J.W., J.Z., and Y.C.; funding acquisition, J.W. All authors have read and agreed to the published version of the manuscript.

Funding

This study was supported by the Key Project of the National Social Science Fund of China (19AZD005).

Institutional Review Board Statement

Not applicable.

Informed Consent Statement

Not applicable.

Data Availability Statement

Data available on request due to restrictions.

Conflicts of Interest

The authors declare no conflict of interest.

References

  1. MA (Millennium Ecosystem Assessment). Ecosystems and Human Well-Being: Synthesis; Island Press: Washington, DC, USA, 2005. [Google Scholar]
  2. Wang, Y.; Pan, J. Building ecological security patterns based on ecosystem services value reconstruction in an arid inland basin: A case study in Ganzhou District, NW China. J. Clean. Prod. 2019, 241, 118337. [Google Scholar] [CrossRef]
  3. Su, Y.; Chen, X.; Liao, J.; Zhang, H.; Wang, C.; Ye, Y.; Wang, Y. Modeling the optimal ecological security pattern for guiding the urban constructed land expansions. Urban For. Urban Green. 2016, 19, 35–46. [Google Scholar] [CrossRef]
  4. Opdam, P.; Steingröver, E.; Van Rooij, S. Ecological networks: A spatial concept for multi-actor planning of sustainable landscapes. Landsc. Urban Plan. 2006, 75, 322–332. [Google Scholar] [CrossRef]
  5. Yu, K. Security patterns and surface model in landscape ecological planning. Landsc. Urban Plan. 1996, 36, 1–17. [Google Scholar] [CrossRef]
  6. Wang, C.; Yu, C.; Chen, T.; Feng, Z.; Hu, Y.; Wu, K. Can the establishment of ecological security patterns improve ecological protection? An example of Nanchang, China. Sci. Total Environ. 2020, 740, 140051. [Google Scholar] [CrossRef]
  7. Peng, J.; Yang, Y.; Liu, Y.; Hu, Y.; Du, Y.; Meersmans, J.; Qiu, S. Linking ecosystem services and circuit theory to identify ecological security patterns. Sci. Total Environ. 2018, 644, 781–790. [Google Scholar] [CrossRef] [Green Version]
  8. Costanza, R.; de Groot, R.; Braat, L.; Kubiszewski, I.; Fioramonti, L.; Sutton, P.; Farber, S.; Grasso, M. Twenty years of ecosystem services: How far have we come and how far do we still need to go? Ecosyst. Serv. 2017, 28, 1–16. [Google Scholar] [CrossRef]
  9. Yuan, Y.; Bai, Z.; Zhang, J.; Xu, C. Increasing urban ecological resilience based on ecological security pattern: A case study in a resource-based city. Ecol. Eng. 2022, 175, 106486. [Google Scholar] [CrossRef]
  10. Lawton, J.H.J.C.U.P.; Daily, G.C. (Eds.) Nature’s Services: Societal Dependence on Natural Ecosystems; Island Press: Washington, DC, USA, 1997; p. 392. ISBN1 1-55963-475-8 (hbk). ISBN2 1-55963-476-6 (soft cover). 1998. [Google Scholar]
  11. Yang, Q.; Liu, G.; Casazza, M.; Hao, Y.; Giannetti, B.F. Emergy-based accounting method for aquatic ecosystem services valuation: A case of China. J. Clean. Prod. 2019, 230, 55–68. [Google Scholar] [CrossRef]
  12. Assumma, V.; Bottero, M.; Caprioli, C.; Datola, G.; Mondini, G. Evaluation of Ecosystem Services in Mining Basins: An Application in the Piedmont Region (Italy). Sustainability 2022, 14, 872. [Google Scholar] [CrossRef]
  13. Peng, J.; Pan, Y.; Liu, Y.; Zhao, H.; Wang, Y. Linking ecological degradation risk to identify ecological security patterns in a rapidly urbanizing landscape. Habitat Int. 2018, 71, 110–124. [Google Scholar] [CrossRef]
  14. Gong, J.; Cao, E.; Xie, Y.; Xu, C.; Li, H.; Yan, L. Integrating ecosystem services and landscape ecological risk into adaptive management: Insights from a western mountain-basin area, China. J. Environ. Manag. 2021, 281, 111817. [Google Scholar] [CrossRef] [PubMed]
  15. The Natural Capital, P. Habitat Risk Assessment. InVEST 3.6.0 Documentation. 2017. Available online: https://invest-userguide.readthedocs.io/en/latest/habitat_risk_assessment.html (accessed on 17 March 2022).
  16. Kheirkhah Ghehi, N.; MalekMohammadi, B.; Jafari, H. Integrating habitat risk assessment and connectivity analysis in ranking habitat patches for conservation in protected areas. J. Nat. Conserv. 2020, 56, 125867. [Google Scholar] [CrossRef]
  17. Caro, C.; Marques, J.C.; Cunha, P.P.; Teixeira, Z. Ecosystem services as a resilience descriptor in habitat risk assessment using the InVEST model. Ecol. Indic. 2020, 115, 106426. [Google Scholar] [CrossRef]
  18. Studwell, A.; Hines, E.; Nur, N.; Jahncke, J. Using habitat risk assessment to assess disturbance from maritime activities to inform seabird conservation in a coastal marine ecosystem. Ocean Coast. Manag. 2021, 199, 105431. [Google Scholar] [CrossRef]
  19. Arkema, K.K.; Verutes, G.; Bernhardt, J.R.; Clarke, C.; Rosado, S.; Canto, M.; Wood, S.A.; Ruckelshaus, M.; Rosenthal, A.; McField, M.; et al. Assessing habitat risk from human activities to inform coastal and marine spatial planning: A demonstration in Belize. Environ. Res. Lett. 2014, 9, 114016. [Google Scholar] [CrossRef]
  20. Samhouri, J.F.; Levin, P.S. Linking land- and sea-based activities to risk in coastal ecosystems. Biol. Conserv. 2012, 145, 118–129. [Google Scholar] [CrossRef]
  21. Zhai, T.; Wang, J.; Fang, Y.; Qin, Y.; Huang, L.; Chen, Y. Assessing ecological risks caused by human activities in rapid urbanization coastal areas: Towards an integrated approach to determining key areas of terrestrial-oceanic ecosystems preservation and restoration. Sci. Total Environ. 2020, 708, 135153. [Google Scholar] [CrossRef]
  22. Lin, Q.; Mao, J.; Wu, J.; Li, W.; Yang, J. Ecological Security Pattern Analysis Based on InVEST and Least-Cost Path Model: A Case Study of Dongguan Water Village. Sustainability 2016, 8, 172. [Google Scholar] [CrossRef] [Green Version]
  23. Hepcan, C.C.; Ozkan, M.B. Establishing ecological networks for habitat conservation in the case of Cesme-Urla Peninsula, Turkey. Environ. Monit. Assess. 2011, 174, 157–170. [Google Scholar] [CrossRef]
  24. Keeley, A.T.H.; Beier, P.; Gagnon, J.W. Estimating landscape resistance from habitat suitability: Effects of data source and nonlinearities. Landsc. Ecol. 2016, 31, 2151–2162. [Google Scholar] [CrossRef]
  25. Proctor, M.F.; Nielsen, S.E.; Kasworm, W.F.; Servheen, C.; Radandt, T.G.; Machutchon, A.G.; Boyce, M.S. Grizzly bear connectivity mapping in the Canada–United States trans-border region. J. Wildl. Manag. 2015, 79, 544–558. [Google Scholar] [CrossRef]
  26. McRae, B.H. Isolation by resistance. Evolution 2006, 60, 1551–1561. [Google Scholar] [CrossRef] [PubMed]
  27. Chetkiewicz, C.-L.B.; Clair, C.C.S.; Boyce, M.S. Corridors for Conservation: Integrating Pattern and Process. Annu. Rev. Ecol. Evol. Syst. 2006, 37, 317–342. [Google Scholar] [CrossRef] [Green Version]
  28. Wei, S.; Pan, J.; Liu, X. Landscape ecological safety assessment and landscape pattern optimization in arid inland river basin: Take Ganzhou District as an example. Hum. Ecol. Risk Assess. Int. J. 2018, 26, 782–806. [Google Scholar] [CrossRef]
  29. Yuanjing, Z.; Binyang, Y.; Ashraf, M.A. Ecological Security Pattern for the Landscape of Mesoscale and Microscale Land: A Case Study of the Harbin City Center. J. Environ. Eng. Landsc. Manag. 2015, 23, 192–201. [Google Scholar] [CrossRef]
  30. Pan, K.; Wu, N.; Pan, K.; Chen, C. A discussion on the issues of there-construction of ecological shelter zone on the upper reaches of the Yangtze. Acta Ecol. Sin. 2004, 24, 617–629. (In Chinese) [Google Scholar]
  31. Yu, Z.; Qin, T.; Yan, D.; Yang, M.; Yu, H.; Shi, W. The Impact on the Ecosystem Services Value of the Ecological Shelter Zone Reconstruction in the Upper Reaches Basin of the Yangtze River in China. Int. J. Environ. Res. Public Health 2018, 15, 2273. [Google Scholar] [CrossRef] [Green Version]
  32. Yang, D. On the Construction of the Ecological Protective Screen for the Upper Reaches of the Changjiang River. J. Sichuan For. Sci. Technol. 2002, 23, 1–6. (In Chinese) [Google Scholar]
  33. Bao, Y.; Bao, Y.H.; Alarten, T.; Wu, L.T.Y. Construction and Protection of Inner Mongolian Ecological Screen. Res. Soil Water Conserv. 2002, 9, 62–65. (In Chinese) [Google Scholar]
  34. Chen, S.; Diao, C.; Zhou, C. Study on Reconstruction and Functional Regionalization of Ecological Shelter Zone in Land Use Planning-A Case Study of Yongchuan District, Chongqing City. Res. Soil Water Conserv. 2011, 1, 105–110. (In Chinese) [Google Scholar]
  35. Jiang, L.; Han, W.; Sun, L. A study on regional ecological barrier construction based on landscape ecological risk. Remote Sens. Land Resour. 2020, 32, 219–226. (In Chinese) [Google Scholar]
  36. Wang, X.; Huang, G.; Zhang, Y.; Cheng, Z.; Yang, Y. The Layout of its Ecological Protective Barrier in Ganzhou City based on Regional Carrying Capacity of Resources and Environments. J. Fujian For. Sci. Technol. 2014, 2, 161–165. (In Chinese) [Google Scholar] [CrossRef]
  37. Zhao, X.; Wang, Q.; Jin, F.; Luo, N.; Fan, B.; Li, X.; Qin, F.; Zhang, H. Re-exploration program for petroleum-rich sags and its significance in Bohai Bay Basin, East China. Pet. Explor. Dev. 2015, 42, 790–801. [Google Scholar] [CrossRef]
  38. Huang, L.; Tan, Y.; Song, X.; Huang, X.; Wang, H.; Zhang, S.; Dong, J.; Chen, R. The status of the ecological environment and a proposed protection strategy in Sanya Bay, Hainan Island, China. Mar. Pollut. Bull. 2003, 47, 180–186. [Google Scholar] [CrossRef]
  39. Yuan, Y.; Song, D.; Wu, W.; Liang, S.; Wang, Y.; Ren, Z. The impact of anthropogenic activities on marine environment in Jiaozhou Bay, Qingdao, China: A review and a case study. Reg. Stud. Mar. Sci. 2016, 8, 287–296. [Google Scholar] [CrossRef]
  40. Yu, L.; Hou, X.; Gao, M.; Shi, P. Assessment of coastal zone sustainable development: A case study of Yantai, China. Ecol. Indic. 2010, 10, 1218–1225. [Google Scholar] [CrossRef]
  41. Ma, T.; Li, X.; Bai, J.; Cui, B. Habitat modification in relation to coastal reclamation and its impacts on waterbirds along China’s coast. Glob. Ecol. Conserv. 2019, 17, e00585. [Google Scholar] [CrossRef]
  42. Zhang, L.; Peng, J.; Liu, Y.; Wu, J. Coupling ecosystem services supply and human ecological demand to identify landscape ecological security pattern: A case study in Beijing–Tianjin–Hebei region, China. Urban Ecosyst. 2016, 20, 701–714. [Google Scholar] [CrossRef]
  43. Grafius, D.R.; Corstanje, R.; Warren, P.H.; Evans, K.L.; Hancock, S.; Harris, J.A. The impact of land use/land cover scale on modelling urban ecosystem services. Landsc. Ecol. 2016, 31, 1509–1522. [Google Scholar] [CrossRef] [Green Version]
  44. Li, F.; Wang, L.; Chen, Z.; Clarke, K.C.; Li, M.; Jiang, P. Extending the SLEUTH model to integrate habitat quality into urban growth simulation. J. Environ. Manag. 2018, 217, 486–498. [Google Scholar] [CrossRef] [PubMed] [Green Version]
  45. Sun, X.; Jiang, Z.; Liu, F.; Zhang, D. Monitoring spatio-temporal dynamics of habitat quality in Nansihu Lake basin, eastern China, from 1980 to 2015. Ecol. Indic. 2019, 102, 716–723. [Google Scholar] [CrossRef]
  46. Duggan, J.M.; Eichelberger, B.A.; Ma, S.; Lawler, J.J.; Ziv, G. Informing management of rare species with an approach combining scenario modeling and spatially explicit risk assessment. Ecosyst. Health Sustain. 2017, 1, 1–18. [Google Scholar] [CrossRef]
  47. Wyatt, K.H.; Griffin, R.; Guerry, A.D.; Ruckelshaus, M.; Fogarty, M.; Arkema, K.K. Habitat risk assessment for regional ocean planning in the U.S. Northeast and Mid-Atlantic. PLoS ONE 2017, 12, e0188776. [Google Scholar] [CrossRef]
  48. Spear, S.F.; Balkenhol, N.; Fortin, M.J.; McRae, B.H.; Scribner, K. Use of resistance surfaces for landscape genetic studies: Considerations for parameterization and analysis. Mol. Ecol. 2010, 19, 3576–3591. [Google Scholar] [CrossRef]
  49. Pickett, S.T.A.; Cadenasso, M.L.; Rosi-Marshall, E.J.; Belt, K.T.; Groffman, P.M.; Grove, J.M.; Irwin, E.G.; Kaushal, S.S.; LaDeau, S.L.; Nilon, C.H.; et al. Dynamic heterogeneity: A framework to promote ecological integration and hypothesis generation in urban systems. Urban Ecosyst. 2016, 20, 1–14. [Google Scholar] [CrossRef] [Green Version]
  50. Gurrutxaga, M.; Rubio, L.; Saura, S. Key connectors in protected forest area networks and the impact of highways: A transnational case study from the Cantabrian Range to the Western Alps (SW Europe). Landsc. Urban Plan. 2011, 101, 310–320. [Google Scholar] [CrossRef]
  51. Kong, F.; Yin, H.; Nakagoshi, N.; Zong, Y. Urban green space network development for biodiversity conservation: Identification based on graph theory and gravity modeling. Landsc. Urban Plan. 2010, 95, 16–27. [Google Scholar] [CrossRef]
  52. Verboom, J.; Pouwels, R. Ecological functioning of ecological networks: A species perspective. In Ecological Networks and Greenways: Concept, Design, Implementation (Cambridge Studies in Landscape Ecology); Jongman, R., Pungetti, G., Eds.; Cambridge University Press: Cambridge, UK, 2004; pp. 56–72. [Google Scholar] [CrossRef]
  53. Wu, L.; Sun, C.; Fan, F. Estimating the Characteristic Spatiotemporal Variation in Habitat Quality Using the InVEST Model—A Case Study from Guangdong–Hong Kong–Macao Greater Bay Area. Remote Sens. 2021, 13, 1008. [Google Scholar] [CrossRef]
  54. Zhang, X.; Song, W.; Lang, Y.; Feng, X.; Yuan, Q.; Wang, J. Land use changes in the coastal zone of China’s Hebei Province and the corresponding impacts on habitat quality. Land Use Policy 2020, 99, 104957. [Google Scholar] [CrossRef]
  55. Sallustio, L.; De Toni, A.; Strollo, A.; Di Febbraro, M.; Gissi, E.; Casella, L.; Geneletti, D.; Munafo, M.; Vizzarri, M.; Marchetti, M. Assessing habitat quality in relation to the spatial distribution of protected areas in Italy. J. Environ. Manag. 2017, 201, 129–137. [Google Scholar] [CrossRef] [PubMed]
  56. Peng, J.; Zhao, S.; Dong, J.; Liu, Y.; Meersmans, J.; Li, H.; Wu, J. Applying ant colony algorithm to identify ecological security patterns in megacities. Environ. Model. Softw. 2019, 117, 214–222. [Google Scholar] [CrossRef] [Green Version]
Figure 1. Map showing the location of the study area.
Sustainability 14 05384 g001
Figure 2. Flowchart of ecological security pattern construction.
Sustainability 14 05384 g002
Figure 3. Habitat quality in the terrestrial ecosystem of Bohai Bay from 1990–2018. (a) is habitat quality; (b) is habitat degradation; (c) is hotspot analysis; (d) is cluster analysis.
Sustainability 14 05384 g003
Figure 4. Transfer matrix for each habitat quality category of terrestrial ecosystems in Bohai Bay from 1990–2018 (Area/km2).
Sustainability 14 05384 g004
Figure 5. Spatial shift of terrestrial ecosystem habitat quality categories in Bohai Bay from 1990–2018.
Sustainability 14 05384 g005
Figure 6. Ecological risks in the ecological sources of Bohai Bay terrestrial ecosystem. (a) is ecological sources (ecological service supply area); (b) is ecological sources risk map.
Sustainability 14 05384 g006
Figure 7. Maximum and mean value of risk in the ecological sources of terrestrial ecosystem in Bohai Bay due to different risk sources (D1—paddy field, D2—dryland, D3—urban land, D4—rural settlement, D5—industrial and construction land, D6—unused land, D7—reclamation area, and A—mean value).
Sustainability 14 05384 g007
Figure 8. Ecological sources affected by different risk sources in different provinces of Bohai Bay (D1—paddy field, D2—dryland, D3—urban land, D4—rural settlement, D5—industrial and construction land, D6—unused land, D7—reclamation area, and A—mean value).
Sustainability 14 05384 g008
Figure 9. The proportion of risk values generated by different threat sources to the ecological sources of Bohai Bay (D1—paddy field, D2—dryland, D3—urban land, D4—rural settlement, D5—industrial and construction land, D6—unused land, and D7—reclamation area).
Sustainability 14 05384 g009
Figure 10. Distribution map of ecological barriers. (a) is 9 ecological barrier cells; (b) is 3 ecological barrier zones.
Sustainability 14 05384 g010
Figure 11. Ecological security pattern of terrestrial ecosystem in Bohai Bay. (a) is ecological security pattern; (b) is combination of ecological barrier zones and ecological security pattern.
Sustainability 14 05384 g011
Figure 12. Exposure and consequence of different threat sources on ecological sources in Bohai Bay. (D1—paddy field, D2—dryland, D3—urban land, D4—rural settlement, D5—industrial and construction land, D6—unused land, D7—reclamation area, and A—mean value).
Sustainability 14 05384 g012
Figure 13. Connotation of ecological barrier. (a) is an embedded ecological barrier; (b) is a guiding ecological barrier; (c) is a strong transmission ecological barrier; (d) is the external diffusion-type ecological barrier. ESSA is an ecological service supply area; BA is the beneficiary area; RS is the source of risk; EB is the ecological barrier; ESSA = BA represents the overlap of ecosystem service supply area and benefit area; BA = RS represents that the benefit area of ecosystem service overlaps with the risk source.
Sustainability 14 05384 g013
Figure 14. The relationship among the constituent elements in the ESPs. (a) is Original landscape conditions; (b) is Build ecological barrier separately; (c) is Basic ESPs; (d) is Optimized ESPs.
Sustainability 14 05384 g014
Table 1. Threat source attributes table.
Threat SourceMaximum Threat Distance (km)WeightsDecay Form
Unused land40.3Exponential
Construction land61Exponential
Rural settlements50.6Exponential
Urban land91Exponential
Paddy fields60.5Linear
Drylands60.7Linear
Table 2. Habitat suitability of each land use type and its sensitivity to different threat sources.
Land Use TypeHabitat SuitabilityUnused LandIndustrial and Construction LandRural SettlementsUrban LandPaddy FieldsDrylands
Paddy fields0.60.10.20.350.500.3
Drylands0.40.10.20.350.50.30
Forests10.30.60.8510.80.5
Shrubs10.20.20.450.60.80.5
Sparse woodlands10.30.650.910.80.55
Other woodlands10.30.70.9510.80.9
High-coverage grasslands0.80.20.20.50.60.40.4
Medium-coverage grasslands0.750.250.250.450.60.450.45
Low-coverage grasslands0.70.30.30.60.70.50.5
Canals0.30.30.30.30.50.30.3
Lakes0.90.30.60.750.90.70.7
Reservoirs0.70.30.50.750.90.70.7
Beaches0.60.30.50.750.950.70.6
Beachland0.60.50.550.850.950.750.75
Cities0000000
Rural settlements0000000
Construction land0000000
Sandy0.10.10.10.10.10.10.1
Saline land0.20.10.10.10.10.10.1
Swamps0.50.50.50.60.70.20.2
Bare ground0000000
Bare rocks0000000
Other0000000
Table 3. Habitat risk evaluation index and rating of the ecological service supply area in Bohai Bay.
Indicator PropertiesIndicatorsRisk Level
Low RiskMedium RiskHigh Risk
ExposureSpatial overlayArea of overlap between risk source and habitat < 10%10% ≤ Area of overlap between risk source and habitat < 30%Area of overlap between risk source and habitat ≥ 30%
Disturbance frequencyThe source of the threat is bare groundThe source of the threat is paddy fields and drylandsThe sources of threat are reclamation activities, construction sites, and rural settlements
Disturbance intensityThe source of the threat is bare groundThe sources of threat are rural settlements, paddy fields, and drylandsThe sources of threat are enclosed areas, towns, and building sites
ConsequenceHabitat heterogeneityAreas with a high habitat quality ratingAreas with a medium habitat quality ratingAreas with a low habitat quality rating
Management effectivenessHabitat range is national, provincial, and municipal nature reservesThe habitat range is a tourist attractionHabitat range not a nature reserve, tourist attraction
Habitat vulnerabilityThe habitat area falls within the ecological red zoneHabitat area is a nature reserveHabitat is neither an ecological red line nor a nature reserve
Table 4. Resistance coefficients of different land use types in Bohai Bay.
Land Use TypesResistance Coefficient
Forest1
Grassland2
Cropland30
Water50
Utilized land300
Built-up land500
Table 5. Area change of habitat quality at all categories of terrestrial ecosystem in Bohai Bay from 1990 to 2018(Area/km2).
HQValuesArea (km2)Area Change Rate (%)
--19902000201020181990–20002000–20102010–20181990–2018
V0–0.42386.592564.627822.6310,340.657.46205.0232.19333.28
IV0.4–0.610,064.969329.354851.871702.44−7.31−47.99−64.91−83.09
III0.6–0.71599.971858.391090.771057.616.15−41.31−3.04−33.90
II0.7–0.81607.191648.96945.913276.682.60−42.64246.41103.88
I0.8–1204.05211.8422.3888.83.82−89.44296.78−56.48
Table 6. Spatial autocorrelation descriptive statistics variables.
YearSpatial Autocorrelation Analysis of Habitat Quality
Moran’s IZ-Scorep-Value
19900.081669.74530.0000
20000.0796871.28730.0000
20100.123878.92060.0000
20180.166393.73600.0000
Publisher’s Note: MDPI stays neutral with regard to jurisdictional claims in published maps and institutional affiliations.

