
Characterization of Seasonal Phytoplankton Pigments and Functional Types around Offshore Island in the East/Japan Sea, Based on HPLC Pigment Analysis


Abstract
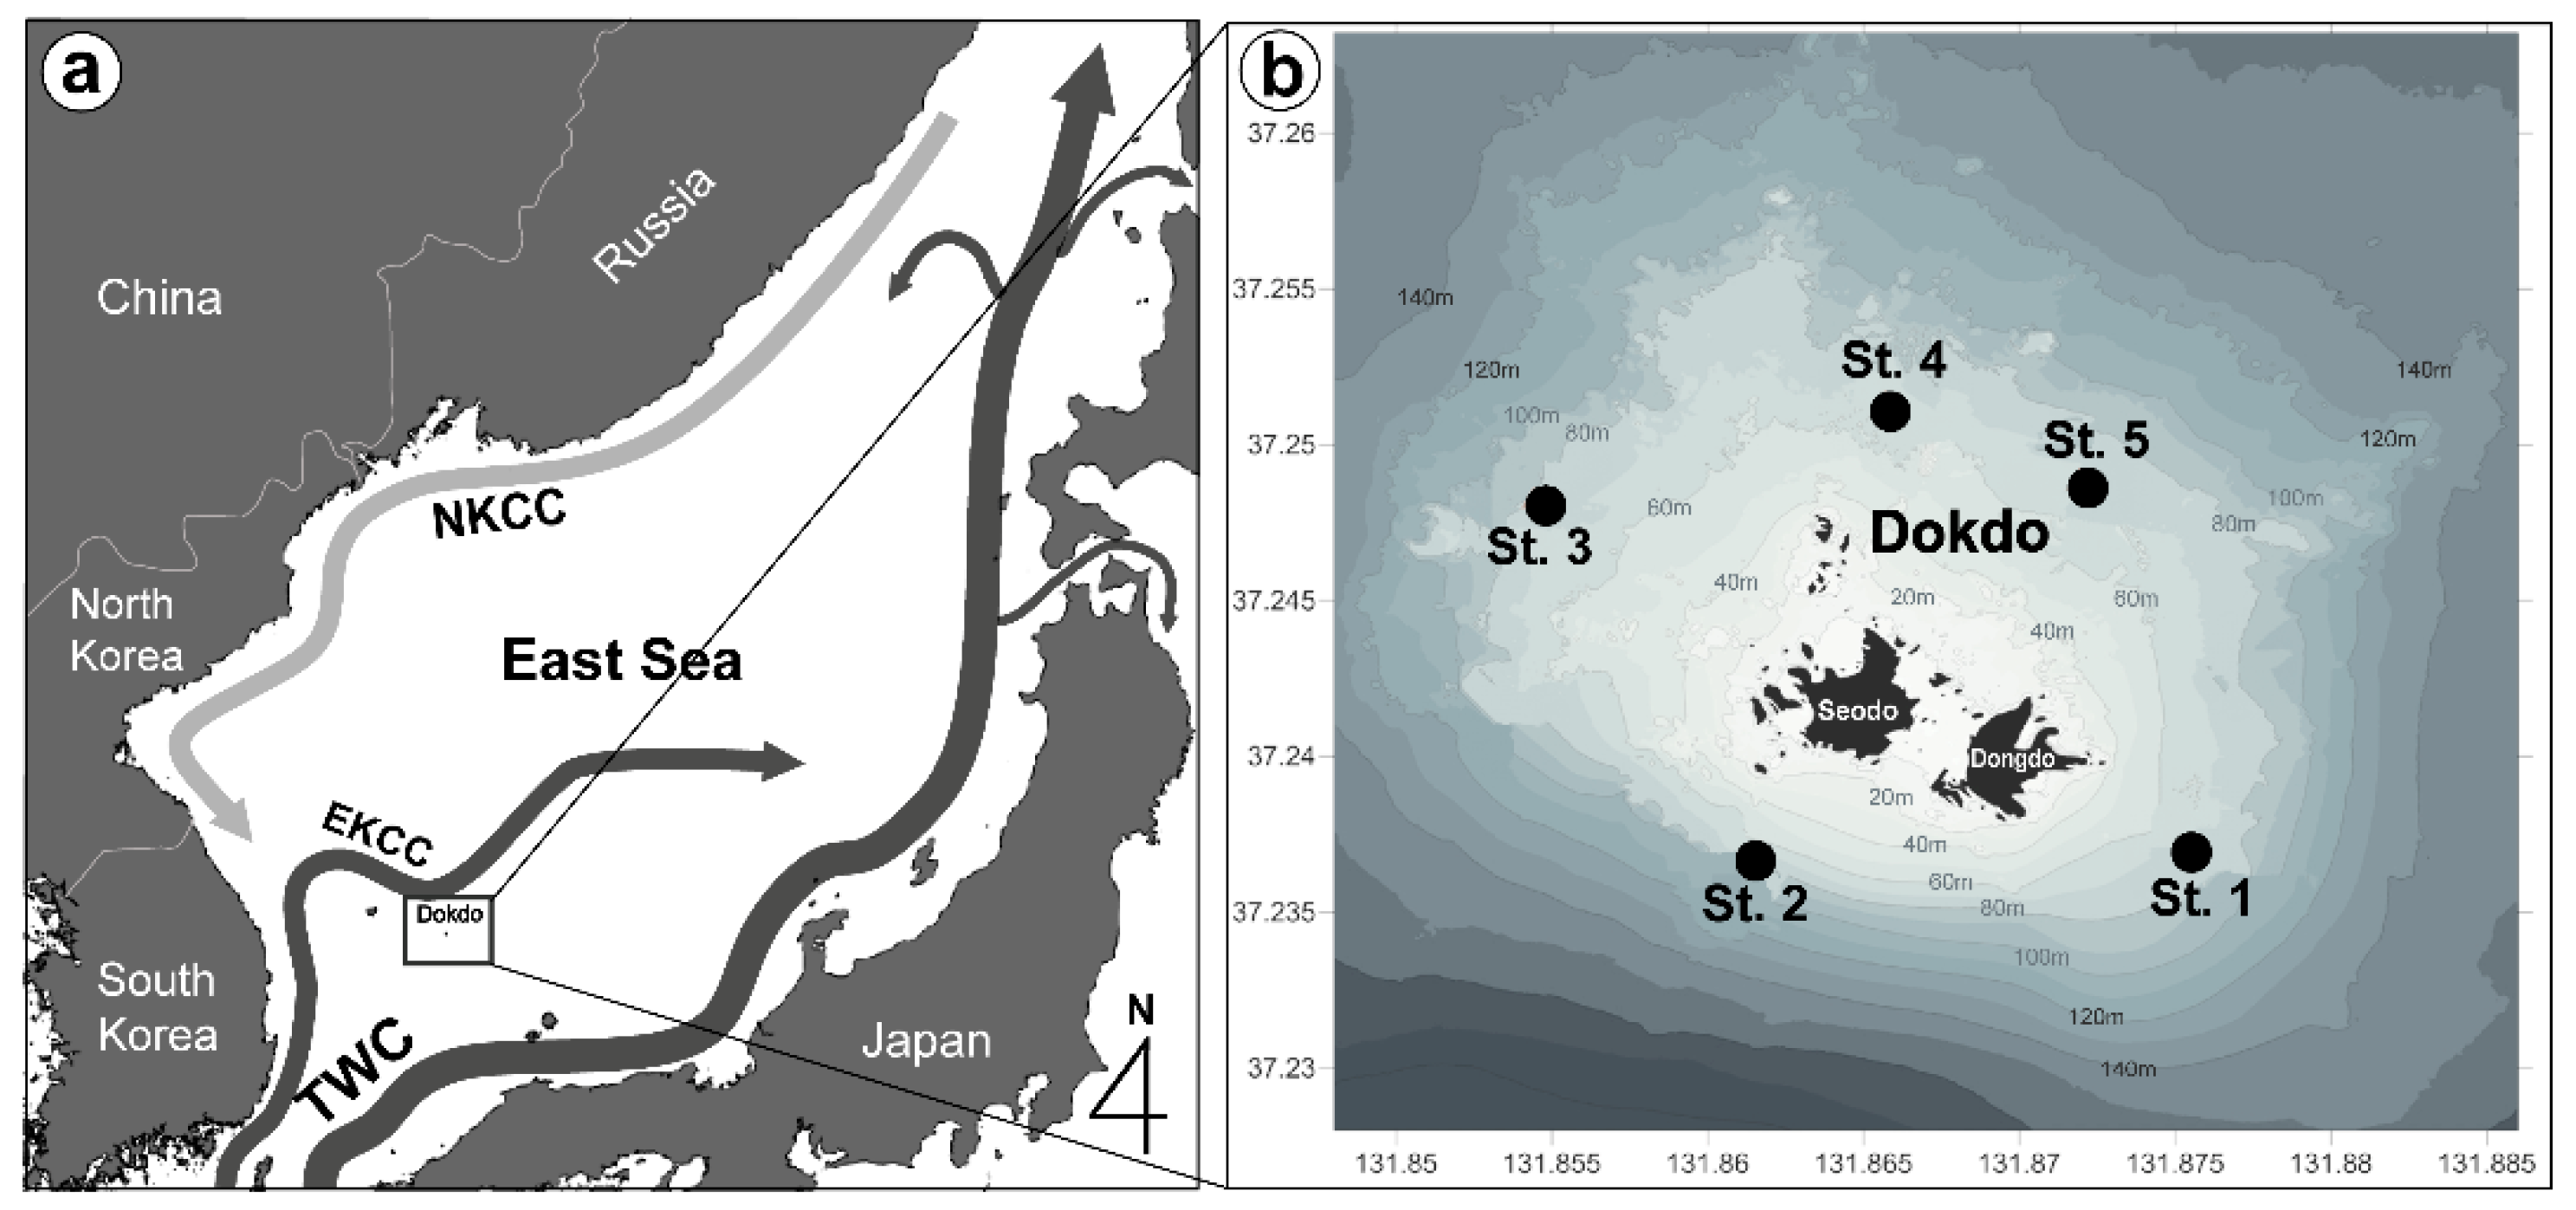
1. Introduction
2. Materials and Methods
3. Results
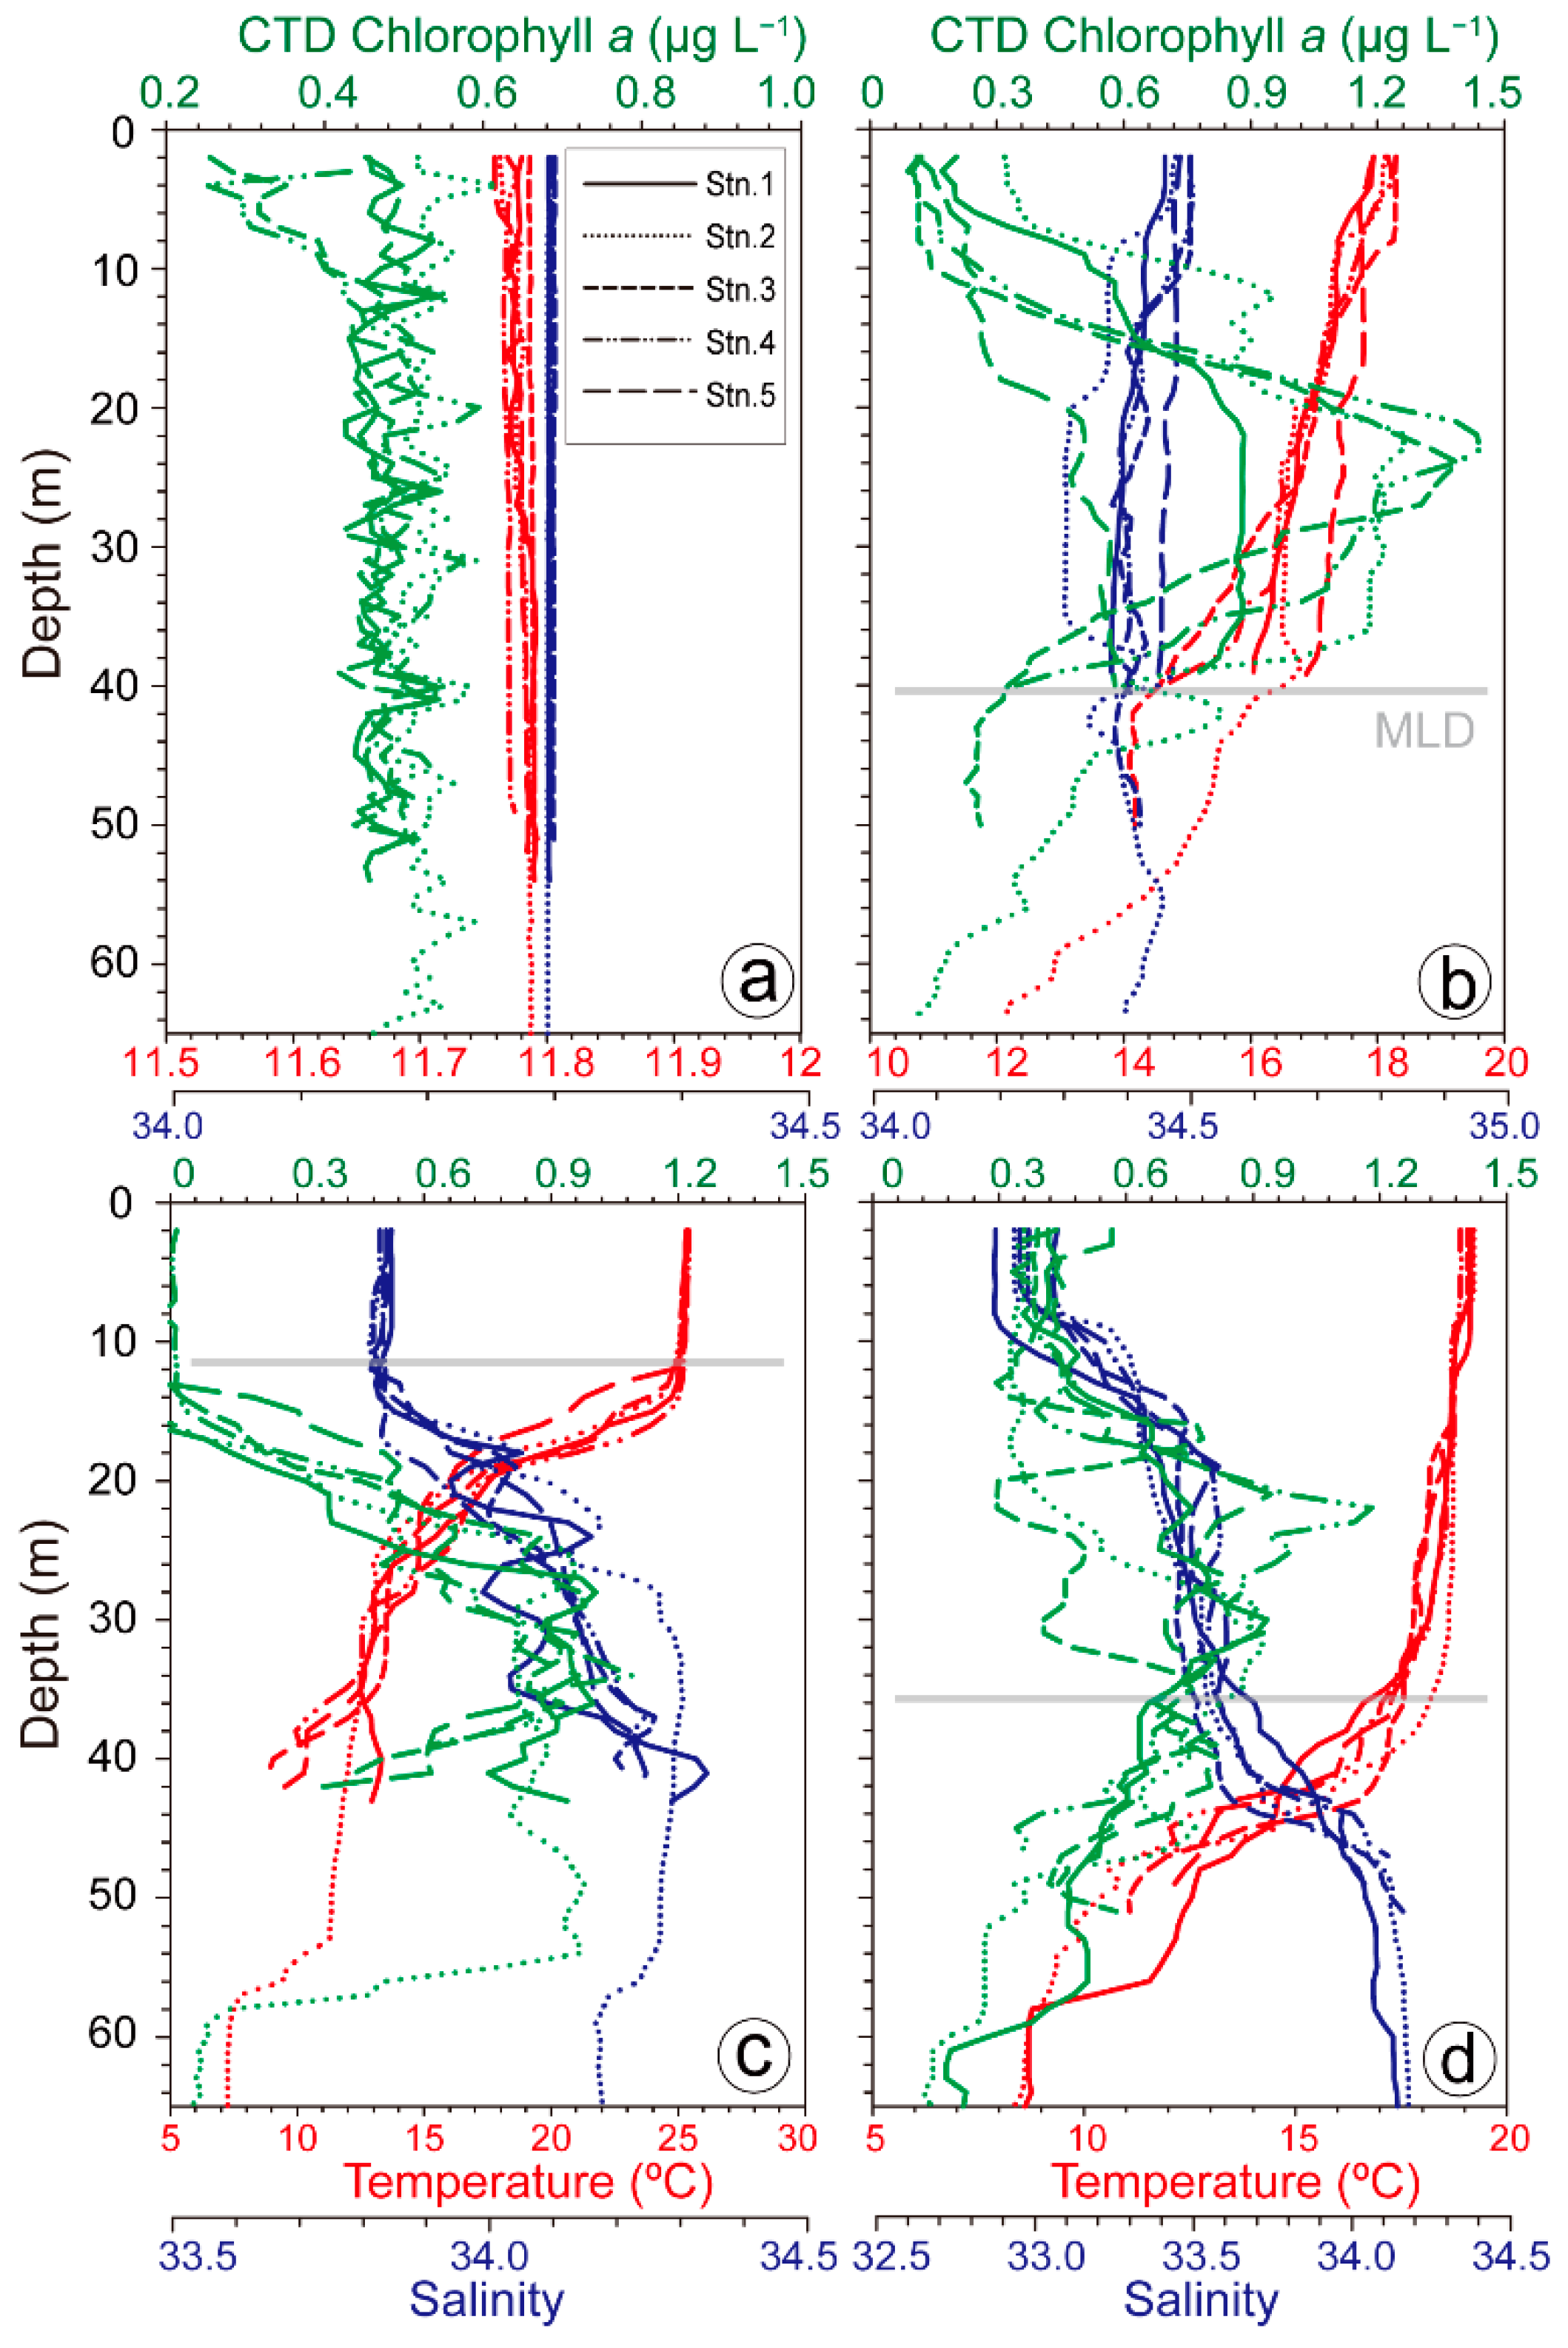
3.1. Hydrological Parameters
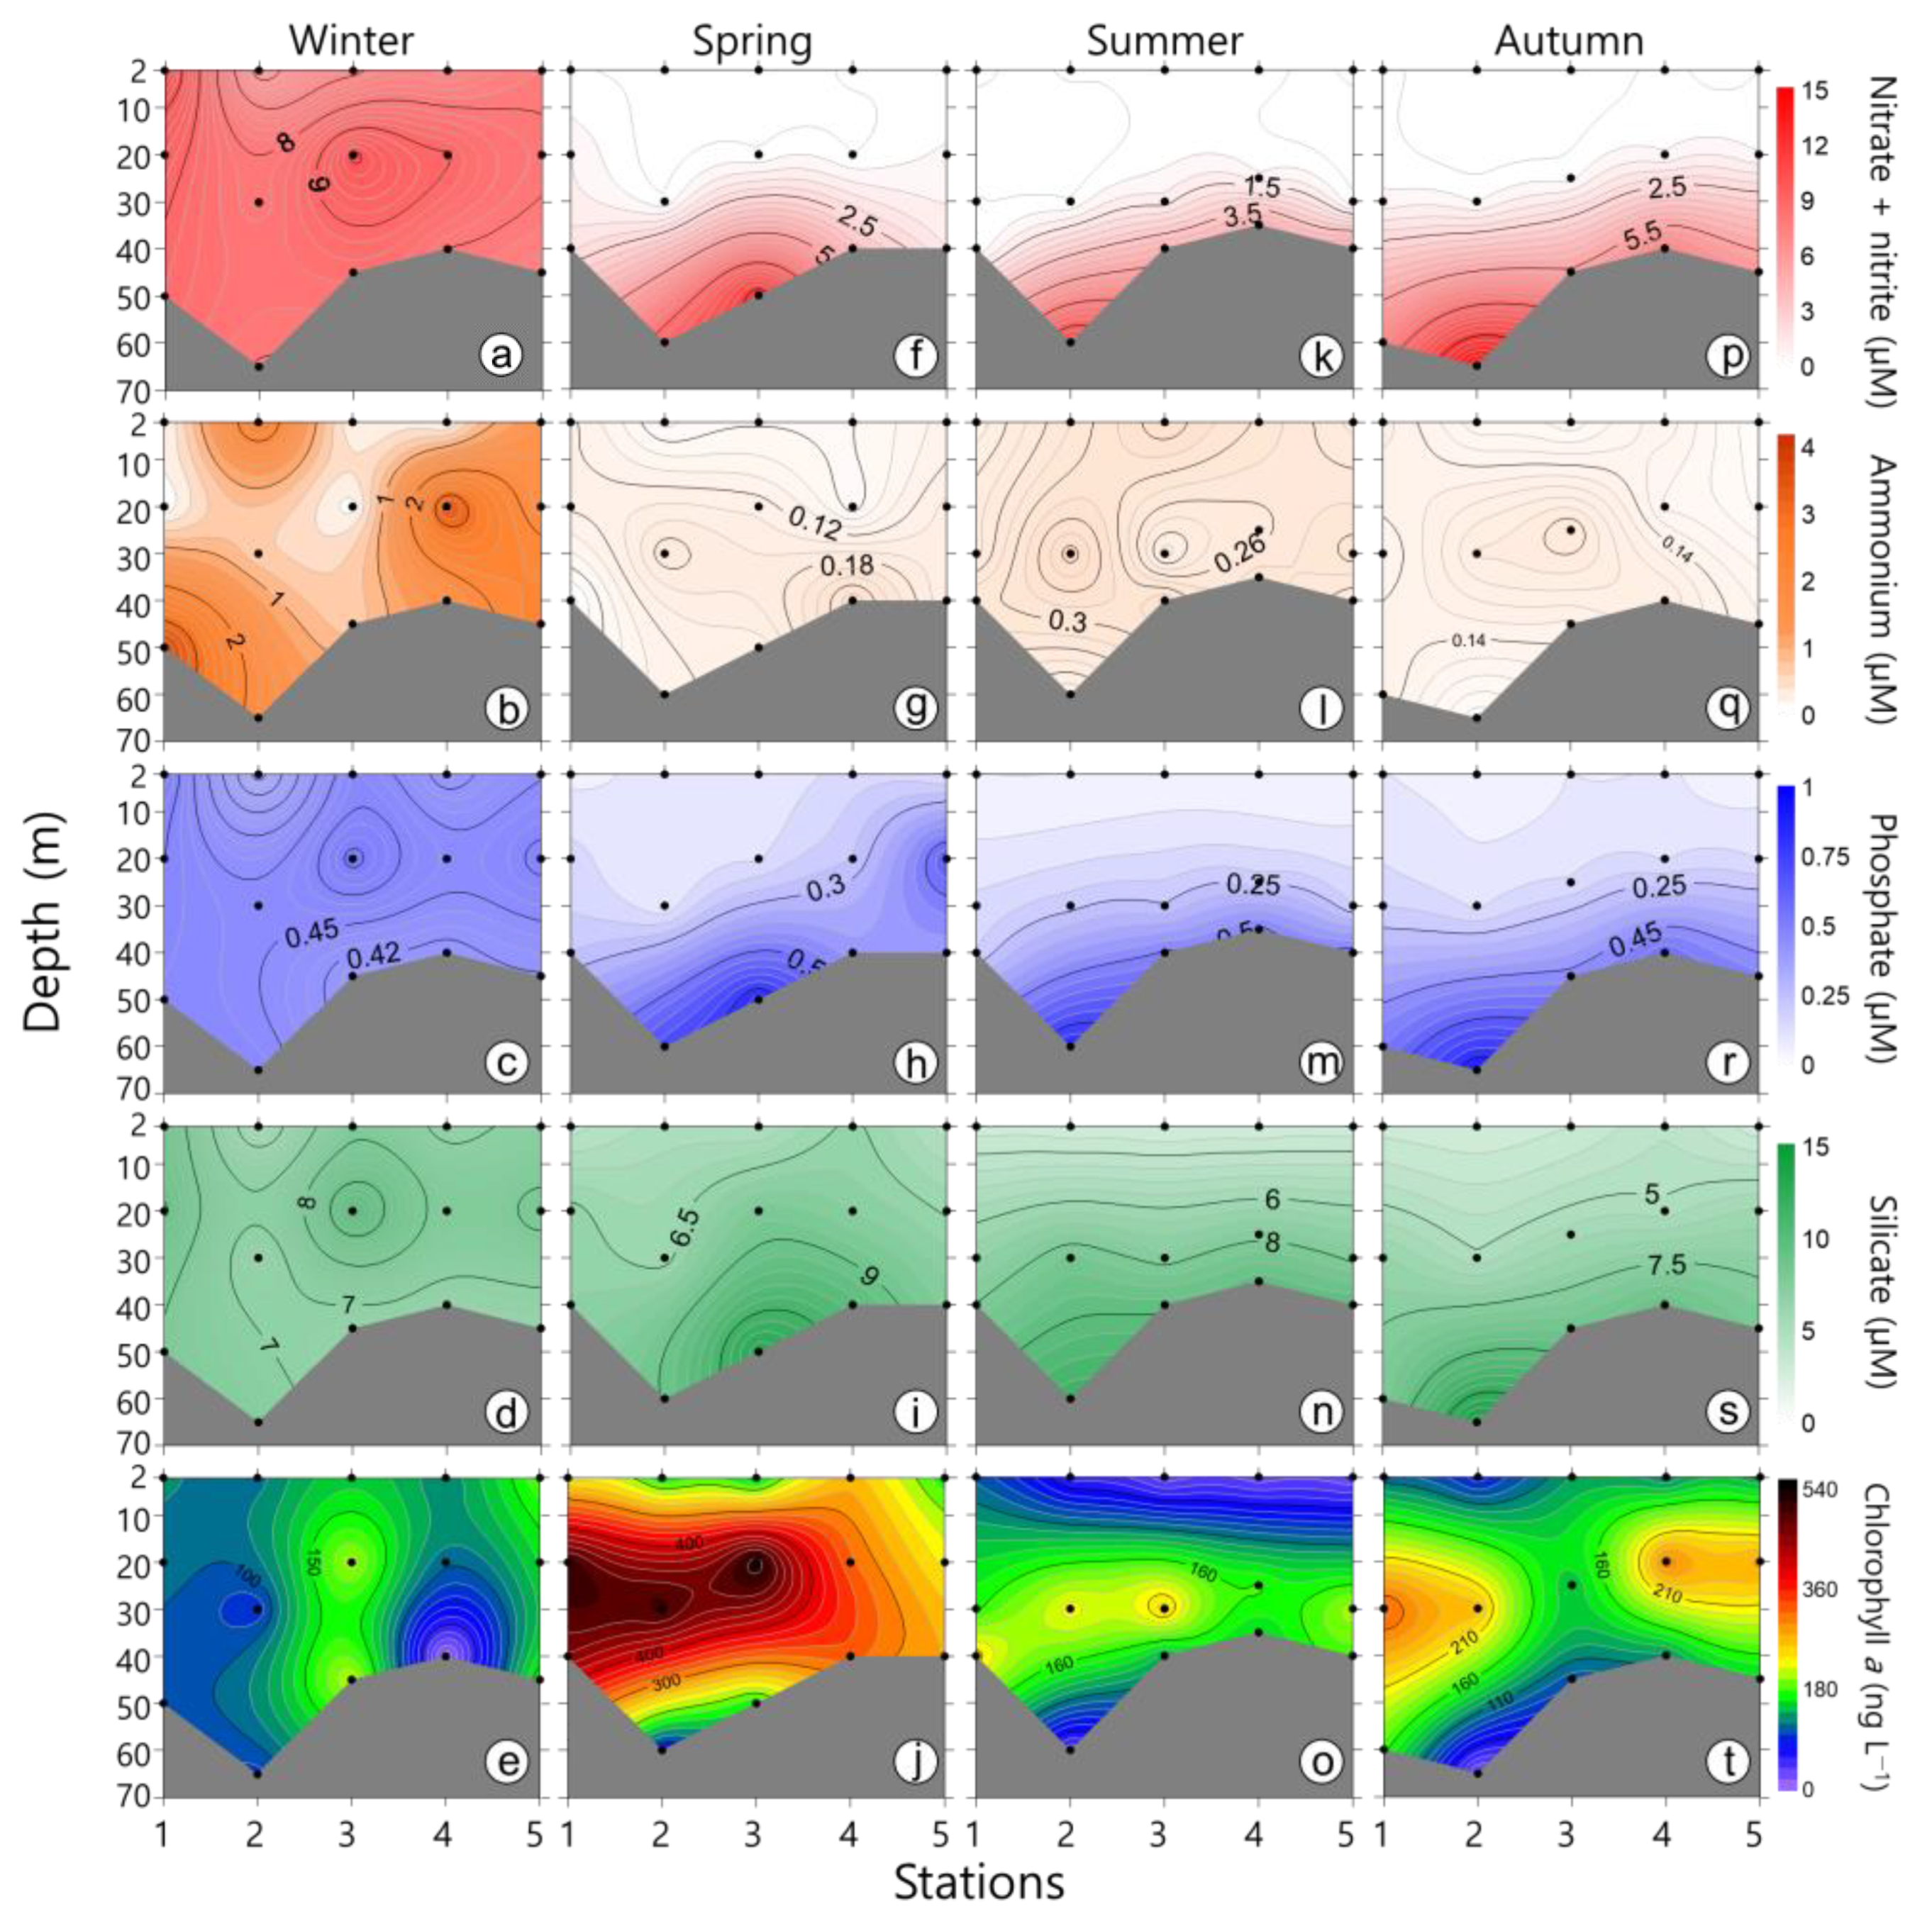
3.2. Nutrients
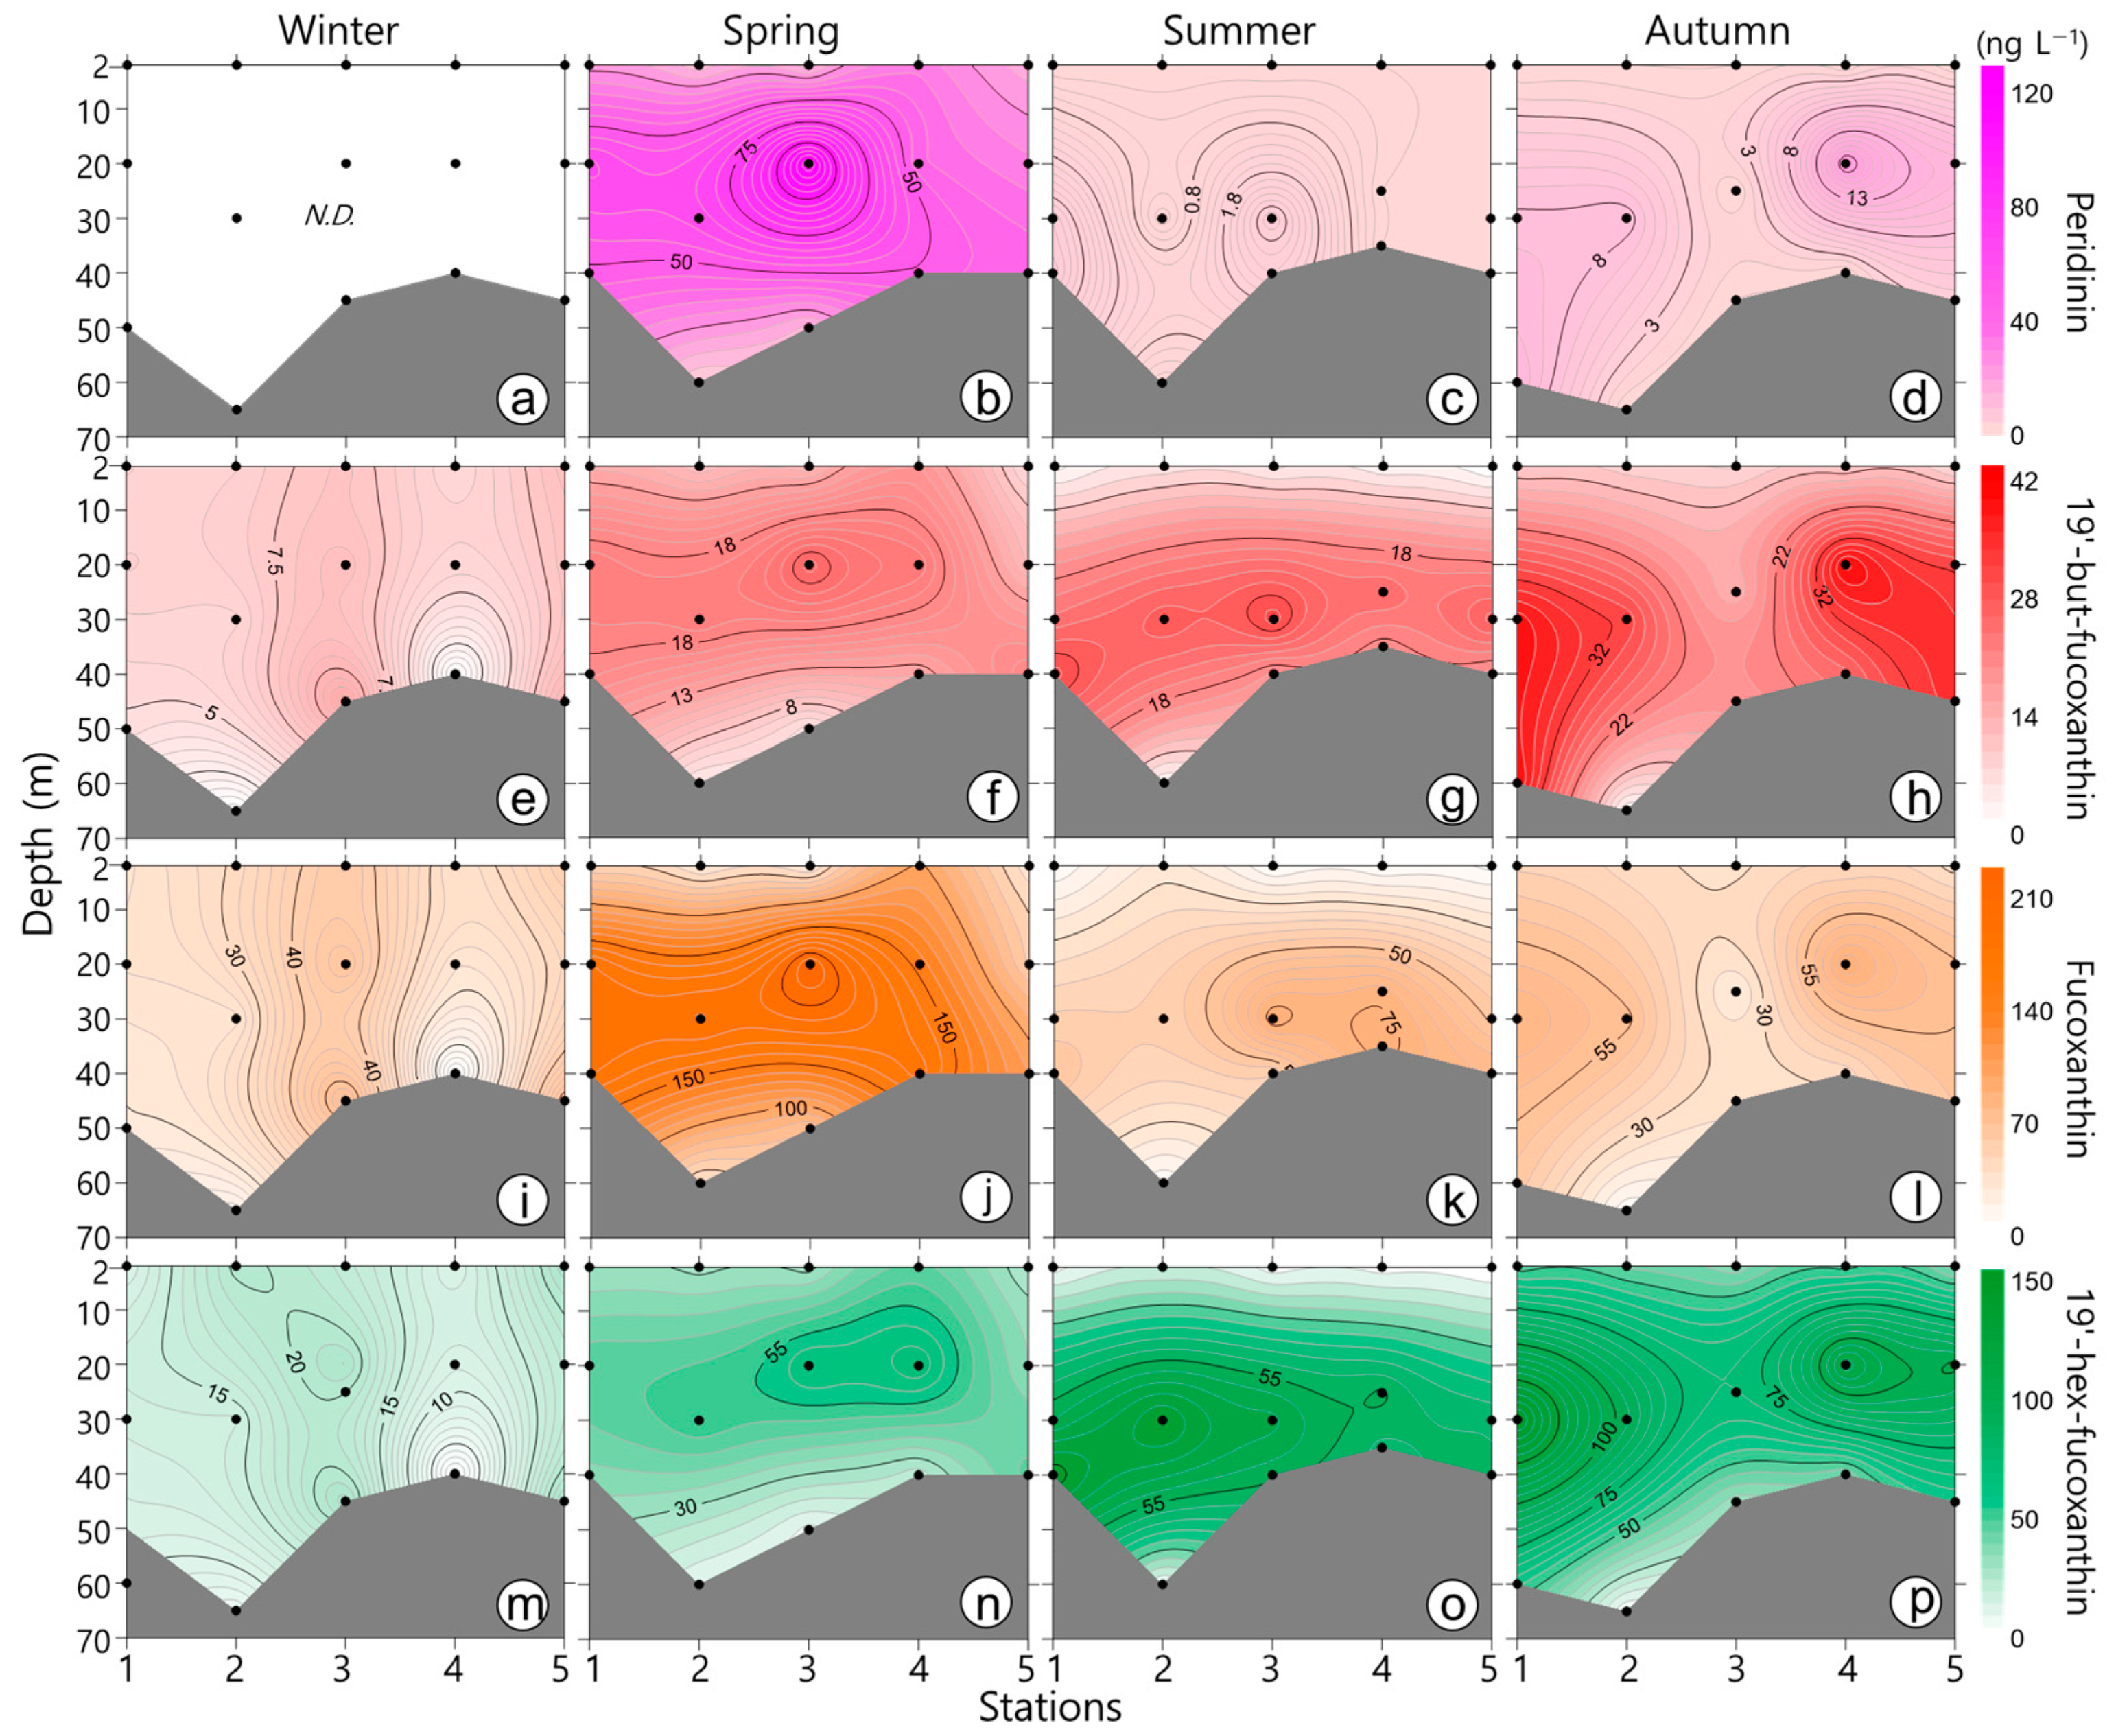
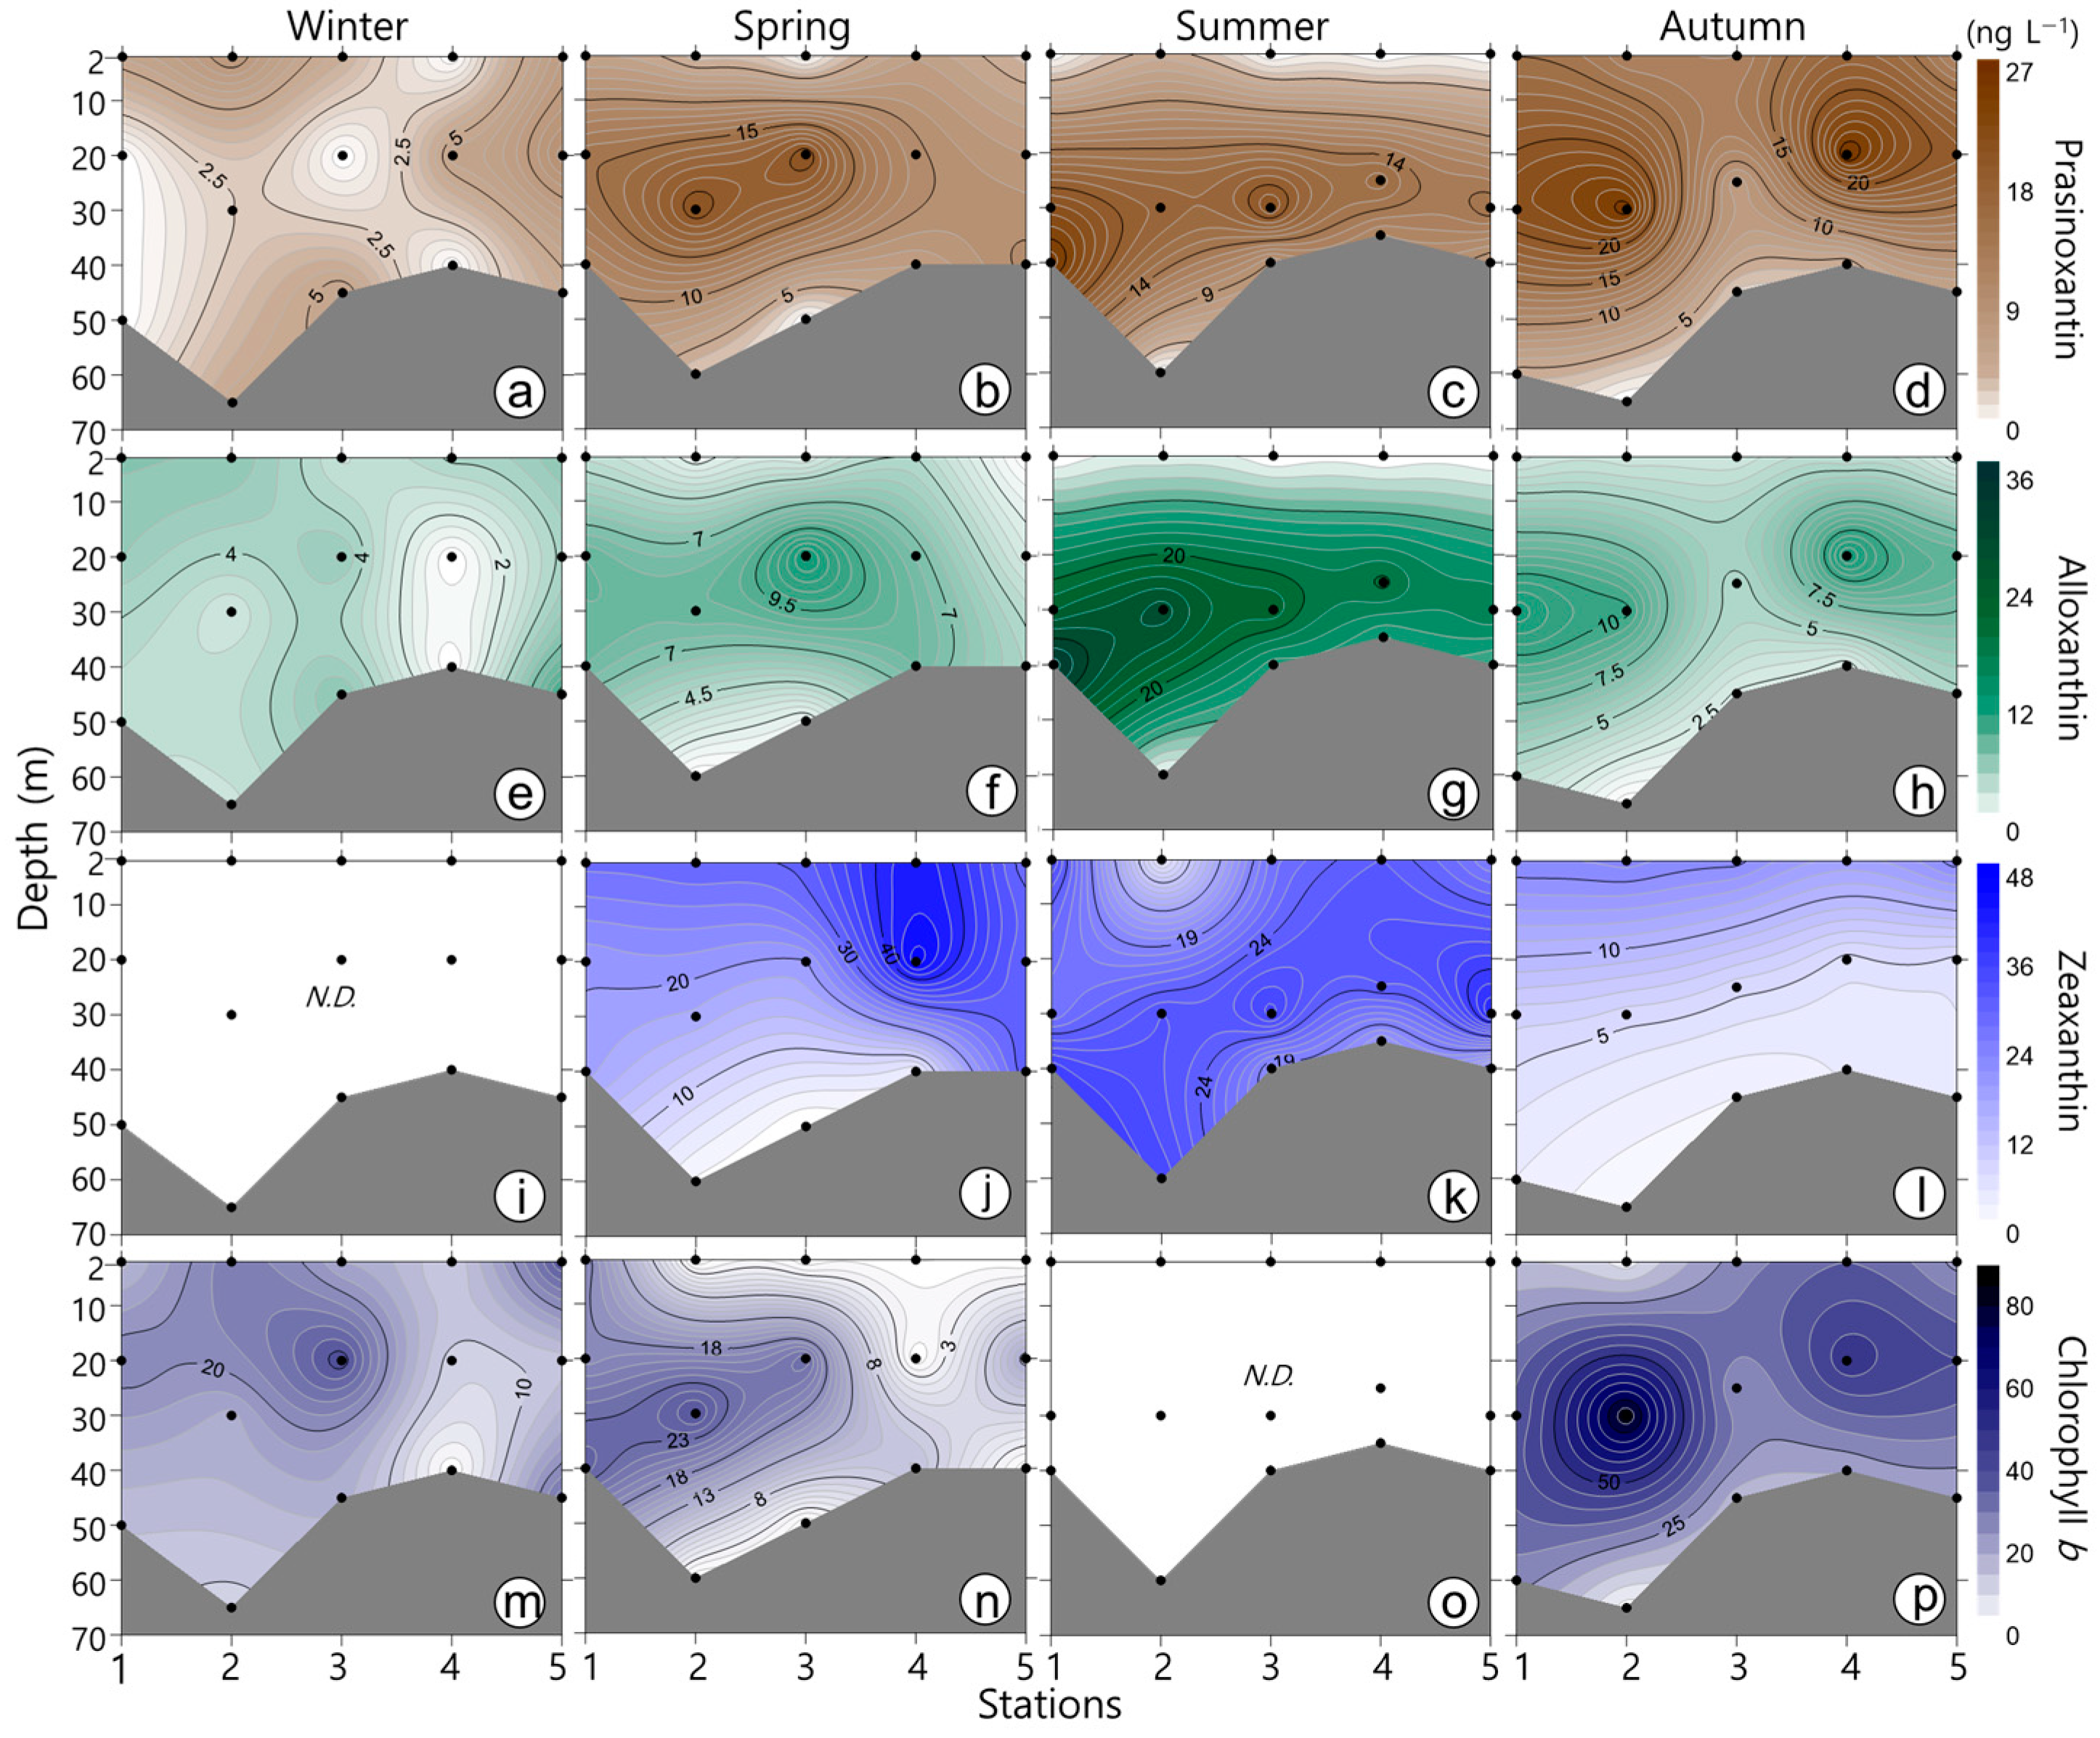
3.3. Phytoplankton Pigments
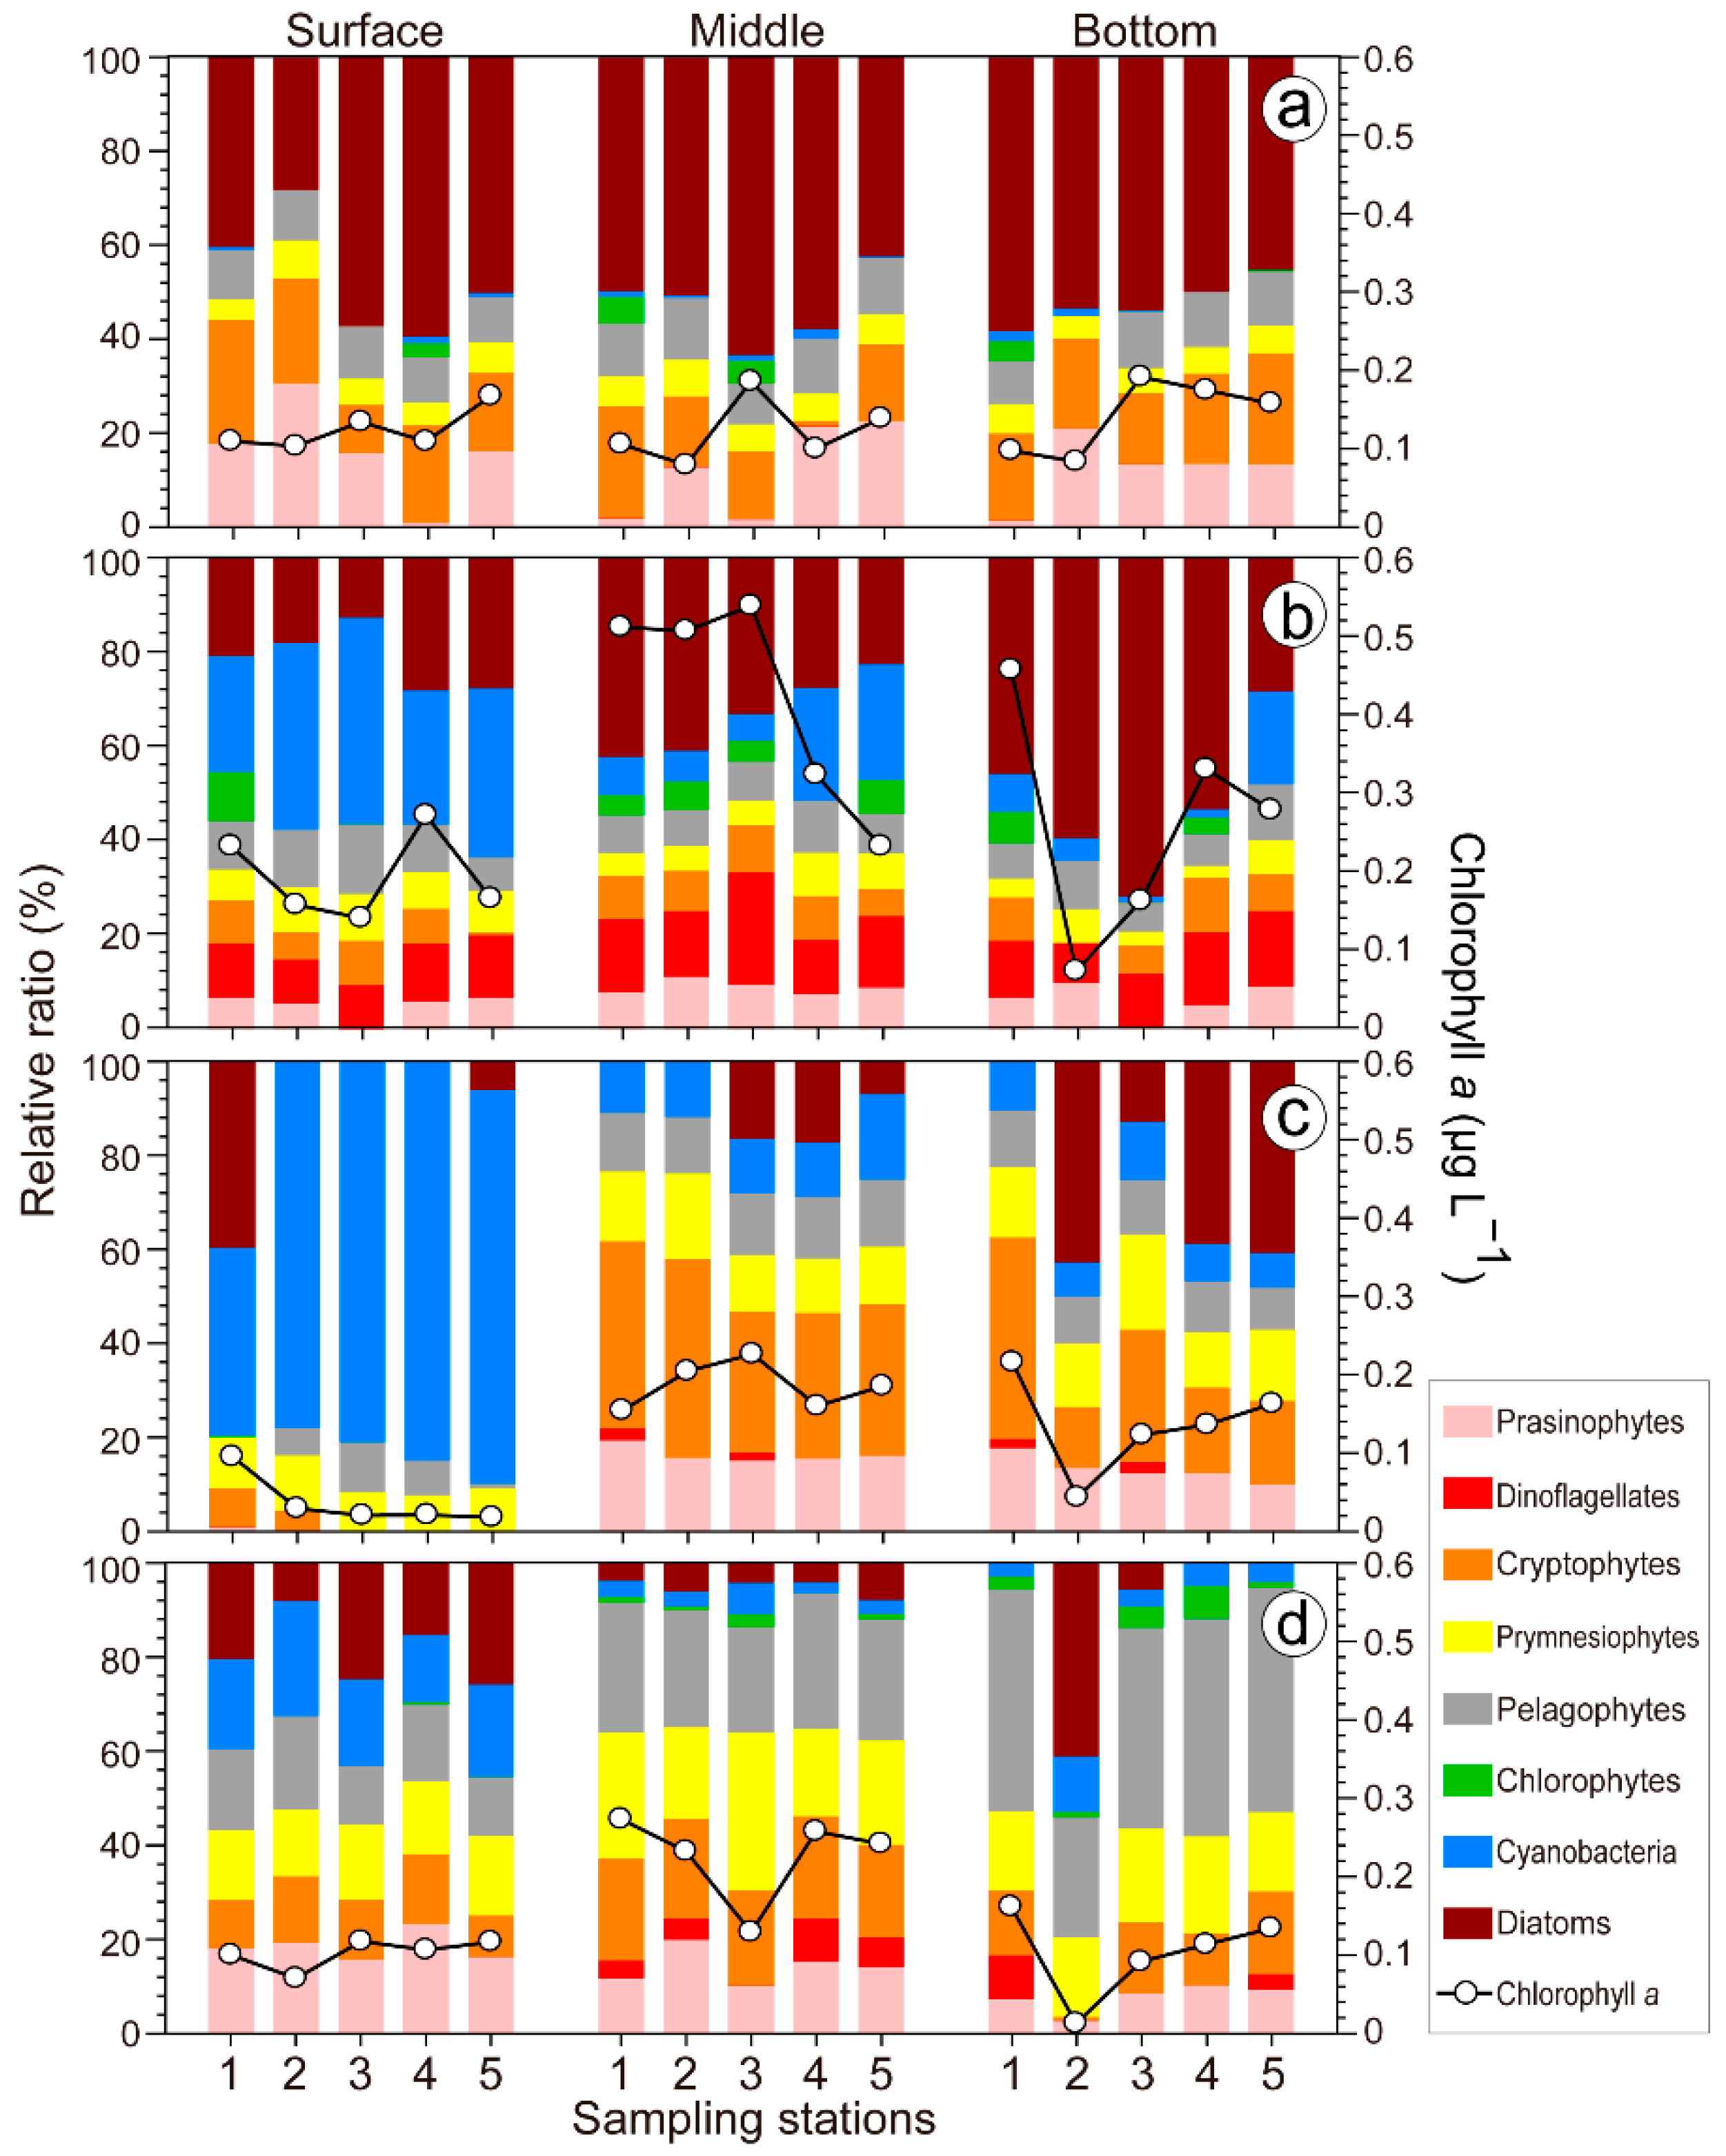
3.4. CHEMTAX Community Analysis
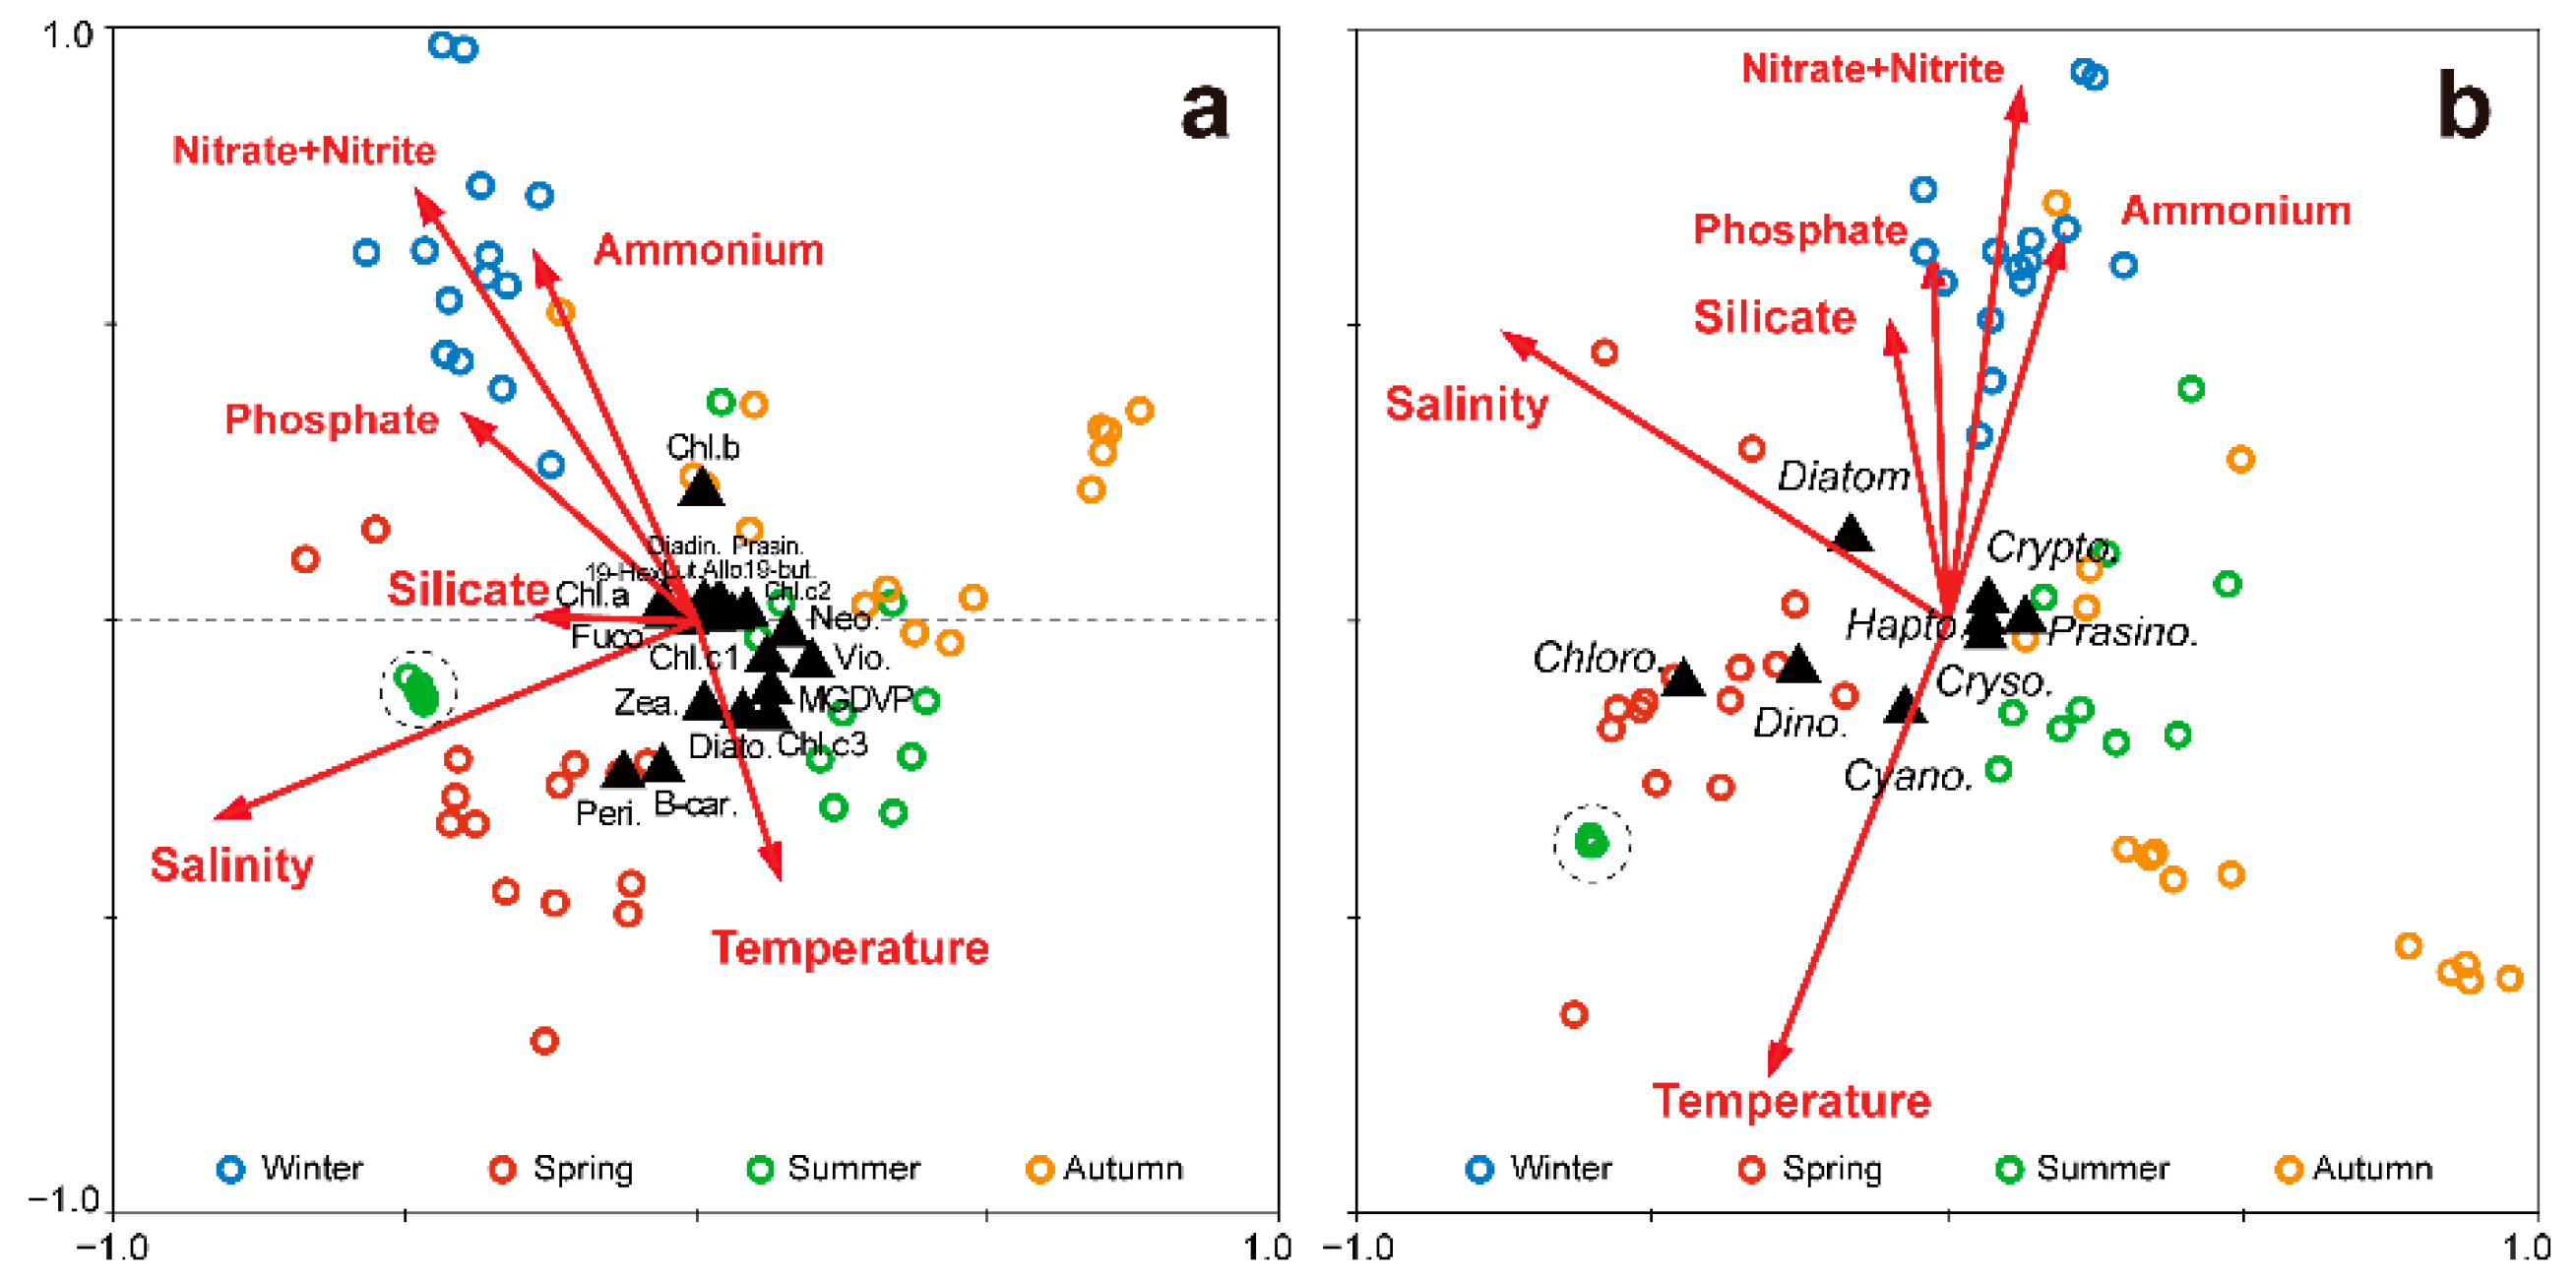
3.5. Canonical Correspondence Analysis of Phytoplankton and Environmental Parameters
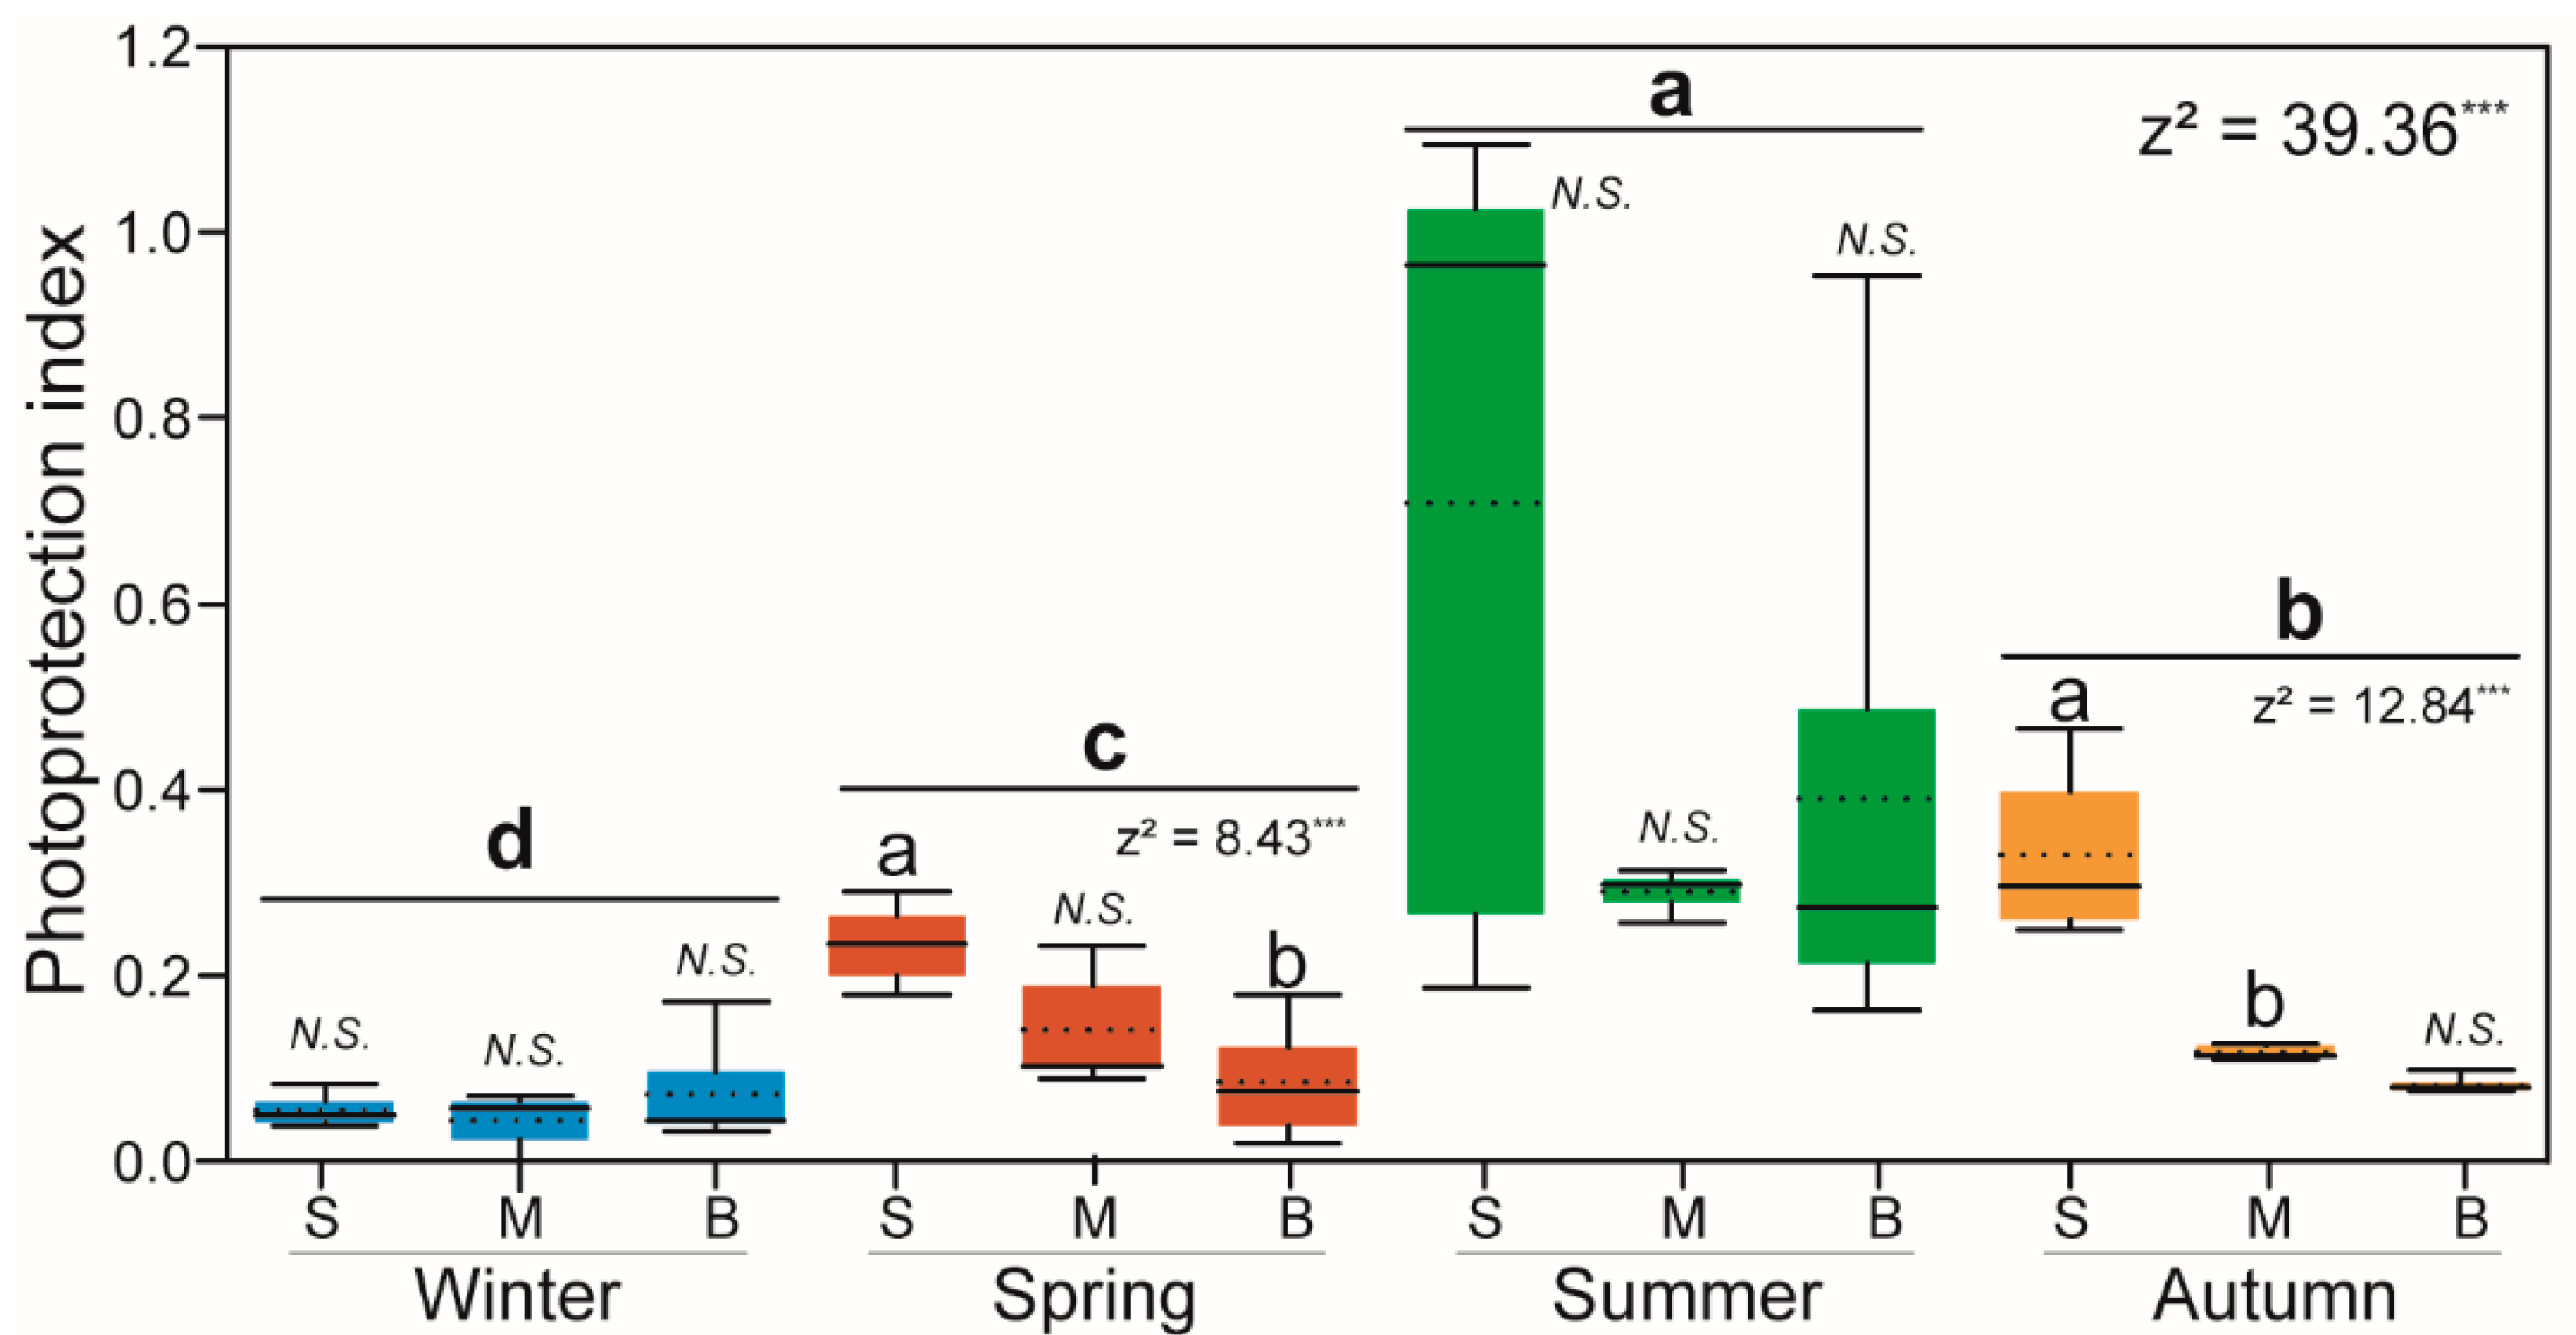
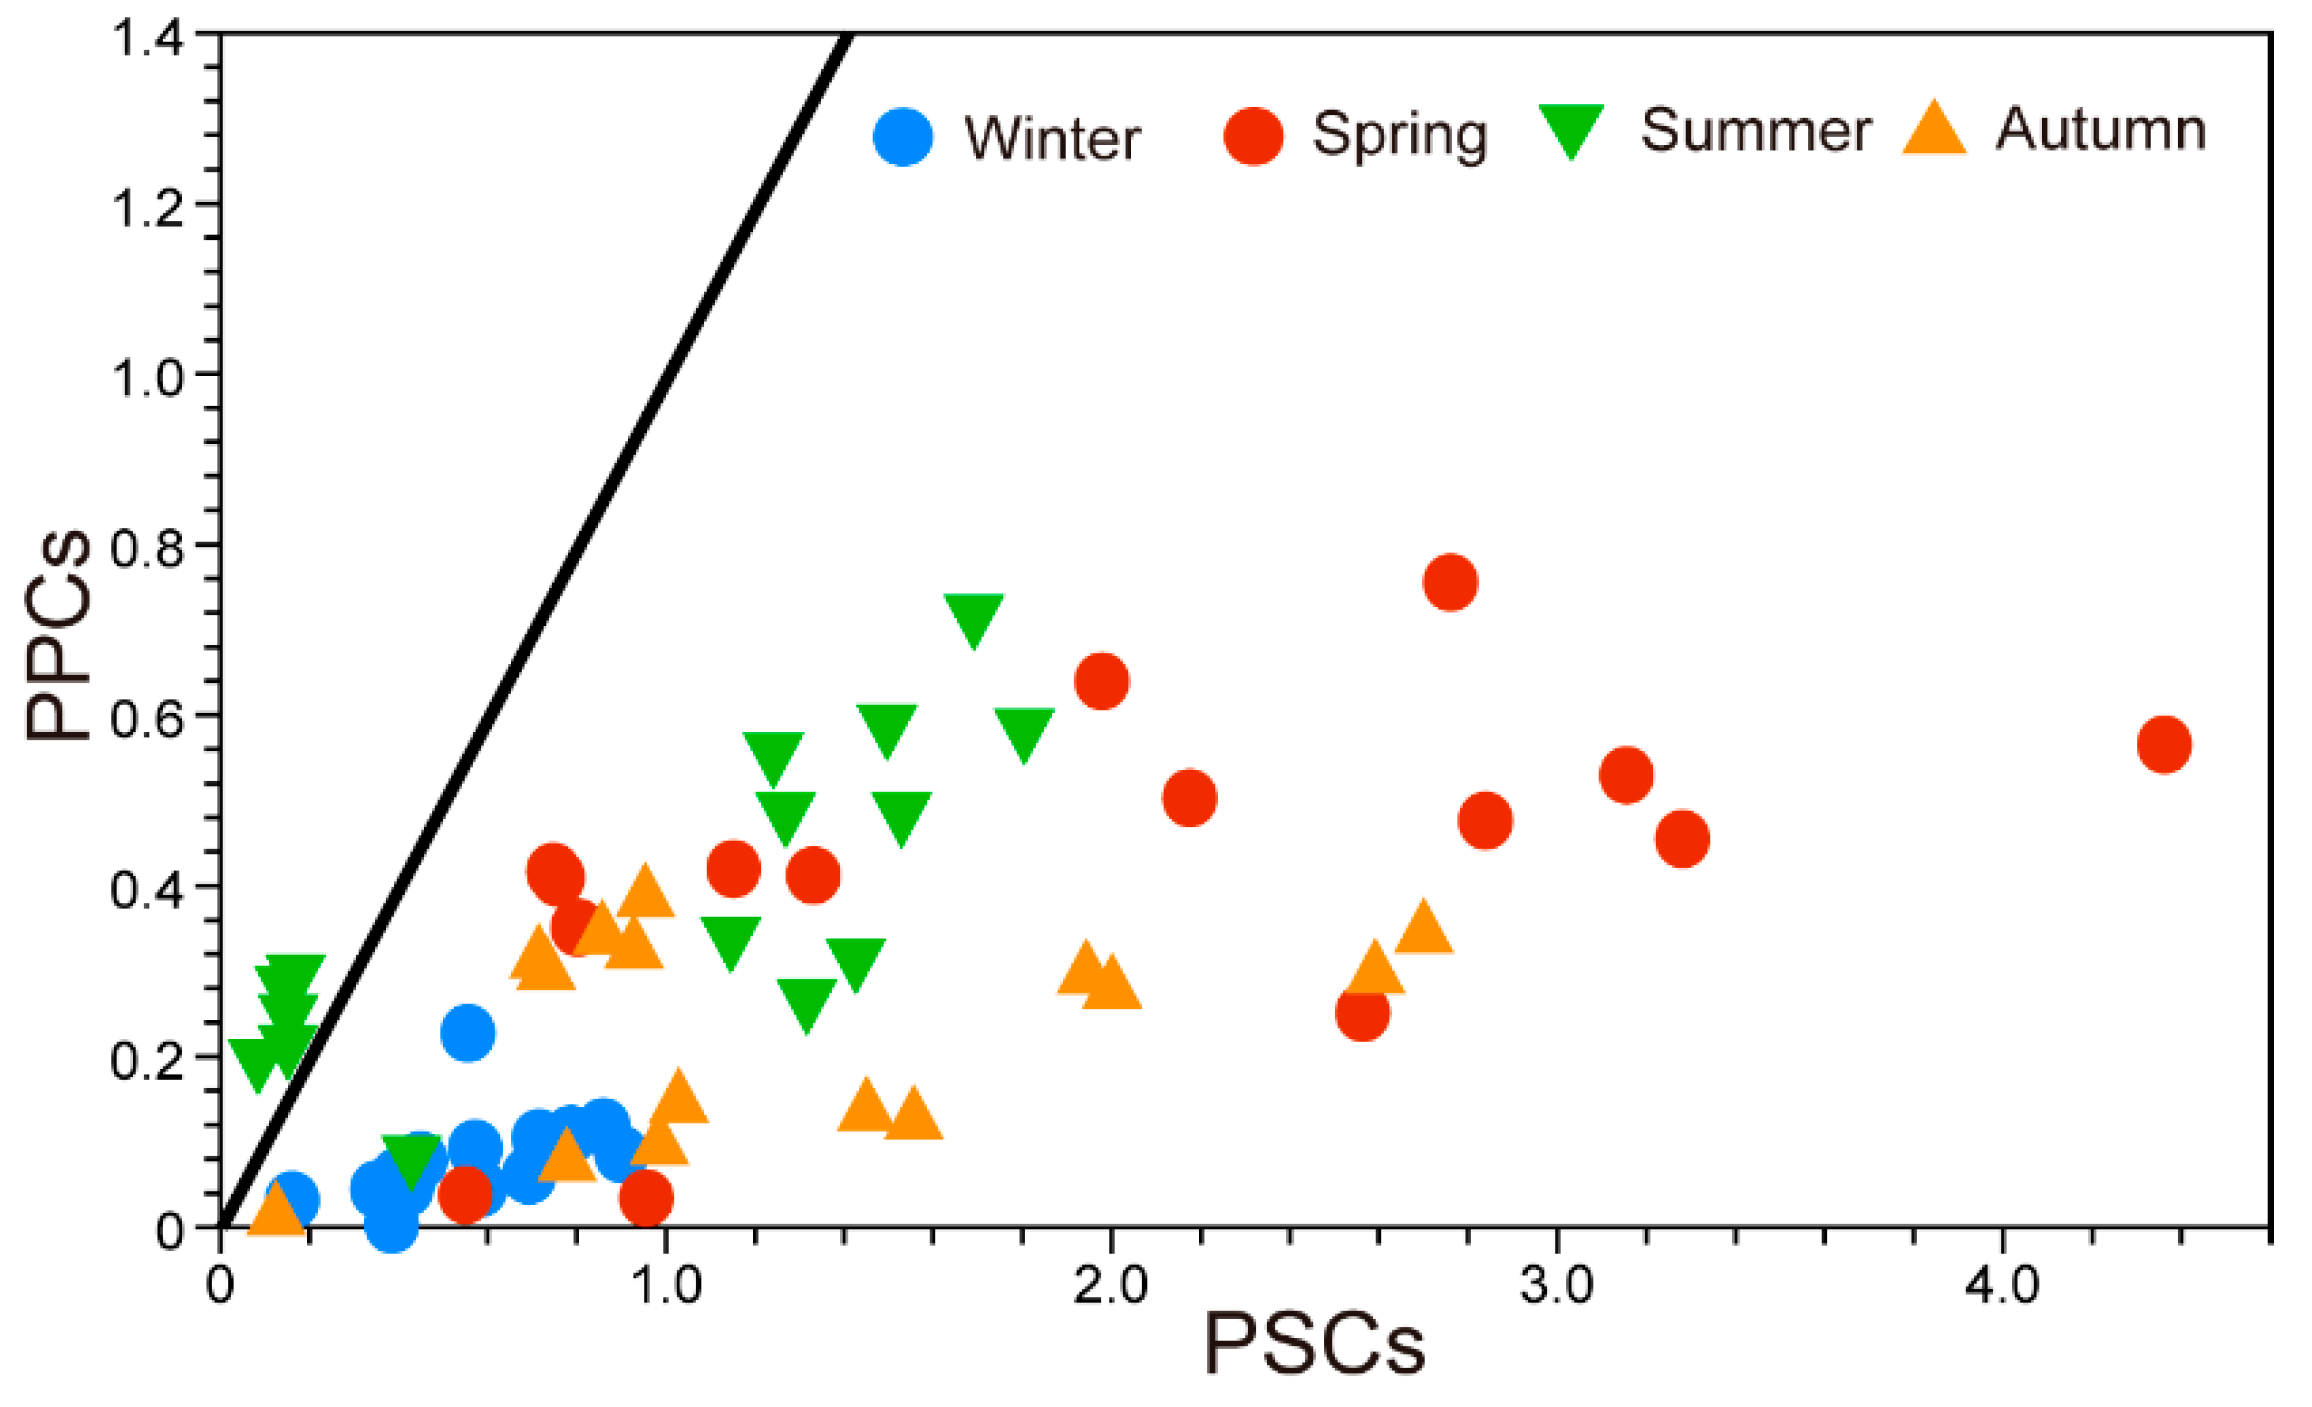
3.6. Pigment Indices and PFGs
4. Discussion
4.1. Environmental Factors
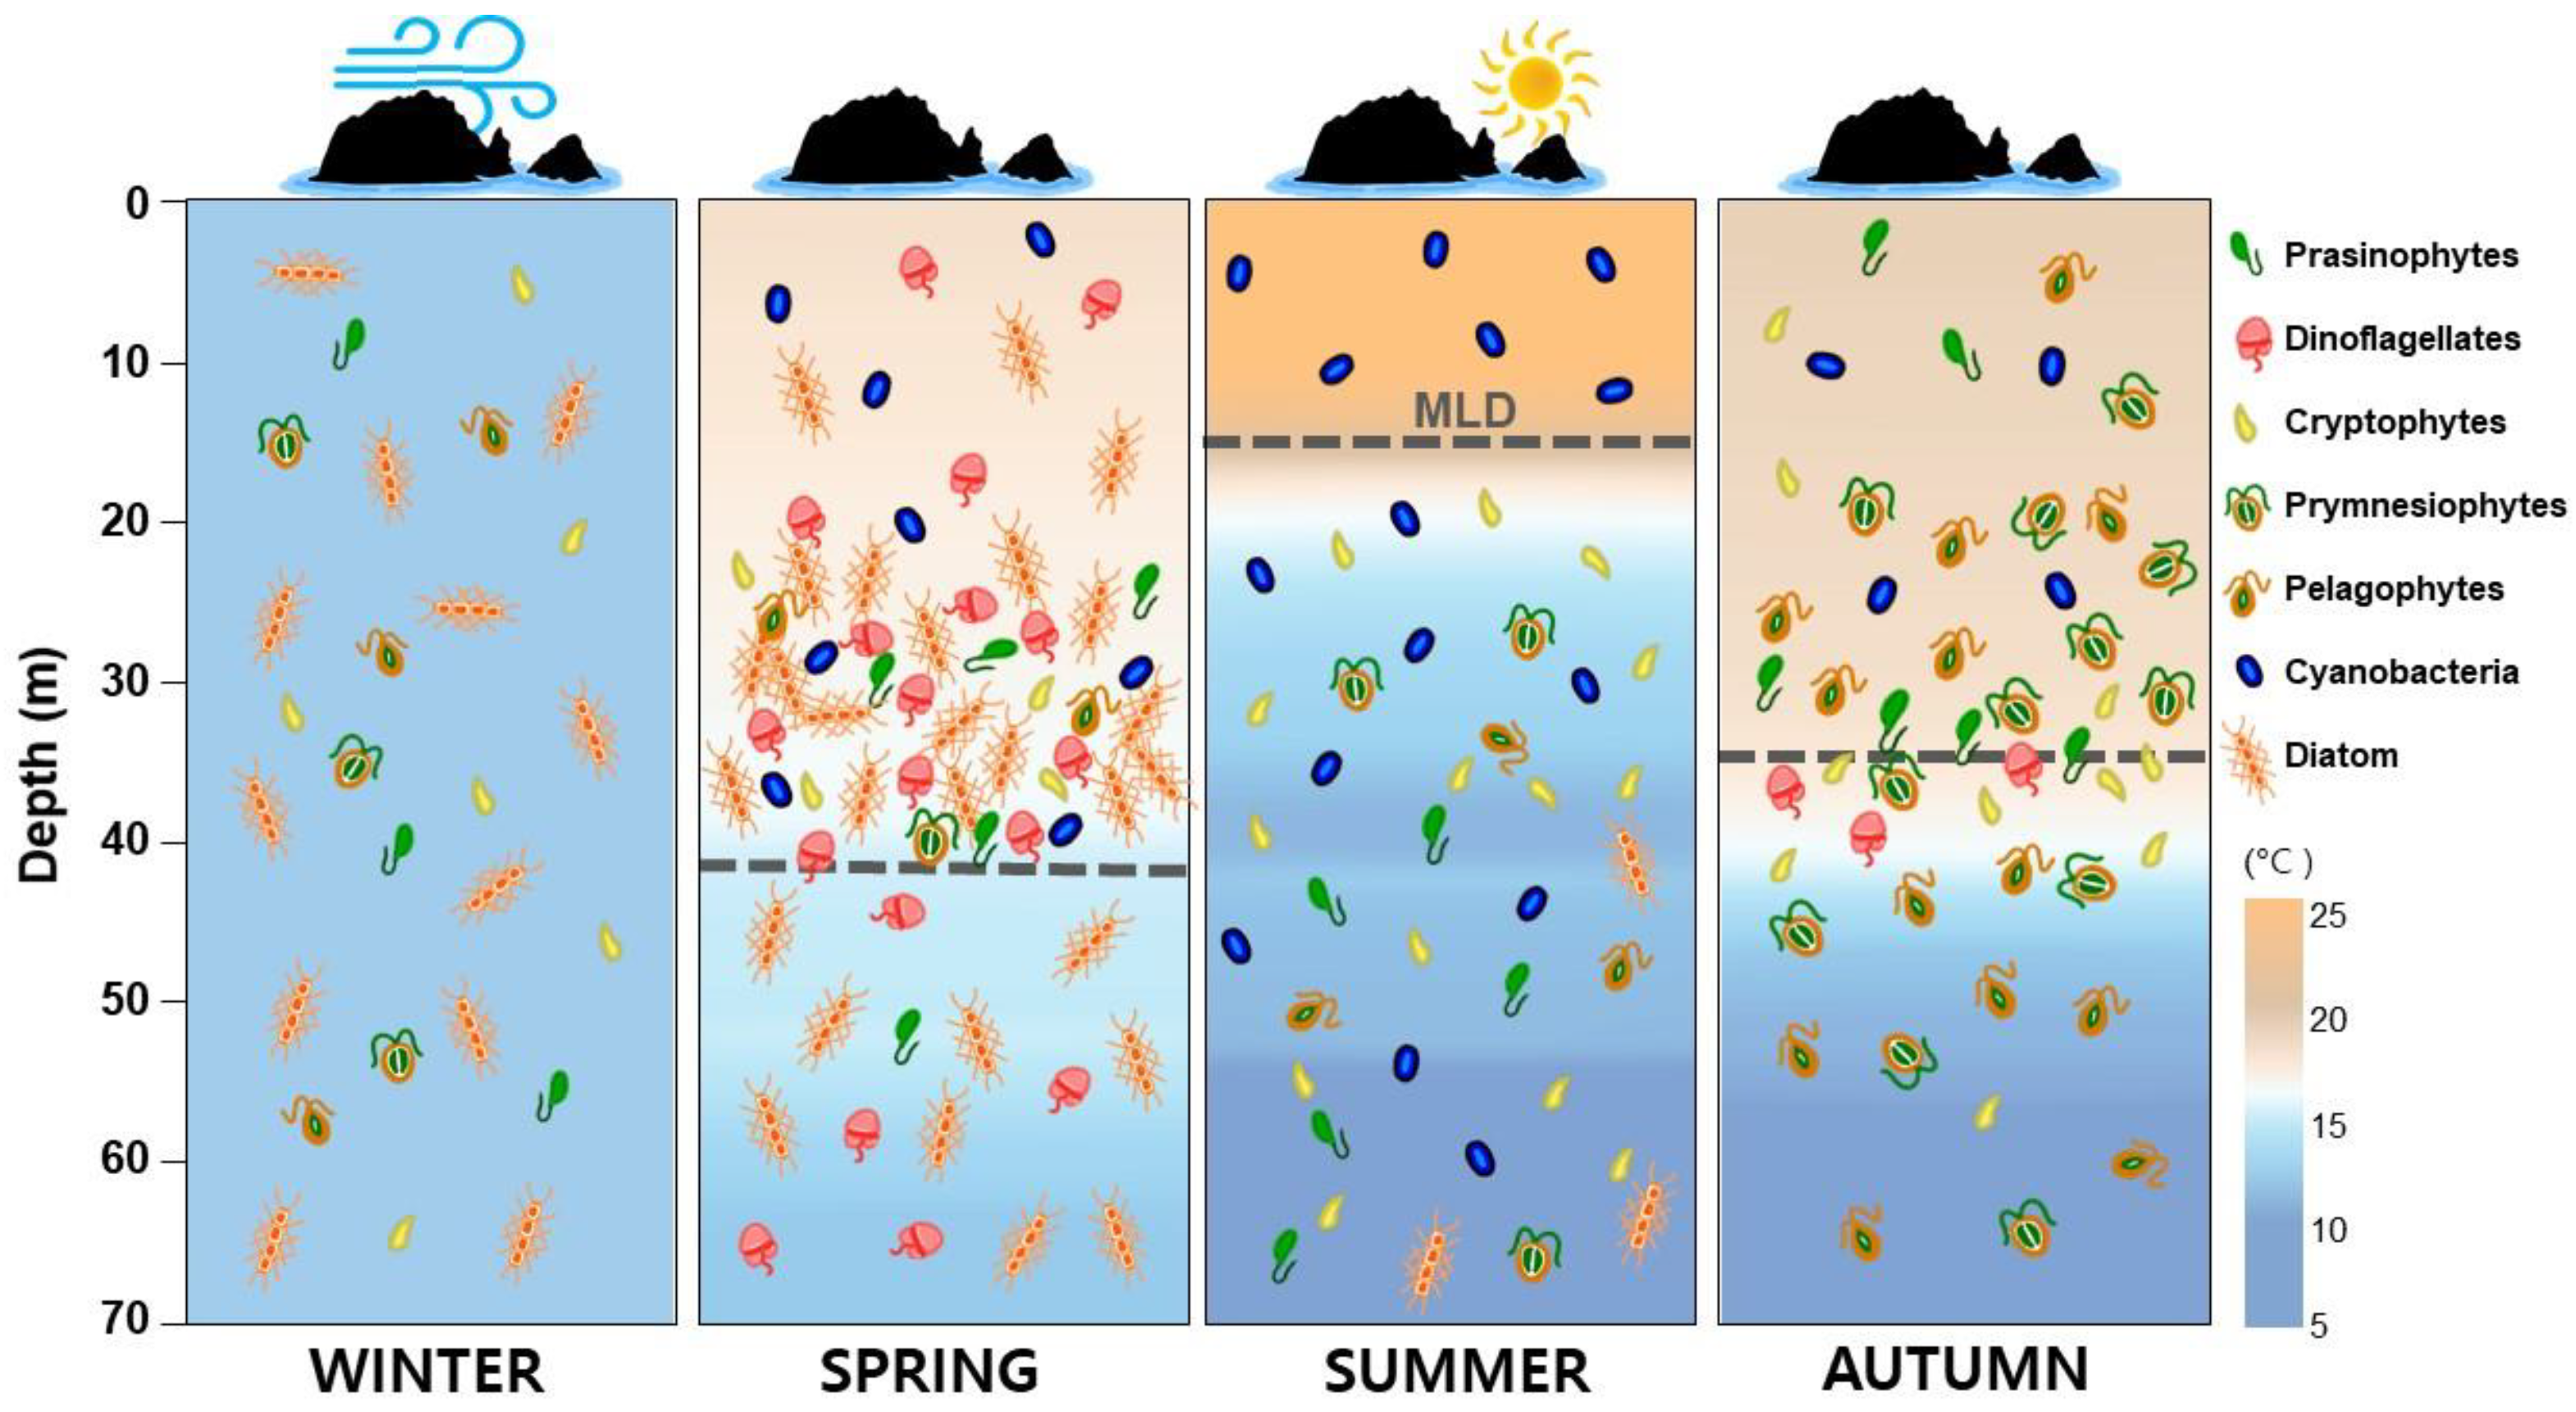
4.2. Seasonal Phytoplankton Dynamics
4.3. Phytoplankton Functional Groups
5. Conclusions
Supplementary Materials
Author Contributions
Funding
Institutional Review Board Statement
Informed Consent Statement
Conflicts of Interest
References
- Legendre, L.; Rassoulzadegan, F. Food-web mediated export of biogenic carbon in oceans: Hydrodynamic control. Mar. Ecol. Prog. Ser. 1996, 145, 179–193. [Google Scholar] [CrossRef]
- Doney, S.C. Plankton in a warmer world. Nature 2006, 444, 695–696. [Google Scholar] [CrossRef]
- Morán, X.A.G.; López-Urrutia, Á.; Calvo-Díaz, A.; Li, W.K. Increasing importance of small phytoplankton in a warmer ocean. Glob. Change Biol. 2010, 16, 1137–1144. [Google Scholar] [CrossRef]
- Baek, S.H.; Kim, D.; Kim, Y.O.; Son, M.; Kim, Y.J.; Lee, M.; Park, B.S. Seasonal changes in abiotic environmental conditions in the Busan coastal region (South Korea) due to the Nakdong River in 2013 and effect of these changes on phytoplankton communities. Cont. Shelf Res. 2019, 175, 116–126. [Google Scholar] [CrossRef]
- Malin, G.; Turner, S.M.; Liss, P.S. Sulfur: The plankton/climate connection. J. Phycol. 1992, 28, 590–597. [Google Scholar] [CrossRef]
- Isobe, A.; Isoda, Y. Circulation in the Japan Basin, the northern part of the Japan Sea. J. Oceanogr. 1997, 53, 373–382. [Google Scholar]
- Kim, T.; Yoon, J.-H. Seasonal variation of upper layer circulation in the northern part of the East/Japan Sea. Cont. Shelf Res. 2010, 30, 1283–1301. [Google Scholar] [CrossRef]
- Park, K.-A.; Ullman, D.S.; Kim, K.; Chung, J.Y.; Kim, K.-R. Spatial and temporal variability of satellite-observed Subpolar Front in the East/Japan Sea. Deep Sea Res. Part I Oceanogr. Res. Pap. 2007, 54, 453–470. [Google Scholar] [CrossRef]
- Lee, M.; Kim, J.H.; Kim, Y.-B.; Park, C.H.; Shin, K.; Baek, S.H. Specific oceanographic characteristics and phytoplankton responses influencing the primary production around the Ulleung Basin area in spring. Acta Oceanol. Sin. 2020, 39, 107–122. [Google Scholar] [CrossRef]
- Kim, T.-H.; Kim, G. Factors controlling the C: N: P stoichiometry of dissolved organic matter in the N-limited, cyanobacteria-dominated East/Japan Sea. J. Mar. Syst. 2013, 115, 1–9. [Google Scholar] [CrossRef]
- Song, S.J.; Park, J.; Ryu, J.; Rho, H.S.; Kim, W.; Khim, J.S. Biodiversity hotspot for marine invertebrates around the Dokdo, East Sea, Korea: Ecological checklist revisited. Mar. Pollut. Bull. 2017, 119, 162–170. [Google Scholar] [CrossRef]
- Baek, S.H.; Lee, M.; Kim, Y.B. Spring phytoplankton community response to an episodic windstorm event in oligotrophic waters offshore from the Ulleungdo and Dokdo islands, Korea. J. Sea Res. 2018, 132, 1–14. [Google Scholar] [CrossRef]
- Yoo, S.; Park, J. Why is the southwest the most productive region of the East Sea/Sea of Japan? J. Mar. Syst. 2009, 78, 301–315. [Google Scholar] [CrossRef]
- Kim, D.-S.; Kim, K.-H.; Shim, J.-H.; Yoo, S.-J. The effect of anticyclonic eddy on nutrients and chlorophyll during spring and summer in the Ulleung Basin, East Sea. Sea 2007, 12, 280–286. [Google Scholar]
- Kwak, J.H.; Hwang, J.; Choy, E.J.; Park, H.J.; Kang, D.-J.; Lee, T.; Chang, K.-I.; Kim, K.-R.; Kang, C.-K. High primary productivity and f-ratio in summer in the Ulleung basin of the East/Japan Sea. Deep Sea Res. Part I Oceanogr. Res. Pap. 2013, 79, 74–85. [Google Scholar] [CrossRef]
- Lee, H.W.; Hong, B.K.; Sohn, M.H.; Chun, Y.Y.; Lee, D.W.; Choi, Y.M.; Hwang, K.S. Seasonal variation in species composition of fish collected by trammel net around Dokdo, East Sea of Korea. Korean J. Fish Aquat. Sci. 2010, 43, 693–704. [Google Scholar]
- Tester, P.A.; Geesey, M.E.; Guo, C.; Paerl, H.W.; Millie, D.F. Evaluating phytoplankton dynamics in the Newport River estuary (North Carolina, USA) by HPLC-derived pigment profiles. Mar. Ecol. Prog. Ser. 1995, 124, 237–245. [Google Scholar] [CrossRef]
- Wright, S.; Jeffrey, S.; Mantoura, R. Phytoplankton Pigments in Oceanography: Guidelines to Modern Methods; Unesco Publishing: Paris, France, 2005. [Google Scholar]
- Barlow, R.; Kyewalyanga, M.; Sessions, H.; Van den Berg, M.; Morris, T. Phytoplankton pigments, functional types, and absorption properties in the Delagoa and Natal Bights of the Agulhas ecosystem. Estuar. Coast. Shelf Sci. 2008, 80, 201–211. [Google Scholar] [CrossRef]
- Mendes, C.R.B.; Kerr, R.; Tavano, V.M.; Cavalheiro, F.A.; Garcia, C.A.E.; Dessai, D.R.G.; Anilkumar, N. Cross-front phytoplankton pigments and chemotaxonomic groups in the Indian sector of the Southern Ocean. Deep Sea Res. Part II Top. Stud. Oceanogr. 2015, 118, 221–232. [Google Scholar] [CrossRef]
- Mackey, M.; Mackey, D.; Higgins, H.; Wright, S. CHEMTAX-a program for estimating class abundances from chemical markers: Application to HPLC measurements of phytoplankton. Mar. Ecol. Prog. Ser. 1996, 144, 265–283. [Google Scholar] [CrossRef]
- Wright, S.W.; van den Enden, R.L.; Pearce, I.; Davidson, A.T.; Scott, F.J.; Westwood, K.J. Phytoplankton community structure and stocks in the Southern Ocean (30–80 E) determined by CHEMTAX analysis of HPLC pigment signatures. Deep Sea Res. Part II Top. Stud. Oceanogr. 2010, 57, 758–778. [Google Scholar] [CrossRef]
- Finkel, Z.V.; Beardall, J.; Flynn, K.J.; Quigg, A.; Rees, T.A.V.; Raven, J.A. Phytoplankton in a changing world: Cell size and elemental stoichiometry. J. Plankton Res. 2010, 32, 119–137. [Google Scholar] [CrossRef]
- Marañón, E.; Behrenfeld, M.J.; González, N.; Mouriño, B.; Zubkov, M.V. High variability of primary production in oligotrophic waters of the Atlantic Ocean: Uncoupling from phytoplankton biomass and size structure. Mar. Ecol. Prog. Ser. 2003, 257, 1–11. [Google Scholar] [CrossRef]
- Klauschies, T.; Bauer, B.; Aberle-Malzahn, N.; Sommer, U.; Gaedke, U. Climate change effects on phytoplankton depend on cell size and food web structure. Mar. Biol. 2012, 159, 2455–2478. [Google Scholar] [CrossRef]
- Terrado, R.; Scarcella, K.; Thaler, M.; Vincent, W.F.; Lovejoy, C. Small phytoplankton in Arctic seas: Vulnerability to climate change. Biodiversity 2013, 14, 2–18. [Google Scholar] [CrossRef]
- Bolaños, L.M.; Karp-Boss, L.; Choi, C.J.; Worden, A.Z.; Graff, J.R.; Haëntjens, N.; Chase, A.P.; Panna, A.D.; Gaube, P.; Morison, F.; et al. Small phytoplankton dominate western North Atlantic biomass. ISME J. 2020, 14, 1663–1674. [Google Scholar] [CrossRef]
- Choi, D.H.; Noh, J.H.; Shim, J. Seasonal changes in picocyanobacterial diversity as revealed by pyrosequencing in temperate waters of the East China Sea and the East Sea. Aquat. Microb. Ecol. 2013, 71, 75–90. [Google Scholar] [CrossRef]
- Guo, C.; Liu, H.; Zheng, L.; Song, S.; Chen, B.; Huang, B. Seasonal and spatial patterns of picophytoplankton growth, grazing and distribution in the East China Sea. Biogeosciences 2014, 11, 1847–1862. [Google Scholar] [CrossRef]
- Lee, Y.; Choi, J.K.; Youn, S.; Roh, S. Influence of the physical forcing of different water masses on the spatial and temporal distributions of picophytoplankton in the northern East China Sea. Cont. Shelf Res. 2014, 88, 216–227. [Google Scholar] [CrossRef]
- Chang, K.I.; Zhang, C.I.; Park, C.; Kang, D.J.; Ju, S.J.; Lee, S.H.; Wimbush, M. Oceanography of the East Sea (Japan Sea); Springer International Publishing: Cham, Switzerland, 2016; p. 460. [Google Scholar]
- Zapata, M.; Rodríguez, F.; Garrido, J.L. Separation of chlorophylls and carotenoids from marine phytoplankton: A new HPLC method using a reversed phase C8 column and pyridine-containing mobile phases. Mar. Ecol. Prog. Ser. 2000, 195, 29–45. [Google Scholar] [CrossRef]
- Riegman, R.; Kraay, G. Phytoplankton community structure derived from HPLC analysis of pigments in the Faroe-Shetland Channel during summer 1999: The distribution of taxonomic groups in relation to physical/chemical conditions in the photic zone. J. Plankton Res. 2001, 23, 191–205. [Google Scholar] [CrossRef]
- Lee, Y.W.; Park, M.O.; Im, Y.S.; Kim, S.S.; Kang, C.K. Application of photosynthetic pigment analysis using a HPLC and CHEMTAX program to studies of phytoplankton community composition. Sea 2011, 16, 117–124. [Google Scholar] [CrossRef]
- Barlow, R.; Stuart, V.; Lutz, V.; Sessions, H.; Sathyendranath, S.; Platt, T.; Kyewalyanga, M.; Clementson, L.; Fukasawa, M.; Watanabe, S. Seasonal pigment patterns of surface phytoplankton in the subtropical southern hemisphere. Deep Sea Res. Part I Oceanogr. Res. Pap. 2007, 54, 1687–1703. [Google Scholar] [CrossRef]
- Brewin, R.J.W.; Sathyendranath, S.; Hirata, T.; Lavender, S.J.; Barciela, R.M.; Hardman-Mountford, N.J. A three-component model of phytoplankton size class for the Atlantic Ocean. Ecol. Modell. 2010, 221, 1472–1483. [Google Scholar] [CrossRef]
- Hirata, T.; Hardman-Mountford, N.J.; Brewin, R.J.W.; Aiken, J.; Barlow, R.; Suzuki, K.; Isada, T.; Howell, E.; Hashioka, T.; Noguchi-Aita, M.; et al. Synoptic relationships between surface Chlorophyll-a and diagnostic pigments specific to phytoplankton functional types. Biogeosciences 2011, 8, 311–327. [Google Scholar] [CrossRef]
- Levitus, S. Climatological Atlas of the World Ocean; National Oceanic and Atmospheric Administration (NOAA): Washington, DC, USA, 1982; 173p.
- Wasmund, N.; Andrushaitis, A.; Łysiak-Pastuszak, E.; Müller-Karulis, B.; Nausch, G.; Neumann, T.; Ojaveer, H.; Olenina, I.; Postel, L.; Witek, Z. Trophic status of the south-eastern Baltic Sea: A comparison of coastal and open areas. Estuar. Coast. Shelf Sci. 2001, 53, 849–864. [Google Scholar] [CrossRef]
- Kim, K.; Chung, J. On the salinity-minimum and dissolved oxygen-maximum layer in the East Sea (Sea of Japan). Elsevier Oceanogr. Ser. 1984, 39, 55–65. [Google Scholar]
- Yang, H.-S.; Kim, S.-S.; Kang, C.-G.; Cho, K.-D. A study on sea water and ocean current in the sea adjacent to Korea Peninsula-III. Chemical characteristics of water masses in the polar front area of the central Korean East Sea. Korean J. Fish Aquat. Sci. 1991, 24, 185–192. [Google Scholar]
- Kim, H.-S.; Jung, M.-M.; Lee, J.-B. The Korean Peninsula warming based on appearance trend of tropical dinoflagellate species, genus. Ornithocercus. Sea 2008, 13, 303–307. [Google Scholar]
- Baek, S.-H.; Lee, M.; Kim, Y.-B. Growth and community response of phytoplankton by N, P and Fe nutrient addition in around water of Ulleungdo and Dokdo in East Sea. J. Korea Acad.-Ind. Coop. Soc. 2016, 17, 186–195. [Google Scholar]
- Son, Y.T.; Chang, K.I.; Yoon, S.T.; Rho, T.; Kwak, J.H.; Kang, C.K.; Kim, K.R. A newly observed physical cause of the onset of the subsurface spring phytoplankton bloom in the southwestern East Sea/Sea of Japan. Biogeosciences 2014, 11, 1319–1329. [Google Scholar] [CrossRef]
- Rho, T.-K.; Kim, Y.-B.; Park, J.-I.; Lee, Y.-W.; Im, D.-H.; Kang, D.-J.; Lee, T.-S.; Yoon, S.-T.; Kim, T.-H.; Kwak, J.-H. Plankton community response to physico-chemical forcing in the Ulleung Basin, East Sea during summer 2008. Ocean Polar Res. 2010, 32, 269–289. [Google Scholar] [CrossRef][Green Version]
- Bing-xian, G. Patterns and structures of the currents in Bohai, Huanghai and East China Seas. In Oceanology of China Seas; Springer: Cham, Switzerland, 1994; pp. 17–26. [Google Scholar]
- Kim, T.-H.; Lee, Y.-W.; Kim, G. Hydrographically mediated patterns of photosynthetic pigments in the East/Japan Sea: Low N: P ratios and cyanobacterial dominance. J. Mar. Syst. 2010, 82, 72–79. [Google Scholar] [CrossRef]
- Choi, D.H.; An, S.M.; Choi, Y.R.; Roh, H.S.; Noh, J.H. Seasonal variation of picocyanobacterial community composition in seawaters around Dokdo, Korea. Sea 2015, 20, 192–198. [Google Scholar] [CrossRef]
- Yoo, S.; Kim, H.C. Suppression and enhancement of the spring bloom in the southwestern East Sea/Japan Sea. Deep Sea Res. Part II Top. Stud. Oceanogr. 2004, 51, 1093–1111. [Google Scholar] [CrossRef]
- Choi, J.K.; Noh, J.H.; Orlova, T.; Park, M.-O.; Lee, S.H.; Park, Y.-J.; Son, S.; Stonik, I.; Choi, D.H. Phytoplankton and primary production. In Oceanography of the East Sea (Japan Sea); Springer: Cham, Switzerland, 2016; pp. 217–245. [Google Scholar]
- Lee, M.; Kim, Y.-B.; Kang, J.H.; Park, C.H.; Baek, S.H. Seasonal distribution of phytoplankton and environmental factors in the offshore waters of Dokdo: Comparison between 2018 and 2019. Korean J. Environ. Biol. 2020, 38, 47–60. [Google Scholar] [CrossRef]
- Xu, N.; Duan, S.; Li, A.; Zhang, C.; Cai, Z.; Hu, Z. Effects of temperature, salinity and irradiance on the growth of the harmful dinoflagellate Prorocentrum donghaiense Lu. Harmful Algae 2010, 9, 13–17. [Google Scholar] [CrossRef]
- Jeong, H.J.; Lim, A.S.; Lee, K.; Lee, M.J.; Seong, K.A.; Kang, N.S.; Jang, S.H.; Lee, K.H.; Lee, S.Y.; Kim, M.O. Ichthyotoxic Cochlodinium polykrikoides red tides offshore in the South Sea, Korea in 2014: I—Temporal variations in three-dimensional distributions of red-tide organisms and environmental factors. Algae 2017, 32, 101–130. [Google Scholar] [CrossRef]
- Lim, Y.K.; Baek, S.H. Seasonal distributional characteristics of phytoplankton adjacent to the oyster farming area of Hansan-Geoje Island. Korean J. Environ. Biol. 2018, 36, 647–658. [Google Scholar] [CrossRef]
- Noh, J.H.; Kim, W.; Son, S.H.; Ahn, J.-H.; Park, Y.-J. Remote quantification of Cochlodinium polykrikoides blooms occurring in the East Sea using geostationary ocean color imager (GOCI). Harmful Algae 2018, 73, 129–137. [Google Scholar] [CrossRef]
- Islabão, C.; Mendes, C.; Detoni, A.; Odebrecht, C. Phytoplankton community structure in relation to hydrographic features along a coast-to-offshore transect on the SW Atlantic Continental Shelf. Cont. Shelf Res. 2017, 151, 30–39. [Google Scholar] [CrossRef]
- Ilmavirta, V. Phytoflagellates and their ecology in Finnish brown-water lakes. In Flagellates in Freshwater Ecosystems; Springer: Cham, Switzerland, 1988; pp. 255–270. [Google Scholar]
- Viličić, D.; Terzić, S.; Ahel, M.; Burić, Z.; Jasprica, N.; Carić, M.; Mihalić, K.C.; Olujić, G. Phytoplankton abundance and pigment biomarkers in the oligotrophic, eastern Adriatic estuary. Environ. Monit. Assess. 2008, 142, 199–218. [Google Scholar] [CrossRef] [PubMed]
- Furuya, K.; Marumo, R. The structure of the phytoplankton community in the subsurface chlorophyll maxima in the western North Pacific Ocean. J. Plankton Res. 1983, 5, 393–406. [Google Scholar] [CrossRef]
- Andersen, R.A.; Bidigare, R.R.; Keller, M.D.; Latasa, M. A comparison of HPLC pigment signatures and electron microscopic observations for oligotrophic waters of the North Atlantic and Pacific Oceans. Deep Sea Res. Part II Top. Stud. Oceanogr. 1996, 43, 517–537. [Google Scholar] [CrossRef]
- Kang, Y.; Harke, M.J.; Berry, D.L.; Collier, J.L.; Wilhelm, S.W.; Dyhrman, S.T.; Gobler, C.J. Transcriptomic Responses of Four Pelagophytes to Nutrient (N, P) and Light Stress. Front. Mar. Sci. 2021, 8, 223. [Google Scholar] [CrossRef]
- Park, M.-O.; Kang, S.-W.; Lee, C.-I.; Choi, T.-S.; Lantoine, F. Structure of the phytoplanktonic communities in Jeju Strait and northern East China Sea and dinoflagellate blooms in spring 2004: Analysis of photosynthetic pigments. Sea 2008, 13, 27–41. [Google Scholar]
- Uitz, J.; Claustre, H.; Morel, A.; Hooker, S.B. Vertical distribution of phytoplankton communities in open ocean: An assessment based on surface chlorophyll. J. Geophys. Res. Oceans 2006, 111, 1–23. [Google Scholar] [CrossRef]
- Irwin, A.J.; Finkel, Z.V.; Schofield, O.M.; Falkowski, P.G. Scaling-up from nutrient physiology to the size-structure of phytoplankton communities. J. Plankton Res. 2006, 28, 459–471. [Google Scholar] [CrossRef]
- Margalef, R. Life-forms of phytoplankton as survival alternatives in an unstable environment. Oceanol. Acta 1978, 1, 493–509. [Google Scholar]
- Moreno, D.V.; Marrero, J.P.; Morales, J.; García, C.L.; Úbeda, M.V.; Rueda, M.; Llinás, O. Phytoplankton functional community structure in Argentinian continental shelf determined by HPLC pigment signatures. Estuar. Coast. Shelf Sci. 2012, 100, 72–81. [Google Scholar] [CrossRef]
- Ras, J.; Claustre, H.; Uitz, J. Spatial variability of phytoplankton pigment distributions in the Subtropical South Pacific Ocean: Comparison between in situ and predicted data. Biogeosciences 2008, 5, 353–369. [Google Scholar] [CrossRef]
- Madhu, N.; Ullas, N.; Ashwini, R.; Meenu, P.; Rehitha, T.; Lallu, K. Characterization of phytoplankton pigments and functional community structure in the Gulf of Mannar and the Palk Bay using HPLC-CHEMTAX analysis. Cont. Shelf Res. 2014, 80, 79–90. [Google Scholar] [CrossRef]
- Gibb, S.; Barlow, R.; Cummings, D.; Rees, N.; Trees, C.; Holligan, P.; Suggett, D. Surface phytoplankton pigment distributions in the Atlantic Ocean: An assessment of basin scale variability between 50 N and 50 S. Prog. Oceanogr. 2000, 45, 339–368. [Google Scholar] [CrossRef]
- Vijayan, A.K.; Yoshikawa, T.; Watanabe, S.; Sasaki, H.; Matsumoto, K.; Saito, S.-I.; Takeda, S.; Furuya, K. Influence of non-photosynthetic pigments on light absorption and quantum yield of photosynthesis in the western equatorial Pacific and the subarctic North Pacific. J. Oceanogr. 2009, 65, 245–258. [Google Scholar] [CrossRef]
- Chai, C.; Jiang, T.; Cen, J.; Ge, W.; Lu, S. Phytoplankton pigments and functional community structure in relation to environmental factors in the Pearl River Estuary. Oceanologia 2016, 58, 201–211. [Google Scholar] [CrossRef]
- Lee, M.; Won, N.-I.; Baek, S.H. Comparison of HPLC pigment analysis and microscopy in phytoplankton assessment in the Seomjin River Estuary, Korea. Sustainability 2020, 12, 1675. [Google Scholar] [CrossRef]


| Abbreviations | Pigment | Designation |
|---|---|---|
| Allo | Alloxanthin | Cryptophytes (major) |
| But | 19′-Butanoyloxyfucoxanthin | Pelagophytes |
| Chl-a | Chlorophyll a | |
| Chl-b | Chlorophyll b | Chlorophytes |
| Chl-c2 | Chlorophyll c2 | |
| Diad | Diadinoxanthin | |
| Diato | Diatoxanthin | |
| Fuco | Fucoxathin | Diatoms (major) |
| Lut | Lutein | Chlorophytes |
| Neo | 9′-cis-neoxanthin | Chlorophytes |
| Hex | 19′-Hexanoyloxyfucoxanthin | Prymnesiophytes (major) |
| Peri | Peridinine | Dinoflagellates (major) |
| Pras | Prasinoxanthin | Prasinophytes |
| Viol | Violaxanthin | Chlorophytes |
| Zea | Zeaxanthin | Cyanobacteria (major) |
| β–Car | β-Carotene | |
| Pigment index | Estimation Formula | |
| TChl a | Total chlorophyll a | Chl-a + DVChl-a + Chlide a |
| PPC | Photoprotective carotenoids | Allo + Diad + Vio + Zea + β-Car |
| PSC | Photosynthetic carotenoids | But + Fuco + Hex + Peri |
| PI | Photoprotection index | PPC/TChl a |
| DP | Total diagnostic pigments | PSC + Allo + Zea + TChl-b |
| ∑DPW | Weighted sum of diagnostic pigments | 1.41(Fuco) + 1.41(Peri) + 1.27(Hex-fuco) + 0.35(But-fuco) + 0.60(Allo) + 1.01(Chl-b) + 0.86(Zea) |
| fmicro (>20 µm) | Microphytoplankton proportion factor | (1.41(Fuco) + 1.41(Peri))/∑DPW |
| fnano (2–20 µm) | Nanophytoplankton proportion factor | (1.27(Hex) + 0.35(But) + 0.60(Allo))/∑DPW |
| fpico (0.2–2 µm) | Picophytoplankton proportion factor | (1.01(TChl b) + 0.86(Zea))/∑DPW |
| Depth | fmicro | fnano | fpico | |
|---|---|---|---|---|
| Winter | S | 0.56 ± 0.08 | 0.32 ± 0.02 | 0.22 ± 0.05 |
| M | 0.55 ± 0.06 | 0.33 ± 0.03 | 0.23 ± 0.06 | |
| B | 0.59 ± 0.08 | 0.32 ± 0.02 | 0.21 ± 0.06 | |
| Spring | S | 0.57 ± 0.10 | 0.30 ± 0.05 | 0.21 ± 0.04 |
| M | 0.78 ± 0.10 | 0.21 ± 0.05 | 0.11 ± 0.05 | |
| B | 0.92 ± 0.11 | 0.17 ± 0.06 | 0.05 ± 0.05 | |
| Summer | S | 0.27 ± 0.19 | 0.30 ± 0.08 | 0.48 ± 0.23 |
| M | 0.42 ± 0.10 | 0.54 ± 0.08 | 0.12 ± 0.03 | |
| B | 0.42 ± 0.18 | 0.48 ± 0.12 | 0.18 ± 0.21 | |
| Autumn | S | 0.35 ± 0.04 | 0.45 ± 0.04 | 0.27 ± 0.07 |
| M | 0.31 ± 0.08 | 0.55 ± 0.08 | 0.19 ± 0.07 | |
| B | 0.43 ± 0.05 | 0.47 ± 0.05 | 0.18 ± 0.03 |
Publisher’s Note: MDPI stays neutral with regard to jurisdictional claims in published maps and institutional affiliations. |
© 2022 by the authors. Licensee MDPI, Basel, Switzerland. This article is an open access article distributed under the terms and conditions of the Creative Commons Attribution (CC BY) license (https://creativecommons.org/licenses/by/4.0/).
Share and Cite
Lee, M.; Kim, Y.-B.; Park, C.-H.; Baek, S.-H. Characterization of Seasonal Phytoplankton Pigments and Functional Types around Offshore Island in the East/Japan Sea, Based on HPLC Pigment Analysis. Sustainability 2022, 14, 5306. https://doi.org/10.3390/su14095306
Lee M, Kim Y-B, Park C-H, Baek S-H. Characterization of Seasonal Phytoplankton Pigments and Functional Types around Offshore Island in the East/Japan Sea, Based on HPLC Pigment Analysis. Sustainability. 2022; 14(9):5306. https://doi.org/10.3390/su14095306
Chicago/Turabian StyleLee, Minji, Yun-Bae Kim, Chan-Hong Park, and Seung-Ho Baek. 2022. "Characterization of Seasonal Phytoplankton Pigments and Functional Types around Offshore Island in the East/Japan Sea, Based on HPLC Pigment Analysis" Sustainability 14, no. 9: 5306. https://doi.org/10.3390/su14095306
APA StyleLee, M., Kim, Y.-B., Park, C.-H., & Baek, S.-H. (2022). Characterization of Seasonal Phytoplankton Pigments and Functional Types around Offshore Island in the East/Japan Sea, Based on HPLC Pigment Analysis. Sustainability, 14(9), 5306. https://doi.org/10.3390/su14095306