1. Introduction
The theory adverse selection in insurance markets was introduced by Rothschild and Stiglitz [
1] and has since been developed and extended in many theoretical and empirical studies [
2]. Adverse selection theory predicts that individuals who purchase more insurance coverage tend to be riskier. In the context of an annuity, since annuity is a product that pays a specified amount to its policyholder for as long as he or she is alive, a riskier policyholder would be the one who is likely to live longer than the average. To identify adverse selection in the annuity market, we examine whether longer-lived individuals purchase more annuities. Beyond the premium size of annuity purchase, Finkelstein and Poterba [
3] finds that different risk types select into different products, adopting the concept of separating equilibrium introduced by Rothschild and Stiglitz [
1]. For instance, shorter-lived individuals select into level annuities, while longer-lived individuals select into back-loaded annuities such as escalating or real annuities under inflationary period.
This paper presents the evidence of adverse selection in the Korean private annuity market using the money’s worth calculations. It provides a detailed examination of money’s worth ratios across ages, size of policy, and product types. Korean private annuity market provides an ideal and unique laboratory to investigate the degree of adverse selection across a rich array of products, including those that have not been observed in previous research, such as frontloaded products and joint annuity products with different reversion rates and second beneficiary’s age. In addition, the Korean private annuity market provides an attractive research setting as it offers two types of tax treatment of private pensions Different ways in which tax incentives are provided results in an adverse selection.
In testing adverse selection, a direct way would be to examine whether individuals who have private information about their life expectancy purchase more annuity or select into backloaded annuity products and hence individuals who buy backloaded products live longer. However, this test is not feasible because we do not have the relevant data. An indirect test of the same phenomenon is to assume that insurance company recognize this adverse selection and price products accordingly, leading to different money’s worth for different annuity products [
4].
Adverse selection occurs because there is asymmetric information between the insurers and the insureds, and the insureds use private information about their life expectancy in making a decision to purchase an annuity. If the insurance company had same level of information about each annuitant’s life expectancy as the annuitant, it could sell individual-specific priced policies which would generate the same expected return for each individual from the firm’s perspective. However, when annuity buyers know more about their life expectancy, the insurance company offers prices so that, on average, the return to various annuity products will be the same. So, in pricing a more backloaded annuity, for example, an insurance company will consider the average mortality experience of the set of annuitants who are likely to purchase this type of annuity. A potential annuitant with private information that he is likely to be long-lived has a greater incentive to purchase a backloaded annuity than one with more payouts in the near term [
3]. So, for the insurer to have nonnegative profit, insurer should set relatively lower payout for backloaded annuity than nominal annuity.
Korea is the fastest aging society in the world. From 1980 to 2010, the life expectancy of the population increased by approximately 0.5 years annually and this is the fastest rate among the OECD nations. Because of the rapid increase in life expectancy, Korea is moving toward an aged society at the fastest pace. The United States is expected to take 72 years to double the proportion of individuals aged 65 and older from 7 to 14 percent. United Kingdom is projected to take 46 years. Korea is projected to take only 18 years. In addition, Korea has a relatively low retirement age [
5]. Therefore, offsetting the risk of outliving one’s retirement resources is an important issue in Korea. Annuity becomes both a very useful, and possibly essential, financial tool in overcoming longevity risk and the demand is expected to grow.
With the annuity market growing, it is important for the insurer to identify the adverse selection issue in the market. If insurance company price annuity products not taking account of the selection effects, then the profits for annuity products that longer-lived individuals select into will be negative, which will eventually lead to the bankruptcy of a company. Using money’s worth calculations, we observe not only the fairness of annuity products but also the insurer’s recognition of the presence of adverse selection.
2. Literature Review
Although the theoretical literature is quite rich and offers adverse selection models that differ in significant ways, one prediction that the models make—what we call the coverage–risk correlation—appears to be robust and arises in a wide range of circumstances [
6]. As long as the researcher can obtain the data about the policyholder, a natural way to test the coverage–risk correlation is to run the following regression:
where
is a variable representing the ex-post realization of policyholder
i’s risk,
is a variable representing the policyholder’s
i’s choice of coverage, and
is a vector of all policyholder’s characteristics that are known to the insurer and potentially relevant for classifying his or her risk. Ref. [
7] tested the Equation (1) in Korean individual annuities market employing survey-based data on individual’s subjective life expectancy and preference to purchase an annuity.
However, researchers often lack access to policyholder information so instead examine the pricing of life annuities using the money’s worth metric. Prior research studying the cost of adverse selection using money’s worth metric are usually limited to few developed countries, especially United Sates and United Kingdom [
8,
9]. Finkelstein and Poterba [
9] analyze the money’s worth values of both voluntary and compulsory markets in United Kingdom and found that annuities sold in the compulsory market provide higher money’s worth than those sold in voluntary market, reflecting the greater cost of adverse selection in a voluntary market.
Fong [
10] calculates money’s worth values using Singapore data. The paper finds that money’s worth of annuities is higher than annuities sold to a similar age–gender mix in the United States, United Kingdom, and Australia. This high value can be due to a mandated pool of policy holders from the Central Provident Fund (CPF). Fong, Lemaire and Yu [
11] further considers risk measures in calculating money’s worth values for Singapore annuity market. The paper finds that annuity products have big dispersion in the risk profiles while the money’s worth values are similar.
James and Song [
12] studied different money’s worth values across countries, including Australia, Canada, Chile, Israel, Singapore, Switzerland, and the UK. The paper finds that money’s worth for annuitants is greater than 95% in most countries. Moreover, money’s worth values for annuity markets in other countries such as India, Chile, Germany, and Netherlands were analyzed [
12,
13,
14,
15].
There is some empirical evidence providing money’s worth calculations in the Korean private annuity market. Synn [
16] reports the money’s worth value of a 65-year-old male annuitant. Lee [
17] provides money’s worth values for annuity products with 10-year guarantee period and 20-year guarantee period for male and female annuitants aged 55, 60, and 65. In this paper, we investigate money’s worth values for a more diverse group of the population across a rich array of products, including those that have not been observed in previous research, such as frontloaded products and joint annuity products with different reversion rates and the second beneficiary’s age. In addition, the Korean private annuity market provides a unique laboratory as it offers two types of tax treatment of private pension. Different ways in which tax incentives are provided results in an adverse selection.
3. Hypotheses Development
The longer annuitant expects to be alive, the bigger is the annuity’s value. Therefore, longer-lived individuals have greater incentives to purchase annuities than shorter-lived individuals. Once an individual decides to purchase an annuity, he has discretion on the amount and timing of the annuitization, both of which are related to the degree of adverse selection problem.
We first investigate the timing of annuitization. The amount of private information about expected longevity should increase as the individual ages. Therefore, a group of annuitants who decide to annuitize in later years of their lives will be more adversely selected, leading to lower money’s worth values.
Hypothesis 1 (H1). Money’s worth values should decline with age.
Next, we analyze the amount of annuitiztion. Longer-lived individuals would choose to annuitize more of their wealth. Therefore, the group of annuitants who purchase annuity with a larger premium will be more adversely selected, leading to lower money’s worth values.
Hypothesis 2 (H2). Money’s worth should decrease with premium size.
In addition to choosing the timing and amount of annuitization, longer-lived individuals also have greater incentives to purchase certain types of annuities as the value of some features increases with life expectancy. We observed “guarantee period” as a product feature. The guarantee period is a feature that provides an annuity payment until the end of the guarantee period regardless of the annuitant’s survival. If you were to die soon after starting your annuity, your annuity would ordinarily stop and there would be no further payments made. Therefore, shorter-lived individuals would choose to select into annuities with longer guarantee periods.
Hypothesis 3 (H3). Money’s worth should increase with the length of the guarantee period.
Frontloaded annuity and joint annuity are also types of annuities that a person who expects to die young is more likely to purchase. Money’s worth calculations on these product types will be provided as well.
In addition, tax incentives can be used as a tool for examining the degree of adverse selection in the private annuity market. Tax-qualified annuity apply “exempt-exempt-taxed” (EET) regime and non-tax qualified annuity apply “taxed-exempt-exempt” (TEE) scheme. In Korea, tax-qualified annuity provides a higher percentage of tax incentive (explanation on this argument will be provided in detail in the later section of the paper). However, tax-qualified annuity provides a tax incentive to the extent of KRW 4 million a year while non-tax qualified pension does not have such limit. Longer-lived individuals would choose to annuitize their wealth not only in tax-qualified annuity up to its limit but also more wealth in non-tax qualified pension. In other words, a non-tax qualified pension will be purchased by individuals who are more adversely selected.
Hypothesis 4 (H4). Money’s worth value should be lower for non-tax qualifed pension compared to tax-qualified pension.
4. Money’s Worth
4.1. Basic Framework
The conventional measure of the value of an annuity is the moneys’ worth (Mitchell et al., 1999), which compares the expected present value of the annuity payments with the price paid for the annuity. Money’s worth, the EPDV/premium ratio, would be unity if the annuity were actuarially fair.
The EPDV of monthly, single life annuity payments for products with different guarantee periods are given below:
where
A is the monthly payout of the specified product, and
is the probability that the annuitant survives until period
t,
is the expected one-month interest rate. Note that the EPDV for the ten year guaranteed annuity does not include the survival probability for the first 120 months reflecting that this annuity pays out for the first 120 months regardless of survival.
The joint annuity formula contains the reversion of the annuity to the second beneficiary at a lower level (70%) or the same level (100%) upon principal beneficiary’s death. The survival probability of the reversionary beneficiary is noted with a ′ mark. The EPDV of monthly, joint annuity payments for products of different reversion rates are given below:
4.2. Annuity Price
The basic type of annuity product is single life immediate annuity, which involve only one purchaser, rather than joint life annuities purchased by couples. In Korean private annuities market, all products are variable annuities whose payout is linked to the performance of an underlying pool of investment assets. So future payout is not certain as future crediting rates are not determined at the time of purchase. For discount rate, we used payment calculated from crediting rate of December 2014. Also, to ensure the comparability, data was limited to bancassurance channel as it provided the largest number of firms offering various products.
Table 1 provides the average monthly payments for different annuity products. Purchase price were set at KRW 1 billion to clarify the differences among payouts for various cohorts as some of the companies provided future annuity payout amount in the unit of KRW 10,000. Annuity payments are based on the average of 6 firms in the sample that offer single premium immediate annuities with 10, 20, 100 guarantees. The table indicates that initial payments are lower for annuities with longer guarantee periods. The table also shows that average payments for all products are higher for men than for women, reflecting the greater life expectancy for women. Monthly annuity payments also increase with the age reflecting the fewer expected payments. But for women, it rises at a lower rate.
4.3. Interest Rate
Previous research evaluating money’s worth have usually inferred zero coupon yield curve of treasury securities with various maturities from 10 to 25 years for a discount factor [
3,
4,
18]. This reflects the assumption that this rate of return is risk free.
We follow a number of earlier studies in using risk free interest rates to discount annuity payouts. In Korea, all private annuities are variable annuities in which the income payment varies depending on the performance of the managed portfolio. Therefore, we do not need to use the yield curve. We use 20-year treasury bond rate of September 2014.
4.4. Mortality Rate
Three different mortality tables were used in estimating the cumulative survival probability of population and annuitants. First, the complete life table for the Korean population was used. We used the life tables from 2012. Second, projected survival probabilities for the Korean population were used. We used the population projections, which are from 2012. The Korean Statistical Information Service compiles these mortality tables. The projections are not given for every year but for every five years from 2010 to 2060. Therefore, for the other years we performed linear interpolation based on the complete life table and projected life table. Additionally, the projections are given not for every age but in a sum of 5 years such as the ages 0, 1–4, 5–9, and 10–14. We assumed that the proportion of death probability by age remains same as that of 2012 complete life table and gave the sum proportional weights [
16]. Third, the mortality table of annuitants was used. This is based on information compiled by the Korea Insurance Development Institute with regard to the mortality experience of male and female annuitants. We used the 7th annuitant projections, which are from 2012.
In estimating annuitant mortality projections, we followed the research by Finkelstein and Poterba [
9]. Annuitant mortality table of 2012 need to be updated to take account of mortality improvements. To update the older period tables to 2014 period tables, we assume that mortality improvements in these annuitant populations have been the same as those experienced by the general population.
One remaining difficulty is that the annuitant mortality tables are period mortality tables, not cohort tables. To turn 2014 period tables into cohort tables, we again assume that projected mortality improvements for the population are the same as for annuitant groups. Therefore, we compute the ratio of age- and gender-specific mortality in the 2014 population cohort mortality table and the 2014 population period mortality table and use these ratios to “cohortize” 2014 annuitant period tables.
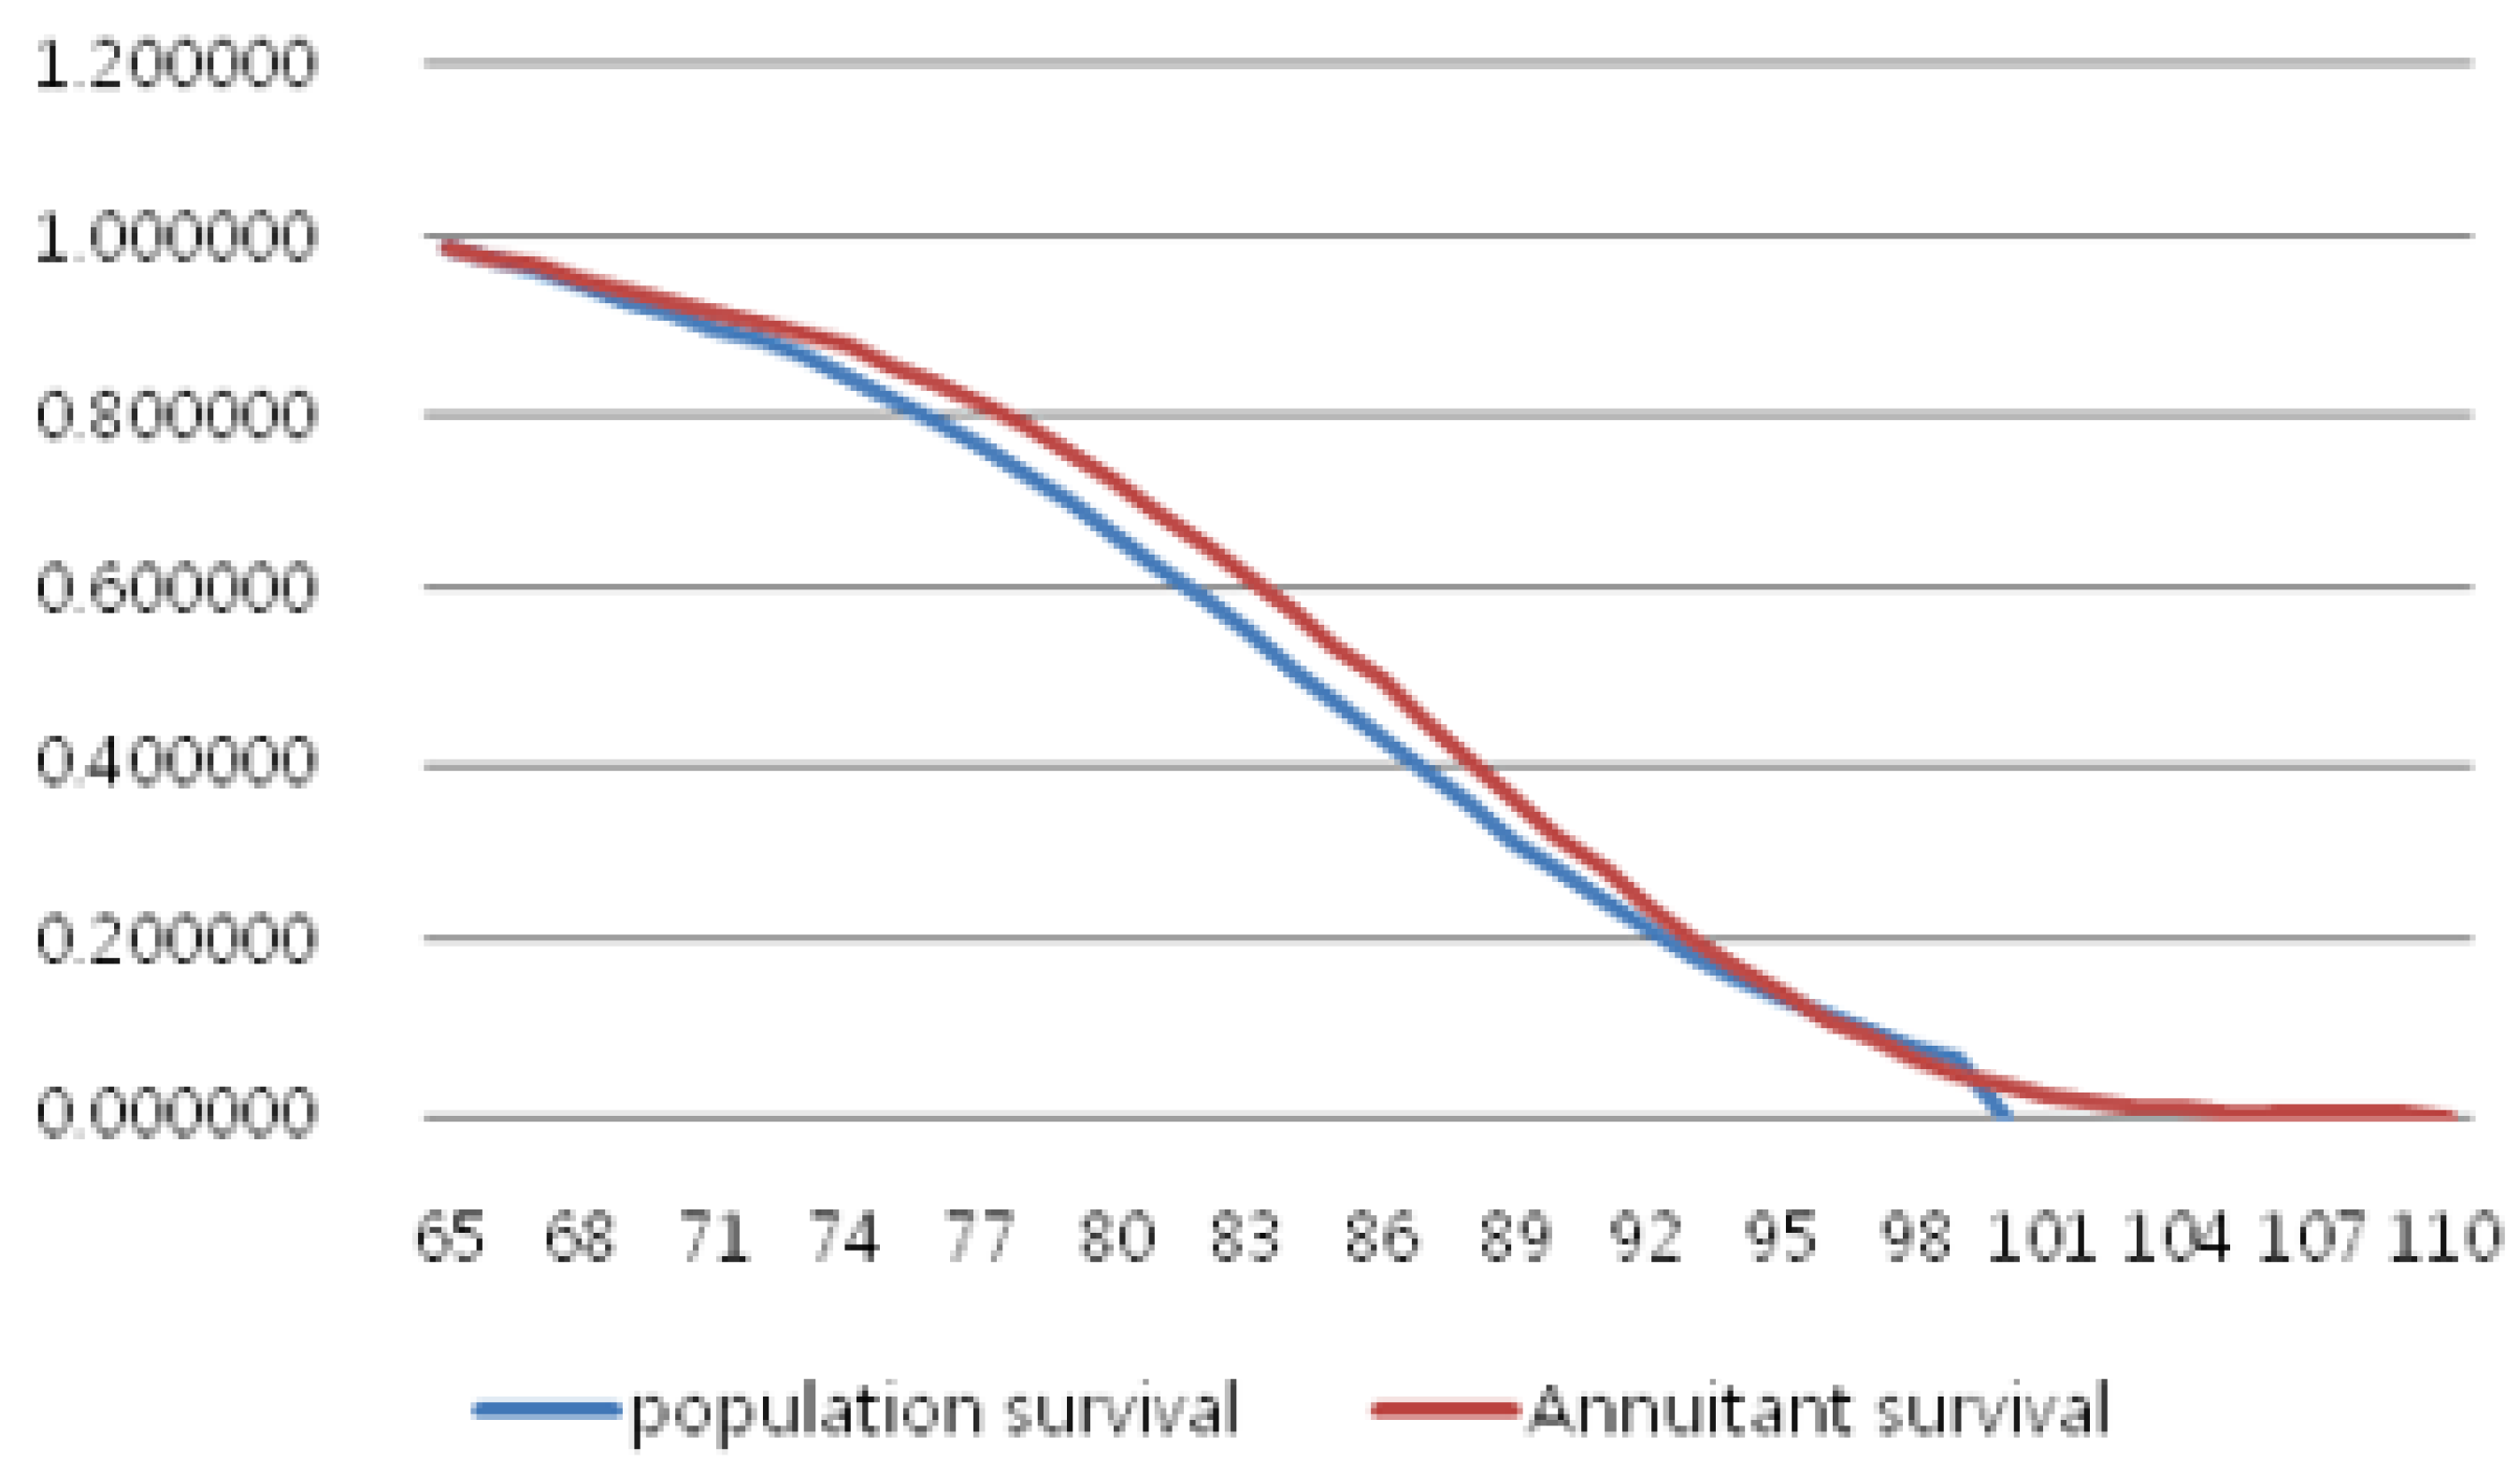
Figure 1 shows the probability that a 65-year-old male will survive to various ages when facing the mortality rates for the population at large and those for annuitants. The average 65-year-old male annuitant has a higher survival probability at almost all ages than an individual who faces the mortality rates for the population at large. This is also evidence of adverse selection which identifies annuitants outliving the average population.
5. Evidence of Adverse Selection
Table 2 shows the money’s worth values computed using mortality tables for the population at large and for the annuity buyers. Annuity payments are based on the average of 6 firms in the sample that offer single premium immediate annuities with 10, 20, 100 guarantees Several conclusions can be drawn from the table. First, money’s worth values decrease with age. These results support hypothesis 1. This pattern is consistent with the amount of private information about their life expectancy increasing as people get older. Second, money’s worth values are almost always higher for male annuitants. One possible explanation is the shorter expected duration and consequent lower mortality and reinvestment risk of male annuitants [
13]. Another possible explanation can be the decreasing gap of life expectancy between the male and female population and insurance companies are not reflecting this current trend in pricing the annuity payout. Third, money’s worth values are always higher for annuitants than for a general population across all ages and genders. This reflects annuitants having longer life expectancies than non-annuitants.
The analysis so far has focused on comparisons of the different types of annuity policies that have the same initial premium amount.
Table 3 presents the money’s worth of annuity products with different initial premiums: KRW 100 million, 500 million, and 1 billion. Calculations are based on the average of annuity payouts of the two firms in the sample, and population mortality tables. Most companies provided proportionally increasing annuity payouts on different premium amounts, so the money’s worth values were the same across different premiums.
Table 3 is an average of two companies whose payouts did not increase proportionally. There is a consistent pattern where the money’s worth increases with the premium size. These results reject Hypothesis 2. These patterns were also found in the past research showing that there are bulk discounts [
3,
19]. These could be due to administrative cost savings and discounts for big premium amounts by insurance companies.
Table 4 compares the money’s worth of annuities with a 10-year guarantee period, a 20-year guarantee period and an age 100 guarantee which promises an annuity payment until the annuitant reaches 100 regardless of the annuitant’s survival. Calculations are based on the average of annuity payouts of the 6 firms in the sample, and population mortality tables. The table shows that money’s worth increases systematically with the length of the guarantee period, which supports Hypothesis 3.
In a similar context, frontloading is a feature that shorter-lived individuals find more appealing than those who expect to be longer-lived. Frontloaded annuity products in Korea provide twice as much payment for the guarantee period unlike the nominal annuity which provides a constant amount across all ages. For example, if a frontloaded 10-year-guarantee annuity provides KRW 10 million for the first 10 years, then from year 11 it will provide KRW 5 million.
Table 5 compares the money’s worth values of frontloaded annuities with different guarantee periods. As in
Table 4, money’s worth increases with the length of the guarantee period.
The last two columns of
Table 5 are money’s worth values for annuities with the nominal guarantee period feature which provides the same amount of payout throughout the period. Calculations for both frontloaded and nominal annuity are based on the average of annuity payouts of four firms that offer both frontloaded and nominal annuity, and population mortality tables. The table shows that frontloaded annuity has higher money’s worth value than level annuity given the same guarantee period. This is consistent with shorter-lived individuals self-selecting into annuities that pays a bigger amount in the near term.
Another feature that is more attractive to shorter-lived individuals is joint annuity. Joint annuity provides longevity risk insurance to both husband and wife as a spouse will continue collecting payments even after the primary annuitant dies. Therefore, we could project individuals with a shorter life expectancy to select into joint annuity than single annuity, leading to higher money’s worth value for joint annuity. Indeed, that is exactly the result of
Table 6. Regardless of the second beneficiary’s age and reversion level, joint annuity has higher money’s worth values than individual annuity. In addition, at a given primary annuitant’s age money’s worth value decreases as the second beneficiary’s age increases. This is consistent with the amount of private information about the mortality risk rising as an individual ages. For instance, a 65-year-old male annuitant with a 70-year-old wife would choose to purchase joint annuity only if his wife expects to live for a long time. Furthermore, among joint annuity products the money’s worth calculations were higher for products that provide the same initial payout to the second beneficiary (100% level) than for products that give out at a lower rate (70% level) at the death of the primary annuitant. This reflects individuals with a short life expectancy wishing to leave a bequest for their spouse and it would be more prominent where the bequest amount is larger.
Table 6 shows the money’s worth calculations of a single company because other insurance companies provided annuity payouts not considering the second beneficiary’s age. All annuity payout data in this research are obtained through each insurance company’s official homepage and for convenience other companies probably have put the same amount of payout regardless of reversionary beneficiary’s age. Calculations are based on population mortality tables for products with 10-year guarantee period.
Tax-qualified annuity is an EET (exempt-exempt-taxed) scheme, in which both the funds contributed, and the accrual return on accumulated funds are exempted from taxation. In return, the benefits are treated as taxable income upon withdrawals. On the other hand, non-tax-qualified annuity is a TEE (taxed-exempt-exempt) scheme, under which a taxpayer has to pay income tax on pension savings upon contribution. In return, the accrual return on funds accumulated and the withdrawal of assets is fully exempted from taxation.
In the case where the discount rate is equal to the rate of return, and contributions and withdrawals are subject to the same marginal income tax rate, these two regimes deliver the same net present value of reverences to the government; therefore, the same value of benefit to annuitants [
20]. However, in Korea, withdrawals are taxed more leniently than in contribution. Consequently, the EET scheme provides bigger tax support for annuitants. From this, we could predict that money’s worth value of tax-qualified annuity will be higher than that of non-tax qualified pension as longer-lived individuals would not only fully annuitize their wealth in qualified annuity of KRW 4 million a year but annuitize more wealth in non-tax qualified pensions.
In comparison to products under different tax regimes, products that differ only in tax treatment should be chosen because the differences in money’s worth values across products could be driven simply by differences in the features and options comprised in a product. To ensure comparability, we made two conditions to be consistent across tax-qualified and non-tax-qualified annuity; whether it paid out a dividend and whether it had an insurance period before the income phase in which the plan is converted into an annuity and payments are received. The latter includes a death benefit, compensation for casualty, etc.
Dividend payout is set as a criterion because all life annuity products in Korea are variable annuities whose return depends on the crediting rate of each month and products that pay dividend apply a lower crediting rate compensating for future dividend payment. However, the future dividend is not known at the time of purchase so calculating the accurate money’s worth values of dividend paying products is not viable. So, it is improper to compare dividend-paying and non-dividend-paying products as money’s worth values of dividend-paying products will be shown to be lower than its actual value. Additionally, if a product has an insurance period before the income phase, it will have a lower payout than a product with no prior insurance period because it provides an additional option. When these two conditions were applied, only one company was satisfied.
To enjoy tax incentives, certain conditions have to be met. For tax-qualified-annuity, the annuitant must receive payments at least 5 years from the purchase at age 55 years or older and tax incentive is provided to the extent of KRW 4 million. A non-tax-qualified annuitant must receive payments at least ten years from the purchase and can choose to receive annuity from the age of 45. Fulfilling all these conditions, money’s worth values of a 55-year-old annuitant paying monthly premium of KRW 330,000 for 5 years and getting annuity payments from age 65 are shown in
Table 7.
Table 7 shows that the money’s worth values are higher for non-tax-qualified annuity. Annuity payment is for an annuity with 20-year guarantee period based on population mortality tables. This rejects Hypothesis 4. These results could be explained if the insurance company set a lower payout for the tax-qualified product as individuals are still willing to purchase them due to the tax incentive. This is a “moral hazard” of insurance company. Government use tax incentives to encourage the development of private retirement saving plans [
20]. This is a cost to the government and insurance companies are providing lower payout compensating for government’s tax expenditures.
We have focused our analysis on bancassurance channel but only one company satisfied the abovementioned criteria imposed to compare products with different the tax incentives. This may be insufficient to generalize that money’s worth value of non-tax-qualified annuity is higher than that of tax-qualified annuity. So, we relieve the condition of the bancassurance channel that has been maintained throughout the research.
Table 8 shows the money’s worth comparison of face-to-face channel products, and again, only one firm (different from
Table 7) satisfied the condition. Annuity payment is for an annuity with 20-year guarantee period based on population mortality tables. The money’s worth value is consistently higher for non-tax-qualified product.
6. Cross-Country Analysis
There have been previous studies that provide money’s worth calculations across different countries.
Table 9 lists the money’s worth values from other studies by country. A natural question of which country provides higher money’s worth values or which country has a higher cost of adverse selection rises. We investigate these questions in relation to social security system.
The effects of social security under uncertain lifetimes have been studied by Sheshinski and Weiss [
21] and Abel [
22] in models where there is no private annuity market. However, if a competitive annuity market was introduced into these models, social security would have no effect because the rate of return on private annuities would be the same as that in actuarially fair fully funded social security; thus, consumers would exactly offset the effects of social security by adjusting their purchases of private annuities.
The study by Abel [
23] introduces a private market for annuities and demonstrates that with privately known heterogenous mortality probabilities, social security actually does have real effects on the allocation of consumption. This is due to adverse selection. Adverse selection drives the rate of return on competitively supplied annuities below the actuarially fair rate of return based on the population average ex ante mortality probability. On the other hand, because the social security system is compulsory, it is immune to adverse selection and a fully funded system can offer a rate of return equal to the actuarially fair rate based on the population’s average mortality. In sum, adverse selection in private annuity market leads to lower rate of return on private annuities compared to the rate of return implicit in compulsory social annuity.
Following Abel [
23], Heijdra and Reijnders [
24] also studies the consequences of introducing mandatory social annuities. The study finds that mandatory social annuities, providing higher rate of return than private annuity, do indeed “crowd out” their private counterparts. Keeping everything else constant, this crowding out is more than one-for-one as the higher level of total income in the retirement period reduces the incentive for private saving.
Based on the abovementioned theoretical background, we project that private annuity will be crowded out by social security more in countries where public financial assistance is benevolent. Since the risk of outliving one’s retirement resources is partly born by the state or the current generation of tax payers, the incentive to make voluntary purchases of annuities is reduced for individuals in countries where retirees receive a generous guaranteed social security income for life. Social security is a substitute, a better one if adverse selection is high, for individual annuities. The group of annuitants who choose to buy private annuity in countries that provide generous state funded retiree benefits should be very adversely selected. On the other hand, individuals living in countries that provide little social security have little discretion but to purchase private annuity to offset the risk of outliving their retirement resources. Therefore, in states that provide limited public financial assistance for retirees the cost of adverse selection should be low. We test the following hypothesis:
Hypothesis 5 (H5). In countries that provide generous social security income adverse selection should explain a large part of the disparity between premium cost and annuity intrinsic value.
In testing Hypothesis 5, we need to define how to measure the generosity of social security income. This paper adopts 2014 Global Age Watch Index. The Global AgeWatch Index is constructed by HelpAge International from international data sets drawn from the United Nations Department of Economic and Social Affairs, the World Bank, the World Health Organization, the International Labor Organization, UNESCO and the Gallup World Poll. Global AgeWatch Index is the first analytical framework that uses comparative quantitative data available internationally to measure and monitor the economic and social wellbeing of older people globally [
25].
There are four domains in this index: income security, health status, employment and education, and enabling environments. We adopted income security domain, which assesses older people’s access to a sufficient amount of income and the capacity to use it independently, in order to meet basic needs in older age. This domain consists of four indicators and is calculated by giving each indicator different weights: 40 percent for pension income coverage, 20 percent for poverty rate, 20 percent for the relative welfare of older people, and 20 percent for GDP per capita. The numbers are shown in the second column of
Table 9.
Table 9.
Cross-country Cost of Adverse Selection.
Table 9.
Cross-country Cost of Adverse Selection.
| Country | Income Security | Study | Valuation Date | Money’s Worth for 65-Year-Old Male | Cost of Adverse Selection as % of Cost of Insurance |
|---|
| General Population | Annuitant |
|---|
| US | 78.7 | James and Song [12] | 1999 | 0.858 | 0.974 | 81.7% |
| Australia | 52.2 | Bateman
and Ganegoda [26] | 2006 | 0.76 | 0.79 | 12.5% |
| UK | 82.7 | Finkelestein and Poterba [3] | 1998 | 0.865 | 0.988 | 91.1% |
| Martin and Fitzgerald [27] | 2004 | | 0.823 | |
| Canada | 83.2 | Milevsky and Shao [28] | 2009 | 0.965 | 1.117 | - |
| Israel | 68.1 | James and Song [12] | 1999 | 0.769 | 0.882 | 48.9% |
| Chile | 70.5 | James
and Song [12] | 1999 | 0.865 | 0.967 | 75.6% |
Thorburn, Rocha and Morales
[13] | 2005 | | 1.067 | |
| Korea | 32.5 | This
research | 2014 | 0.863 | 0.897 | 24.8% |
| Singapore | | Fong [10] | 2000 | 0.923 | 0.933 | 13% |
| Swiss | 76 | James
and Song [12] | 1999 | 0.916 | 1.082 | - |
Butler
and Ruesch
[29] | 2005 | 0.891 | | |
Butler
and Staubli
[30] | 2009 | | 1.007 | |
| India | 44.6 | James
and Sane
[14] | 2002 | 0.811 | 0.892 | 42.9% |
| Germany | 80.5 | Kaschutzke and Maurer
[15] | 1997–
2006 | 0.689 | 0.789 | 32.2% |
| Netherlands | 85.6 | Cannon, Stevens,
and Tonks [18] | 2012 | 0.976 | 1.011 | - |
In measuring the degree of adverse selection, we follow previous literature [
3,
10]. The difference between the money’s worth value using the population mortality table, and that using the annuitant mortality table, is a measure of the cost of adverse selection: MW (annuitant mortality table)—MW (population mortality table). Additionally, the cost of insurance is measured by 1—MW (population mortality table). Therefore, the share of cost of insurance that is due to adverse selection is calculated as the following: {MW (annuitant mortality table)—MW (population mortality table)}/{1—MW (population mortality table)}. The last column of
Table 9 shows these calculations. we used the money’s worth values from the most recent studies of each country to compare them with the income security domain of 2014. For countries that has money’s worth values above 1, calculated using either population mortality table or annuitant mortality table, the cost of adverse selection was not given any value as this implies that the annuity is providing more than the actuarially fair payout.
The income security measure is evaluated in 2014 and the cost of adverse selection is measured over different sample periods across papers. Therefore, analyzing the cost of adverse selection on income security might be an apple-to-orange comparison. However, we believe that both measures are stable over time and ran a simple regression. We find the coefficient to be 1.03 with p-value of 0.07. This shows some evidence in support for Hypothesis 5 that in countries where the social security income is generous, the cost of adverse selection is high.
7. Summary and Conclusions
Our paper examines adverse selection using the money’s worth calculations in the Korean private annuity market. Korean market provides an ideal and unique laboratory to study the empirical question as it allows us to investigate the money’s worth values across different ages, gender, and products, including those that have not been observed in previous studies. Our results show the presence of adverse selection in Korean private annuity market.
First, we find that money’s worth values decrease with age. The amount of private information about expected longevity should increase as individual ages. Therefore, the group of annuitants who decide to annuitize in later years of their lives will be more adversely selected, leading to lower money’s worth values.
Second, we analyze the money’s worth values by the mount of premium. Contrary to our hypothesis, we find the money’s worth increasing with premium size. This could be explained due to bulk discount provided by insurers.
Third, we investigate different types of product features. We find that money’s worth increases with the length of the guarantee period. Individuals with shorter life expectancy have an incentive to select into products with longer guarantee period, leading to higher money’s worth. We also find that money’s worth values are higher for joint annuity compared to individual annuity. Among joint annuity products, money’s worth calculations were higher for products with a higher reversion rate. This is consistent with individuals with shorter life expectancy selecting into joint annuity with higher reversion rate than single annuity, leading to higher money’s worth values.
Fourth, we compare tax-qualified annuity and non-tax qualified annuity. Contrary to our hypothesis, we find that money’s worth values are higher for non-tax qualified plans. This can be explained by the “moral hazard” of insurance company providing lower payout to tax-qualified plans because policyholders will still select into these products due to tax incentives.
Lastly, we observe that the cost of adverse selection is higher in countries with more generous social security income.
Our sample is limited to annuity products sold via bancassurance channel to ensure comparability. Bancassurance channel provided the largest number of firms offering various products. In future research, we hope to explore more diverse type of products sold in other channels since different product characteristics leads to different selection effects.


