Freight Transport Cost and Urban Sprawl across EU Regions
Abstract
:1. Introduction
2. Regional Freight Transport and Spatial Structure
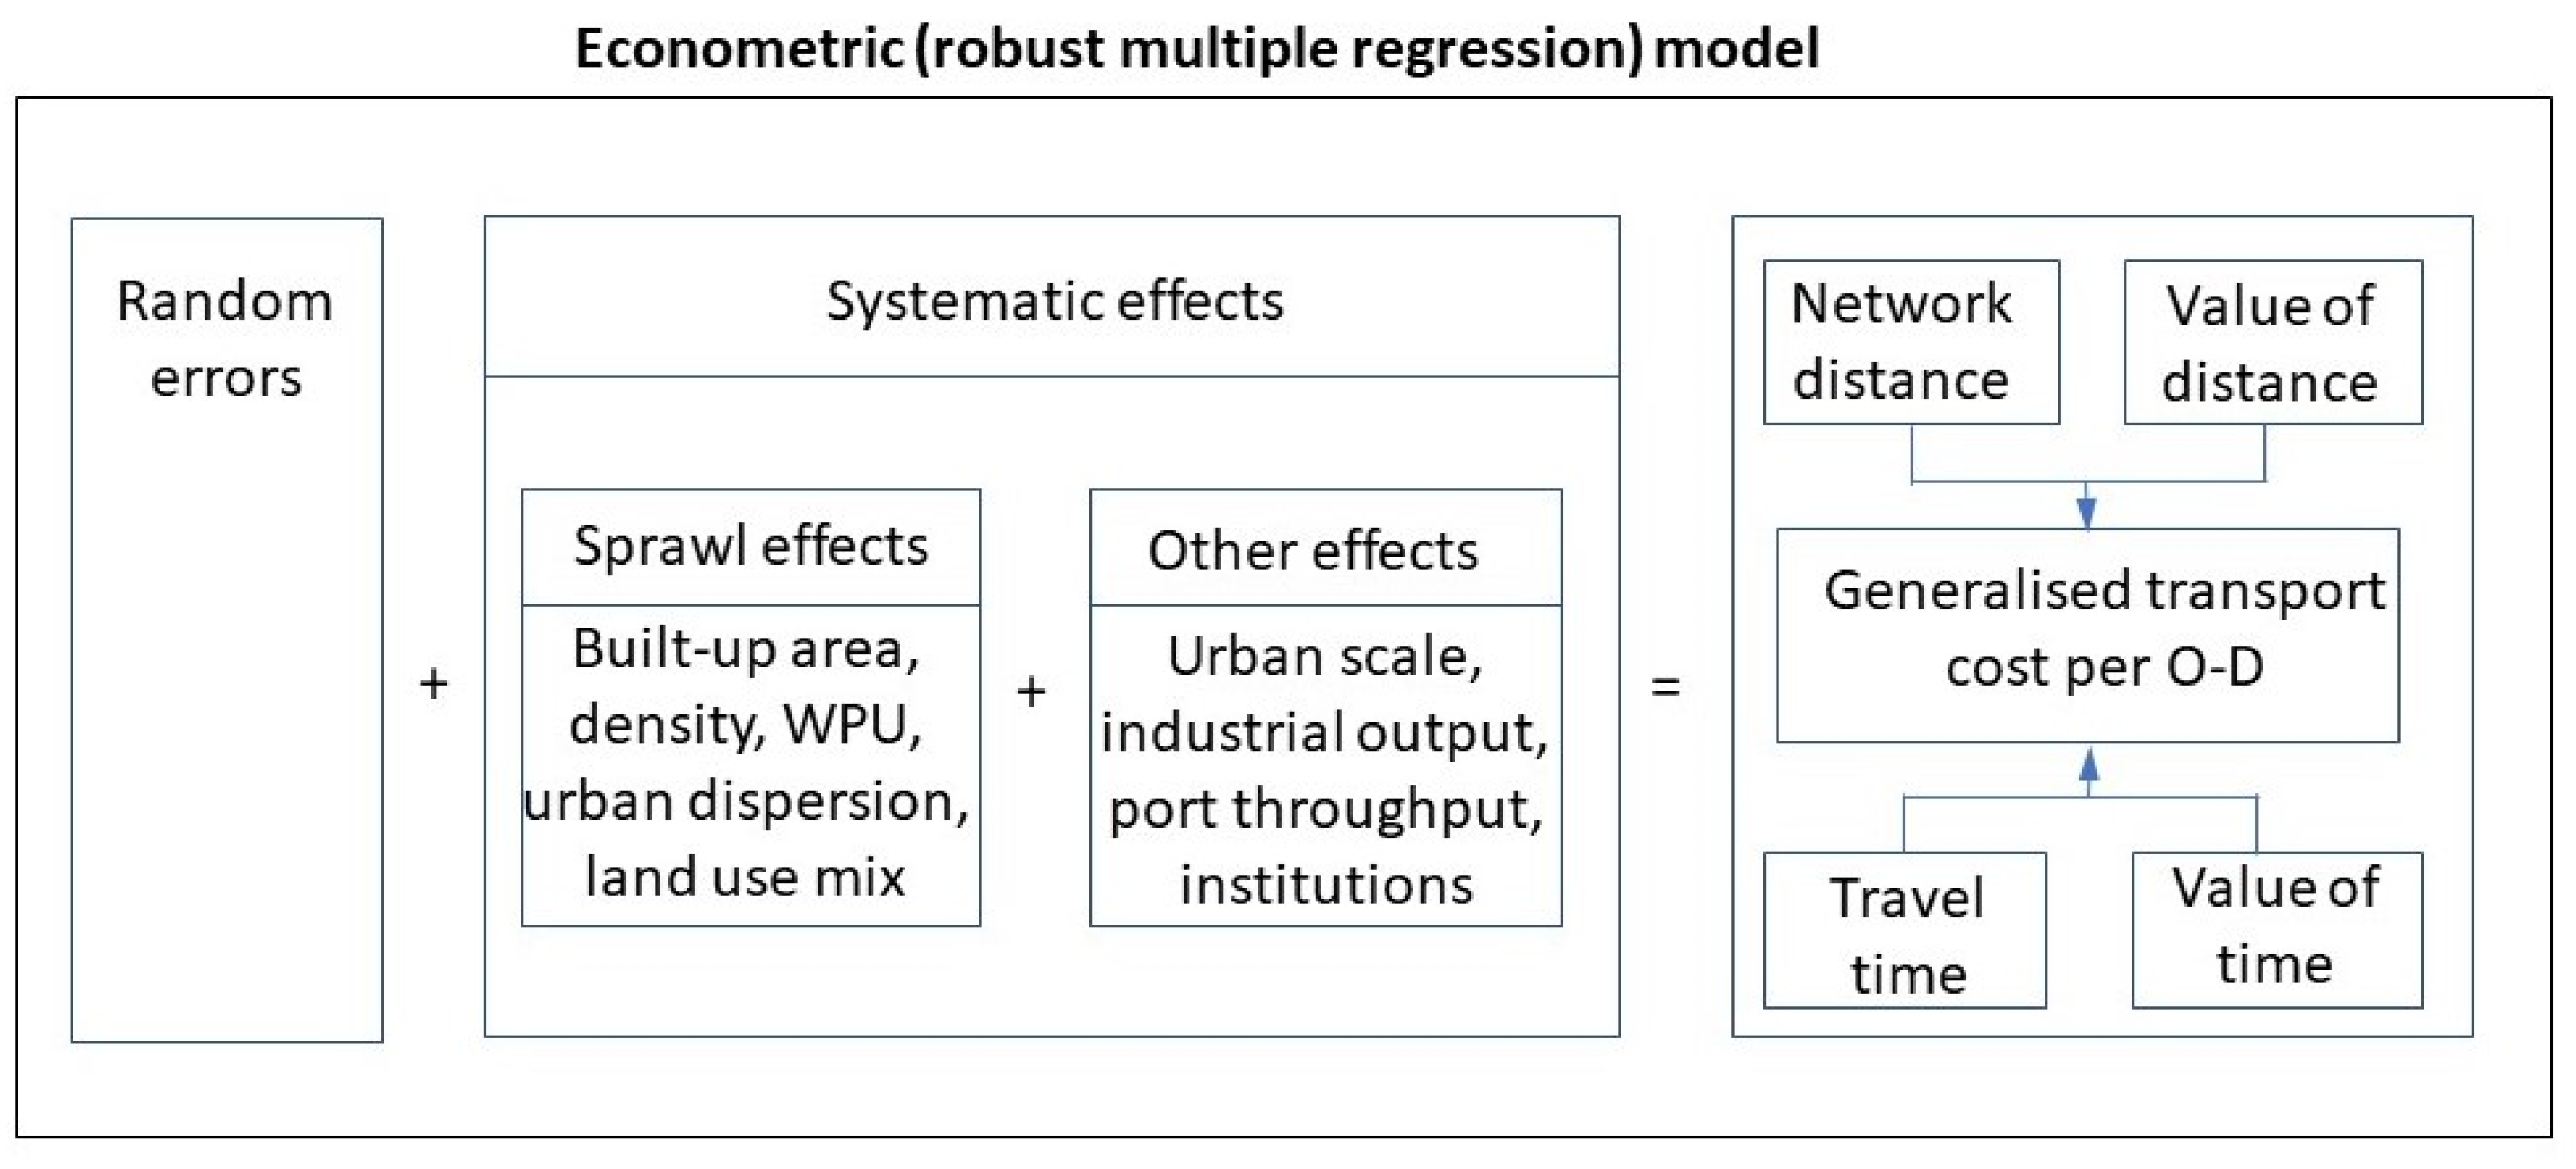
| Variables | Indicative Bibliography | Included |
|---|---|---|
| Land cover/urban sprawl | ||
| Proportion of built-up area | [26] | ✓ |
| Land uptake per person | [17,26] | ✓ |
| Urban dispersion | [24,26] | ✓ |
| Weighted urban proliferation | [26] | ✓ |
| Land use | ||
| Residential/commercial density | [12,13,14,15,16,17,24,25] | ✓ |
| Industrial/construction density | [12] | ✓ |
| Land use mix | [13,14,17] | ✓ |
| Accessibility (land use proximity) | [13] | ✘ |
| Built environment designs | [27,28] | ✘ |
3. Model Specification and Description of the Variables
3.1. Specification of the Model
3.2. Description of the Transport Cost Variables
3.3. Description of the Sprawl Metrics
3.3.1. The Land Cover Metrics of Sprawl
3.3.2. The Land Use Metrics of Sprawl
4. Results
5. Conclusions
Funding
Institutional Review Board Statement
Informed Consent Statement
Data Availability Statement
Conflicts of Interest
References
- Thissen, M.; Los, B.; Lankhuizen, M.; van Oort, F.G.; Diodato, D. EUREGIO: A Global Input-Output Database with Regional Detail for Europe (2000–2010); Tinbergen Institute Discussion Papers, No. 18-084/VI; Tinbergen Institute: Amsterdam, The Netherlands, 2017; Available online: http://www.rug.nl/ggdc/html_publications/memorandum/gd172.pdf (accessed on 1 January 2022).
- van de Riet, O.; de Jong, G.; Walker, W. Drivers of freight transport demand and their policy implications. In Building Blocks for Sustainable Transport: Obstacles, Trends, Solutions; Petrels, A., Himanen, V., Lee-Gosselin, M., Eds.; Emerald Group Publishing Limited: Bingley, UK, 2008; pp. 73–102. [Google Scholar]
- Anas, A.; Pines, D. Public goods and congestion in a system of cities: How do fiscal and zoning policies improve efficiency? J. Econ. Geogr. 2013, 13, 649–676. [Google Scholar] [CrossRef] [Green Version]
- Anas, A. Urban Sprawl and the Control of Land Use; Oxford Research Encyclopedia of Economics and Finance Press: Oxford, UK, 2019. [Google Scholar] [CrossRef]
- Bruton, M.J. Transport Planning. In The Spirit and Purpose of Planning; Bruton, M.J., Ed.; Hutchinson: London, UK, 1974; pp. 169–204. [Google Scholar]
- Cervero, R.; Kockelman, K. Travel demand and the 3Ds: Density, diversity, and design. Transp. Res. Part D Transp. Environ. 1997, 2, 199–219. [Google Scholar] [CrossRef]
- van Wee, B. Land use and transport: Research and policy challenges. J. Transp. Geogr. 2002, 10, 259–271. [Google Scholar] [CrossRef]
- Camagni, R.; Gibelli, M.C.; Rigamonti, P. Urban mobility and urban form: The social and environmental costs of different patterns of urban expansion. Ecol. Econ. 2002, 40, 199–216. [Google Scholar] [CrossRef]
- Bento, A.M.; Cropper, M.L.; Mobarak, A.M.; Vinha, K. The Effects of Urban Spatial Structure on Travel Demand in the United States. Rev. Econ. Stat. 2005, 87, 466–478. [Google Scholar] [CrossRef]
- Travisi, C.M.; Camagni, R.; Nijkamp, P. Impacts of urban sprawl and commuting: A modelling study for Italy. J. Transp. Geogr. 2010, 18, 382–392. [Google Scholar] [CrossRef]
- Hu, L.; Iseki, H. Land use and transportation planning in a diverse world. Transp. Policy 2019, 81, 282–283. [Google Scholar] [CrossRef]
- Allen, J.; Browne, M.; Cherrett, T. Investigating relationships between road freight transport, facility location, logistics management and urban form. J. Transp. Geogr. 2012, 24, 45–57. [Google Scholar] [CrossRef] [Green Version]
- Bassok, A.; Johnson, C.; Kitchen, M.; Maskin, R.; Overby, K.; Carlson, D.; Goodchild, A.; McCormack, E.; Wygonik, E. Smart Growth and Urban Goods Movement; NCFRP Report 24; National Cooperative Freight Research Program, Transportation Research Board, National Academy of Sciences: Washington, DC, USA, 2013. [Google Scholar]
- De Bakshi, N.; Tiwari, G.; Bolia, N.B. Influence of urban form on urban freight trip generation. Case Stud. Transp. Policy 2020, 8, 229–235. [Google Scholar] [CrossRef]
- Dhonde, B.; Patel, C.R. Characterization of freight trip from textile power loom units–A case study of Surat, India. Transp. Res. Procedia 2020, 48, 428–438. [Google Scholar] [CrossRef]
- Gardrat, M. Urban growth and freight transport: From sprawl to distension. J. Transp. Geogr. 2021, 91, 102979. [Google Scholar] [CrossRef]
- OECD. The Governance of Land Use in OECD Countries: Policy Analysis and Recommendations; OECD Publishing: Paris, France, 2017. [Google Scholar]
- Kennedy, C.; Steinberger, J.; Gasson, B.; Hansen, Y.; Hillman, T.; Havránek, M.; Pataki, D.; Phdungsilp, A.; Ramaswami, A.; Mendez, G.V. Greenhouse Gas Emissions from Global Cities. Environ. Sci. Technol. 2009, 43, 7297–7302. [Google Scholar] [CrossRef] [PubMed]
- McKinney, M.L. Urbanization, Biodiversity, and Conservation. BioScience 2002, 52, 883–890. [Google Scholar] [CrossRef]
- Gaigné, C.; Riou, S.; Thisse, J.-F. Are compact cities environmentally friendly? J. Urban Econ. 2012, 72, 123–136. [Google Scholar] [CrossRef]
- Proost, S.; Van Dender, K. What Long-Term Road Transport Future? Trends and Policy Options. Rev. Environ. Econ. Policy 2011, 5, 44–65. [Google Scholar] [CrossRef]
- Krugman, P. The Self-Organizing Economy; Blackwell Publishers: Oxford, UK, 1996. [Google Scholar]
- Anas, A. Discovering the efficiency of urban sprawl. In The Oxford Handbook of Urban Economics and Planning, Chapter 6; Brooks, N., Donaghy, K., Knaap, G.-J., Eds.; Oxford University Press: New York, NY, USA, 2011; pp. 123–149. [Google Scholar]
- Ingram, G.K. Patterns of Metropolitan Development: What Have We Learned? Urban Stud. 1998, 35, 1019–1035. [Google Scholar] [CrossRef] [Green Version]
- Giuliano, G.; Kang, S. Spatial dynamics of the logistics industry: Evidence from California. J. Transp. Geogr. 2018, 66, 248–258. [Google Scholar] [CrossRef]
- EEA. Urban Sprawl in Europe; Joint EEA-FOEN Report, 11/2016; European Environmental Agency (EEA) and Federal Office for the Environment, Publications Office of the European Union: Luxembourg, 2016. [Google Scholar]
- Levinson, D.M. Network Structure and City Size. PLoS ONE 2012, 7, e29721. [Google Scholar] [CrossRef]
- Tsekeris, T.; Geroliminis, N. City size, network structure and traffic congestion. J. Urban Econ. 2013, 76, 1–14. [Google Scholar] [CrossRef] [Green Version]
- Greene, W.H. Econometric Analysis, 5th ed.; Prentice Hall: Hoboken, NJ, USA, 2003. [Google Scholar]
- Acock, A.C. A Gentle Introduction to Stata, 6th ed.; College Station, Stata Press: Texas, TX, USA, 2018. [Google Scholar]
- Persyn, D.; Diaz-Lanchas, J.; Barbero, J. Estimating Road Transport Costs between EU Regions; JRC Working Papers on Territorial Modelling and Analysis, No. 04/2019; Joint Research Centre, European Commission: Seville, Spain, 2019. [Google Scholar]
- Persyn, D.; Díaz-Lanchas, J.; Barbero, J.; Conte, A.; Salotti, S. A New Dataset of Distance and Time Related Transport Costs for EU Regions; Territorial Development Insights Series, JRC119412; European Commission: Brussels, Belgium, 2020. [Google Scholar]
- Pearson, K. Mathematical contributions to the theory of evolution.—III. Regression, heredity, and panmixia. Philos. Trans. R. Soc. London. Ser. A 1896, 187, 253–318. [Google Scholar]
- Vancauwenberghe, G.; Hernández Quirós, L. Evolution of the Access to Spatial Data for Environmental Purposes; JRC Technical Report, No. 126750; Joint Research Centre, Publications Office of the European Union: Luxembourg, 2022. [Google Scholar]
- Hennig, E.I.; Schwick, C.; Soukup, T.; Orlitová, E.; Kienast, F.; Jaeger, J.A. Multi-scale analysis of urban sprawl in Europe: Towards a European de-sprawling strategy. Land Use Policy 2015, 49, 483–498. [Google Scholar] [CrossRef] [Green Version]
- Turner, M.G.; Gardner, R.H.; O’Neill, R.V. Landscape Ecology in Theory and Practice: Pattern and Process; Springer: New York, NY, USA, 2001. [Google Scholar]
- Song, Y.; Merlin, L.; Rodriguez, D. Comparing measures of urban land use mix. Comput. Environ. Urban Syst. 2013, 42, 1–13. [Google Scholar] [CrossRef]
- Ahrend, R.; Gamper, C.; Schumann, A. The OECD Metropolitan Governance Survey: A Quantitative Description of Governance Structures in Large Urban Agglomerations; OECD Regional Development Working Papers, No. 2014/04; OECD Publishing: Paris, France, 2014. [Google Scholar]
- Aljohani, K.; Thompson, R.G. Impacts of logistics sprawl on the urban environment and logistics: Taxonomy and review of literature. J. Transp. Geogr. 2016, 57, 255–263. [Google Scholar] [CrossRef]
- Browne, M.; Allen, J.; Woodburn, A.; Piotrowska, M. The Potential for Non-road Modes to Support Environmentally Friendly Urban Logistics. Procedia-Soc. Behav. Sci. 2014, 151, 29–36. [Google Scholar] [CrossRef] [Green Version]
- Christodoulou, A.; Christidis, P. Measuring Congestion in European Cities; JRC Technical Report No. 118448; Joint Research Centre, Publications Office of the European Union: Luxembourg, 2020. [Google Scholar]
- OECD. Definition of Functional Urban Areas (FUA) for the OECD Metropolitan Database; OECD Publishing: Paris, France, 2013. [Google Scholar]


| Variable (Unit) | Source | Mean | Standard Deviation | Minimum (Region) | Maximum (Region) |
|---|---|---|---|---|---|
| Travel Distance | EC-JRC 1 | 77.12 | 44.25 | 6.31 | 289.16 |
| (km) | (Åland) | (Pohjois-ja Itä-Suomi) | |||
| Travel Time | EC-JRC | 1.76 | 1.03 | 0.23 | 10.10 |
| (hours) | (Åland) | (Notio Aigaio) | |||
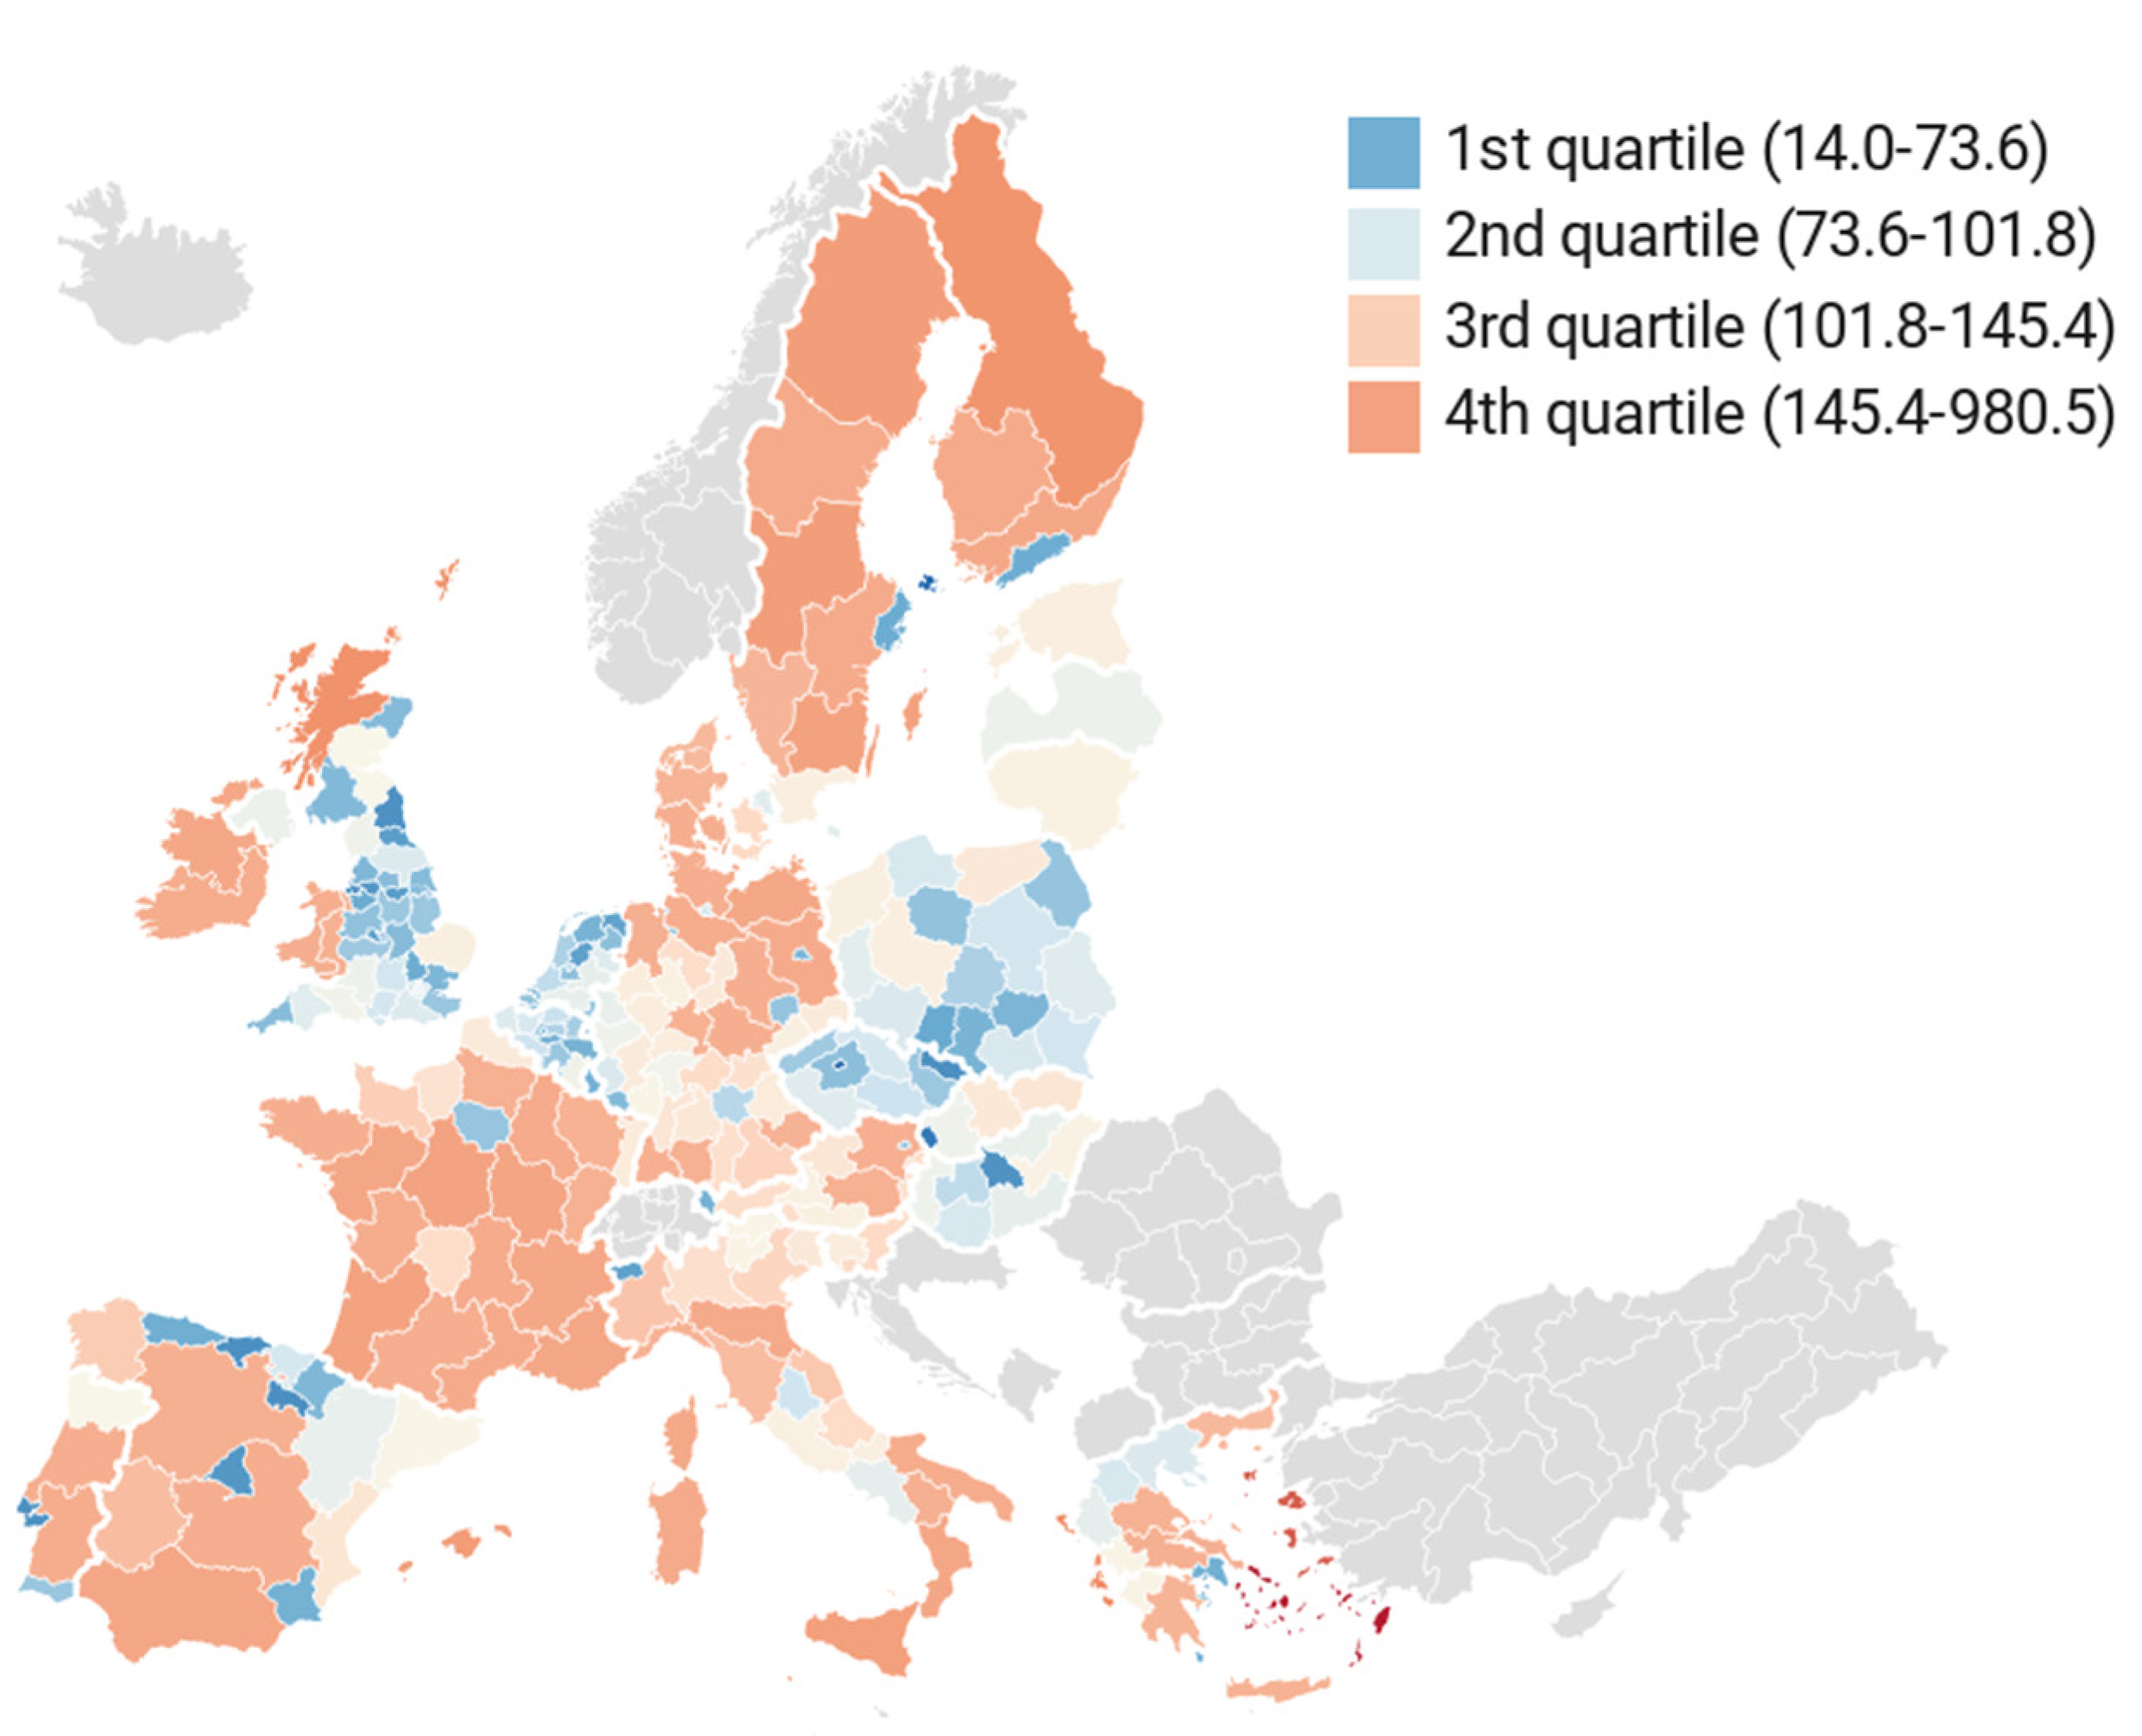
| GTC (euro) | EC-JRC | 122.59 | 89.56 | 14.00 (Åland) | 980.54 (Notio Aigaio) |
| PBA | EEA 2 | 9.27 | 11.89 | 0.29 | 85.40 |
| (%) | (Övre Norrland) | (Inner London) | |||
| LUP | EEA | 297.31 | 119.54 | 50.90 | 791.51 |
| (m2/inhab.-job) | (Inner London) | (Länsi-Suomi) | |||
| DIS | EEA | 44.75 | 2.14 | 36.27 | 49.40 |
| (UPU/m2) | (Dytiki Makedonia) | (Inner London) | |||
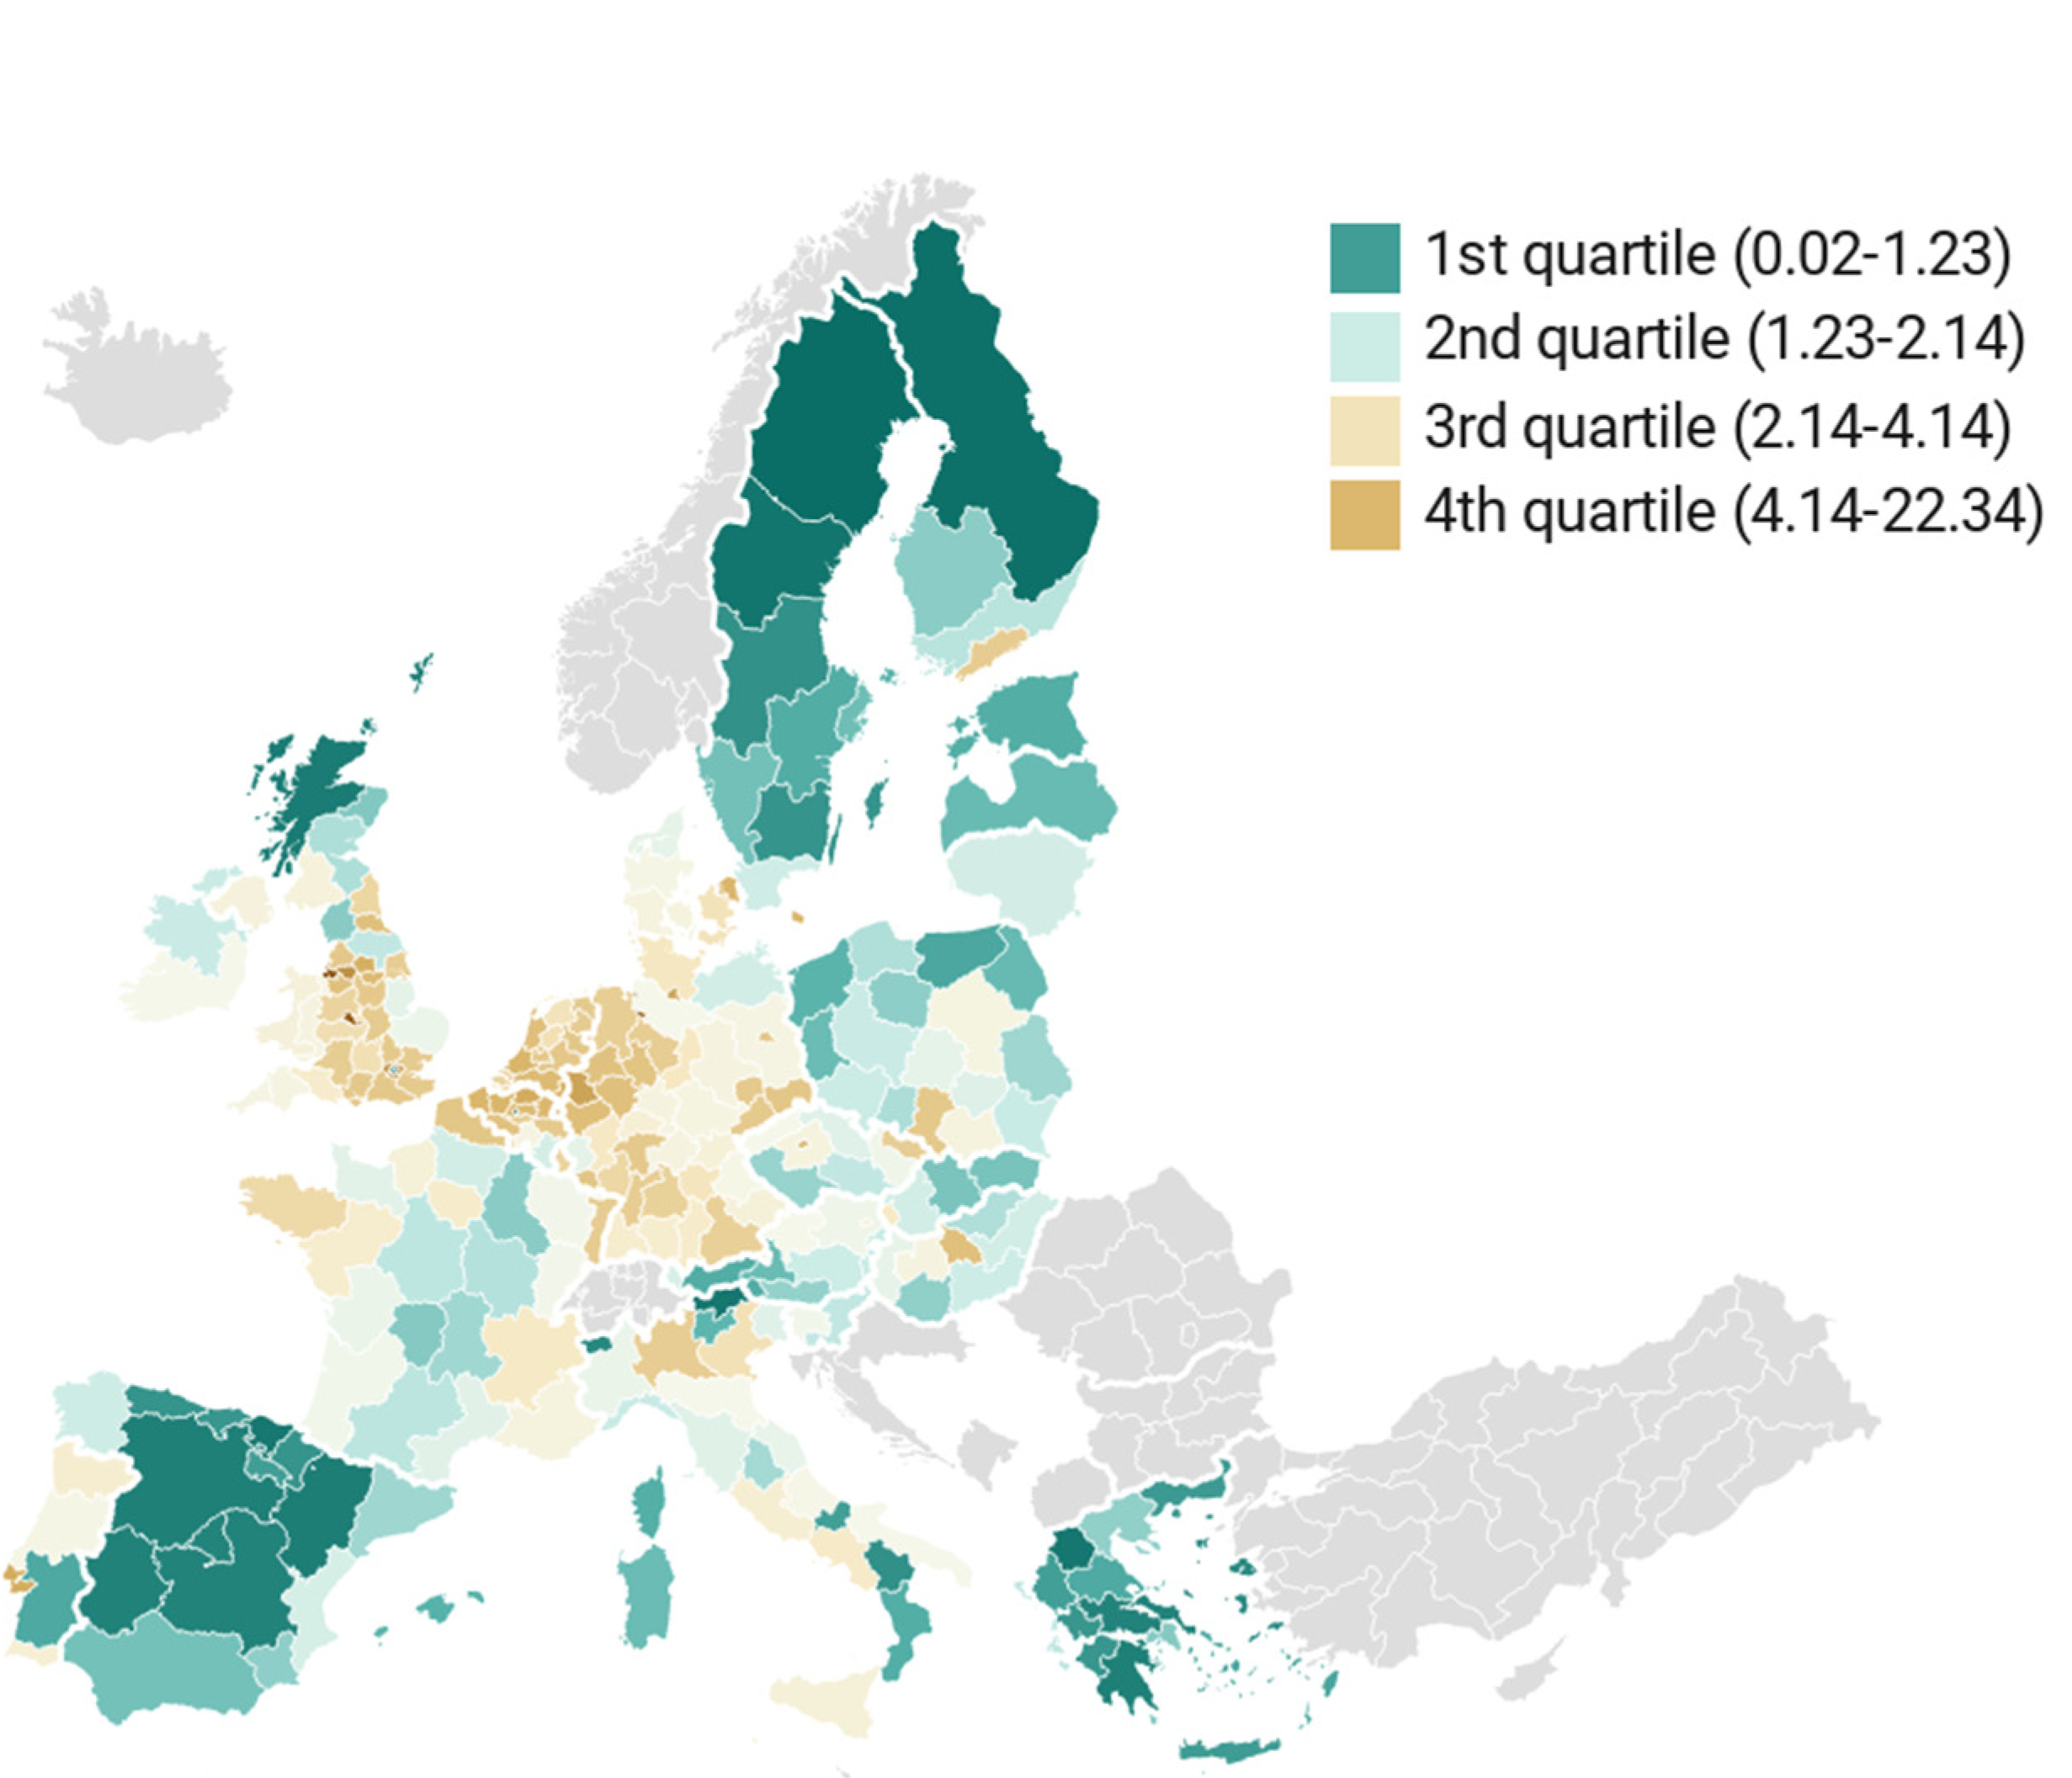
| WUP (UPU/m2) | EEA | 3.22 | 3.35 | 0.02 (Inner London) | 22.34 (Merseyside) |
| RSS (m2/inhab.-job) | LUCAS 3 | 0.54 | 1.03 | 0.04 (Övre Norrland) | 10.49 (Praha) |
| HEIS | LUCAS | 3.89 | 5.20 | 0.44 | 44.51 |
| (m2/job) | (Berlin) | (Övre Norrland) | |||
| landmix | LUCAS | 0.70 | 0.10 | 0.37 | 0.97 |
| (Inner London) | (Attiki) | ||||
| industry | Eurostat 4 | 20.04 | 7.78 | 2.35 | 48.75 |
| (%) | (Inner London) | (Groningen) | |||
| port | Eurostat | 13.02 | 31.07 | 0.00 | 362 |
| (M ton) | (Zuid-Holland) |
| PBA | LUP | DIS | WUP | RSS | HEIS | Landmix | Industry | Port | |
|---|---|---|---|---|---|---|---|---|---|
| PBA | 1.000 | ||||||||
| LUP | −0.428 | 1.000 | |||||||
| DIS | 0.631 | −0.333 | 1.000 | ||||||
| WUP | 0.680 | −0.273 | 0.624 | 1.000 | |||||
| RSS | −0.182 | 0.484 | −0.126 | −0.180 | 1.000 | ||||
| HEIS | −0.264 | 0.561 | −0.295 | −0.280 | 0.863 | 1.000 | |||
| landmix | 0.023 | −0.209 | 0.091 | 0.157 | −0.129 | −0.139 | 1.000 | ||
| industry | −0.260 | 0.229 | −0.260 | −0.098 | 0.090 | 0.018 | 0.023 | 1.000 | |
| port | 0.134 | −0.131 | 0.214 | 0.199 | −0.024 | −0.024 | 0.075 | −0.165 | 1.000 |
| 1 | 2 | 3 | 4 | 5 | 6 | |
|---|---|---|---|---|---|---|
| PBA | −0.729 *** (−0.196) | |||||
| LUP | 0.160 *** (0.432) | |||||
| DIS | −6.757 *** (−0.327) | |||||
| WUP | −1.836 ** (−0.139) | |||||
| RSS | 19.388 *** (0.451) | |||||
| HEIS | 3.617 *** (0.425) | |||||
| landmix | −70.794 ** (−0.165) | −40.924 (−0.095) | −39.685 (−0.092) | −49.634 (−0.115) | −44.337 * (−0.103) | −37.312 (−0.087) |
| FUA 1–2 M | −14.038 * (−0.106) | −8.052 (−0.061) | −9.446 (−0.071) | −15.238 ** (−0.115) | −16.748 ** (−0.126) | −13.624 ** (−0.103) |
| FUA 2–3 M | −18.791 ** (−0.102) | −12.038 * (−0.065) | −18.609 ** (−0.101) | −27.274 *** (−0.148) | −26.131 *** (−0.142) | −26.172 *** (−0.142) |
| FUA > 3 M | −27.562 *** (−0.135) | −24.224 *** (−0.118) | −22.805 ** (−0.111) | −41.260 *** (−0.202) | −42.404 *** (−0.207) | −36.888 *** (−0.180) |
| industry | −0.583 (−0.103) | −0.603 (−0.106) | −0.581 (−0.102) | −0.379 (−0.067) | −0.483 (−0.085) | −0.386 (−0.068) |
| port | 0.162 ** (0.114) | 0.176 ** (0.123) | 0.172 ** (0.121) | 0.167 * (0.117) | 0.167 ** (0.117) | 0.166 * (0.117) |
| east | 60.938 *** (0.510) | 49.546 *** (0.415) | 56.270 *** (0.471) | 58.906 *** (0.493) | 93.295 *** (0.781) | 46.295 *** (0.387) |
| Constant | 121.110 *** | 53.769 ** | 403.296 *** | 104.668 *** | 85.770 *** | 80.133 *** |
| Region effects 1 | included | included | Included | included | included | included |
| R2 | 0.459 | 0.507 | 0.477 | 0.451 | 0.548 | 0.539 |
| Root MSE | 34.689 | 33.091 | 34.101 | 34.920 | 31.701 | 32.017 |
| Observations | 245 | 245 | 245 | 245 | 245 | 245 |
| 1 | 2 | 3 | 4 | 5 | 6 | |
|---|---|---|---|---|---|---|
| PBA | −0.009 * (−0.103) | |||||
| LUP | 0.002 *** (0.261) | |||||
| DIS | −0.105 * (−0.218) | |||||
| WUP | −0.024 (−0.078) | |||||
| RSS | 0.260 *** (0.259) | |||||
| HEIS | 0.045 *** (0.229) | |||||
| landmix | −1.835 ** (−0.183) | −1.429 * (−0.143) | −1.377 * (−0.138) | −1.566 * (−0.156) | −1.490 ** (−0.149) | −1.418 * (−0.142) |
| FUA 1–2 M | −0.243 * (−0.079) | −0.150 (−0.048) | −0.155 (−0.050) | −0.255 * (−0.082) | −0.274 ** (−0.088) | −0.236 * (−0.076) |
| FUA 2–3 M | −0.364 ** (−0.085) | −0.242 (−0.056) | −0.312 (−0.073) | −0.463 ** (−0.108) | −0.445 ** (−0.104) | −0.452 *** (−0.105) |
| FUA >3 M | −0.429 *** (−0.090) | −0.351 * (−0.074) | −0.298 (−0.063) | −0.593 *** (−0.125) | −0.608 *** (−0.128) | −0.540 *** (−0.113) |
| industry | −0.031 ** (−0.233) | −0.031 *** (−0.237) | −0.031 *** (−0.237) | −0.028 ** (−0.213) | −0.030 *** (−0.224) | −0.028 ** (−0.214) |
| port | 0.002 * (0.067) | 0.002 ** (0.074) | 0.002 * (0.074) | 0.002 * (0.070) | 0.002 ** (0.070) | 0.002 * (0.069) |
| east | 1.495 *** (0.538) | 1.160 *** (0.417) | 1.397 *** (0.502) | 1.463 *** (0.526) | 1.778 *** (0.639) | 1.309 *** (0.471) |
| Constant | 2.958 *** | 2.042 *** | 7.400 *** | 2.757 *** | 2.504 *** | 2.450 *** |
| Region effects 1 | included | included | Included | included | included | included |
| R2 | 0.407 | 0.426 | 0.418 | 0.405 | 0.438 | 0.431 |
| Root MSE | 0.845 | 0.831 | 0.837 | 0.846 | 0.823 | 0.828 |
| Observations | 245 | 245 | 245 | 245 | 245 | 245 |
| 1 | 2 | 3 | 4 | 5 | 6 | |
|---|---|---|---|---|---|---|
| PBA | −0.943 ** (−0.125) | |||||
| LUP | 0.196 ** (0.261) | |||||
| DIS | −6.849 (−0.164) | |||||
| WUP | −1.898 (−0.071) | |||||
| RSS | 23.115 *** (0.266) | |||||
| HEIS | 3.698 ** (0.215) | |||||
| landmix | −140.536 * (−0.162) | −103.445 (−0.119) | −106.863 (−0.123) | −116.670 (−0.134) | −108.214 (−0.124) | −104.226 (−0.120) |
| FUA 1–2 M | −20.784 * (−0.077) | −13.800 (−0.051) | −17.492 (−0.065) | −23.278 * (−0.087) | −24.509 ** (−0.091) | −21.679 * (−0.081) |
| FUA 2–3 M | −29.044 * (−0.078) | −21.811 * (−0.059) | −32.964 * (−0.088) | −41.621 *** (−0.112) | −39.286 *** (−0.105) | −40.564 *** (−0.109) |
| FUA >3 M | −44.404 ** (−0.107) | −41.511 ** (−0.100) | −44.333 * (−0.107) | −62.971 *** (−0.152) | −63.825 *** (−0.154) | −58.538 *** (−0.141) |
| industry | −2.473 ** (−0.215) | −2.486 ** (−0.216) | −2.422 ** (−0.210) | −2.216 ** (−0.193) | −2.336 ** (−0.203) | −2.224 ** (−0.193) |
| port | 0.196 * (0.068) | 0.212 ** (0.074) | 0.202 * (0.070) | 0.196 * (0.068) | 0.200 * (0.070) | 0.196 * (0.068) |
| east | −1.733 (−0.007) | −32.419 (−0.134) | −4.278 (−0.018) | −1.806 (−0.007) | 21.273 (0.088) | 14.589 (−0.060) |
| Constant | 228.147 *** | 144.578 ** | 509.509 ** | 206.852 *** | 184.331 *** | 181.764 *** |
| Region effects 1 | included | included | Included | included | included | included |
| R2 | 0.352 | 0.369 | 0.354 | 0.347 | 0.382 | 0.370 |
| Root MSE | 76.826 | 75.807 | 76.713 | 77.084 | 75.031 | 75.758 |
| Observations | 245 | 245 | 245 | 245 | 245 | 245 |
Publisher’s Note: MDPI stays neutral with regard to jurisdictional claims in published maps and institutional affiliations. |
© 2022 by the author. Licensee MDPI, Basel, Switzerland. This article is an open access article distributed under the terms and conditions of the Creative Commons Attribution (CC BY) license (https://creativecommons.org/licenses/by/4.0/).
Share and Cite
Tsekeris, T. Freight Transport Cost and Urban Sprawl across EU Regions. Sustainability 2022, 14, 5217. https://doi.org/10.3390/su14095217
Tsekeris T. Freight Transport Cost and Urban Sprawl across EU Regions. Sustainability. 2022; 14(9):5217. https://doi.org/10.3390/su14095217
Chicago/Turabian StyleTsekeris, Theodore. 2022. "Freight Transport Cost and Urban Sprawl across EU Regions" Sustainability 14, no. 9: 5217. https://doi.org/10.3390/su14095217
APA StyleTsekeris, T. (2022). Freight Transport Cost and Urban Sprawl across EU Regions. Sustainability, 14(9), 5217. https://doi.org/10.3390/su14095217


