Article

Artificial Neural Network-Forecasted Compression Strength of Alkaline-Activated Slag Concretes

1
Department of Civil and Construction Engineering, Faculty of Engineering and Science, Curtin University Malaysia, CDT 250, Miri 98009, Malaysia
2
Department of Civil Engineering, College of Engineering, Prince Sattam Bin Abdulaziz University, Alkharj 11942, Saudi Arabia
3
Department of Civil Engineering, Faculty of Engineering and IT, Amran University, Amran 9677, Yemen
4
Polytechnic Institute, Far Eastern Federal University, 690922 Vladivostok, Russia
5
World-Class Research Center of Advanced Digital Technologies, Peter the Great St. Petersburg Polytechnic University, 195251 St. Petersburg, Russia
6
Department of Civil Engineering, Faculty of Engineering, Universiti Malaysia Sarawak, Kota Samarahan 94300, Malaysia
7
UNIMAS Water Centre, Faculty of Engineering, Universiti Malaysia Sarawak, Kota Samarahan 94300, Malaysia
*
Author to whom correspondence should be addressed.
Sustainability 2022, 14(9), 5214; https://doi.org/10.3390/su14095214
Submission received: 23 January 2022 / Revised: 17 February 2022 / Accepted: 23 February 2022 / Published: 26 April 2022

Abstract

:
The utilization of ordinary Portland cement (OPC) in conventional concretes is synonymous with high carbon emissions. To remedy this, an environmentally friendly concrete, alkaline-activated slag concrete (AASC), where OPC is completely replaced by ground granulated blast-furnace slag (GGBFS) industrial waste, is one of the currently pursued research interests. AASC is not commonly used in the construction industry due to limitations in experience and knowledge on the mix proportions and mechanical properties. To circumvent great labour in the experimental works toward the determination of the optimal properties, this study, therefore, presents the compressive strength prediction of AASC by employing the back-propagation artificial neural network (ANN) modelling technique. To construct this model, a sufficiently equipped experimental databank was built from the literature covering varied mix proportion effects on the compressive strength of AASC. For this, four model variants with different input parameter considerations were examined and the ideal ANN architecture for each model with the best input number–hidden layer neuron number–output number format was identified to improve its prediction accuracy. From such a setting, the most accurate prediction model with the highest determination coefficient, R2, of 0.9817 was determined, with an ANN architecture of 8-18-1 containing inputs such as GGBFS, a fine to total aggregate ratio, sodium silicate, sodium hydroxide, mixing water, silica modulus of activator, percentage of sodium oxide and water–binder ratio. The prediction accuracy of the optimal ANN model was then compared to existing ANN-based models, while the variable selection was compared to existing AASC models with other machine learning algorithms, due to limitations in the ANN-based model. To identify the parametric influence, the individual relative importance of each input variable was determined through a sensitivity analysis using the connection weight approach, whose results indicated that the silica modulus of the activator and sodium silicate greatly affected the AASC compressive strength. The proposed methodology demonstrates that the ANN-based model can predict the AASC compressive strength with a high accuracy and, consequently, aids in promoting the utilization of AASC in the construction industry as green concrete without performing destructive tests. This prediction model can also accelerate the use of AASC without using a cement binder in the concrete matrix, leading to produce a sustainable construction material.

1. Introduction

Currently, ordinary Portland cement (OPC), also known as conventional cement, is the most extensively used cementitious material in the construction industry [1]. Cement has long been applied as a binder in construction materials since ancient times [2,3]. With the rapid development of infrastructure and growth in population, the global demand for cement for construction and building purposes has increased in direct correspondence to the enhancing need for concrete usage [4,5]. Approximately, 4.1G tonnes of cement were produced globally in 2019, and such a high amount remained since 2014. According to Widera and Stone [6], cement manufacturing is one of the most energy-intensive processes and the largest source of greenhouse gas emissions among all industrial processes. Furthermore, the fabrication of cement is associated with a large amount of carbon dioxide (CO2) emissions being released into the atmosphere [5,7,8,9,10,11,12].
To mitigate the anthropogenic emission of carbon dioxide, one current prospective practice is the utilisation of supplementary cementitious materials (SCMs) as the replacement of OPC [13,14,15,16]. This exercise has contributed broadly to much construction material innovations lately. Some examples, to note a few, include natural pozzolans, ground granulated blast-furnace slag (GGBFS) [17,18,19], fly ash (FA) [3,12,20,21,22], rice husk ash [23,24,25], and silica fumes [26,27,28,29]. In terms of convention, partially replacing OPC with slag-based SCMs, such as GGBFS, produces slag concrete, while substituting the cement completely with GGBFS results in alkali-activated slag concrete (AASC). As the cement content is 100% replaced by SCMs (GGBFS), it leads to a reduction in the activation ability of GGBFS. Hence, to enhance the strength, an alkaline activator is commonly used to activate the clinker-free (cement-free) SCMs. The concrete, which uses activated SCMs in the mix, is alternately defined as alkali-activated concrete. AASC that employs alkali-activated GGBFS is receiving increasing attention as an alternative to OPC concrete (OPCC) [30]. Through the replacement of traditional OPC as a binder with alkali-activated slag (AAS), less energy is required in production, with lowered CO2 emissions from the clinker-free cement fabrication. To put things into perspective, the production of 1 tonne of slag requires approximately 1300 MJ of energy and releases around 0.07 tonnes of CO2, whereas the production of an equivalent amount of OPC requires up to 5000 MJ of energy coupled with high CO2 emissions amounting to 1 tonne [31]. The utilization of AASC is an environmentally supportive solution to reduce carbon emissions, as the effective use of industrial by-products in concrete fabrication not only reduces the amount of CO2 and energy required, but also alleviates burdens on the environment in the form of landfills and pollution.
Several existing studies have found that AASC exhibits excellent properties compared to the traditional OPCC [19,32]. Thomas et al. [33] concluded that AASC, compared to OPCC, offers a lower heat of hydration, faster hydration rate, higher early strength, flexural and compressive strength, and better durability in an aggressive environment. Bakharev et al. [34] revealed that AASC is more durable in a sulphate environment compared to OPCC, as deduced from the observation that OPCC’s strength decrease was greater and that products of degradation and microstructural changes were observed on the surface of OPC samples after up to 12 months of exposure to sodium sulphate solution. Despite such advantages, previous studies have also shown that AASC has a higher autogenous and drying shrinkage rate than OPCC. Thus, it is crucial to form a clear understanding of the mechanical strength and properties of any new type of concrete, such as AASC, in both its beneficial characteristics and limitations before adopting it in practice.
In the construction industry, the compressive strength test is customarily carried out for concrete samples at the ages of 3 days, 7 days, and 28 days for quality assurance and quality control. Nonetheless, a waiting period of 28 days can be taxing both in time, labour, and cost. The 28-day strength evaluation is a mandatory requirement, as it confirms the quality and the desired strength of the material. Kabir et al. [35] stated that, generally, concrete mix design is based on the code recommendation, field/past experiences, or trial mixtures. Any error or variation that occurs in the mix design or during the mix preparation may cause the strength test result to not attain the designed concrete strength; hence, causing the entire mixing process to have to be repeated. There have been several strength prediction models developed [36,37,38]. Since AASC remains rarely adopted in construction, to determine the suitable design mix for specific design strength, experiments and tests are customarily required. To circumvent this laborious event, a good strength prediction model would be a more convenient method to estimate the characteristic strength of AASC at the early stage before performing the optimisation of the mixture in achieving the desired concrete strength.
Recent modelling advances have seen an upward trend and many beneficial contributions of machine learning or artificial neural network (ANN) in characterising the mechanical properties of construction materials [39] or structural prediction [40]. Observationally complying findings have been reported in these studies. Moreover, predicting the compressive strength through a machine learning algorithm [41,42,43,44] is a nondestructive technique, where only a little or no sample preparation is required [45].
Thus, the laborious, as well as cost and time-consuming experiment event can be hugely reduced in the design mix determination. The utilization of the prediction model can not only reduce the cost and time for testing, but it also allows more economical use of raw materials for a high sustainability merit and prevents unnecessary construction failures. It has not escaped the authors that much research and development has already been carried out in the prediction models for concrete compressive strength. It is notable to see, however, that most of the previous prediction models were derived for conventional concretes, i.e., OPC concretes. In this context, these previous prediction models may not work accurately for the prediction of AASC compressive strength. This study, therefore, fulfils this gap by developing a strength prediction model of AASC for a safe and reliable application in the construction industry.
The proposed model is developed as shown in Figure 1 using ANN. Previously published data are gathered for data bank development. The selection of a variable and ANN architecture can also be determined from a previous study to be adapted to the current study.
The MATLAB Deep Learning Toolbox is used to train and analyse the developed data bank. The accuracy of the developed model is examined before any further analysis is performed. A sensitivity or parametric study is performed to understand the predominant factors of compressive strength development in AASC. The newly developed prediction model is able to promote the use of green construction materials with a high accuracy of compressive strength prediction. Therefore, practisers are more confident in applying AASC in the construction industry that reducing the cement usage.

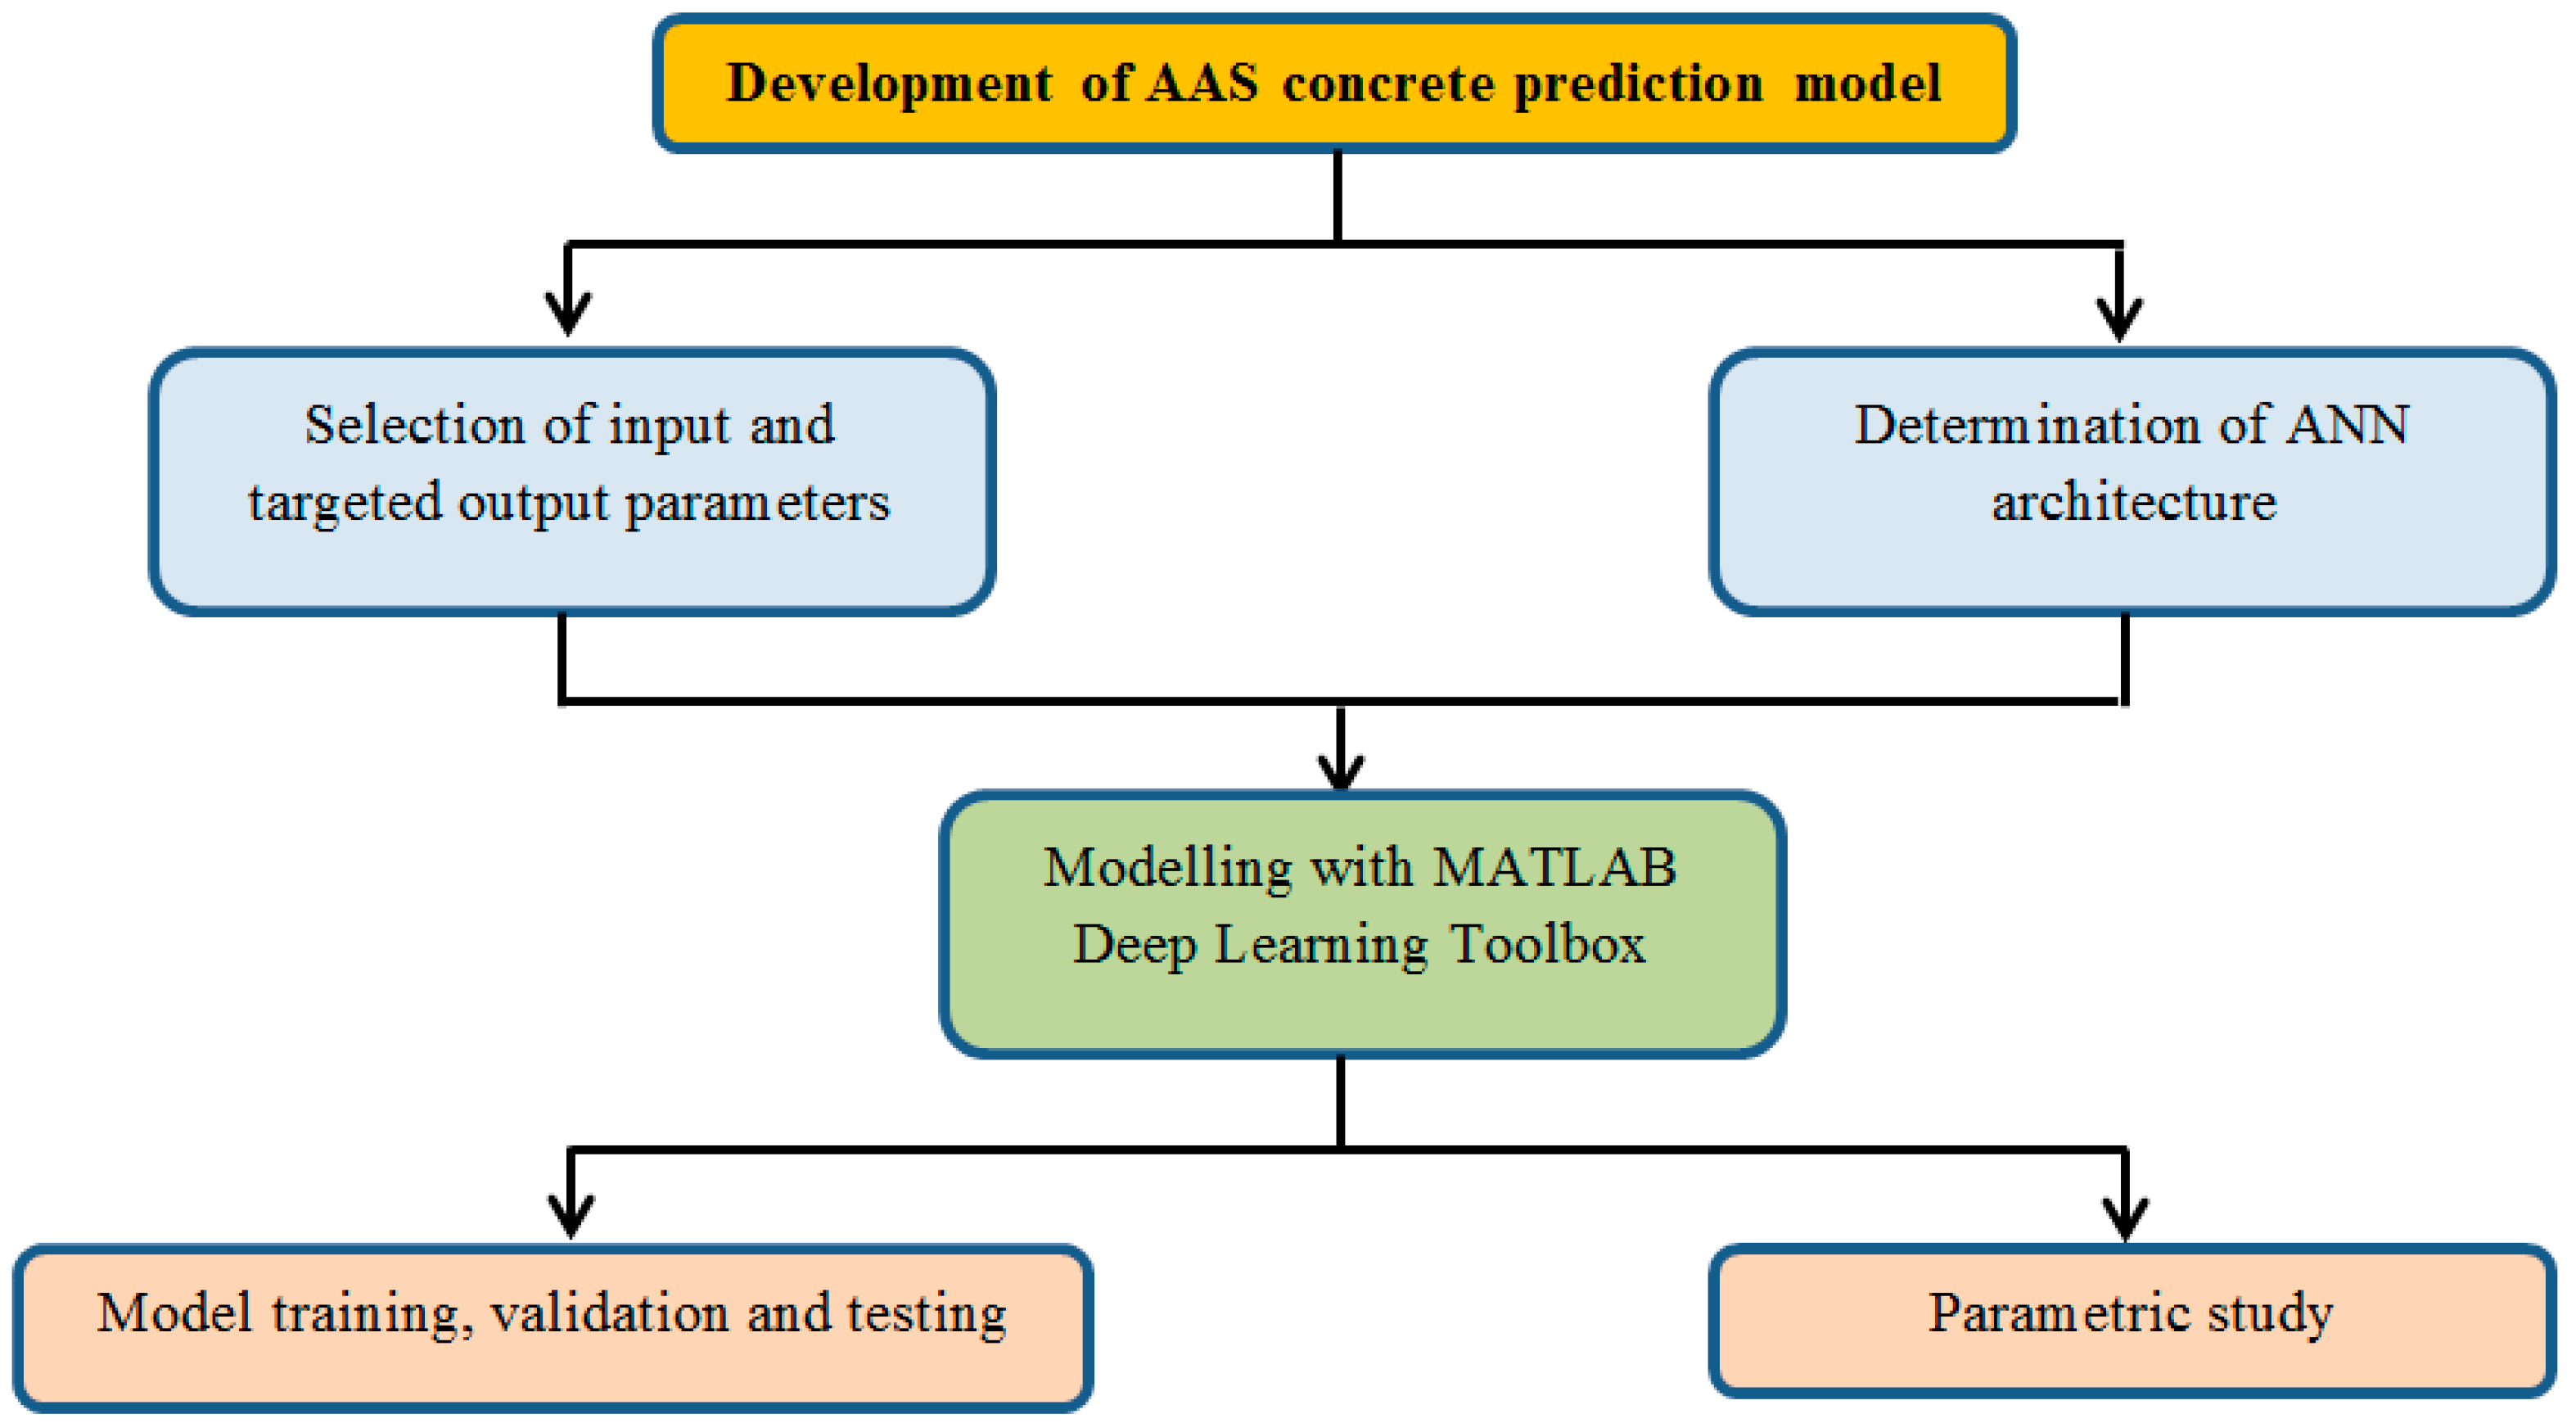
2. Artificial Neural Network Model Development

ANN models have shown a reliable strength prediction and were applied in this research to produce a highly accurate compressive strength prediction for AASC. Previous published data were gathered for data bank development. The selection of a variable and ANN architecture could also be determined from a previous study to be adapted to the current study. The MATLAB Deep Learning Toolbox was used to train and analyse the developed data bank. A sensitivity or parametric study was performed to understand the predominant factors of the compressive strength development in AASC.

2.1. Data Bank Construction

The primary goal of this study was to construct a reliable and accurate strength prediction artificial neural network (ANN) model for the compressive strength of AASC that could potentially be applicable in the construction field. The accuracy and reliability of an ANN prediction model are mainly based on the quality and quantity of the available data. Most of the previous ANN model studies were based on the databases constructed from their experimental results, which were limited to the specific environment and material composition [46].
In this study, a data bank was first built by conducting a literature review to collect extensive and detailed information on the mix proportions, physical properties of composites, and mechanical properties of AASC. In total, 181 sets of AASC design mix produced with different mix proportions were gathered from different reliable sources consisting of previously published or available studies on the behaviour of AASC [30,47,48,49,50,51,52,53,54,55,56,57,58,59,60,61]. As the data obtained for this study were mainly from various sources, the developed ANN-based prediction model would be more general. All the collected data were principally stored and organized in a spread sheet by stating the sources. The relevant data included the AASC compressive strength and the AASC mix design with all proportions of alkali activators, precursors (GGBFS), fine and coarse aggregates [62,63,64], water/binder ratios, slag compositions, finenesses of slag, specific gravities of slag, water contents, molar concentrations of sodium hydroxide, ratios of sodium hydroxide to sodium silicate, etc.

2.2. Variables Selection

An Appropriate selection of variables for inputs was essential to improve the accuracy of the compressive strength prediction of AASC, utilising ANN models. When choosing the input variables, it was important to consider the relationship between the variables and the target output. The suitable input variables used for the ANN model in this study were identified based on previous experimentation on ANN models and additional variables required specifically for AASC. Input variables from previous works on various concretes using ANN models are summarised in Table 1, with the model accuracy described in terms of the correlation factor, R2. The selection of input variables also considered the difficulties in the data collection due to the limitation of findings on AASC using the ANN model, and the utilization of AASC in the construction field.
Table 1. Summary of input variables for strength prediction using ANN in previous studies.
RefsInputR2
[65]Cement; BFS; FA; ultrasonic; pulse velocity; rebound number; curing age0.993
[66]Cement; nanosilica and diameter; superplasticiser; fine and coarse aggregates; w/b ratio0.868
[46]Binder; w/b ratio; fly ash; fine and coarse aggregate; superplasticiser0.941
[67]Cement; nanosilica; fine aggregate; copper slag; age of specimen; superplasticiser0.950
[68]Cement; BFS; FA; water; superplasticiser; fine and coarse aggregates0.860
[69]Water absorption; fine aggregate; recycled and natural coarse aggregates; w/b ratio; water/total material ratio0.999
[70]Cement; FA; fine and coarse aggregates; w/b ratio0.892
[71]Concrete density; cement; FA; SF; water; fine and coarse aggregates; w/b ratio0.930
[72]FA; water glass solution; sodium hydroxide solution; coarse aggregate; fine aggregate; water; concentration of sodium hydroxide; curing time; curing temperature0.970
[41,43]Concrete age, NaOH concentration, SF, GGBFS, natural zeolite0.961
Annotations: FA—fly ash; BFS—blast-furnace slag; GGBFS—ground granulated blast-furnace slag; w/b—water-to-binder.
In this study, the input variables were divided into two categories defined as primary and secondary variables. Primary variables were considered as those directly and significantly affecting the dependent parameter, concrete compressive strength, whereas secondary variables were defined as the supportive measurements related to the primary variables that could influence the dependent parameter. According to the existing machine learning prediction model for concrete compressive strength, the adopted primary input variables were, generally, the constituent materials, also called raw materials of concrete or the design mix proportion of concrete, since the mechanical properties of concrete are highly dependent on these variables. Hence, the common variables, such as the binder (slag) content, fine and coarse aggregates, activators, and liquid/binder ratio (l/b), that were utilised in existing models were likewise considered as primary inputs in this study.
As this study aimed to research AASC, previous studies or literature regarding AASC were taken into considerations when selecting the additional primary and secondary input variables for AASC instead of conventional concrete. The activator utilised for AASC in this prediction model was that combining sodium hydroxide and a sodium silicate solution based on the data collection. For the primary variables, the molarity of the NaOH solution, the proportion of NaOH to the Na2SiO3 solution, the percentage of Na2O, and the silica modulus of the activator, Ms, was the main variables that affected the compressive strength of AASC. However, due to the reason that the collected data came from existing experimental studies from different researchers, values were customarily described in different terms, or the concrete may have been prepared with different procedures, so there were limitations on determining the molarity of the solution. For instance, some activators were prepared by adding NaOH pellets or flakes straight into the Na2SiO3 solution, while some were prepared by adding the premixed NaOH solution to the Na2SiO3 solution. A similar case could be determined concerning the ratio of NaOH to the Na2SiO3 solution. Hence, to standardise the variables, the NaOH pellets/flakes content (solid) and the water added into the mix were included as the input variables instead of the molarity and the ratio of combination. In short, the primary variables considered for the AASC design mix included the slag content, ratio of fine aggregate to total aggregate (F:T), Na2SiO3 solution, NaOH solid content, mixing water, Ms, Na2O%, and total water/binder ratio (w/b), where the total water included the water from sodium silicate and added water.
In terms of the secondary variables, the physical properties, generally, the specific surface area of slag, were related to the mechanical properties of AASC. Hence, the Blaine fineness of slag was taken into account. Moreover, data collected from AASC specimens were from different experimental studies that used different methods to cure the concrete until testing to obtain their compressive strength at 28 days. Hence, the curing methods of concrete specimens had to be considered as secondary variables. From the data, the employed curing methods were air curing at ambient/room temperature, chamber curing at approximately 20 °C, water curing, membrane curing with a sheet covering, and heat curing at 60 °C. Since the prediction model for AASC compressive strength was the goal, only one variable, the compressive strength of AASC, fc′, was considered in the output layer (also called the dependent variable). Table 2 summarises the inputs and output details of the proposed model.

2.3. ANN Prediction Models

Four models with different combinations of inputs were trained in determining the one with the highest accuracy. As shown in Table 3, Model C0 was developed to predict the compressive strength of AASC with primary inputs only, whereas Models CF and CR were developed with primary inputs and one of the secondary inputs, which were the Blaine fineness and curing type, respectively. For Model CFR, the inputs were both primary and secondary variables. The output for all models was the same, which was the compressive strength of AASC at 28 days.

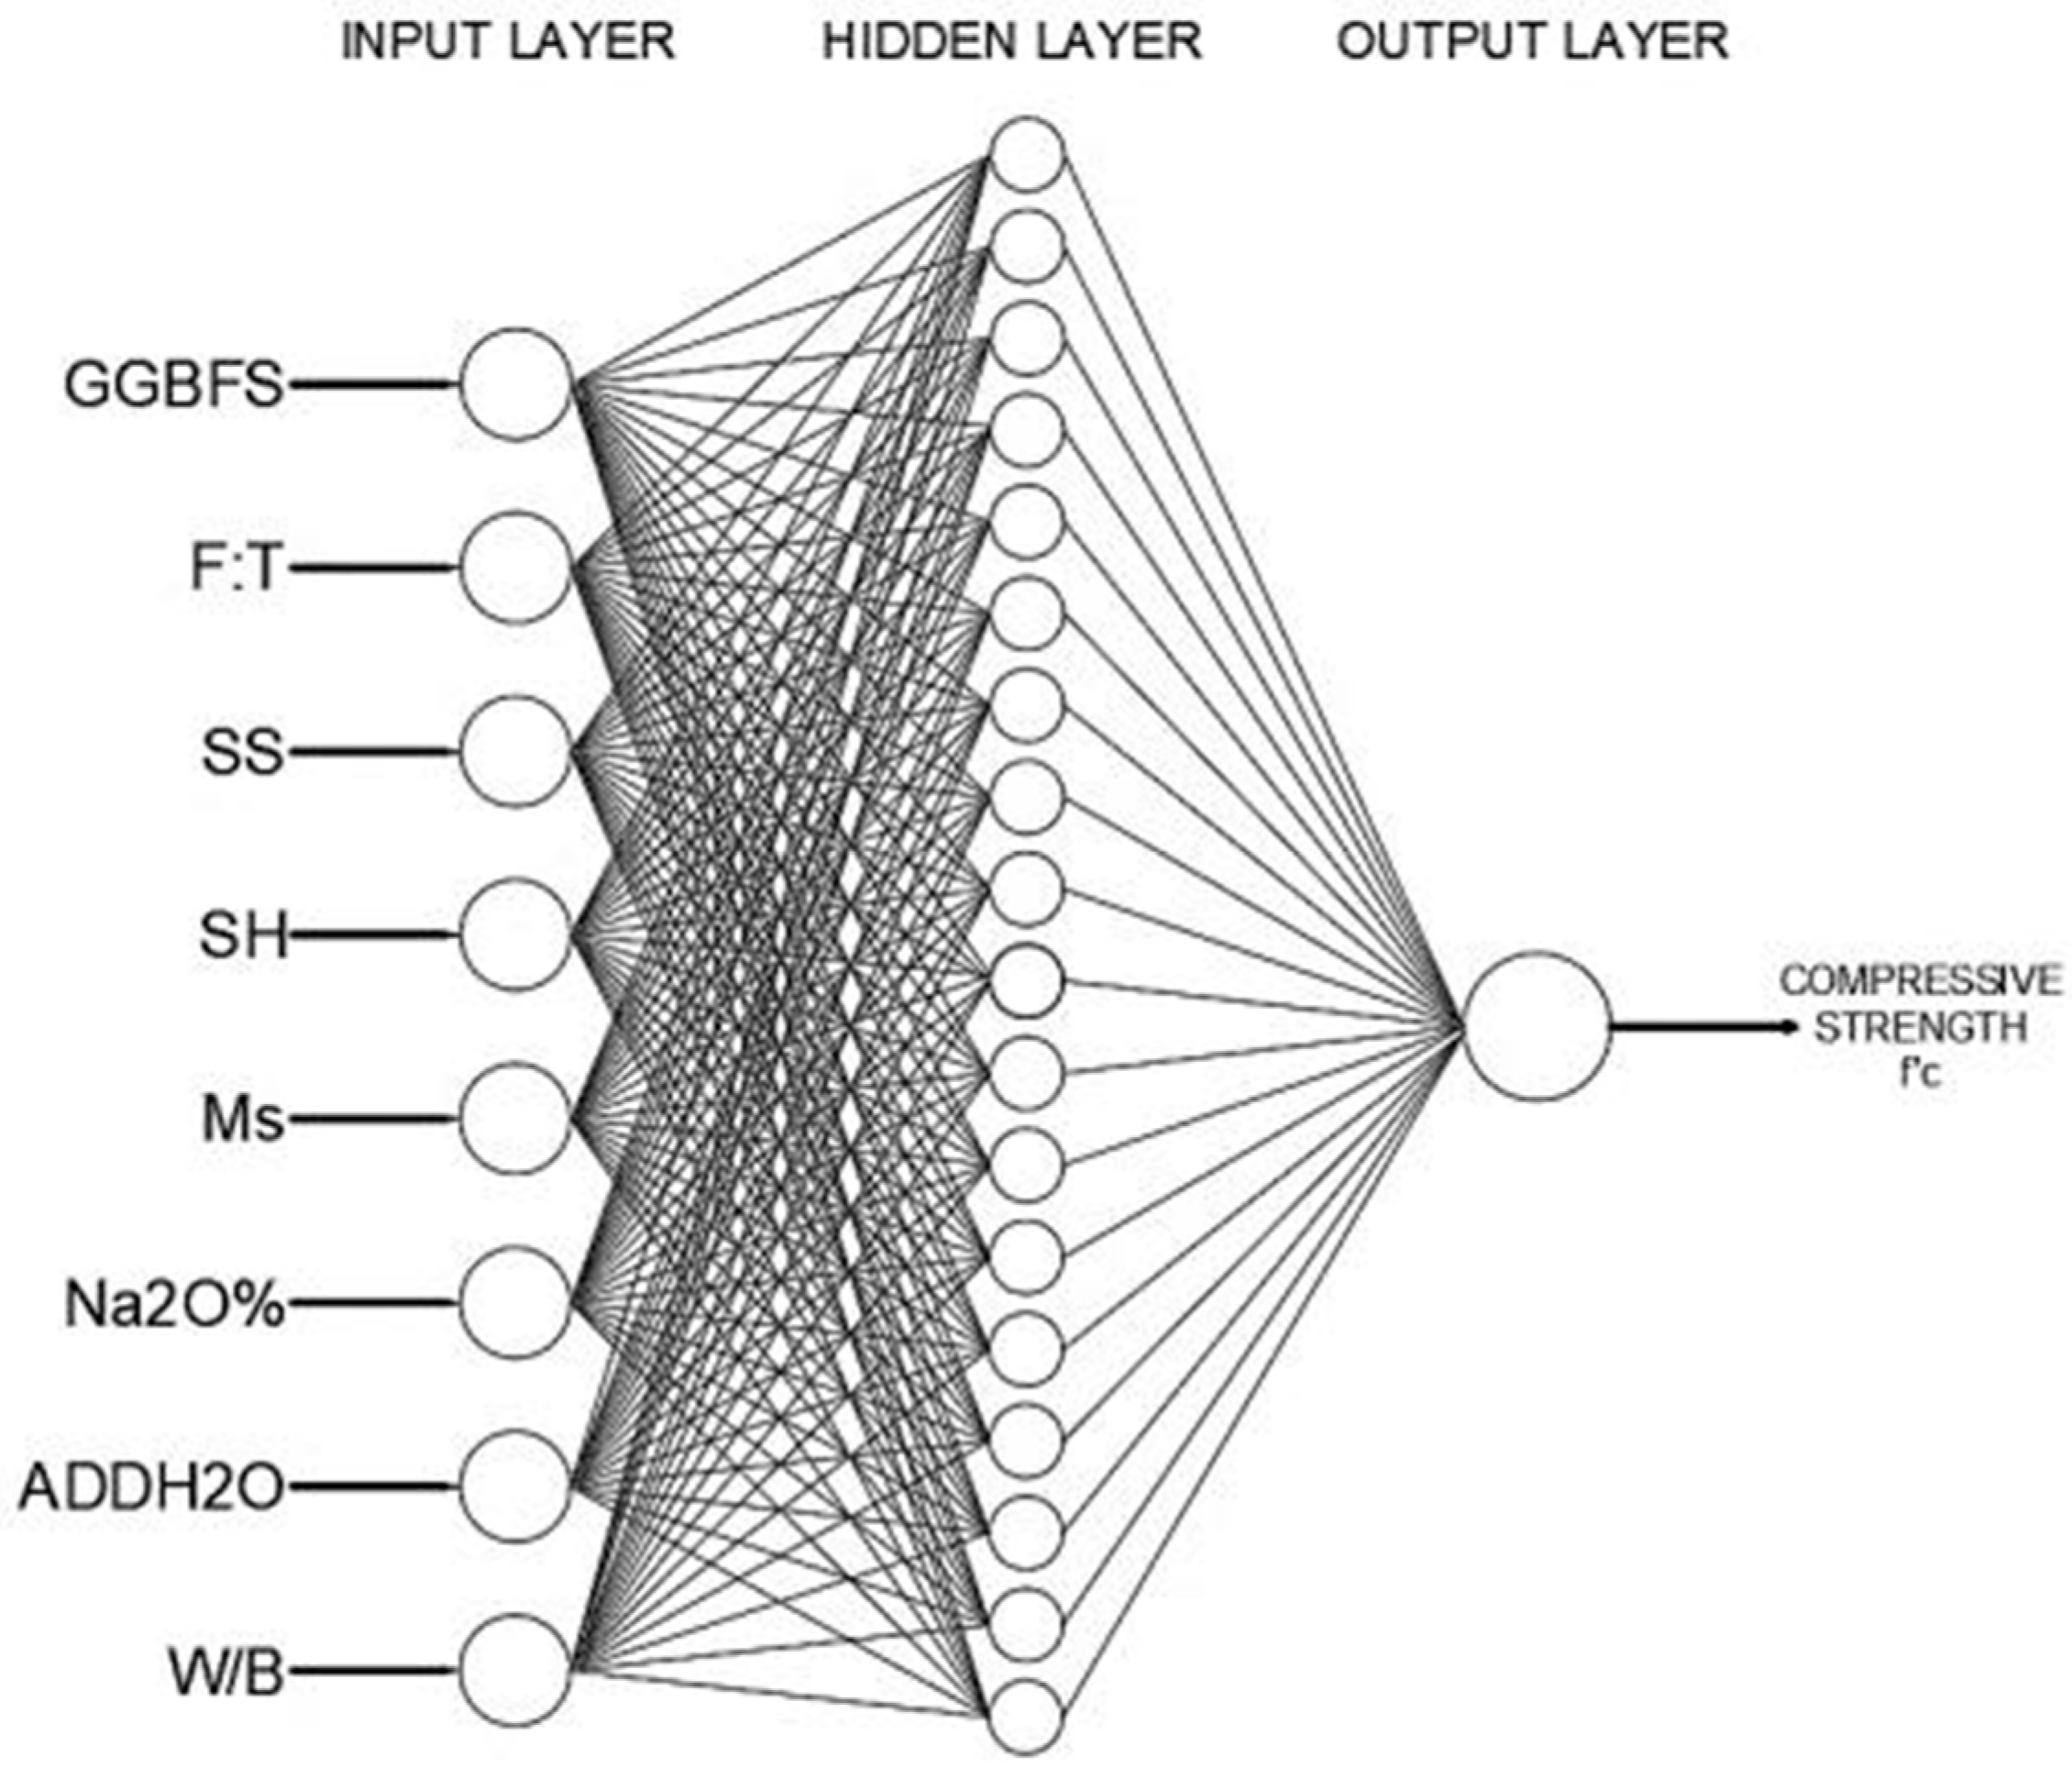
2.3.1. ANN Architecture

Figure 2 shows the typical ANN model for AASC. Specialised computer software was used in building the ANN model. The prediction model of AASC compressive strength, MC0, MCF, MCR, and MCF were developed using the MATLAB Deep Learning Toolbox. The Levenberg–Marquardt training algorithm with a back-propagation approach in the MATLAB Deep Learning Toolbox was implemented for the modelling of the network. Levenberg–Marquardt is a feed-forward ANN model that minimises the error for a particular training pattern by automatically managing the relationships between variables and adjusting the weight of data at a small amount each time. Training with this algorithm automatically stops when the generalisation stops.
The predictive accuracy and generalisation capability of ANN models in predicting compressive strength are affected by the architecture of the ANN [68]. The architecture of an ANN model is generally described in terms of the input number–hidden layer neuron number–output number format. For instance, an ANN architecture of 3-5-1 contains three inputs, five neurons in one hidden layer, and one output.
In this study, the number of neurons in the input layer was based on the selection of input variables, which are known as independent variables; meanwhile, the number of neurons in the output layer was equal to the number of dependent variables, i.e., the compressive strength. According to Atici [65], there is no general rule in selecting the number of hidden neurons. The appropriate number of hidden nodes is selected by varying the number of hidden nodes during the model learning, and the optimal number of hidden nodes is determined based on the best prediction performance [73].
To identify the range of the number of neurons in the hidden layer, the architecture of the ANN model from previous studies that attained good prediction accuracy was nominated and considered for further scrutiny. The accuracy of the model was described in terms of R2. The number of hidden neurons could also be determined using different proposed heuristics from existing studies when designing the ANN architecture. In this study, to design a stable ANN model and to ensure the generalisation of the network, the optimal number of hidden neurons was determined within the range of the number of neurons in the hidden layer by referring to the previous model that exhibited a high accuracy.
For Models C0, CF, CR, and CFR, a total of 8, 9, 9, and 10 input variables was selected, respectively. The corresponding number of calculated hidden neurons for each of the models was within the range of 3–17, 3–19, 3–19, and 4–21 from the heuristics listed in Table 3. The ANN architectures applied in existing models had a similar number of hidden neurons, ranging from 4 to 18, with one or two hidden layers. Therefore, this study considered the testing ranges to be 1–25, which included the recommended values from both the proposed heuristics and previously applied ANN architecture to determine the optimal ANN architecture. In terms of hidden layers in the ANN architecture, previous studies that adopted one hidden layer in the model generally obtained an acceptable prediction accuracy [39]. Hence, in this study, all proposed models were trained with a single hidden layer. To obtain the optimal number of neurons for each model, the model was trained with the number of hidden neurons from 1 to 25. The root mean square error (RMS) of the network was plotted against the range of the number of hidden neurons for the determination of the optimal number of hidden neurons.

2.3.2. Training, Validation, and Testing

To create an ANN model with a good generalisation capability, the collected data were classified into three datasets, which were operated in the training, validation, and testing phases. Figure 3 demonstrates the partitions of datasets. For training datasets, the data were presented to the network during model training and the network was adjusted according to its error, while for validation datasets, the data were used for the network generalisation and to halt training when the generalisation stopped improving. In terms of datasets for testing, they were independent and used to assess the developed neural network as the data from the sets was not used in building the model. The testing datasets could determine the ability of the model to generalise its predictions beyond the training and validation datasets and the network performance when it was presented with unfamiliar datasets. In this study, 80% of datasets from the databank was used for training, whereas 15% and 5% was adopted for the model validation and testing, respectively.
The outcome of the ANN model developed in MATLAB was expressed in terms of the R, MSE, and predicted values for compressive strength in all training, validation, and testing phases. The performance of each model developed using the Levenberg–Marquardt technique in the MATLAB Deep Learning Toolbox was then determined by the statistical terms, namely, R-squared (R2), the root mean squared error (RMSE), mean absolute error (MAE), and mean absolute percentage error (MAPE) of the model. The equations are shown in Equations (1)–(4).
R 2 = 1 ( j = 1 p ( t j O j ) 2 j = 1 p ( t j t j ¯ ) 2 )
R M S E = j = 1 p ( t j O j ) 2 P
M A E = 1 P j = 1 p | t j O j |
M A P E = ( 1 P j = 1 p | t j O j t j | ) × 100 %

3. Compressive Strength Prediction

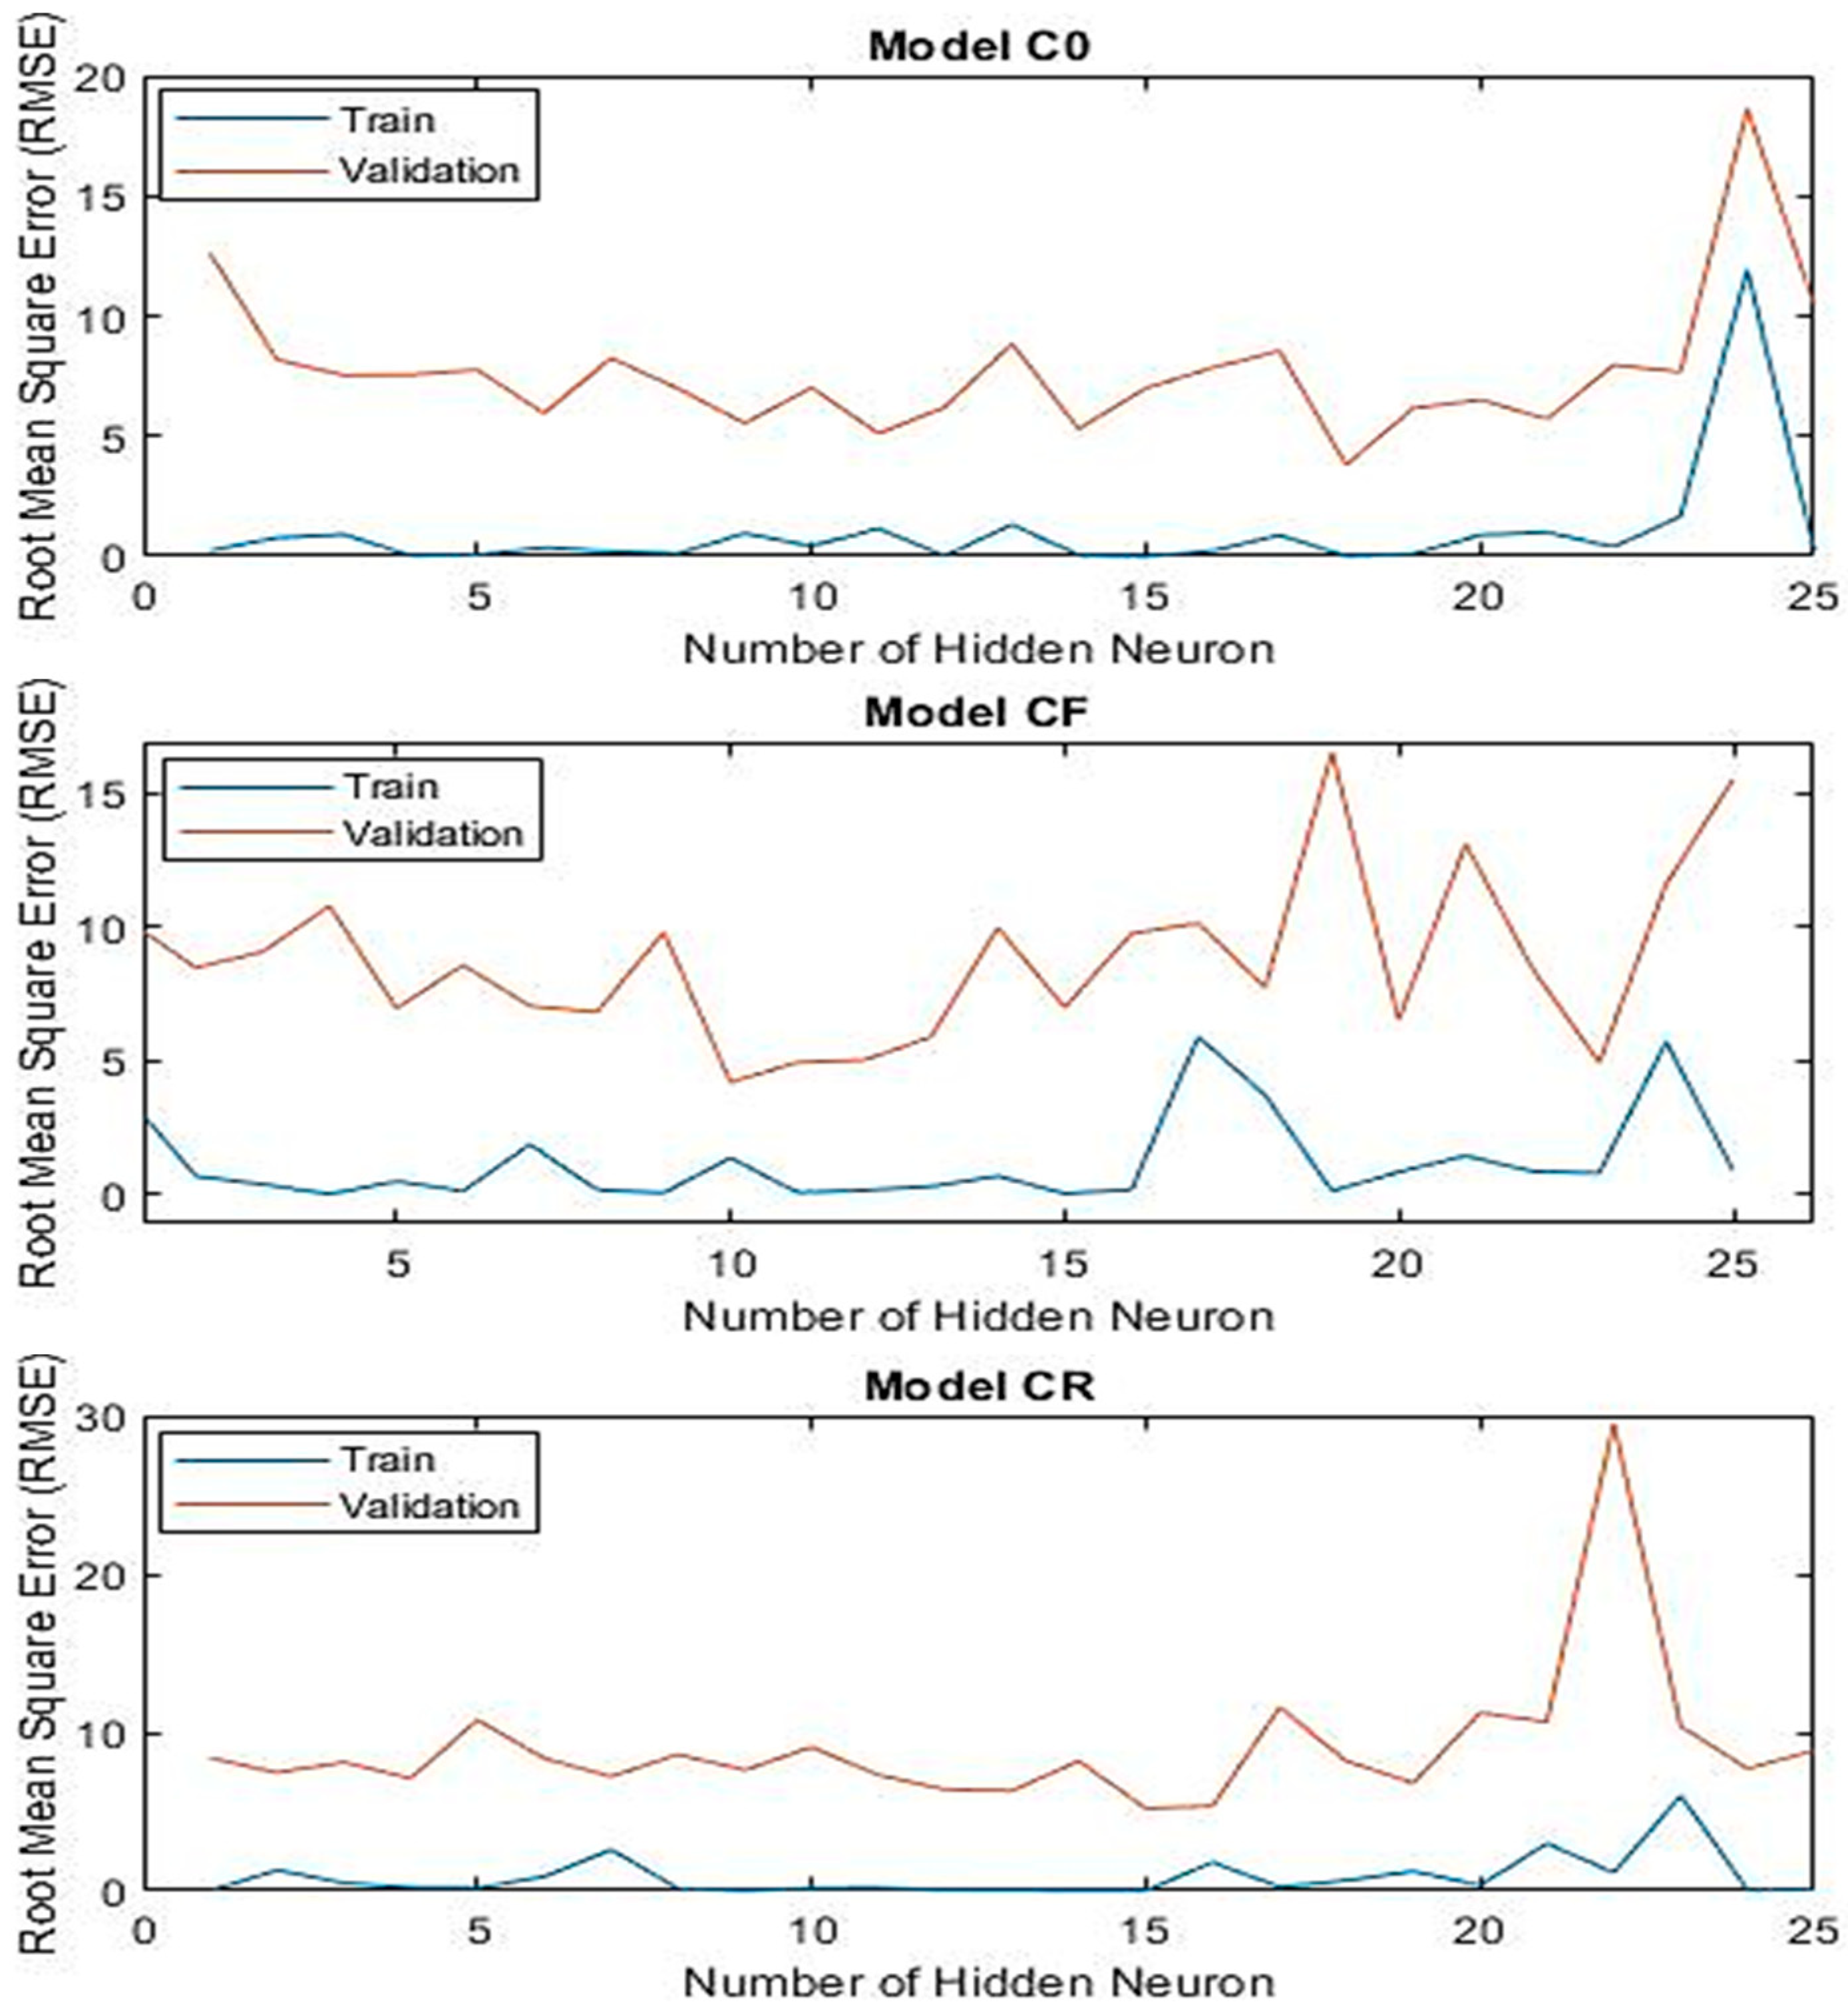
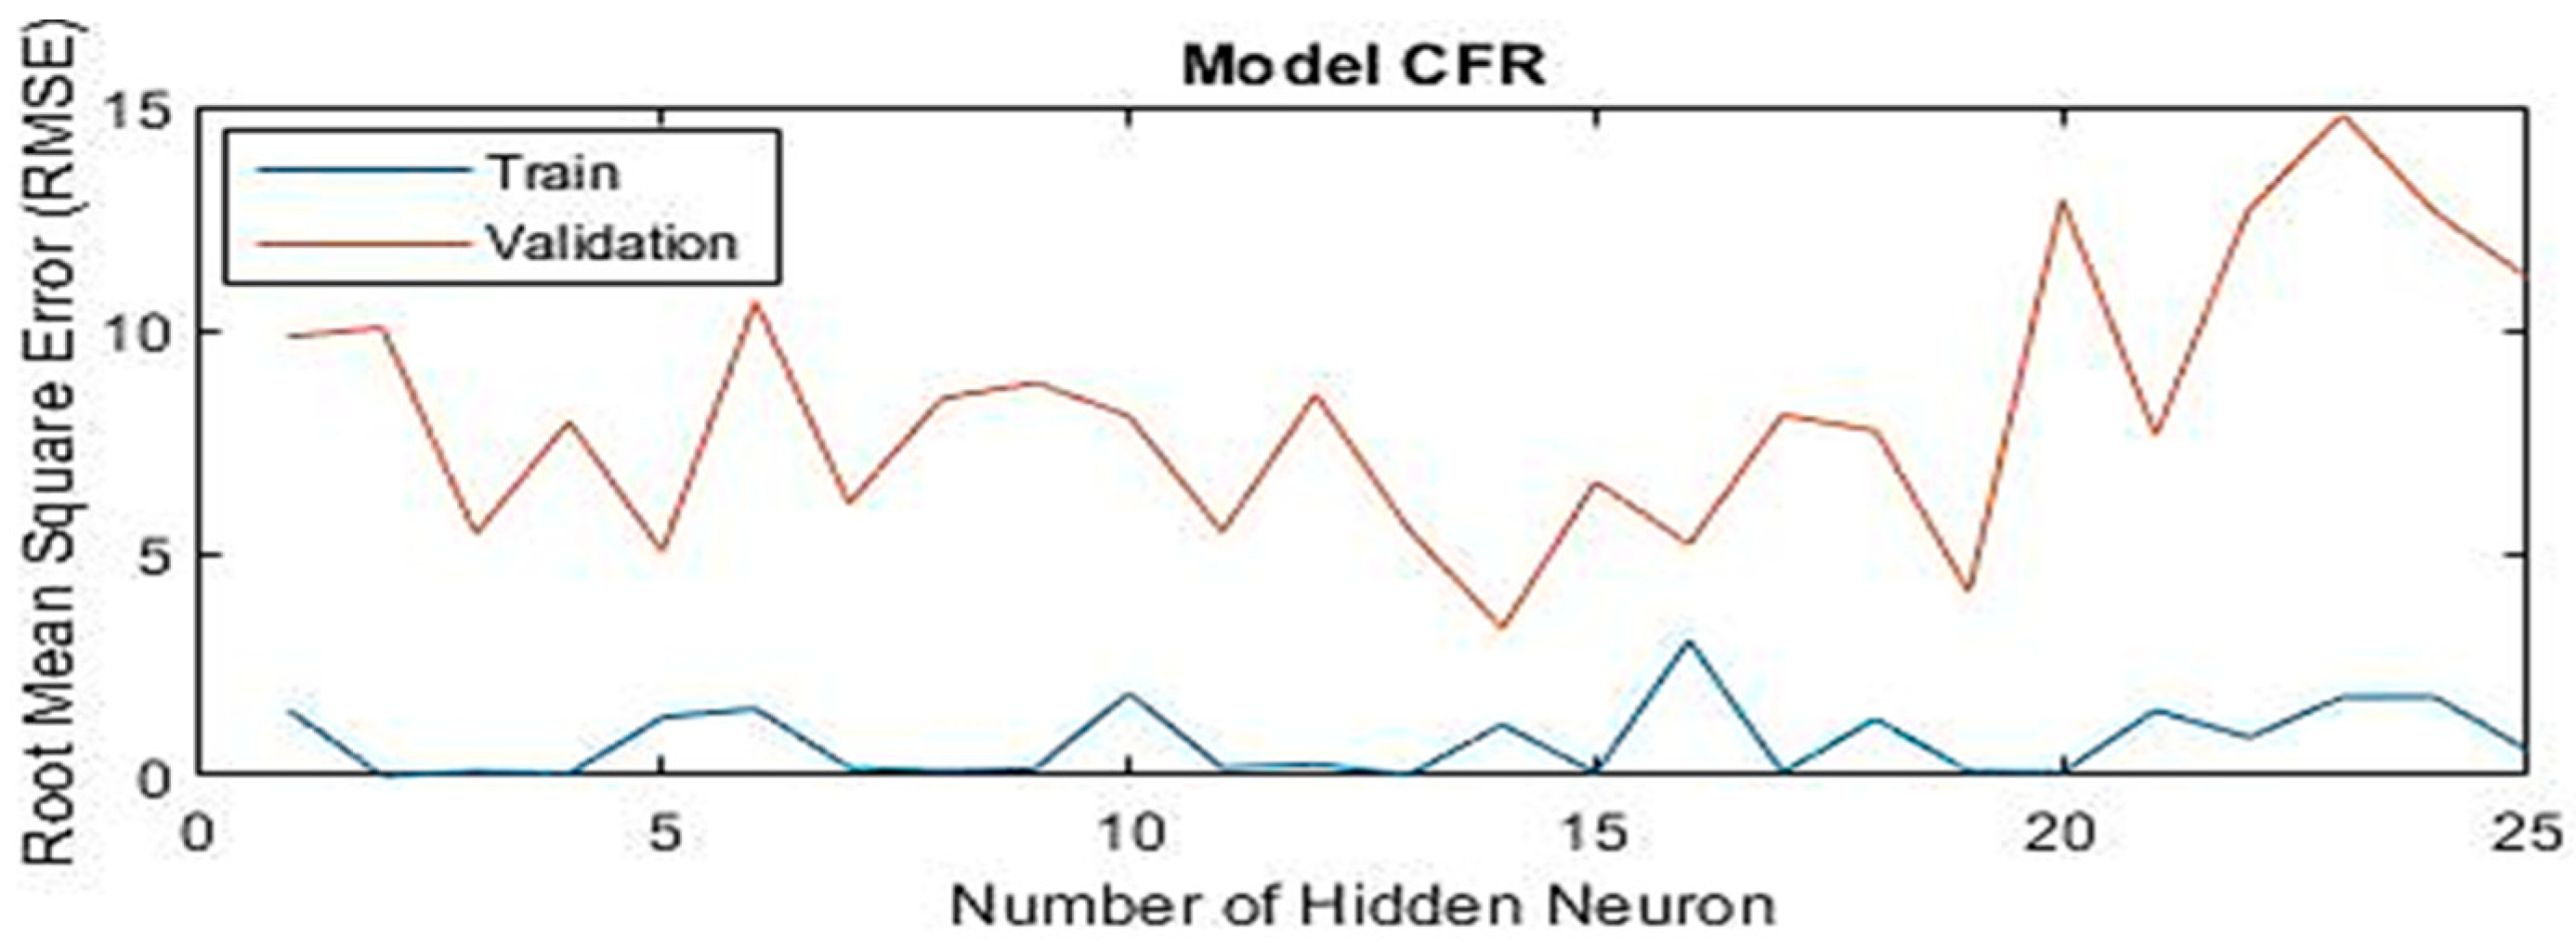
3.1. Optimal ANN Architecture

To begin, a databank was developed with 181 datasets of various AASC design mixes collected from the existing literature. To ensure the accuracy of the ANN model development, the optimal ANN architecture of Models C0, CF, CR, and CFR had to be obtained before executing the training phase. To determine the optimal ANN architecture, all the models were trained with different numbers of hidden neurons within the range of 1–25 hidden neurons in a single hidden layer. For the evaluation, the root mean square error (RMSE) values of each model for training and validation were plotted as a function of the number of hidden neurons. Figure 3 shows that the RMSE of training experienced a small fluctuation with an increasing number of hidden neurons, while the RMSE of validation kept fluctuating until it reached the lowest point before starting to increase with bigger fluctuations. Both RMSEs for the training and validation of models grew corresponding to an increase in the number of hidden neurons. This occurred because, even though the training error is low, the generalisation error tends to grow due to over-fitting and a high variance when a neural network contains too many hidden neurons [74]. From a previous study, a high accuracy was also obtained for one hidden layer with an ANN concrete compression strength prediction [37].
From Figure 4, RMSE values in training were lower than in the validation. When the RMSE of the model validation was low but slightly higher than that of the training, the model was generalised well in predicting the relationship between the inputs and output.
When the validation error is lower across but slightly higher than the training error, it implies that the resulting regression is a good fit. A good fitting result indicates that the model developed is generalised well in predicting the relationship between the inputs and output. Hence, the selection of optimal network architecture for the optimal number of hidden neurons must fulfil the criteria of (i) minimum training and validation RMSE and (ii) minimum difference between training and validation RMSE.
The optimal ANN architectures for Models C0, CF, CR, and CFR for a single hidden layer setting were determined as those comprising 18, 10, 16, and 14 neurons, respectively. Table 4 summarises the optimal ANN architecture for each model and provides a comparison with previous models. In the current study, considering the only binder of GGBFS, the included parameters represented the influenced factors in AASC well.
Table 4. Optimal ANN architectural details of ANN models.
ModelCurrent Study[75][76]
C0CFCRCFRSVRRFRETRGBR
Number of hidden neurons1810161412----
RMSE (Training)0.01101.34731.80041.14361.136.5983.9292.7212.919
RMSE (Validation)3.79744.17015.35663.2973-8.0536.1436.0004.880
Difference3.78642.82283.55622.1537-----
ANN Architecture8-18-19-10-19-16-110-14-126-12-1----

3.2. Prediction Accuracy

Having determined the optimal setting, the prediction Models C0, CF, CR, and CFR with different input variables were trained using the MATLAB Deep Learning Tool with 181 datasets from the databank alongside the optimal ANN architecture as presented in Table 4 to predict the AASC compressive strength. Prediction accuracies for compressive strength using all the investigated models were evaluated in terms of the correlation coefficient (R), determination coefficient (R2), root mean square error (RMSE), mean absolute error (MAE), and mean absolute percentage error (MAPE). The correlation coefficient of the network outputs versus targets for each model in training, validation, testing, and overall phases is presented in Table 5.
It can be seen that all the neural network models exhibited a correlation coefficient of more than 0.9 and were almost equal to the excellent value of one. This showed that the models had a high degree of fitness to the target values. Model C0 had the highest correlation coefficient of 0.9908 for the overall data, which indicated that the correlation between the targets and network outputs in this model was the strongest among all the models investigated.
To evaluate the predictability among the developed prediction models, performances of the models were further evaluated with R2, RMSE, MAE, and MAPE by measuring the error between the target values and network outputs. The overall RMSE, MAE, and MAPE for models were determined according to the results of the prediction models from MATLAB with respective targets, network outputs, the absolute error, and relative error of 181 AASC samples during model training, validation, and testing. The R, R2, RMSE, MAE, and MAPE values as determined for each model are tabulated in Table 6.
The determined coefficient, R2, of the AASC compressive strength for the ANN models was 0.9817, 0.9746, 0.9805, and 0.9769 for Models C0, CF, CR, and CFR, respectively. Similar to the correlation coefficient, all the investigated models had an R2 close to 1.0. This implies that the developed models are effective and precise in predicting the AASC compressive strength. It is worth noting that the R2 values of the existing ANN prediction model for the compressive strength of different concrete fell between 0.868 and 0.999. Hence, the R2 of all models developed in this study was considered of high vitality and acceptable. By comparing R2 between all the models, Model C0 demonstrated the highest R2 of 0.9817, which indicates that 98.17% of the variability in the network outputs could be explained or predicted by the inputs or independent variables from the model.
RMSE and MAE are the measures of the difference between targets and network predicted values. Low RMSE and MAE values indicate that the model is better at forecasting. The ANN prediction Models C0, CF, CR and CFR exhibited RMSE values of 2.1189, 2.5000, 2.1911 and 2.3855 (MPa), respectively, and MAE values of 1.2188, 1.6704, 1.3967, and 1.3690 (MPa), respectively. The range of RMSE and MAE of the existing neural network model for alkaline-activated fly ash (AAF) concrete compressive strength was between 1.4737 to 4.9684 and between 0.8416 to 4.1113, respectively [72]. Thus, in this study, the RMSE and MAE values of all the neural network models were, again, considered acceptable as compared to previous works. Model C0 showed the lowest RMSE and MAE among all the models, which indicated the best performance from this model.
In terms of MAPE, the overall MAPE values were 3.79%, 4.4%, 4%, and 3.83% for Models C0, CF, CR, and CFR, respectively. MAPE for all the models in this study was much lower, less than 5%. Among all the models investigated, Model C0 presented the lowest MAPE of 3.79% for the overall data, which implies that Model C0 exhibited the greatest performance in predicting the compressive strength for AASC where the forecast was only off by 3.79%.
Therefore, it shows from the statistical investigation that all the models provided a good quality of simulations because of well-fitting data and prediction abilities. Model C0 displayed the highest superiority compared to Models CF, CR, and CFR, since its R and R2 were higher, while RMSE, MAE, and MAPE were lower than other investigated models. To proceed, an existing ANN-based prediction model for high-performance concrete (HPC) compressive strength from [68] was selected as the comparable model to evaluate the ANN model accuracy. Statistical results, namely, R2, RMSE, and MAE, of the existing model were 0.86, 5.51 (MPa), and 4.03 (MPa). In this study, the R2, RMSE, and MAE of Model C0 for the AASC compressive strength had values of 0.98, 2.12 (MPa), and 1.22 (MPa), respectively. Hence, the value of R2 was greater while both error functions (RMSE, and MAE) were lower than the compared existing model. From this comparison, it could be justified that the present ANN-based Model C0 for AASC exhibited acceptable performance in predicting the compressive strength.
In terms of the input variables adopted in the ANN models, the findings from the statistical outcomes and comparison showed that Model C0 was better in the prediction of the AASC compressive strength among all the models. Thus, it could be justified that Model C0, which adopted primary variables only (namely, the GGBF-slag content, fine aggregate to total aggregate ratio (F:T), Na2SiO3 solution content, NaOH content in solid, mixing water content, silica modulus of activator (Ms), percentage of sodium oxide (Na2O %), and water–binder ratio (w/b)), was sufficient to predict the compressive strength of AASC with a high accuracy. For Models CF, CR, and CFR, with additional secondary input variables, the models seemed greatly adaptive with more detailed variables considered. However, this, consequently, increased the complexity of the model, which was not necessary and less favoured.
Next, the current optimised model was compared with two previously published models with a similar set of input variables to evaluate their performance. Due to the limitation in the ANN prediction model for AASC, the proposed ANN model for alkali-activated fly ash (AAF) concrete, which is similar to AASC, from [72] was adopted as the first model. The input variables utilised for the existing model were the fly ash content, fine and coarse aggregate content, Na2SiO3 solution content, NaOH solution content, water content, NaOH concentration, curing time, and temperature. By comparing the inputs for AASC (slag) and AAFC (fly ash), the inputs utilised were found to be similar, except for the main binder material due to different concrete types and NaOH concentrations, as it was expressed differently by the NaOH solid content and mixing water. For the curing time, as the present model was used to predict the characteristic compressive strength (28 days) of concrete, the curing time was excluded.
For the second model, the existing stepwise regression model of AASC from [77] was considered. The input variables adopted for the stepwise regression model were the sodium oxide dosage (Na2O %), silica dosage, activator silica modulus (Ms), water–binder ratio (w/b), activator–binder ratio, and curing method. Through the comparison between the present ANN AASC models and the existing stepwise regression AASC model, the variables used in both models were the same, except that the activator–binder ratio in the present study was described in terms of its content. The R2 of the existing stepwise regression model was determined to be 0.97, which is considered a good performing model; the R2 of the present neural network model was 0.98, which had a higher accuracy compared to the stepwise regression model.
From the above discussion, it can be observed that the prediction model developed using the current ANN approach could predict the compressive strength of alkaline-activated slag concrete effectively with a high accuracy by using suitable input variables and ANN architecture. However, there were limitations in this study, i.e., constrained by the types of alkaline activator used and databank built.
Regarding the types of alkaline activator, the most common activator, which is the combination of sodium silicate with sodium hydroxide, was adopted in this study. Other alkaline activators, such as sodium silicate only, potassium silicate only, sodium silicate with potassium hydroxide, etc., may pose a different effect on the AASC compressive strength compared to the activator adopted in this study. In terms of the databank built in this study, there was a range for each utilised variable. Thus, if a newly tested value of compressive strength was outside the range of datasets, the predicted value (network output) may not have displayed a high accuracy for the AASC compressive strength. In future works, when there are more data regarding AASC, a databank with more datasets and a higher range for variables should be created.
Although there were some limitations, the result of this study demonstrates the significant potential of the nondestructive method for predicting the performance of alkaline-activated slag concrete. The prediction model could be a useful tool for building a standard that could be utilised when designing the mix proportion of AASC, which is not a presently available option. The quality and probable weakness of the AASC concrete could be determined early without the need for experimental works as well.

4. Parametric Study

As the proposed ANN-based model demonstrated the ability to predict the compressive strength of AASC that agrees well with the experimental data, a parametric study was conducted on Model C0, i.e., with the greatest accuracy, to investigate the effects of the selected input variables on the compressive strength.
As all variables were interrelated and due to the complexity of the prediction model developed using ANN, a parametric study of the variables was unable to be conducted by changing just one of the input variables while keeping the others constant. Hence, the connection weight approach that used the synaptic weight of variables in the ANN model was utilised to conduct the parametric analysis. To carry out the examination, values of synaptic weight for the input–hidden and hidden–output obtained from the MATLAB Deep Learning Tool are summarised in Table 7. Each weight represents the intensity of signal transfer between two neurons. A positive weight indicates that the input variable had a positive effect on the output variable, where an increase in the input would increase the output; a negative weight indicates that the input variable had a negative effect on the output variable, where an increase in the input would decrease the output.
Following the described methodology, the sensitivity analysis with the connection weight approach (Equation (5)) was conducted and the products are summarised in Table 8, while the relative importance and ranking of each input variable are tabulated in Table 9. Moreover, the contribution of each parameter is illustrated in Figure 5. The connection weight approach uses raw synaptic weights to determine the variables’ contribution, where the positive or negative sign of weights is considered during the calculation. Thus, the relative importance determined using this approach shows a positive or negative sign that explains the relationship between the input and output.
R e l a t i v e   I m p o r t a n c e ,   R I j k = j = 1 N h w j i w k j
From the computed results, it could be observed that the relative importance of the silica modulus of the alkaline activator (Ms) was the highest (35.6% negatively) among the input variables. This indicated that Ms had the greatest impact on the compressive strength of AASC, followed then by the sodium silicate solution content (26.5% positively), slag content (11% negatively), etc.
In terms of the activator silica modulus (Ms), it played an important role in predicting the compressive strength, as it had the most influence on the overall preference. However, the sensitivity analysis showed that the AASC strength was negatively affected by the Ms, characterising that an increase in Ms correlated to the reduction in the AASC compressive strength. While, for the sodium silicate content (SS), the results also exhibited that it was one of the significant variables for strength, it was not as significant as Ms. In a converse manner to the influence by Ms, SS had a positive effect on the strength, since the compressive strength increased with SS. The slag content (GGBFS) and the water–binder ratio (W/B) were interrelated, and the relative importance of both variables could be explained from the sign (positive or negative) of the results. As GGBFS affected the strength negatively, a decrease in GGBFS increased the strength. With the decrease in GGBFS, the W/B would increase, assuming that the water remained constant, and, eventually, the strength would increase with the W/B. The ratio of fine aggregate to total aggregate (F:T) showed the least importance in affecting the AASC compressive strength. In Figure 5, the relative importance of F:T was relatively small and unnoticeable. This indicated that if there were any changes in F:T, there would only be a small effect on the compressive strength of AASC.
Due to the apparent complexity of the ANN, the ability to ascertain or understand the detailed mechanisms underlying the weights of the neural network was limited. However, recent advancements, such as the sensitivity analysis, have illustrated that this is indeed not the case. By utilising the synaptic weights with the connection weight approach, the contribution of predictor variables in neural networks can be identified and the relationship between the variables can be explained as well, in a manner analogous to the statistical analysis of variance (ANOVA) [39].

5. Conclusions

This study presented the compressive strength prediction of AASC by an artificial neural network (ANN) model. The ANN model considered the complex and nonlinear relation between the compressive strength and the concrete components, such as the raw materials in preparing the concrete specimen.
For the development of the ANN AASC compressive strength prediction model, 181 datasets with various mix proportions of AASC were collected from the existing literature and experimental works to construct the databank. Four models, namely, C0, CF, CR, and CFR, were selected with key predetermined input variables that were classified into primary and secondary variables. The optimal ANN architecture for each model in terms of the number of hidden neurons was first determined by training the models with neuron numbers ranging from 1 to 25, with reference to the literature to ensure a better prediction accuracy. In comparison to the previous ANN-based model proposed for concrete, the present ANN model in this study showed a comparable and acceptable prediction accuracy with respect to the compressive strength of AASC. The optimal model variant for the prediction of the strength of AASC was that from Model C0, the optimal architectural configuration of which was 8-18-1 (input number–hidden layer neuron number–output number), with a good balancing performance of high R2, while low in both RMSE and MAE when evaluated upon the datasets. Furthermore, in terms of the input variables, the appropriate variables determined, from Model C0, in this study were similar to the previously proposed stepwise regression model for AASC.
A sensitivity analysis with the connection weight approach was conducted for the parametric analysis to determine the relative importance of each input variable on the AASC compressive strength. The silica modulus of the activator, Ms, and sodium silicate content, SS, with 35.60% and 26.50% of relative importance, played an important role in influencing the AASC compressive strength. The relationship of both variables with the AASC compressive strength was in contrast, where the strength increased with Ms but decreased with the increase in SS.
In brief, the ANN-based model performed well in predicting and fitting the compressive strength of AASC as proven by the obtained statistical results. The present model was further justified as demonstrating a good efficiency in predicting the compressive strength through evaluating the present model with the existing models. Hence, with this study, the ANN-based model can be utilised as a reliable tool for assessing the characteristic strength of alkaline-activated slag concrete at the early stage without conducting any laborious and time-consuming physical strength tests, such that the economic aspect of any relevant project as well as the development of new materials, slag concrete, in the construction industry, can be well ensured.
As this research focused on AASC, it is empirically applicable to GGBFS AASC. A further consideration of various supplementary cementitious materials should be included for a wider range and comprehensive prediction of AASC compressive strength. Other mechanical properties could also be included in this ANN prediction model for reliable application in the construction industry.

Author Contributions

Conceptualization, Y.H.L., A.B.H.K. and Y.Y.L.; Data curation, Y.X.T., Y.H.L., M.A., R.F., N.V., A.B.H.K. and Y.Y.L.; Formal analysis, Y.X.T., Y.H.L., M.A., R.F., N.V., A.B.H.K. and Y.Y.L.; Funding acquisition, M.A., R.F. and N.V.; Investigation, Y.X.T. and Y.H.L.; Methodology, Y.X.T., Y.H.L. and A.B.H.K.; Project administration, Y.H.L., N.V. and A.B.H.K.; Resources, M.A., R.F., N.V. and Y.Y.L.; Software, R.F., A.B.H.K. and Y.Y.L.; Supervision, Y.H.L., M.A., N.V. and A.B.H.K.; Validation, Y.H.L., M.A., R.F., N.V., A.B.H.K. and Y.Y.L.; Visualization, N.V., A.B.H.K. and Y.Y.L.; Writing—original draft, Y.X.T.; Writing—review and editing, Y.H.L., M.A., R.F., N.V., A.B.H.K. and Y.Y.L. All authors have read and agreed to the published version of the manuscript.

Funding

The research is partially funded by the Ministry of Science and Higher Education of the Russian Federation under the strategic academic leadership program ‘Priority 2030’ (Agreement 075-15-2021-1333 dated 30.09.2021).

Institutional Review Board Statement

Not applicable.

Informed Consent Statement

Not applicable.

Data Availability Statement

Data sharing not applicable.

Acknowledgments

The authors would like to acknowledge the technical support provided by the Curtin University Malaysia. Additionally, the authors gratefully acknowledge the financial support given by the Deanship of Scientific Research at Prince Sattam bin Abdulaziz University, Alkharj, Saudi Arabia, and the collaboration with the Department of Civil Engineering, Faculty of Engineering and IT, Amran University, Yemen, for this study.

Conflicts of Interest

The authors declare no conflict of interest.

References

  1. Long, W.J.; Wei, J.J.; Gu, Y.C.; Xing, F. Research on dynamic mechanical properties of alkali activated slag concrete under temperature-loads coupling effects. Constr. Build. Mater. 2017, 154, 687–696. [Google Scholar] [CrossRef]
  2. Lesovik, V.; Voronov, V.; Glagolev, E.; Fediuk, R.; Alaskhanov, A.; Amran, Y.H.M.; Murali, G.; Baranov, A. Improving the behaviors of foam concrete through the use of composite binder. J. Build. Eng. 2020, 31, 101414. [Google Scholar] [CrossRef]
  3. Amran, M.; Fediuk, R.; Murali, G.; Avudaiappan, S.; Ozbakkaloglu, T.; Vatin, N.; Karelina, M.; Klyuev, S.; Gholampour, A. Fly ash-based eco-efficient concretes: A comprehensive review of the short-term properties. Materials 2021, 14, 4264. [Google Scholar] [CrossRef] [PubMed]
  4. Mosaberpanah, M.A.; Amran, Y.H.M.; Akoush, A. Performance investigation of palm kernel shell ash in high strength concrete production. Comput. Concr. 2020, 26, 577–585. [Google Scholar] [CrossRef]
  5. Amran, M.; Lee, Y.H.; Fediuk, R.; Murali, G.; Mosaberpanah, M.A.; Ozbakkaloglu, T.; Karelia, M. Palm Oil Fuel Ash-Based Eco-Friendly Concrete Composite: A Critical Review of the Long-Term Properties. Materials 2021, 14, 7074. [Google Scholar] [CrossRef] [PubMed]
  6. Widera, B.; Stone, D. Analysis of possible application of iron-based substitute for portland cement in building and its influence on carbon emissions: The examples of Jizera Mountains Region and Tohono O’Odham Indian reservation. In Proceedings of the International Multidisciplinary Scientific GeoConference: SGEM 2, Albena, Bulgaria, 30 June–6 July 2016; pp. 455–463. [Google Scholar]
  7. Benhelal, E.; Zahedi, G.; Shamsaei, E.; Bahadori, A. Global strategies and potentials to curb CO2 emissions in cement industry. J. Clean. Prod. 2013, 51, 142–161. [Google Scholar] [CrossRef]
  8. Amran, Y.H.M.; Alyousef, R.; Alabduljabbar, H.; El-Zeadani, M. Clean production and properties of geopolymer concrete; A review. J. Clean. Prod. 2020, 251, 119679. [Google Scholar] [CrossRef]
  9. Onaizi, A.M.; Huseien, G.F.; Lim, N.H.A.S.; Amran, M.; Samadi, M. Effect of nanomaterials inclusion on sustainability of cement-based concretes: A comprehensive review. Constr. Build. Mater. 2021, 306, 124850. [Google Scholar] [CrossRef]
  10. Amran, M.; Murali, G.; Fediuk, R.; Vatin, N.; Vasilev, Y.; Abdelgader, H. Palm oil fuel ash-based eco-efficient concrete: A critical review of the short-term properties. Materials 2021, 14, 332. [Google Scholar] [CrossRef]
  11. Fediuk, R.; Mugahed Amran, Y.H.; Mosaberpanah, M.A.; Danish, A.; El-Zeadani, M.; Klyuev, S.V.; Vatin, N. A critical review on the properties and applications of sulfur-based concrete. Materials 2020, 13, 4712. [Google Scholar] [CrossRef]
  12. Onaizi, A.M.; Lim, N.H.A.S.; Huseien, G.F.; Amran, M.; Ma, C.K. Effect of the addition of nano glass powder on the compressive strength of high volume fly ash modified concrete. Mater. Today Proc. 2021, 48, 1789–1795. [Google Scholar] [CrossRef]
  13. Kueh, A.B.H. Spent ground coffee–awaking the sustainability prospects. Environ. Toxicol. Manag. 2021, 1, 1–6. [Google Scholar] [CrossRef]
  14. Lee, Y.H.; Amran, M.; Lee, Y.Y.; Kueh, A.B.H.; Kiew, S.F.; Fediuk, R.; Vatin, N.; Vasilev, Y. Thermal behavior and energy efficiency of modified concretes in the tropical climate: A systemic review. Sustainability 2021, 13, 11957. [Google Scholar] [CrossRef]
  15. Tay, L.T.; Lee, Y.Y.; Lee, Y.H.; Kueh, A.B.H. Compressive and Flexural Strengths of Mortar with Silica Aerogel Powder. In Proceedings of the International Conference on Civil, Offshore and Environmental Engineering; Springer: Singapore; pp. 493–500.
  16. Lee, Y.H.; Chua, N.; Amran, M.; Lee, Y.Y.; Kueh, A.H.; Fediuk, R.; Vatin, N.; Vasilev, Y. Thermal Performance of Structural Lightweight Concrete Composites for Potential Energy Saving. Crystals 2021, 11, 461. [Google Scholar] [CrossRef]
  17. Abdelgader, H.S.; Kurpińska, M.; Amran, M. Effect of slag coal ash and foamed glass on the mechanical properties of two-stage concrete. Mater. Today Proc. 2022, 1, 12. [Google Scholar] [CrossRef]
  18. Chakrawarthi, V.; Avudaiappan, S.; Amran, M.; Dharmar, B.; Jesuarulraj, L.R.; Fediuk, R.; Aepuru, R.; Vatin, N.; Flores, E.S. Impact Resistance of Polypropylene Fibre-Reinforced Alkali–Activated Copper Slag Concrete. Materials 2021, 14, 7735. [Google Scholar] [CrossRef]
  19. Amran, M.; Murali, G.; Khalid, N.H.A.; Fediuk, R.; Ozbakkaloglu, T.; Lee, Y.H.; Haruna, S.; Lee, Y.Y. Slag uses in making an ecofriendly and sustainable concrete: A review. Constr. Build. Mater. 2021, 272, 121942. [Google Scholar] [CrossRef]
  20. Haruna, S.; Mohammed, B.S.; Wahab, M.M.A.; Kankia, M.U.; Amran, M.; Gora, A.M. Long-Term Strength Development of Fly Ash-Based One-Part Alkali-Activated Binders. Materials 2021, 14, 4160. [Google Scholar] [CrossRef]
  21. Arularasi, V.; Thamilselvi, P.; Avudaiappan, S.; Flores, E.I.S.; Amran, M.; Fediuk, R.; Vatin, N.; Karelina, M. Rheological behavior and strength characteristics of cement paste and mortar with fly ash and GGBS admixtures. Sustainability 2021, 13, 9600. [Google Scholar] [CrossRef]
  22. Amran, M.; Debbarma, S.; Ozbakkaloglu, T. Fly ash-based eco-friendly geopolymer concrete: A critical review of the long-term durability properties. Constr. Build. Mater. 2021, 270, 121857. [Google Scholar] [CrossRef]
  23. Amran, M.; Fediuk, R.; Murali, G.; Vatin, N.; Karelina, M.; Ozbakkaloglu, T.; Krishna, R.S.; Kumar, A.S.; Kumar, D.S.; Mishra, J. Rice husk ash-based concrete composites: A critical review of their properties and applications. Crystals 2021, 11, 168. [Google Scholar] [CrossRef]
  24. Ash, R.H.; Avudaiappan, S.; Prakatanoju, S.; Amran, M.; Aepuru, R. Experimental Investigation and Image Processing to Predict the Properties of Concrete with the Addition of Nano Silica and Rice Husk Ash. Crystals 2021, 11, 1230. [Google Scholar]
  25. Siddika, A.; Amin, M.R.; Rayhan, M.A.; Islam, M.S.; Mamun, M.A.A.; Alyousef, R.; Mugahed Amran, Y.H. Performance of sustainable green concrete incorporated with fly ash, rice husk ash, and stone dust. Acta Polytech. 2021, 61, 279–291. [Google Scholar] [CrossRef]
  26. Fentaw, M.; Alemayehu, E.; Geremew, A. Experimental study of stabilization of expansive soil using the mixture of marble dust, rice husk ash and cement for sub-grade road construction: A case study of Woldia town. J. Civ. Eng. Sci. Technol. 2021, 12, 141–159. [Google Scholar] [CrossRef]
  27. Hossain, M.B.; Roknuzzaman, M.; Biswas, M.A.; Islam, M. Evaluation of engineering properties of thermal power plant waste for subgrade treatment. J. Civ. Eng. Sci. Technol. 2021, 12, 112–123. [Google Scholar] [CrossRef]
  28. Islam, M.R.; Roy, A.C. Prediction of California bearing ratio of fine-grained soil stabilized with admixtures using soft computing systems. J. Civ. Eng. Sci. Technol. 2020, 11, 28–44. [Google Scholar] [CrossRef] [Green Version]
  29. Razali, N.; Sa’don, N.M.; Karim, A.R.A. Strength and durability effect on stabilized subgrade soil. J. Civ. Eng. Sci. Technol. 2016, 7, 9–19. [Google Scholar] [CrossRef] [Green Version]
  30. Mithun, B.M.; Narasimhan, M.C. Performance of alkali activated slag concrete mixes incorporating copper slag as fine aggregate. J. Clean. Prod. 2016, 112, 837–844. [Google Scholar] [CrossRef]
  31. Awoyera, P.; Adesina, A. A critical review on application of alkali activated slag as a sustainable composite binder. Case Stud. Constr. Mater. 2019, 11, e00268. [Google Scholar] [CrossRef]
  32. Amran, M.; Fediuk, R.; Abdelgader, H.S.; Murali, G.; Ozbakkaloglu, T.; Lee, Y.H.; Lee, Y.Y. Fiber-reinforced alkali-activated concrete: A review. J. Build. Eng. 2022, 45, 103638. [Google Scholar] [CrossRef]
  33. Thomas, R.; Ye, H.; Radlinska, A.; Peethamparan, S. Alkali-Activated Slag Cement Concrete. Concr. Int. 2016, 38, 33–38. [Google Scholar]
  34. Bakharev, T.; Sanjayan, J.G.; Cheng, Y.B. Sulfate attack on alkali-activated slag concrete. Cem. Concr. Res. 2002, 32, 211–216. [Google Scholar] [CrossRef]
  35. Kabir, A.; Hasan, M.; Miah, K. Predicting 28 Days Compressive Strength of Concrete from 7 Days Test Result. In Proceedings of the International Conference on Advances in Design and Construction of Structures, Bangalore, India, 19–20 October 2012; pp. 18–22. [Google Scholar]
  36. Bilim, C.; Atiş, C.D.; Tanyildizi, H.; Karahan, O. Predicting the compressive strength of ground granulated blast furnace slag concrete using artificial neural network. Adv. Eng. Softw. 2009, 40, 334–340. [Google Scholar] [CrossRef]
  37. Lin, C.J.; Wu, N.J. An ann model for predicting the compressive strength of concrete. Appl. Sci. 2021, 11, 3798. [Google Scholar] [CrossRef]
  38. Wu, N.J. Predicting the compressive strength of concrete using an rbf-ann model. Appl. Sci. 2021, 11, 6382. [Google Scholar] [CrossRef]
  39. Kueh, A.B.H. Artificial neural network and regressed beam-column connection explicit mathematical moment-rotation expressions. J. Build. Eng. 2021, 43, 103195. [Google Scholar] [CrossRef]
  40. Ma, C.K.; Lee, Y.H.; Awang, A.Z.; Omar, W.; Mohammad, S.; Liang, M. Artificial neural network models for FRP-repaired concrete subjected to pre-damaged effects. Neural Comput. Appl. 2019, 31, 711–717. [Google Scholar] [CrossRef]
  41. Shahmansouri, A.A.; Yazdani, M.; Ghanbari, S.; Akbarzadeh Bengar, H.; Jafari, A.; Farrokh Ghatte, H. Artificial neural network model to predict the compressive strength of eco-friendly geopolymer concrete incorporating silica fume and natural zeolite. J. Clean. Prod. 2021, 279, 123697. [Google Scholar] [CrossRef]
  42. Shahmansouri, A.A.; Nematzadeh, M.; Behnood, A. Mechanical properties of GGBFS-based geopolymer concrete incorporating natural zeolite and silica fume with an optimum design using response surface method. J. Build. Eng. 2021, 36, 102138. [Google Scholar] [CrossRef]
  43. Shahmansouri, A.A.; Akbarzadeh Bengar, H.; Ghanbari, S. Compressive strength prediction of eco-efficient GGBS-based geopolymer concrete using GEP method. J. Build. Eng. 2020, 31, 101326. [Google Scholar] [CrossRef]
  44. Shahmansouri, A.A.; Akbarzadeh Bengar, H.; Ghanbari, S. Experimental investigation and predictive modeling of compressive strength of pozzolanic geopolymer concrete using gene expression programming. J. Concr. Struct. Mater. 2020, 5, 92–117. [Google Scholar]
  45. Liu, G.; Zheng, J. Prediction model of compressive strength development in concrete containing four kinds of gelled materials with the artificial intelligence method. Appl. Sci. 2019, 9, 1039. [Google Scholar] [CrossRef] [Green Version]
  46. Douma, O.B.; Boukhatem, B.; Ghrici, M.; Tagnit-Hamou, A. Prediction of properties of self-compacting concrete containing fly ash using artificial neural network. Neural Comput. Appl. 2016, 28, 707–718. [Google Scholar] [CrossRef]
  47. Huang, J.; Zou, C.; Sun, D.; Yang, B.; Yan, J. Effect of recycled fine aggregates on alkali-activated slag concrete properties. Structures 2021, 30, 89–99. [Google Scholar] [CrossRef]
  48. Taghvayi, H.; Behfarnia, K.; Khalili, M. The effect of alkali concentration and sodium silicate modulus on the properties of alkali-activated slag concrete. J. Adv. Concr. Technol. 2018, 16, 293–305. [Google Scholar] [CrossRef] [Green Version]
  49. Yang, K.; Yang, C.; Magee, B.; Nanukuttan, S.; Ye, J. Establishment of a preconditioning regime for air permeability and sorptivity of alkali-activated slag concrete. Cem. Concr. Compos. 2016, 73, 19–28. [Google Scholar] [CrossRef] [Green Version]
  50. Bernal, S.A.; san Nicolas, R.; Provis, J.L.; de Gutiérrez, R.M.; van Deventer, J.S.J. Natural carbonation of aged alkali-activated slag concretes. Mater. Struct. Constr. 2014, 47, 693–707. [Google Scholar] [CrossRef]
  51. Akçaözoğlu, K.; Akçaözoğlu, S.; Açıkgöz, A. Investigation of Hydration Temperature of Alkali Activated Slag Based Concrete. KSCE J. Civ. Eng. 2018, 22, 2994–3002. [Google Scholar] [CrossRef]
  52. Ding, Y.; Dai, J.-G.; Shi, C.-J. Mechanical Properties of Alkali-Activated Concrete Subjected to Impact Load. J. Mater. Civ. Eng. 2018, 30, 4018068. [Google Scholar] [CrossRef]
  53. Huang, J.; Yan, J.; Liu, K.; Wei, B.; Zou, C. Influence of cooking oil on the mitigation of autogenous shrinkage of alkali-activated slag concrete. Materials 2020, 13, 4907. [Google Scholar] [CrossRef] [PubMed]
  54. Bondar, D.; Ma, Q.; Soutsos, M.; Basheer, M.; Provis, J.L.; Nanukuttan, S. Alkali activated slag concretes designed for a desired slump, strength and chloride diffusivity. Constr. Build. Mater. 2018, 190, 191–199. [Google Scholar] [CrossRef] [Green Version]
  55. Ma, Q.; Nanukuttan, S.V.; Basheer, P.A.M.; Bai, Y.; Yang, C. Chloride transport and the resulting corrosion of steel bars in alkali activated slag concretes. Mater. Struct. Constr. 2016, 49, 3663–3677. [Google Scholar] [CrossRef] [Green Version]
  56. Thunuguntla, C.S.; Gunneswara Rao, T.D. Effect of mix design parameters on mechanical and durability properties of alkali activated slag concrete. Constr. Build. Mater. 2018, 193, 173–188. [Google Scholar] [CrossRef]
  57. Bastani, M.; Behfarnia, K. Application of alkali-activated slag in roller compacted concrete. Int. J. Pavement Res. Technol. 2020, 13, 324–333. [Google Scholar] [CrossRef]
  58. Gholizadeh-Vayghan, A.; Nofallah, M.-H.; Khaloo, A. Technoeconomic Study of Alkali-Activated Slag Concrete with a Focus on Strength, CO2 Emission, and Material Cost. J. Mater. Civ. Eng. 2021, 33, 1–12. [Google Scholar] [CrossRef]
  59. Wardhono, A.; Gunasekara, C.; Law, D.W.; Setunge, S. Comparison of long term performance between alkali activated slag and fly ash geopolymer concretes. Constr. Build. Mater. 2017, 143, 272–279. [Google Scholar] [CrossRef]
  60. Madhuri, G.; Srinivasa Rao, K. Performance of alkali-activated slag concrete against sulphuric acid attack. Asian J. Civ. Eng. 2018, 19, 451–461. [Google Scholar] [CrossRef]
  61. Chi, M. Effects of dosage of alkali-activated solution and curing conditions on the properties and durability of alkali-activated slag concrete. Constr. Build. Mater. 2012, 89, 509–516. [Google Scholar] [CrossRef]
  62. Tolstoy, A.; Lesovik, V.; Fediuk, R.; Amran, M.; Gunasekaran, M.; Vatin, N.; Vasilev, Y. Production of greener high-strength concrete using russian quartz sandstone mine waste aggregates. Materials 2020, 13, 5575. [Google Scholar] [CrossRef] [PubMed]
  63. Makul, N.; Fediuk, R.; Amran, M.; Zeyad, A.M.; Klyuev, S.; Chulkova, I.; Ozbakkaloglu, T.; Vatin, N.; Karelina, M.; Azevedo, A. Design Strategy for Recycled Aggregate Concrete: A Review of Status and Future Perspectives. Crystals 2021, 11, 695. [Google Scholar] [CrossRef]
  64. Azreen, N.M.; Rashid, R.S.M.; Mugahed Amran, Y.H.; Voo, Y.L.; Haniza, M.; Hairie, M.; Alyousef, R.; Alabduljabbar, H. Simulation of ultra-high-performance concrete mixed with hematite and barite aggregates using Monte Carlo for dry cask storage. Constr. Build. Mater. 2020, 263, 120161. [Google Scholar] [CrossRef]
  65. Atici, U. Prediction of the strength of mineral admixture concrete using multivariable regression analysis and an artificial neural network. Expert Syst. Appl. 2011, 38, 9609–9618. [Google Scholar] [CrossRef]
  66. Gupta, S. Using Artificial Neural Network to Predict the Compressive Strength of Concrete containing Nano-silica. Civ. Eng. Archit. 2013, 1, 96–102. [Google Scholar] [CrossRef]
  67. Chithra, S.; Kumar, S.R.R.S.; Chinnaraju, K.; Alfin Ashmita, F. A comparative study on the compressive strength prediction models for High Performance Concrete containing nano silica and copper slag using regression analysis and Artificial Neural Networks. Constr. Build. Mater. 2016, 114, 528–535. [Google Scholar] [CrossRef]
  68. Siraj, N.B.; Fayek, A.R.; Tsehayee, A.A. Development and Optimization of Artificial Intelligence-Based Concrete Compressive Strength Predictive Models. Int. J. Struct. Civ. Eng. Res. 2016, 5, 156–167. [Google Scholar] [CrossRef]
  69. Naderpour, H.; Rafiean, A.H.; Fakharian, P. Compressive strength prediction of environmentally friendly concrete using artificial neural networks. J. Build. Eng. 2018, 16, 213–219. [Google Scholar] [CrossRef]
  70. Rajeshwari, R.; Mandal, S. Prediction of compressive strength of high-volume fly ash concrete using artificial neural network. Lect. Notes Civ. Eng. 2019, 25, 471–483. [Google Scholar] [CrossRef]
  71. Yoon, J.Y.; Kim, H.; Lee, Y.J.; Sim, S.H. Prediction model for mechanical properties of lightweight aggregate concrete using artificial neural network. Materials 2019, 12, 2678. [Google Scholar] [CrossRef] [Green Version]
  72. Nguyen, K.T.; Nguyen, Q.D.; Le, T.A.; Shin, J.; Lee, K. Analyzing the compressive strength of green fly ash based geopolymer concrete using experiment and machine learning approaches. Constr. Build. Mater. 2020, 247, 118581. [Google Scholar] [CrossRef]
  73. Shahmansouri, A.A.; Yazdani, M.; Hosseini, M.; Akbarzadeh Bengar, H.; Farrokh Ghatte, H. The prediction analysis of compressive strength and electrical resistivity of environmentally friendly concrete incorporating natural zeolite using artificial neural network. Constr. Build. Mater. 2022, 317, 125876. [Google Scholar] [CrossRef]
  74. Ke, J.; Liu, X. Empirical analysis of optimal hidden neurons in neural network modeling for stock prediction. In Proceedings of the 2008 IEEE Pacific-Asia Workshop on Computational Intelligence and Industrial Application, Wuhan, China, 19–20 December 2008; IEEE: Piscataway, NJ, USA, 2008; Volume 2, pp. 828–832. [Google Scholar] [CrossRef]
  75. Gupta, T.; Rao, M.C. Prediction of compressive strength of geopolymer concrete using machine learning techniques. Struct. Concr. 2021, 18p. [Google Scholar] [CrossRef]
  76. Zhang, L.V.; Marani, A.; Nehdi, M.L. Chemistry-informed machine learning prediction of compressive strength for alkali-activated materials. Constr. Build. Mater. 2022, 316, 126103. [Google Scholar] [CrossRef]
  77. Thomas, R.J.; Peethamparan, S. Stepwise regression modeling for compressive strength of alkali-activated concrete. Constr. Build. Mater. 2017, 141, 315–324. [Google Scholar] [CrossRef] [Green Version]
Figure 1. The flow of prediction model development.
Sustainability 14 05214 g001
Figure 2. Typical optimal ANN architecture.
Sustainability 14 05214 g002
Figure 3. Partition of datasets for ANN model.
Sustainability 14 05214 g003
Figure 4. RMSE values in the training and validation phases for different ANN models.
Sustainability 14 05214 g004aSustainability 14 05214 g004b
Figure 5. Relative importance of each input variable on compressive strength of AASC.
Sustainability 14 05214 g005
Table 2. Inputs and output of AASC prediction model.
VariableUnitMinimumMaximumVariable
GGBFSkg/m3208405Primary input
F:T-0.300.61
Na2SiO3 (l)kg/m37.30206.43
NaOH (s)kg/m32.6838.40
Mixing waterkg/m353.94240.53
Ms-0.192.63
Na2O%%2.713.64
w/b-0.340.7
Blaine finenessm2/kg335527Secondary input
Curing type---
Compressive strengthMPa6.783.2Output
Table 3. Inputs considered for the proposed prediction models.
ModelsInputs
12345678910
C0××
CF×
CR×
CFR
  • GGBFS
  • F:T
  • Na2SiO3 (l)
  • NaOH (s)
  • Mixing water
6.
Ms
7.
Na2O%
8.
w/b
9.
Blaine fineness
10.
Curing types
Annotations: ×—no, and √—yes.
Table 5. Correlation coefficient computed from all phases of the studied ANN models.
ModelCorrelation Coefficient, R
TrainingValidationTestingOverall Data
C00.99530.98050.97050.9908
CF0.99060.97740.97670.9872
CR0.99590.96080.99450.9902
CFR0.99540.96060.97900.9884
Table 6. Statistical errors for ANN models.
ModelRR2RMSE (MPa)MAE (MPa)MAPE (%)
C00.99080.98172.11891.21883.79
CF0.98720.97462.50001.67044.40
CR0.99020.98052.19111.39674.00
CFR0.98840.97692.38551.36903.83
Table 7. Input–hidden and hidden–output weights derived from the ANN model, C0.
Input-HiddenHidden-Output
Hidden NeuronInputOutput
GGBFSF:TSSSHMsNa2OADDH2OW/Bfc
1−1.85110.8766−1.14100.91372.4600−1.4760−0.7266−3.0664−0.9097
2−0.64480.14320.1632−1.68980.95151.67833.2782−2.76352.7061
3−1.6146−0.3582−1.5804−0.6272−1.2745−0.9812−0.74211.76120.6151
40.14463.59350.7653−0.4566−0.89791.3062−2.2284−0.78220.0452
5−0.6419−0.1221−1.41580.5753−0.4139−1.4396−0.74652.1107−1.0167
60.3351−1.45311.2932−0.2918−0.1720−1.07841.79731.5449−0.7799
73.03841.6446−0.76090.26000.17812.2642−0.1741−0.45121.4077
8−1.3240−1.3103−0.49781.27802.3879−0.14210.74941.14290.8236
9−1.80501.9500−0.1177−0.6343−0.76840.7537−0.48601.0722−1.3099
102.47622.99960.07423.8201−3.2209−0.8220−2.06160.1564−0.2059
11−2.06050.18692.0354−1.23660.7149−4.0055−1.1618−3.87750.2064
12−0.32041.10231.1954−0.7342−0.21401.58202.8409−2.0052−2.6165
13−2.31090.0179−0.48851.6056−1.0383−1.1508−1.63861.54271.5972
14−0.2757−0.2649−1.50250.05282.2245−0.1155−0.3543−0.9056−2.5610
151.5999−4.49890.04820.21363.09281.68581.75652.8385−0.6751
161.15691.2737−0.60911.09800.24160.4434−0.8414−1.0749−0.5621
171.23110.0584−1.5809−0.17630.11730.8585−0.1815−1.0590−1.3477
180.00241.31401.73740.5000−0.01250.4533−0.8213−0.07880.7815
Table 8. Connection weight products and relative importance.
Hidden NeuronConnection Weight Product—Input
GGBFSF:TSSSHMsNa2OADDH2Ow/b
11.6839−0.79741.0379−0.8312−2.23781.34260.66092.7894
2−1.74490.38760.4415−4.57292.57504.54178.8712−7.4785
3−0.9931−0.2203−0.9721−0.3858−0.7840−0.6036−0.45651.0833
40.00650.16260.0346−0.0207−0.04060.0591−0.1008−0.0354
50.65260.12421.4394−0.58490.42081.46360.7589−2.1460
6−0.26131.1333−1.00860.22750.13420.8410−1.4018−1.2048
74.27712.3151−1.07120.36590.25073.1873−0.2451−0.6352
8−1.0904−1.0791−0.41001.05261.9666−0.11700.61720.9413
92.3644−2.55430.15420.83091.0065−0.98720.6367−1.4045
10−0.5099−0.6176−0.0153−0.78660.66320.16930.4245−0.0322
11−0.42530.03860.4202−0.25520.1476−0.8268−0.2398−0.8004
120.8383−2.8842−3.12771.92100.5599−4.1394−7.43325.2465
13−3.69100.0285−0.78022.5645−1.6584−1.8381−2.61722.4640
140.70600.67833.8480−0.1353−5.69700.29570.90752.3192
15−1.08003.0371−0.0325−0.1442−2.0878−1.1380−1.1858−1.9162
16−0.6503−0.71600.3424−0.6172−0.1358−0.24920.47290.6042
17−1.6591−0.07872.13060.2376−0.1582−1.15700.24461.4273
180.00191.02691.35780.3907−0.00980.3542−0.6419−0.0616
Sum−1.5748−0.01573.7889−0.7432−5.08481.1982−0.72761.1605
Total of all variables = 14.2936
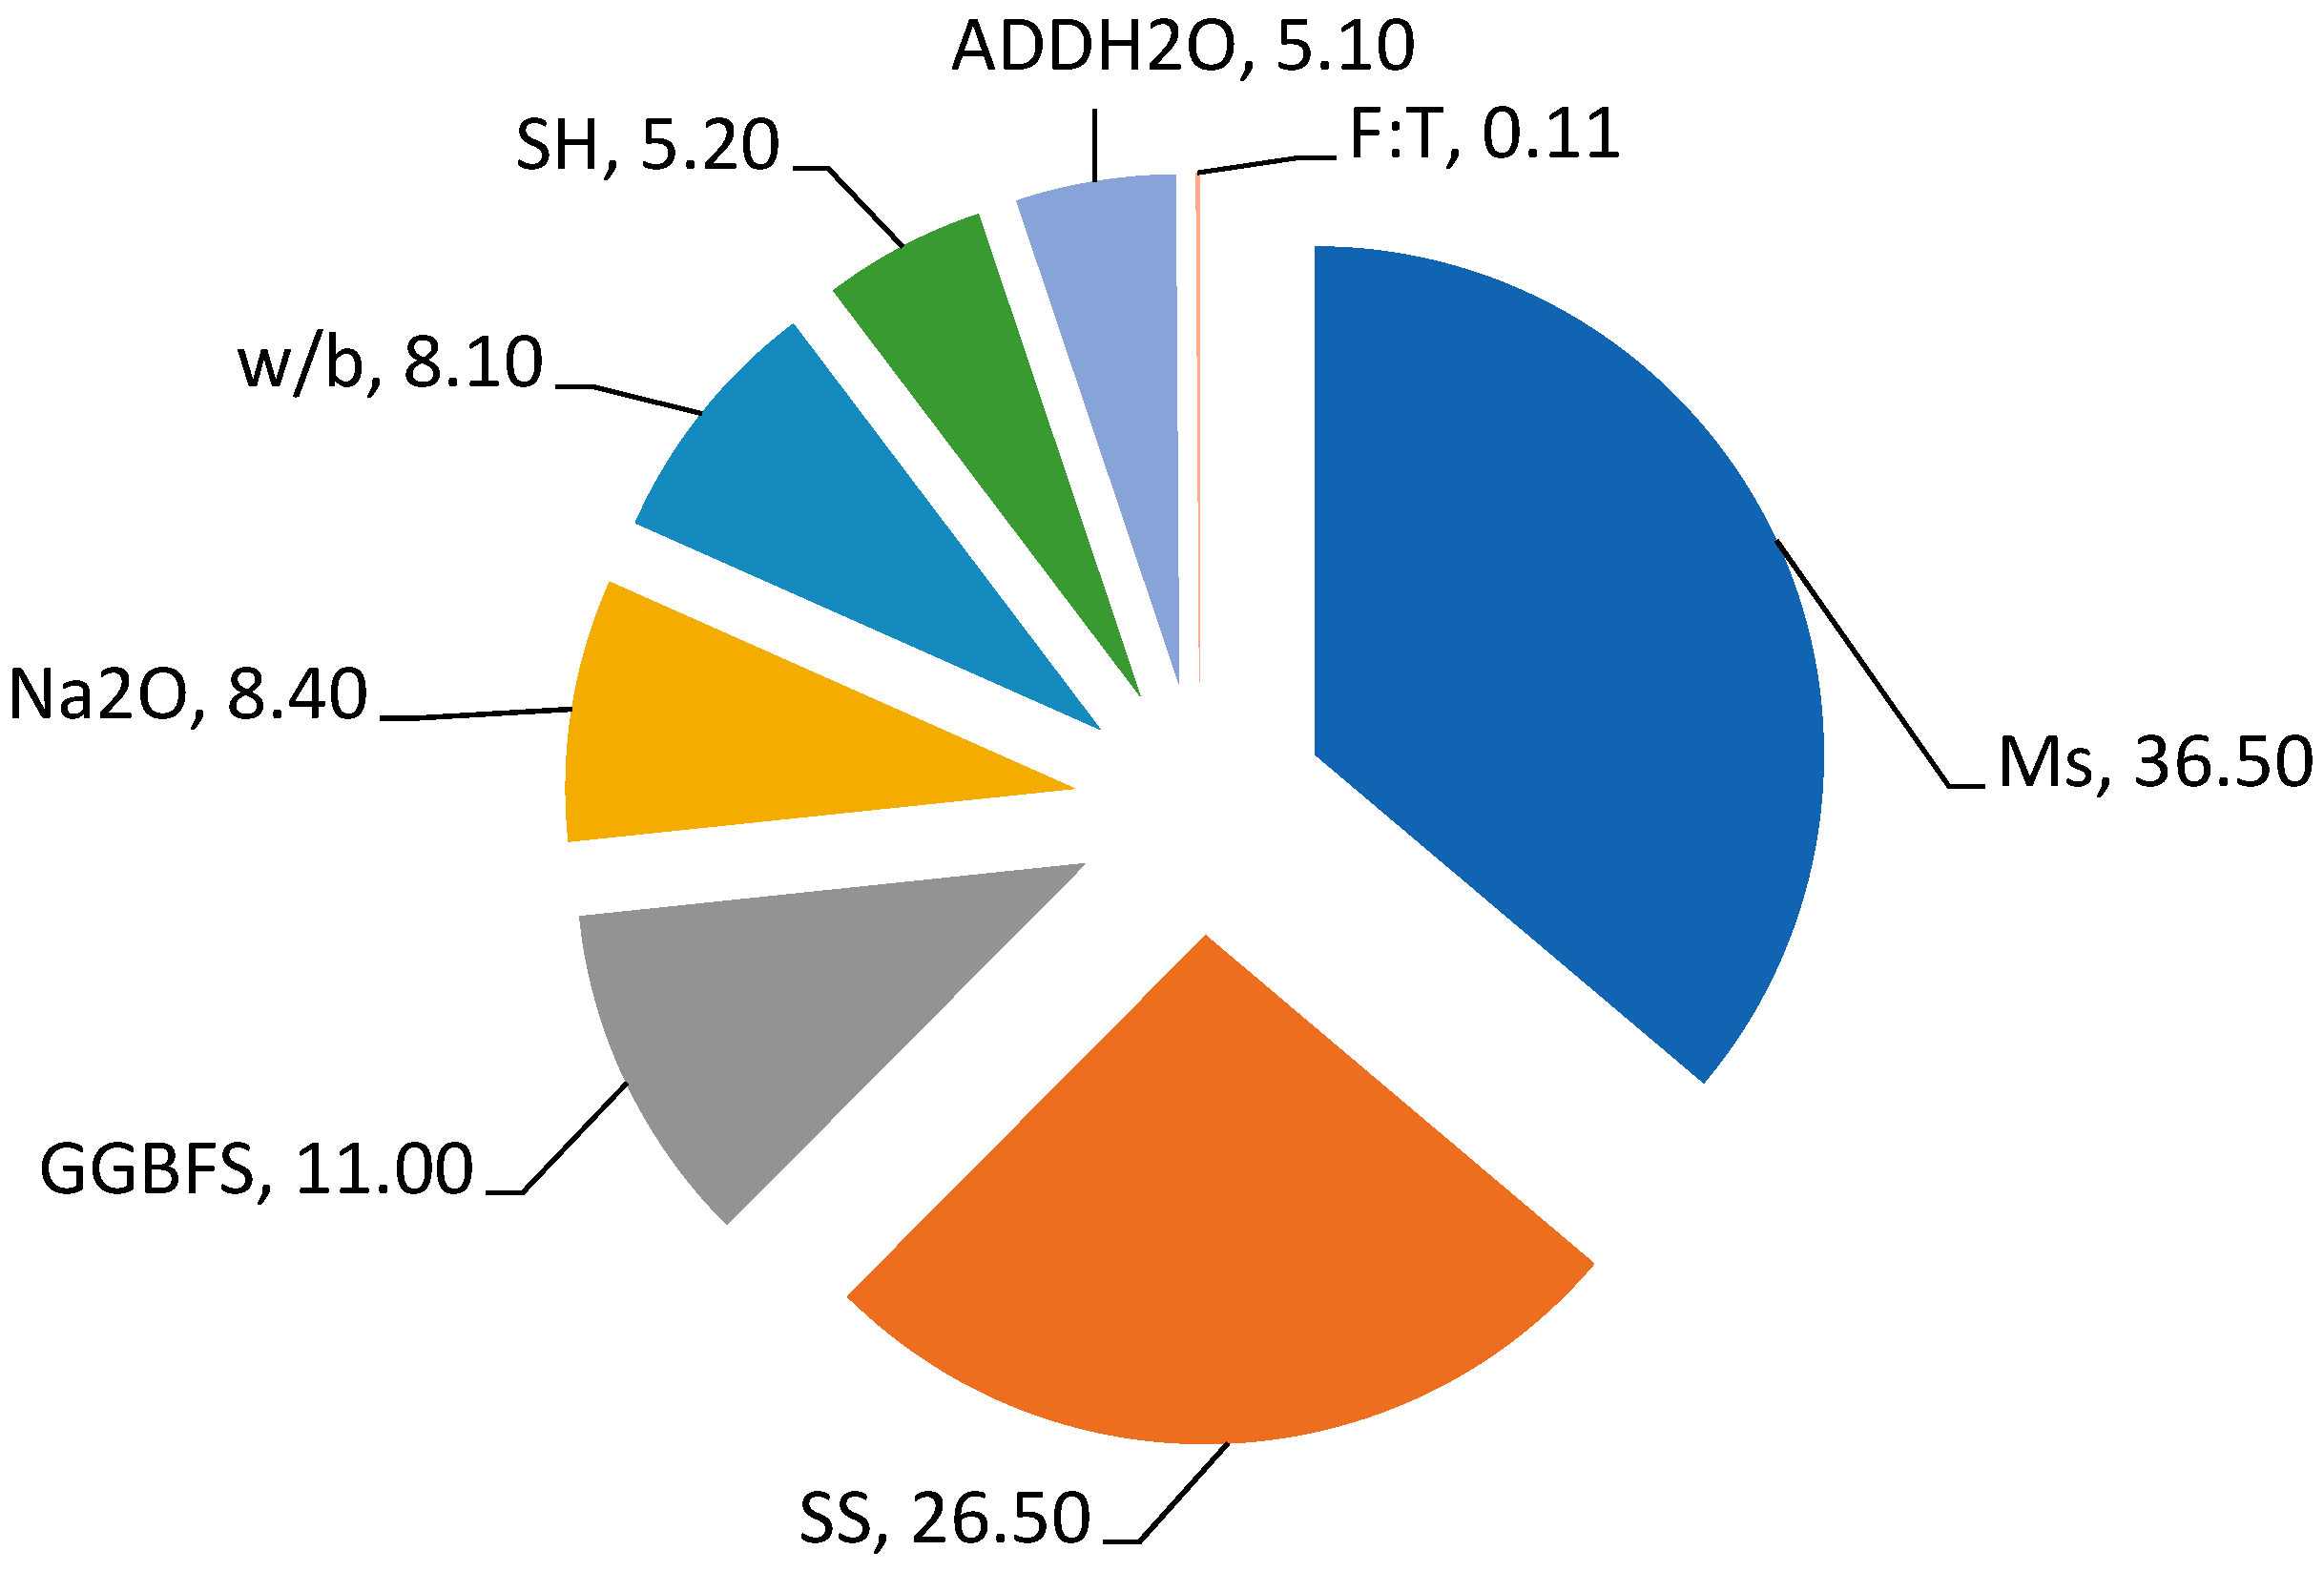
Relative Importance (%)−11.0−0.1126.5−5.2−35.68.4−5.18.1
Table 9. Relative importance and ranking of each input variable.
InputConnection Weight Approach
Relative Importance (%)Ranking
GGBFS−11.03
F:T−0.118
SS26.52
SH−5.26
Ms−35.61
NA2O8.44
ADDH2O−5.17
w/b8.15
Publisher’s Note: MDPI stays neutral with regard to jurisdictional claims in published maps and institutional affiliations.

