Article

Retreat of Major European Tree Species Distribution under Climate Change—Minor Natives to the Rescue?

Forest Research Institute of Baden-Württemberg, Wonnhaldestraße 4, 79100 Freiburg, Germany
*
Author to whom correspondence should be addressed.
Sustainability 2022, 14(9), 5213; https://doi.org/10.3390/su14095213
Submission received: 1 March 2022 / Revised: 13 April 2022 / Accepted: 23 April 2022 / Published: 26 April 2022

Abstract

:
Climate change is projected to trigger strong declines in the potential distribution of major tree species in Europe. While minor natives have moved into the spotlight as alternatives, their ecology is often poorly understood. We use an ensemble species distribution modelling approach on a set of promising native tree species to gain insights into their distribution potential under different climate change scenarios. Moreover, we identify the urgency and potential of altered species distributions in favor of minor natives by comparing the niche dynamics of five major native tree species with the set of six minor natives in a case study. Our models project stark range contractions and range shifts among major tree species, strongly amplified under high emission scenarios. Abies alba, Picea abies and Fagus sylvatica are affected the strongest. While also experiencing range shifts, the minor European natives Castanea sativa, Sorbus torminalis, and Ulmus laevis all considerably expand their range potential across climate change scenarios. Accompanied by Carpinus betulus, with a stable range size, they hold the potential to substantially contribute to sustainably adapting European forest to climate change.

1. Introduction

Indications on the need for transformation of European forest ecosystems in the face of climate change are getting more and more eminent [1,2,3]. Next to an increasing frequency and magnitude of extreme events, rapid average long-term warming and changing precipitation patterns strongly affect the state of forest ecosystems. However, a high degree of uncertainty in the magnitude of change is caused by complex social dimensions and associated mitigation efforts as well as complex physical interactions and feedback loops [4,5,6]. Despite this uncertainty, for its long-term implications, current decision-making in forestry needs to account for climatic changes by the end of the century [7,8,9]. While measures to increase resistance to climate change are prevailing in research on adaptive forestry management, shifting the emphasis towards fostering resilience and the adaptive capacity of forest ecosystems is key when facing climate change [10,11,12].
The major tree species Fagus sylvatica and Picea abies show especially high sensitivity to direct and indirect consequences of climate change with their future ranges projected to drastically diminish under climate change [13,14]. Facing a high level of uncertainty under a changing climate, the selection of alternative tree species is a major adaptation strategy for increased forest ecosystem resilience [10]. Thus, minor European natives are moving into the spotlight as a key adaptation pathway in the transformation process [15]. Moreover, recent studies on climate change adaptation in Europe show that among forest owners and managers, anticipation of changes in tree species composition [16] and positive attitudes towards shifting towards alternative native tree species as a means of climate change adaptation are widespread [17]. However, lacking knowledge on the ecological requirements of some of these minor species hampers assertions regarding their potential in a changing climate [15,18,19].
As forests provide diverse functions and services and are characterized by a multitude of social and ecological interactions [20,21], shifting species composition is projected to have strong implications on the functions forest ecosystems can fulfill in the future [1,22,23]. For the facilitation of sustainability and a growing complexity of demands on forest ecosystems, multi-criterial decision analysis approaches have gained increasing attention in forest management [24,25,26]. This study builds upon a systematic multicriterial analysis for the identification of promising alternative tree species in Europe under changing climate [27], aiding informed shaping of the functionality of future forest ecosystems through identifying the projected impact of climate change on their ranges across Europe. Thus, this offers an indication of their potential to contribute towards climate change adaptation for sustainable forest ecosystems. We apply an ensemble species distribution modelling (SDM) approach on six promising alternative native European tree species as well as five major tree species. SDM is a probabilistic modelling approach widely regarded to assist forest management through its merits to indicate likely climate change impact on species via estimations of occurrence probability [28,29]. While SDM offers a summarized representation of multiple factors impacting species occurrence into a combined occurrence probability, it does not explicitly incorporate demographic processes, biotic interactions and dispersal [30]. Using data which is relatively easy to obtain, SDM is an acclaimed tool to forecast the effects of climate change on forests nonetheless. Thus, this provides an important basis for our understanding of changes in potential tree species distribution, especially for species with scarce available data [28,29].
Ensemble modelling (also called consensus modeling) combines predictions of different algorithms to obtain a more robust consensus model [31]. This approach is based on the assumption that predictions of (individual) relevant models are equally likely representations of the truth, collectively reflecting the uncertainty connected to modelled predictions [31]. Ensemble SDM offers a valuable indication of consensus between different modelling algorithms in the face of uncertain climate change impacts.
We aim at (1) identifying climate change induced range shift dynamics of the analyzed tree species, specifically focusing on (2) decreases and increases in the area of favorable growing conditions, both on the European scale and an exemplary small scale case study in Southwest Germany (state Baden-Württemberg), as well as (3) providing indications on the future distribution potential of alternative tree species where major species decline under climate change.

2. Materials and Methods

2.1. Analyzed Tree Species

The minor native tree species were selected through a multicriterial analysis based on de Avila et al. [27]. Through a literature analysis, 35 alternative tree species were assigned a score for 37 criteria within five target systems (silviculture, yield, timber quality, ecosystem services, risk) [27]. For this study target system scores were equally weighted to obtain the combined score. Among the pool of alternative species, minor tree species with the best combined score were then selected for this study. Based on this approach, Castanea sativa, Sorbus torminalis, Carpinus betulus, Ulmus laevis, Betula pendula and Acer pseudoplatanus were selected as promising native alternative tree species. For comparison with major tree species, four European major tree species, F. sylvatica, Quercus petraea, P. abies and Pinus sylvestris were selected. Additionally, Abies alba was modelled as a species with regional importance in the case study region.

2.2. Species Distribution Modelling

2.2.1. Species Data

The EU-Forest database [32], with its extensive compiled forest inventory data across 21 European countries, was used to derive presence-absence data. Occurrences with any diameter at breast height were classed as presence points. Absence data were collated in two steps. Within countries with species occurrences, all points at which the species was not detected were used as absences. To represent the climatic range across the study area, a random sample of absences was additionally taken throughout the study area equaling half the sum of absences collated within countries of occurrence.

2.2.2. Explanatory Variables

To reduce model complexity a priori, we selected potential explanatory variables by prioritizing environmental variables that have a direct physiological effect, as they strengthen the model accuracy to make predictions and are likely to remain important in the face of changing environmental conditions and new areas [33,34]. We preselected meaningful bioclimatic variables (CHELSA, [35]), soil variables [36,37], additionally computed the Conrads Continentality Index (CCI), and the sum of the mean daily temperature above 5 °C over the year (GDD5) as a preliminary set of explanatory variables for model fitting (see Table 1). Explanatory variables were aggregated to a 1.2 arc min resolution. Based on this preselection, the “select 07” method [38] was used to generate a tree species specific set of meaningful, uncorrelated variables. We calculated the univariate variable importance (AIC) with GLMs using quadratic terms and selected the variables with the higher explanatory power among correlated variable pairs.
For climate change effects on occurrence ranges of the studied tree species, we projected models to an ensemble of four global circulation models (GCMs) from the Coupled Model Intercomparison Project Phase 5 (CMIP5). From a preselected set of 9 GCMs, based on utilization in previous studies with comparable approaches [13,39,40,41,42,43], the envelope was selected based on a representation of climatic extremes [44] using the web application “compareR” [45]. The mean between MPI-ESM-LR, GISS-E2-R, IPSL-CM5A-LR and HadGem2-CC was used to represent the future climate in 2050 (2041–2060) and 2070 (2061–2080) under the representative concentration pathway scenarios (RCPs) 4.5 and 8.5. RCPs have been introduced to allow for better comparison when modelling climate change. RCP 4.5 represents a stabilization without overshoot pathway at CO2 equivalent concentrations of ~650 ppm by 2100 [46], leading to a mean global temperature increase of 2.4 °C by the end of the century [47]. RCP 8.5, on the other hand, is a high emission scenario with a rising concentration of CO2 equivalents reaching over 1370 p.p.m. by the end of the century [46], and a mean global temperature increase of 4.9 °C at that time [47]. For projections across Europe, we used the same explanatory variable resolution as used for model building. In addition, ensemble models were projected to the case study region of Baden-Württemberg (Figure 1), where a finer resolution of 30 arc s (~1 km2) was used, allowing for a more localized climatic and edaphic representation.

2.2.3. Ensemble Species Distribution Modelling

We used an ensemble approach to model the future distribution potential of the assessed tree species. We combined five different modelling approaches—generalized linear models (GLM), generalized additive models (GAM), boosted regression trees (BRT), random forest (RF) and maximum entropy (MAXENT)—to an ensemble model using the weighted mean between model predictions. Model quality was tested using the area under the curve (AUC) [48] of the receiver operating characteristic, the symmetric extremal dependence index (SEDI) [49] and the true skill statistic (TSS) [50]. Model weighting was based on the proportional maxSEDI score. Ensemble modeling was performed with the R package “biomod2” [51]. For tree species with a prevalence lower than 0.1, presences were assigned the combined weight of 0.1 in relation to absences. This is based on the findings of Jiménez-Valverde [52], who suggested this threshold as a safety interval preventing imprecise estimations on the discrimination capacity of models as a consequence of very unbalanced prevalences. Ensemble predictions were transformed into meaningful classes following the adapted classification approach proposed by Hanewinkel et al. [53]. We used three threshold values to generate four classes of occurrence probability (Pocc) (core, extended, low, very low). The highest class is assigned by the threshold probability value corresponding to a false positive rate > 0.01. The second highest class is assigned if the probability of occurrence lies above the value at which the maxTSS is located, and the third class is delimitated by a threshold value corresponding to a false absence rate > 0.01. Below the third threshold the fourth class is assigned. See Figure A1 for a summary of the modelling steps applied. For the identification of urgency and potential for forest adaptation using the assessed alternative tree species, a spatial analysis of the Pocc among alternative tree species was applied to where major species show receding distribution potential. For this analysis, the occurrence potential of alternative species was considered at locations where major tree species with a projected current core or extended Pocc forfeit this potential under climate change scenarios. This analysis was applied to the exemplary case study of Baden-Württemberg. All analysis was performed in R version 4.0.5 [54].

3. Results

3.1. Model Performance

All ensemble models performed well above the quality thresholds of TSS > 0.5, SEDI > 0.7 and AUC > 0.8. A. alba and P. abies ensemble models performed best across scores while the performance of A. pseudoplatanus, B. pendula and C. betulus ensemble models was lowest (Table 2). As highlighted in Figure 2, individual models show a consistently large consensus where ensemble models predict a high Pocc, while the coefficient of variation (CV) is most variable when Pocc approaches zero (see Appendix A for the remaining species).

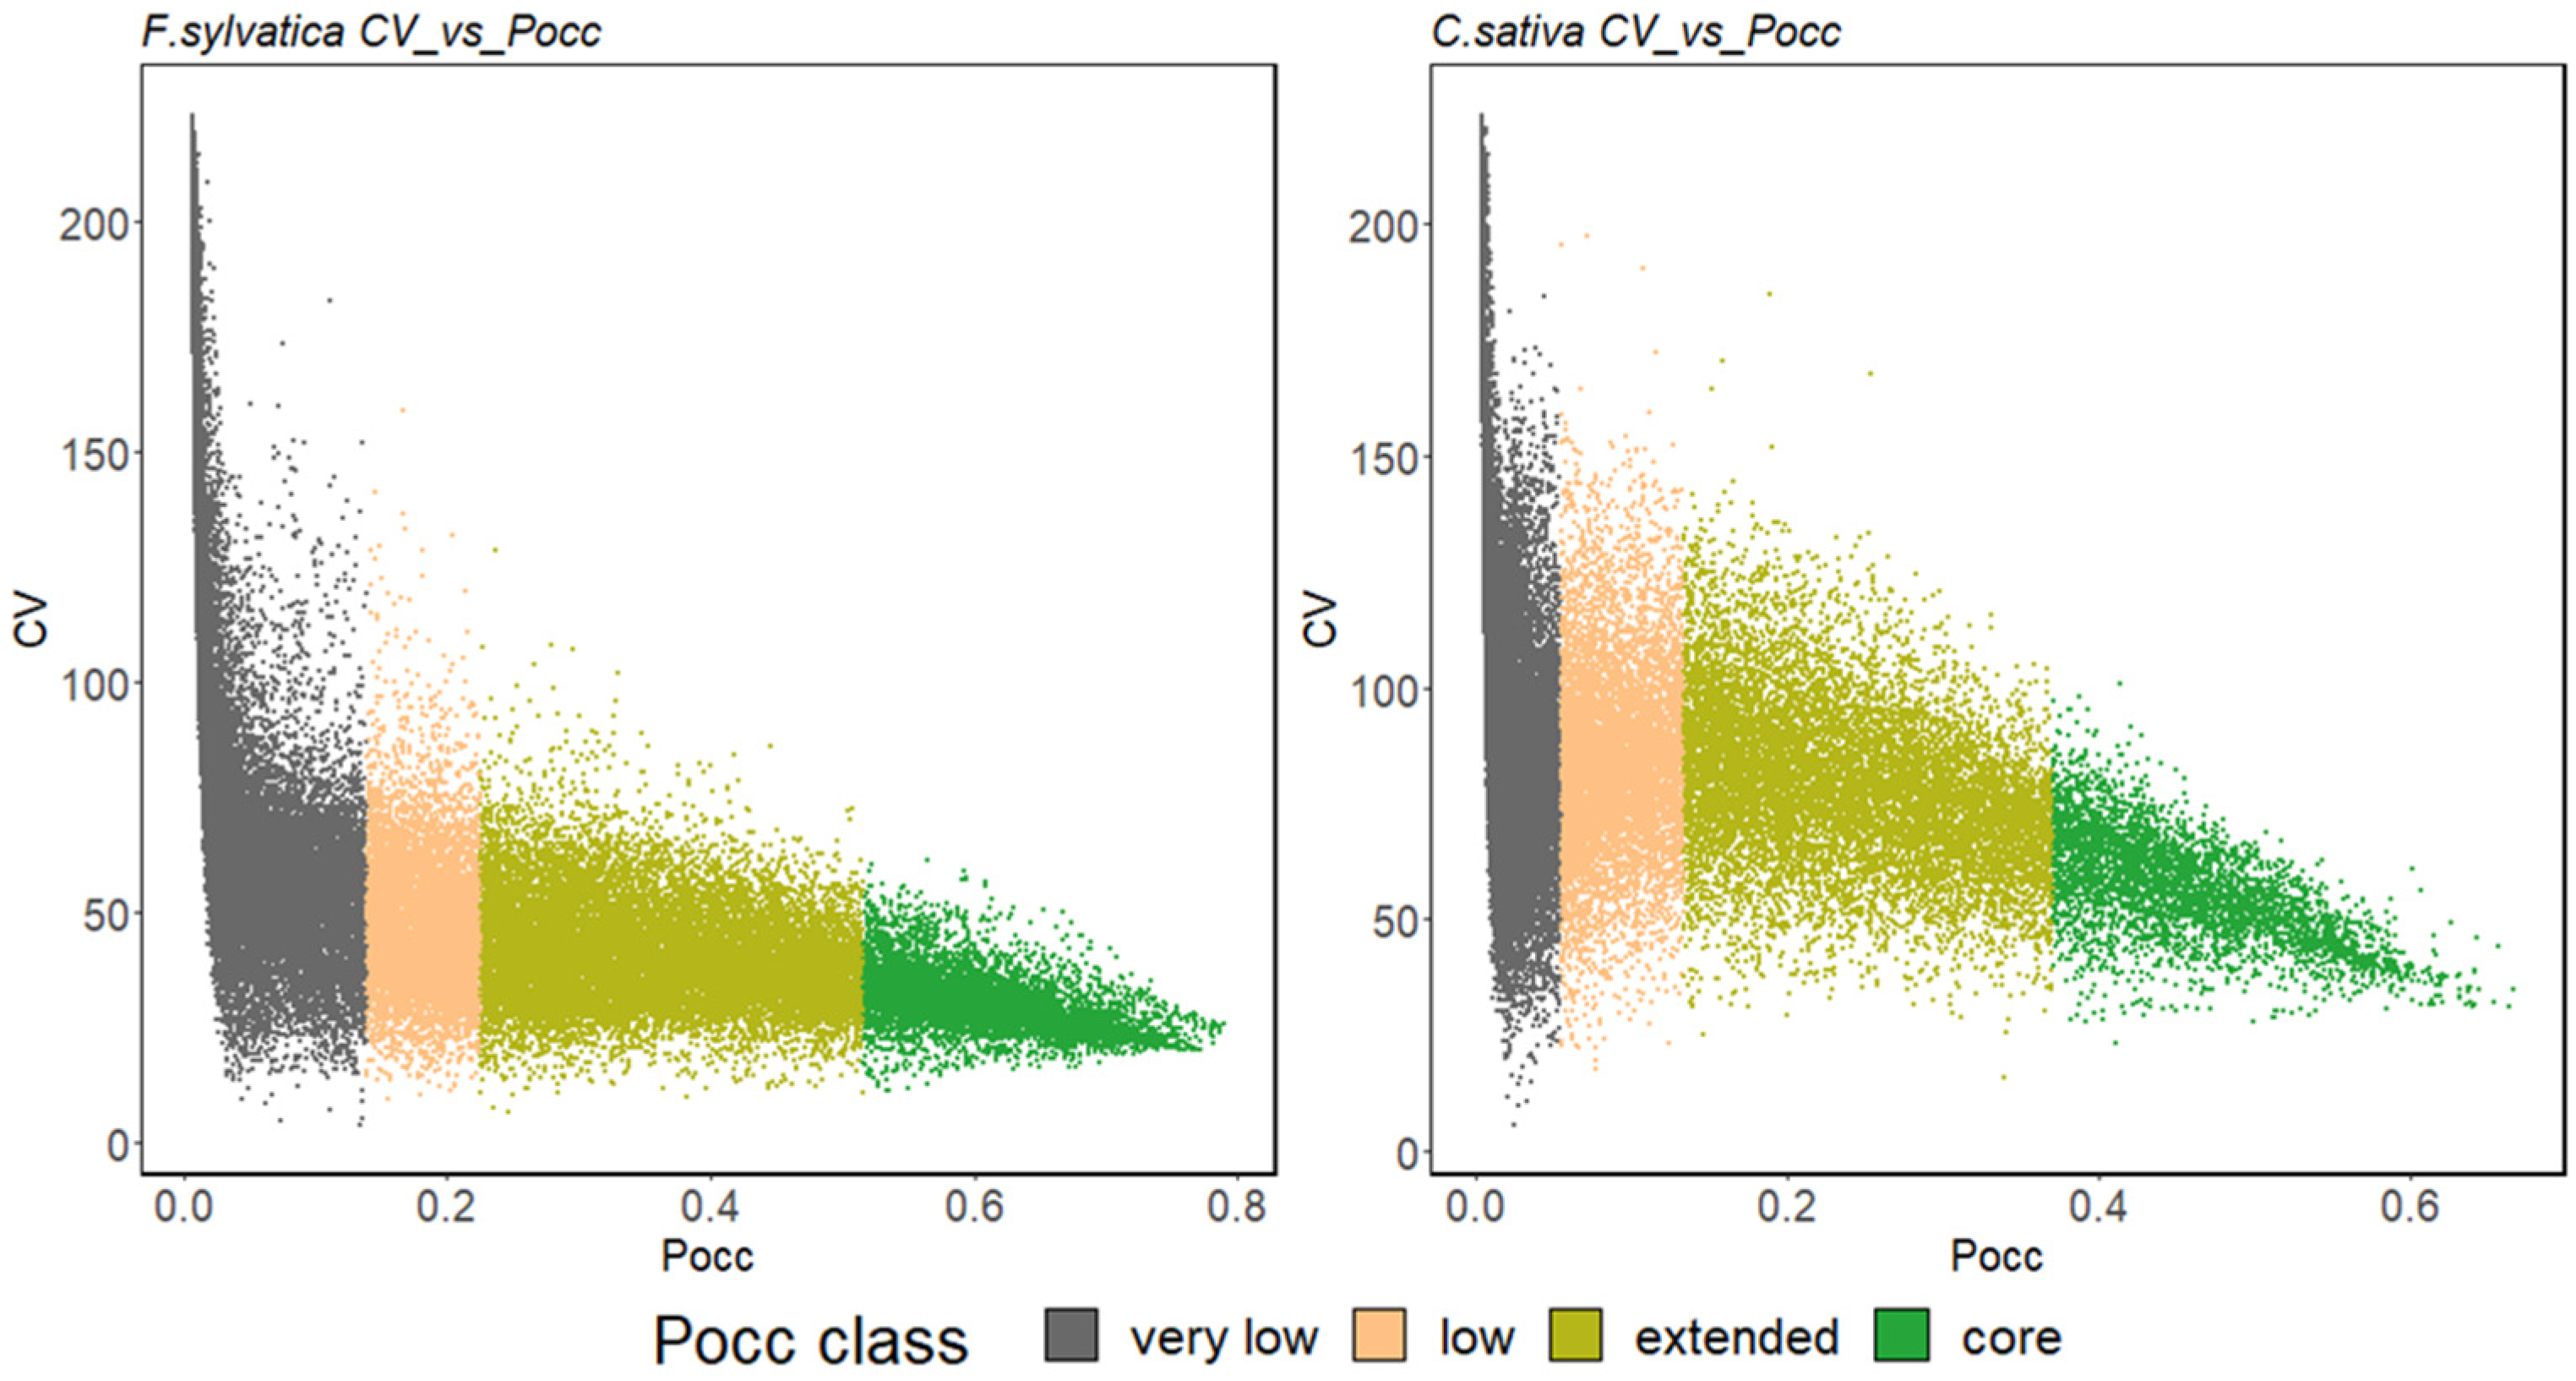
3.2. Ensemble Predictions

For visualization of ensemble model results across Europe, we present projections for the major tree species F. sylvatica and the alternative tree species C. sativa, both for the current climate and in 2070 under RCP 4.5 and RCP 8.5. Projections for the remaining species are placed in the Appendix A. F. sylvatica and C. sativa show opposing distribution patterns regarding the mean annual temperature, continentality and the soil nutrient status while featuring similar mean annual precipitation rates (Figure 3). For C. sativa the mean annual temperature rises with increasing Pocc, up to a mean of 12.26 °C for the highest class, while mean annual temperature shows a decreasing trend across Pocc classes for F. sylvatica, down to a mean of 8.47 °C at its highest Pocc class. An opposite trend is apparent for the continentality and soil nutrient status. While ensemble models predict the continentality range for F. sylvatica to exceed that of C. sativa, the highest Pocc class features the highest mean continentality (22.14) for F. sylvatica, in contrast to C. sativa where the highest class features the lowest mean continentality (16.38).
Those pattern reflect in the predicted current distribution patterns of both species. F. sylvatica is distributed across central and eastern Europe, the British Isles as well as in more elevated and cooler sites in southern Europe, while C. sativa prevails at warmer locations in southern and western Europe, limited by rising continentality to the Northeast (Figure 4). With projected climate change, F. sylvatica forfeits its extensive distribution potential in western and central Europe, showing increasing Pocc in Finland and Scandinavia by the end of the century. In central Europe, a high Pocc is only retained in the highlands under RCP 8.5. Under climate change the distribution potential of C. sativa also shows a north easterly expansion trend, most pronounced under RCP 8.5 where high Pocc is projected to reach southern Scandinavia in the north and the Baltic states in the east. Already under RCP 4.5, most of central Europe and the British Isles feature high Pocc classes. While the distribution potential of C. sativa is projected to recede in southwestern France, northern Spain and central Italy under high emission scenarios, the occurrence probability of C. sativa is on the rise across Europe under climate change, most pronounced under the RCP 8.5 scenario.

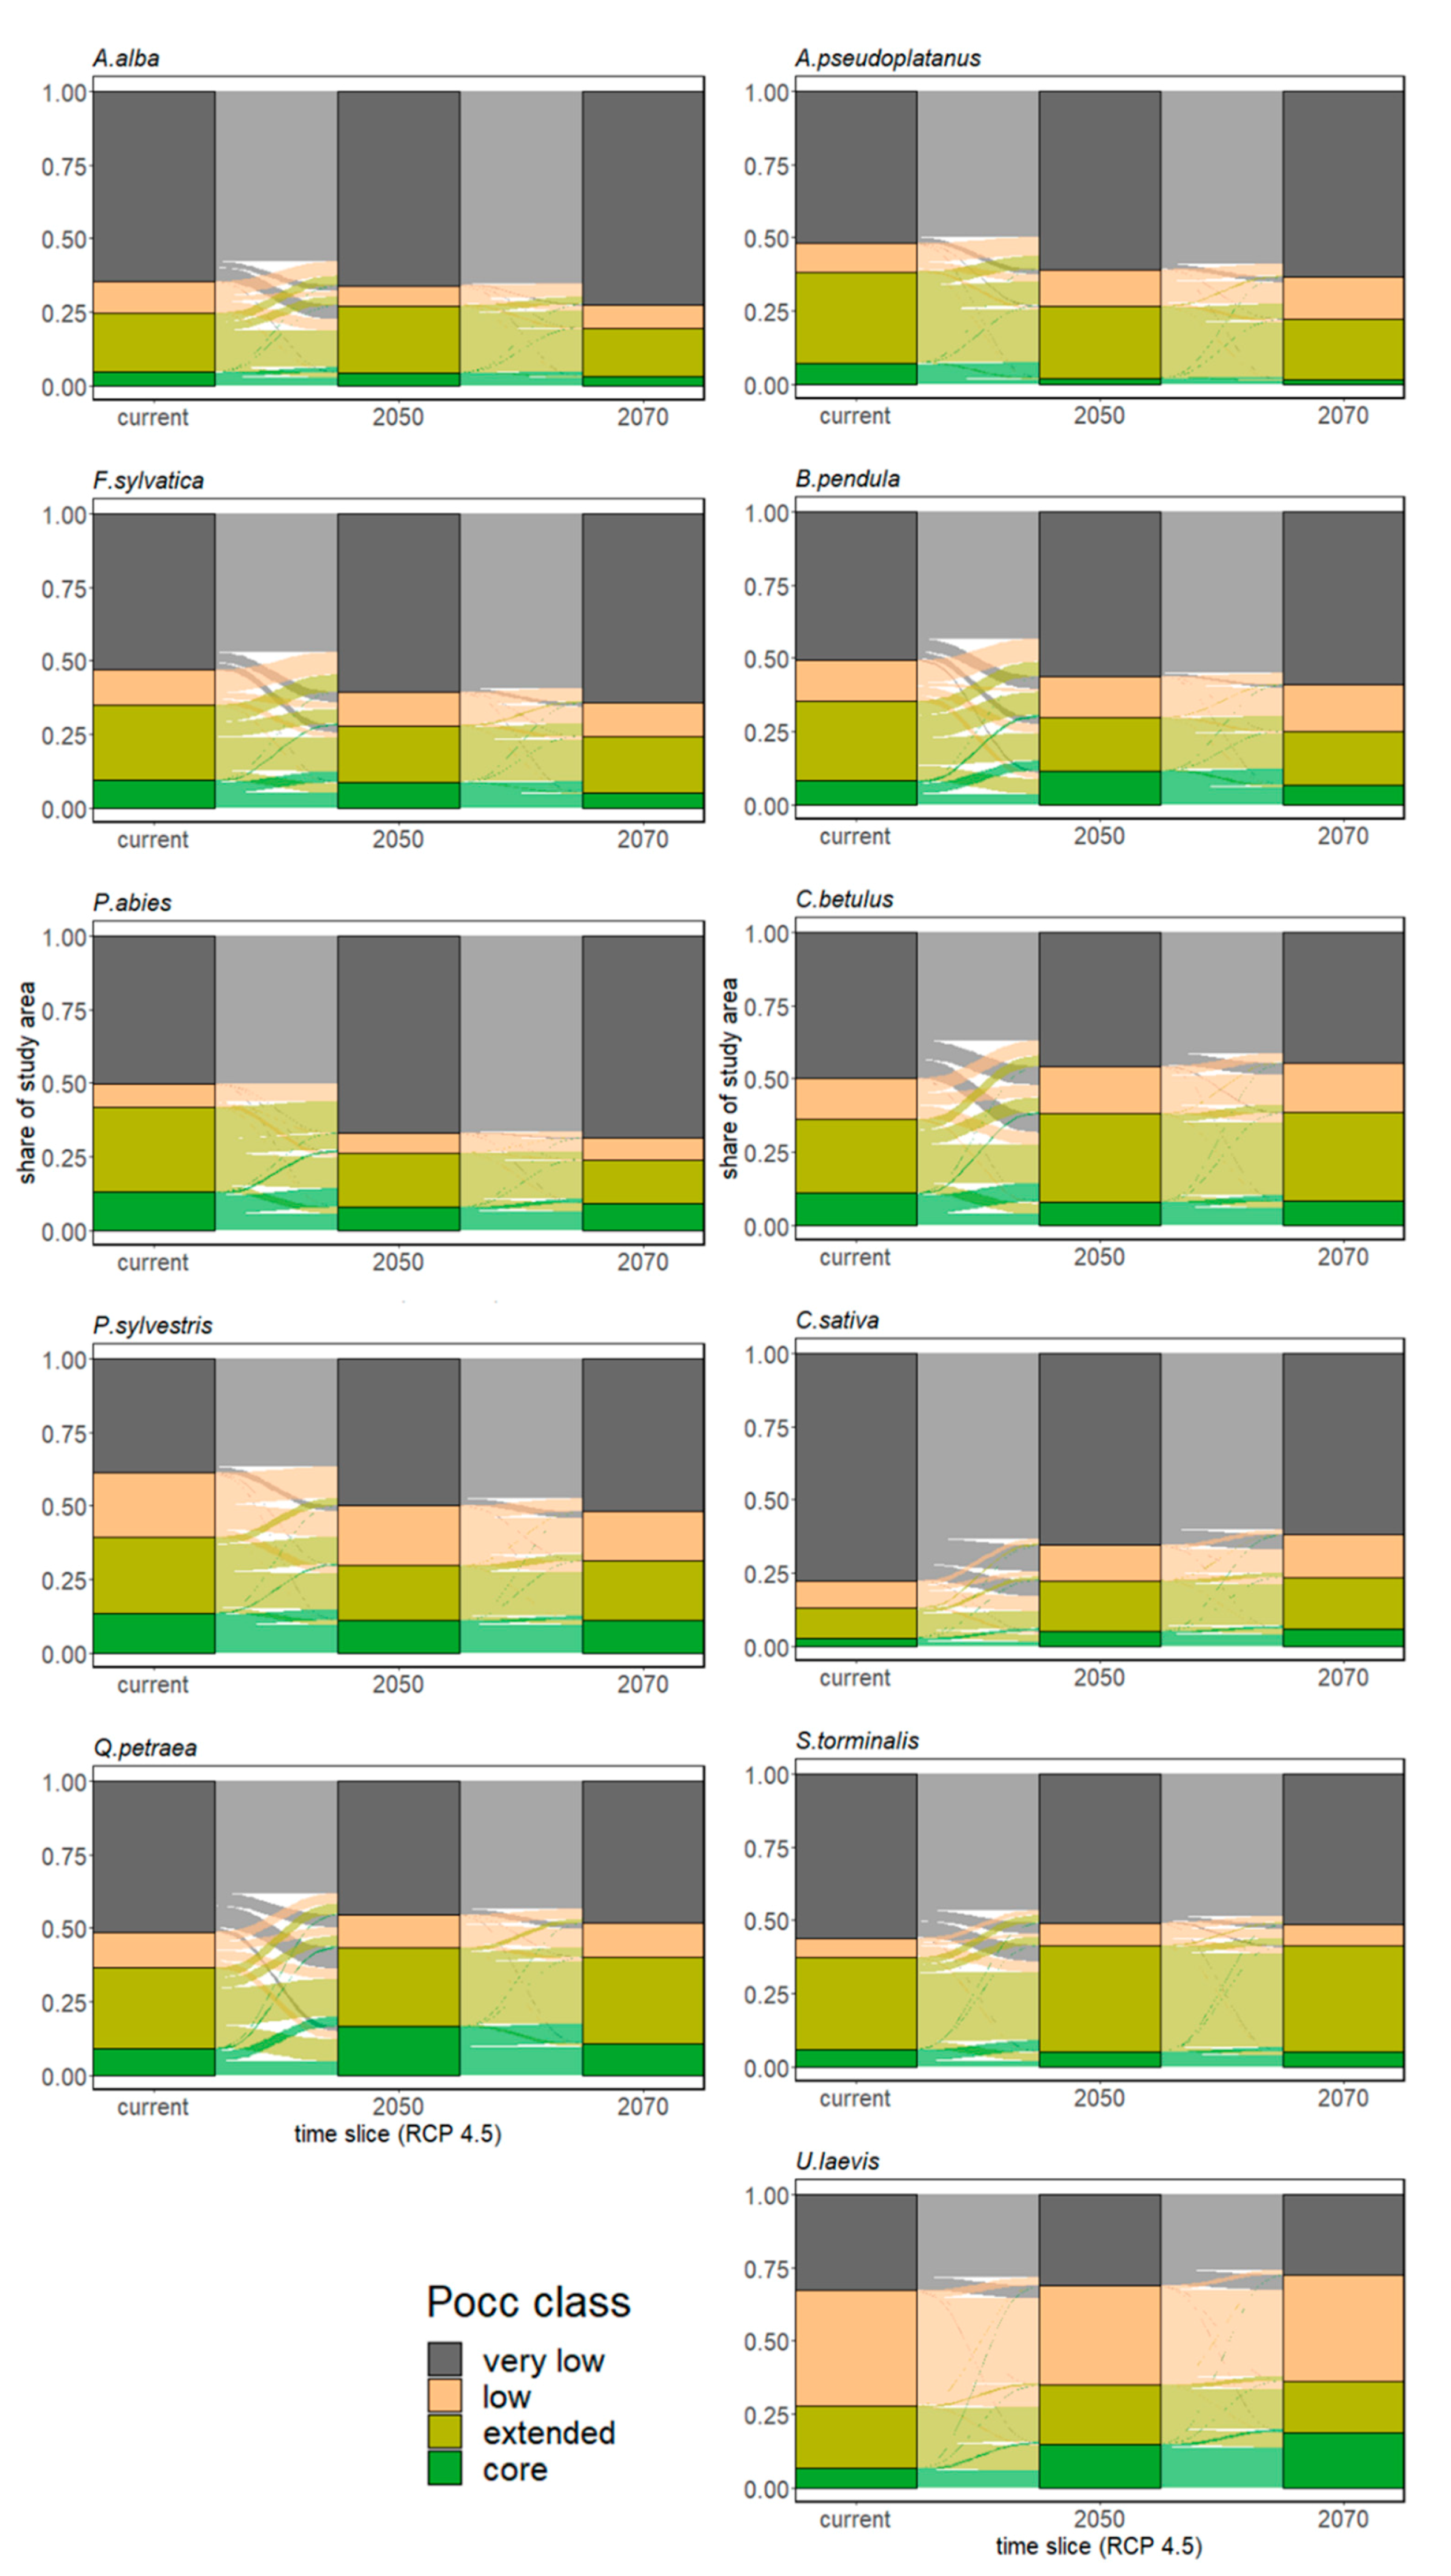
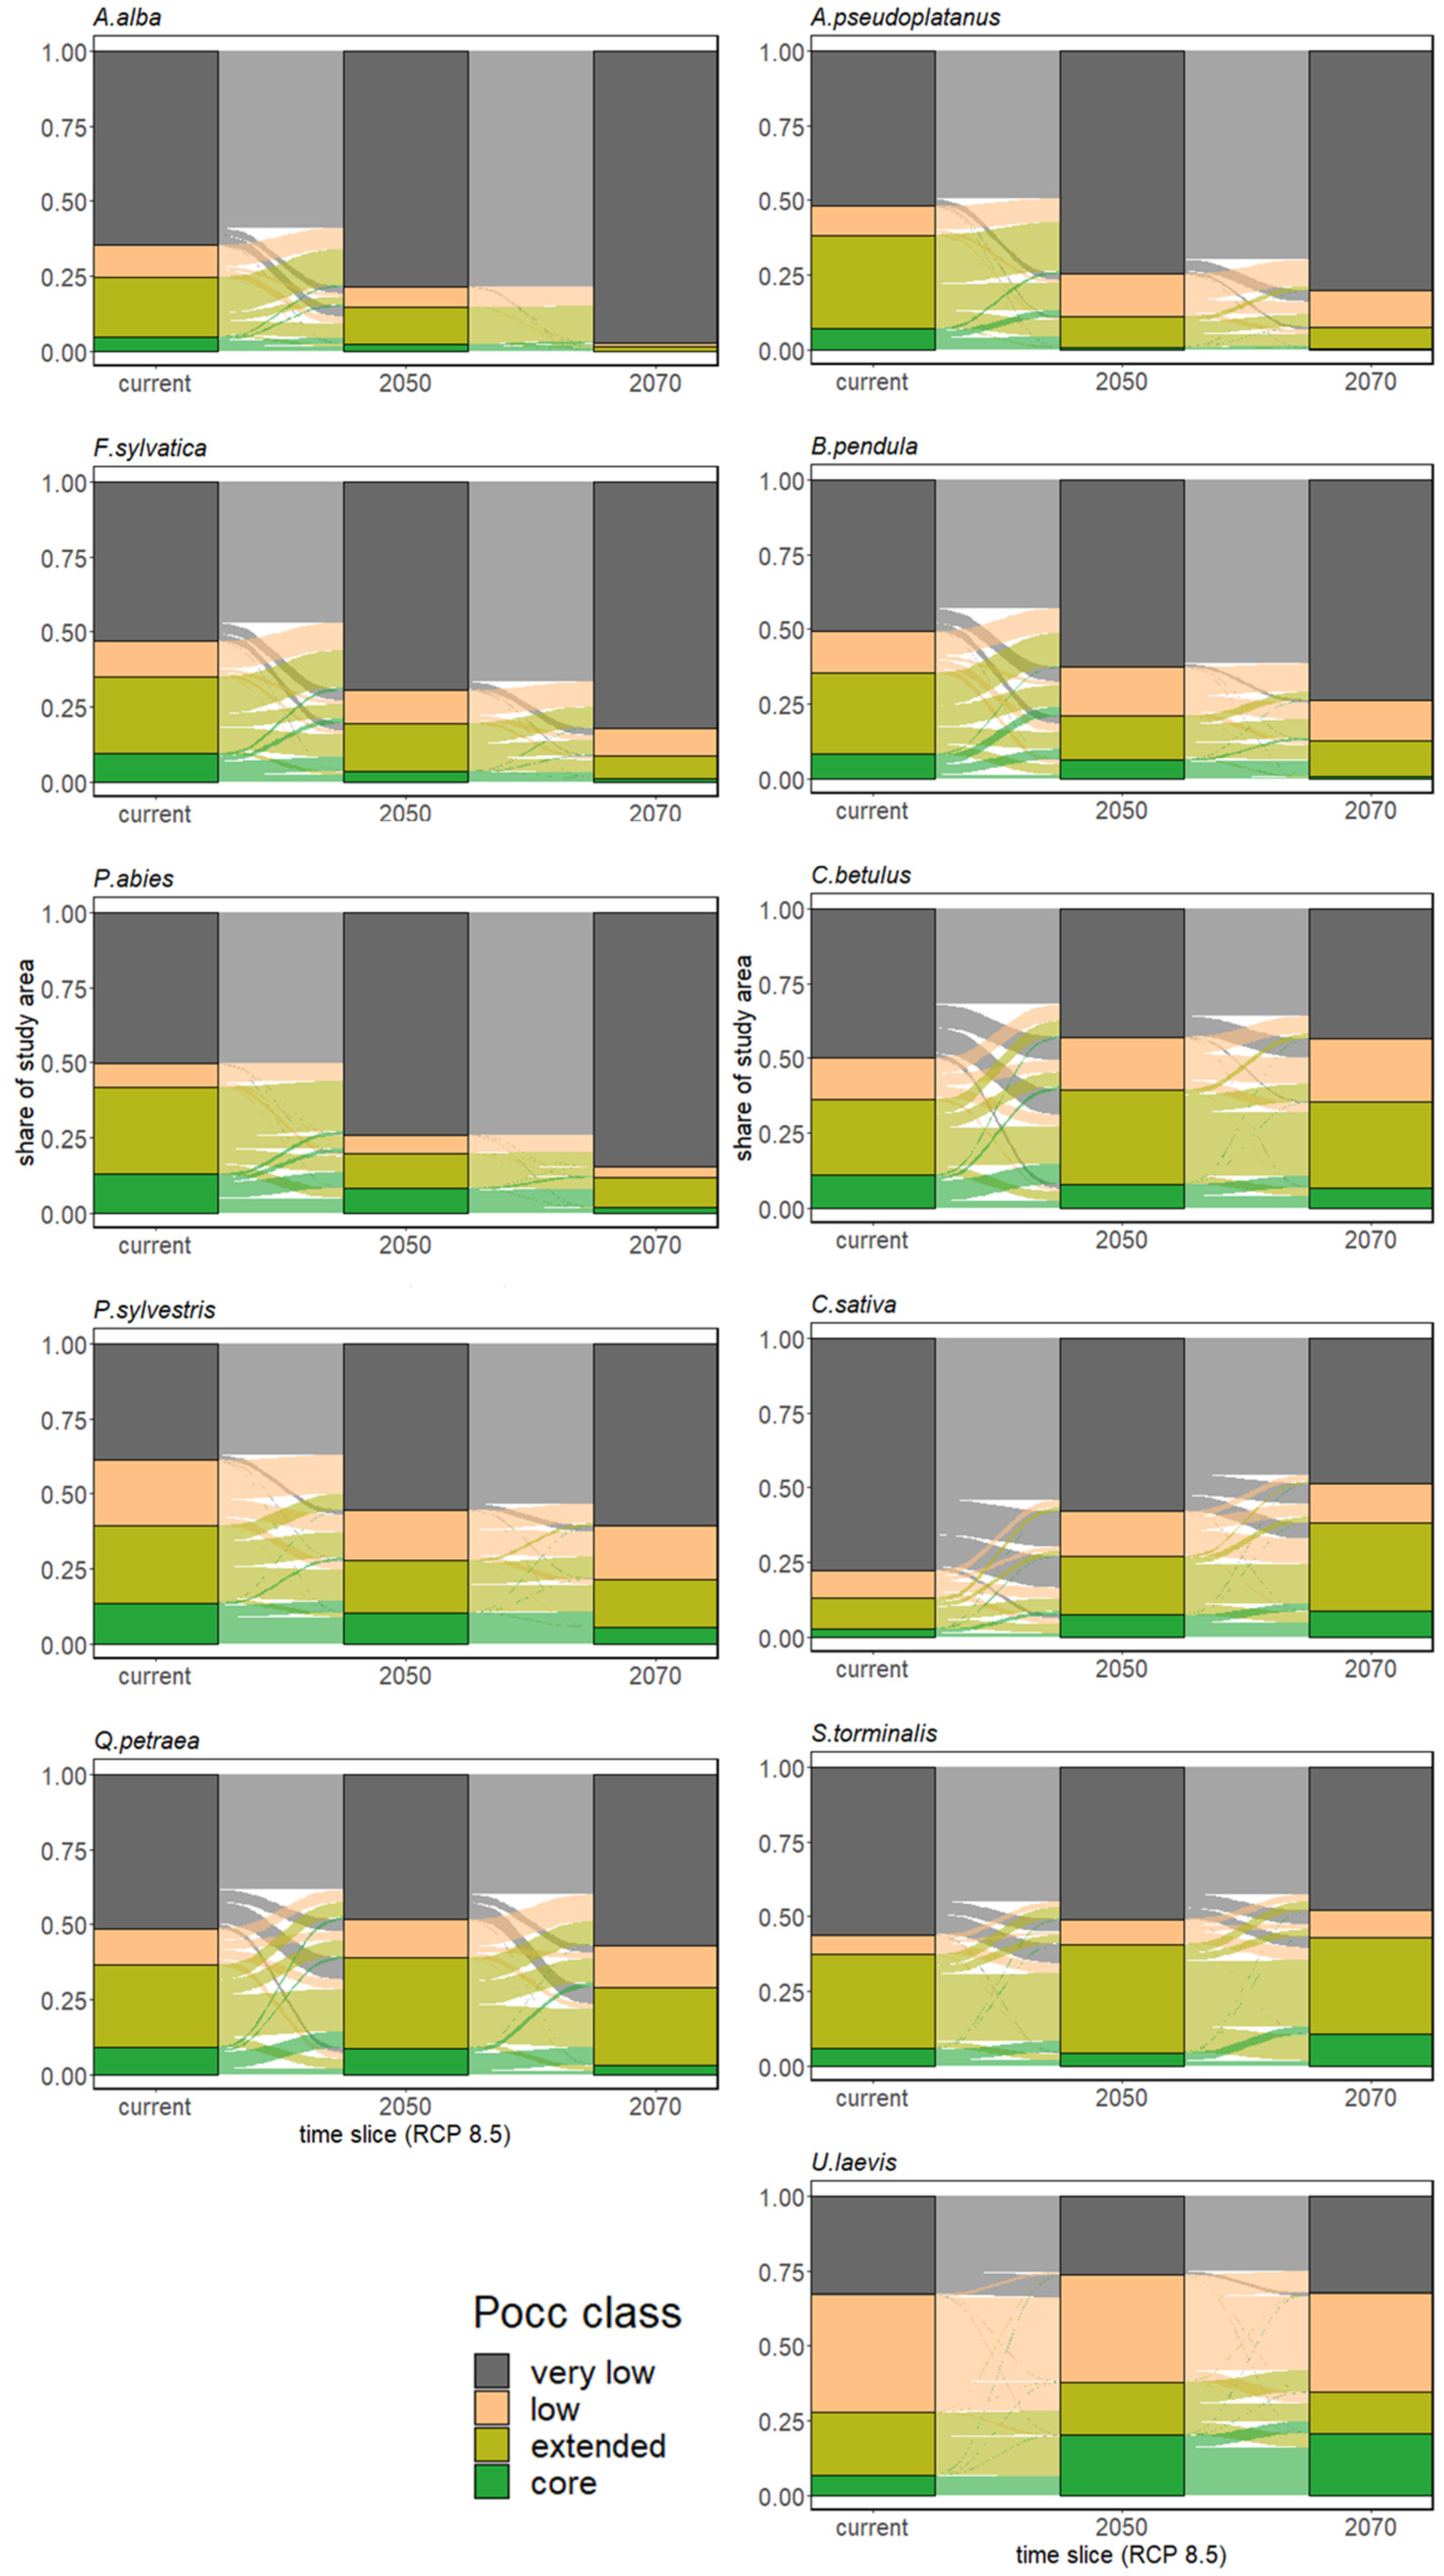
3.2.1. Range Size Dynamic

The major tree species P. abies and F. sylvatica are both projected to experience pronounced range contractions by the end of the century (Figure 5). Under RCP 4.5, ensemble models project a decline in range size by 43% and 31% for the reference years 2050 and 2070, respectively, while under high emission scenarios a decrease in range size by ~¾ (P. abies: −72%, F. sylvatica: −76%) is projected. Ensemble models also show a stark range contraction for A. alba under high emission scenarios. While the range of A. alba only shows a moderate decline under medium emission scenarios (−21%), under RCP 8.5 ensemble models project a contraction by 94.5% with only few refuges of Pocc remaining in the southern Alps, the Carpathians and the Dinaric Alps. While the projected range decline of P. sylvestris under RCP 4.5 is comparable to that of A. alba, despite being strong overall, contractions under RCP 8.5 are least pronounced among modeled conifers (−45%). In comparison, the range size of Q. petraea remains relatively stable across scenarios showing mild increases under RCP 4.5 (+10%) and moderate contractions under RCP 8.5 by 2070 (−20%).
Among the minor natives studied; three species benefit from climate change scenarios in respect to their range size. C. sativa expands its range size nearly threefold under the high emission scenario (+191%) while also strongly gaining under the medium emission scenario (+79%). Under RCP 4.5 the range size of U. laevis grows steadily by 31% in 2070. However, under RCP 8.5, after initial strong range increases by mid-century (+37%) increment in range size regresses to 25% by the end of the century. Comparatively less pronounced but steady is the growth in range size for S. torminalis, reaching between +10% (RCP 4.5) and +16% (RCP 8.5) by 2070. While the range size of C. betulus remains relatively stable across scenarios showing mild increases under RCP 4.5 (+7%) and slight contractions under RCP 8.5 by 2070 (−2%), the range of B. pendula shows a strong decline under RCP 8.5 (−49%). Under both emission scenarios the range of A. pseudoplatanus shows a steady decline most pronounced under RCP 8.5 with 80% by 2070 (RCP 4.5: −42%). The prevalence of Pocc classes throughout Europe under climate change for all modelled species are provided in Table A1 and Table A2.

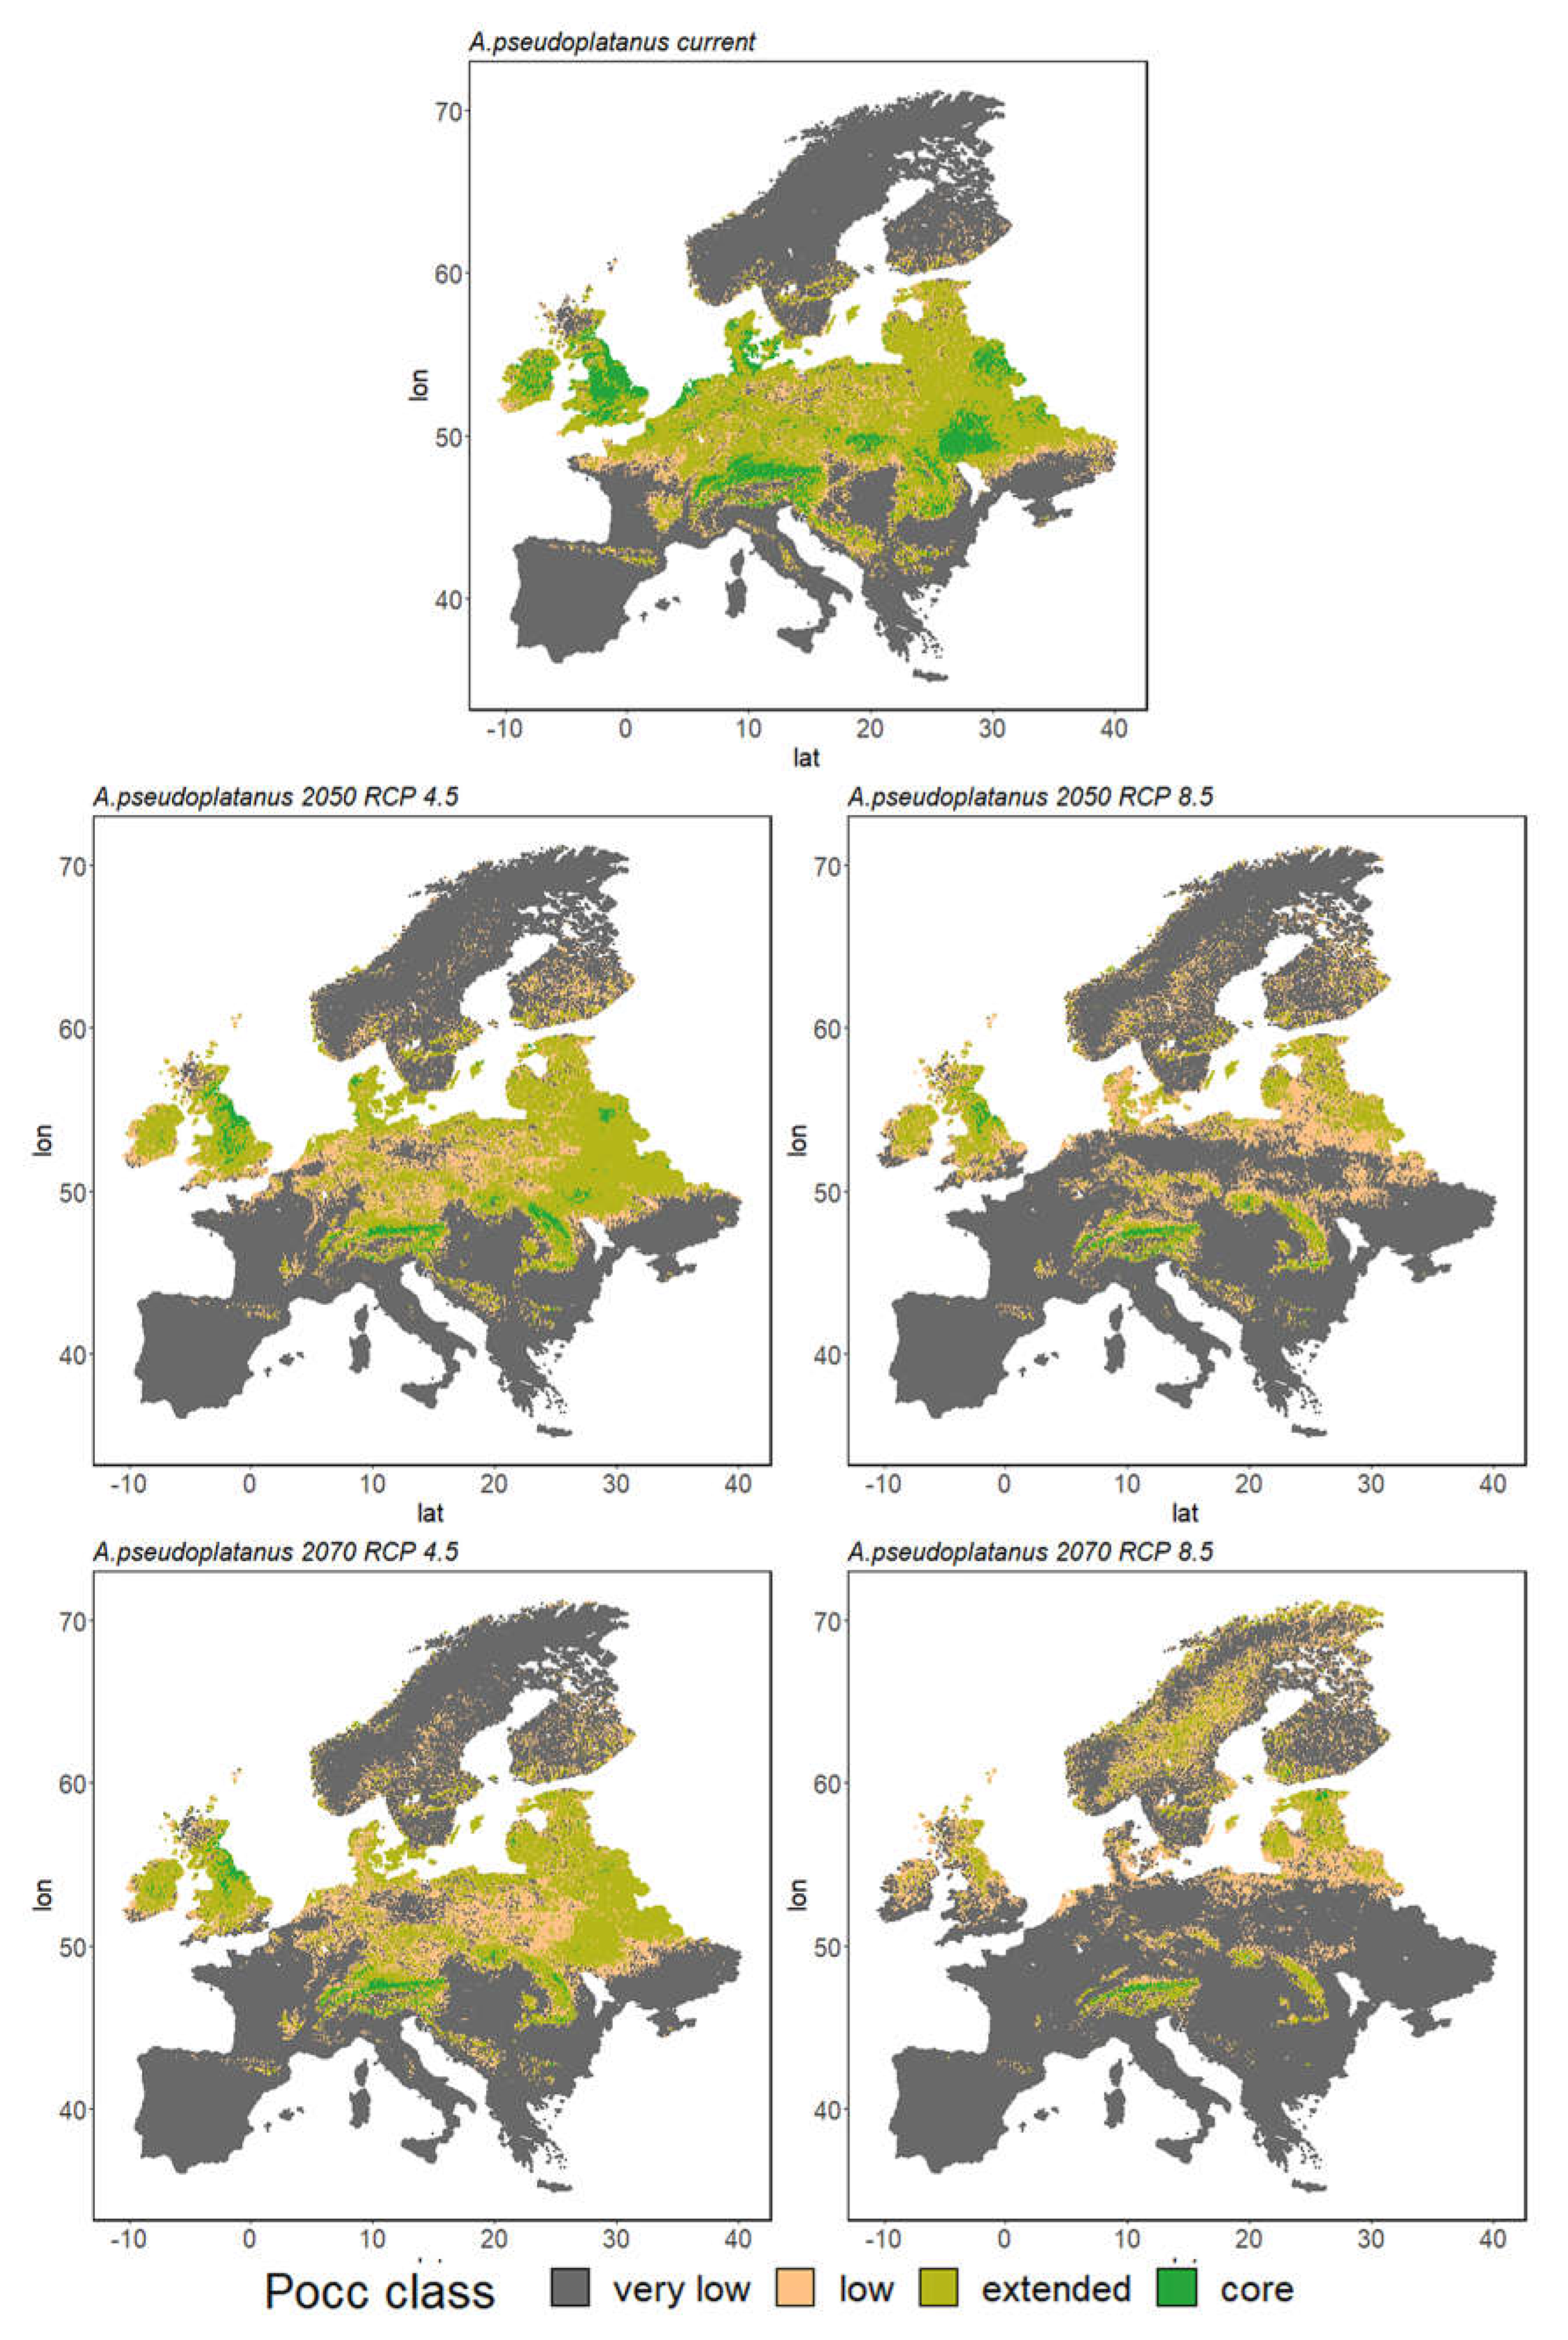
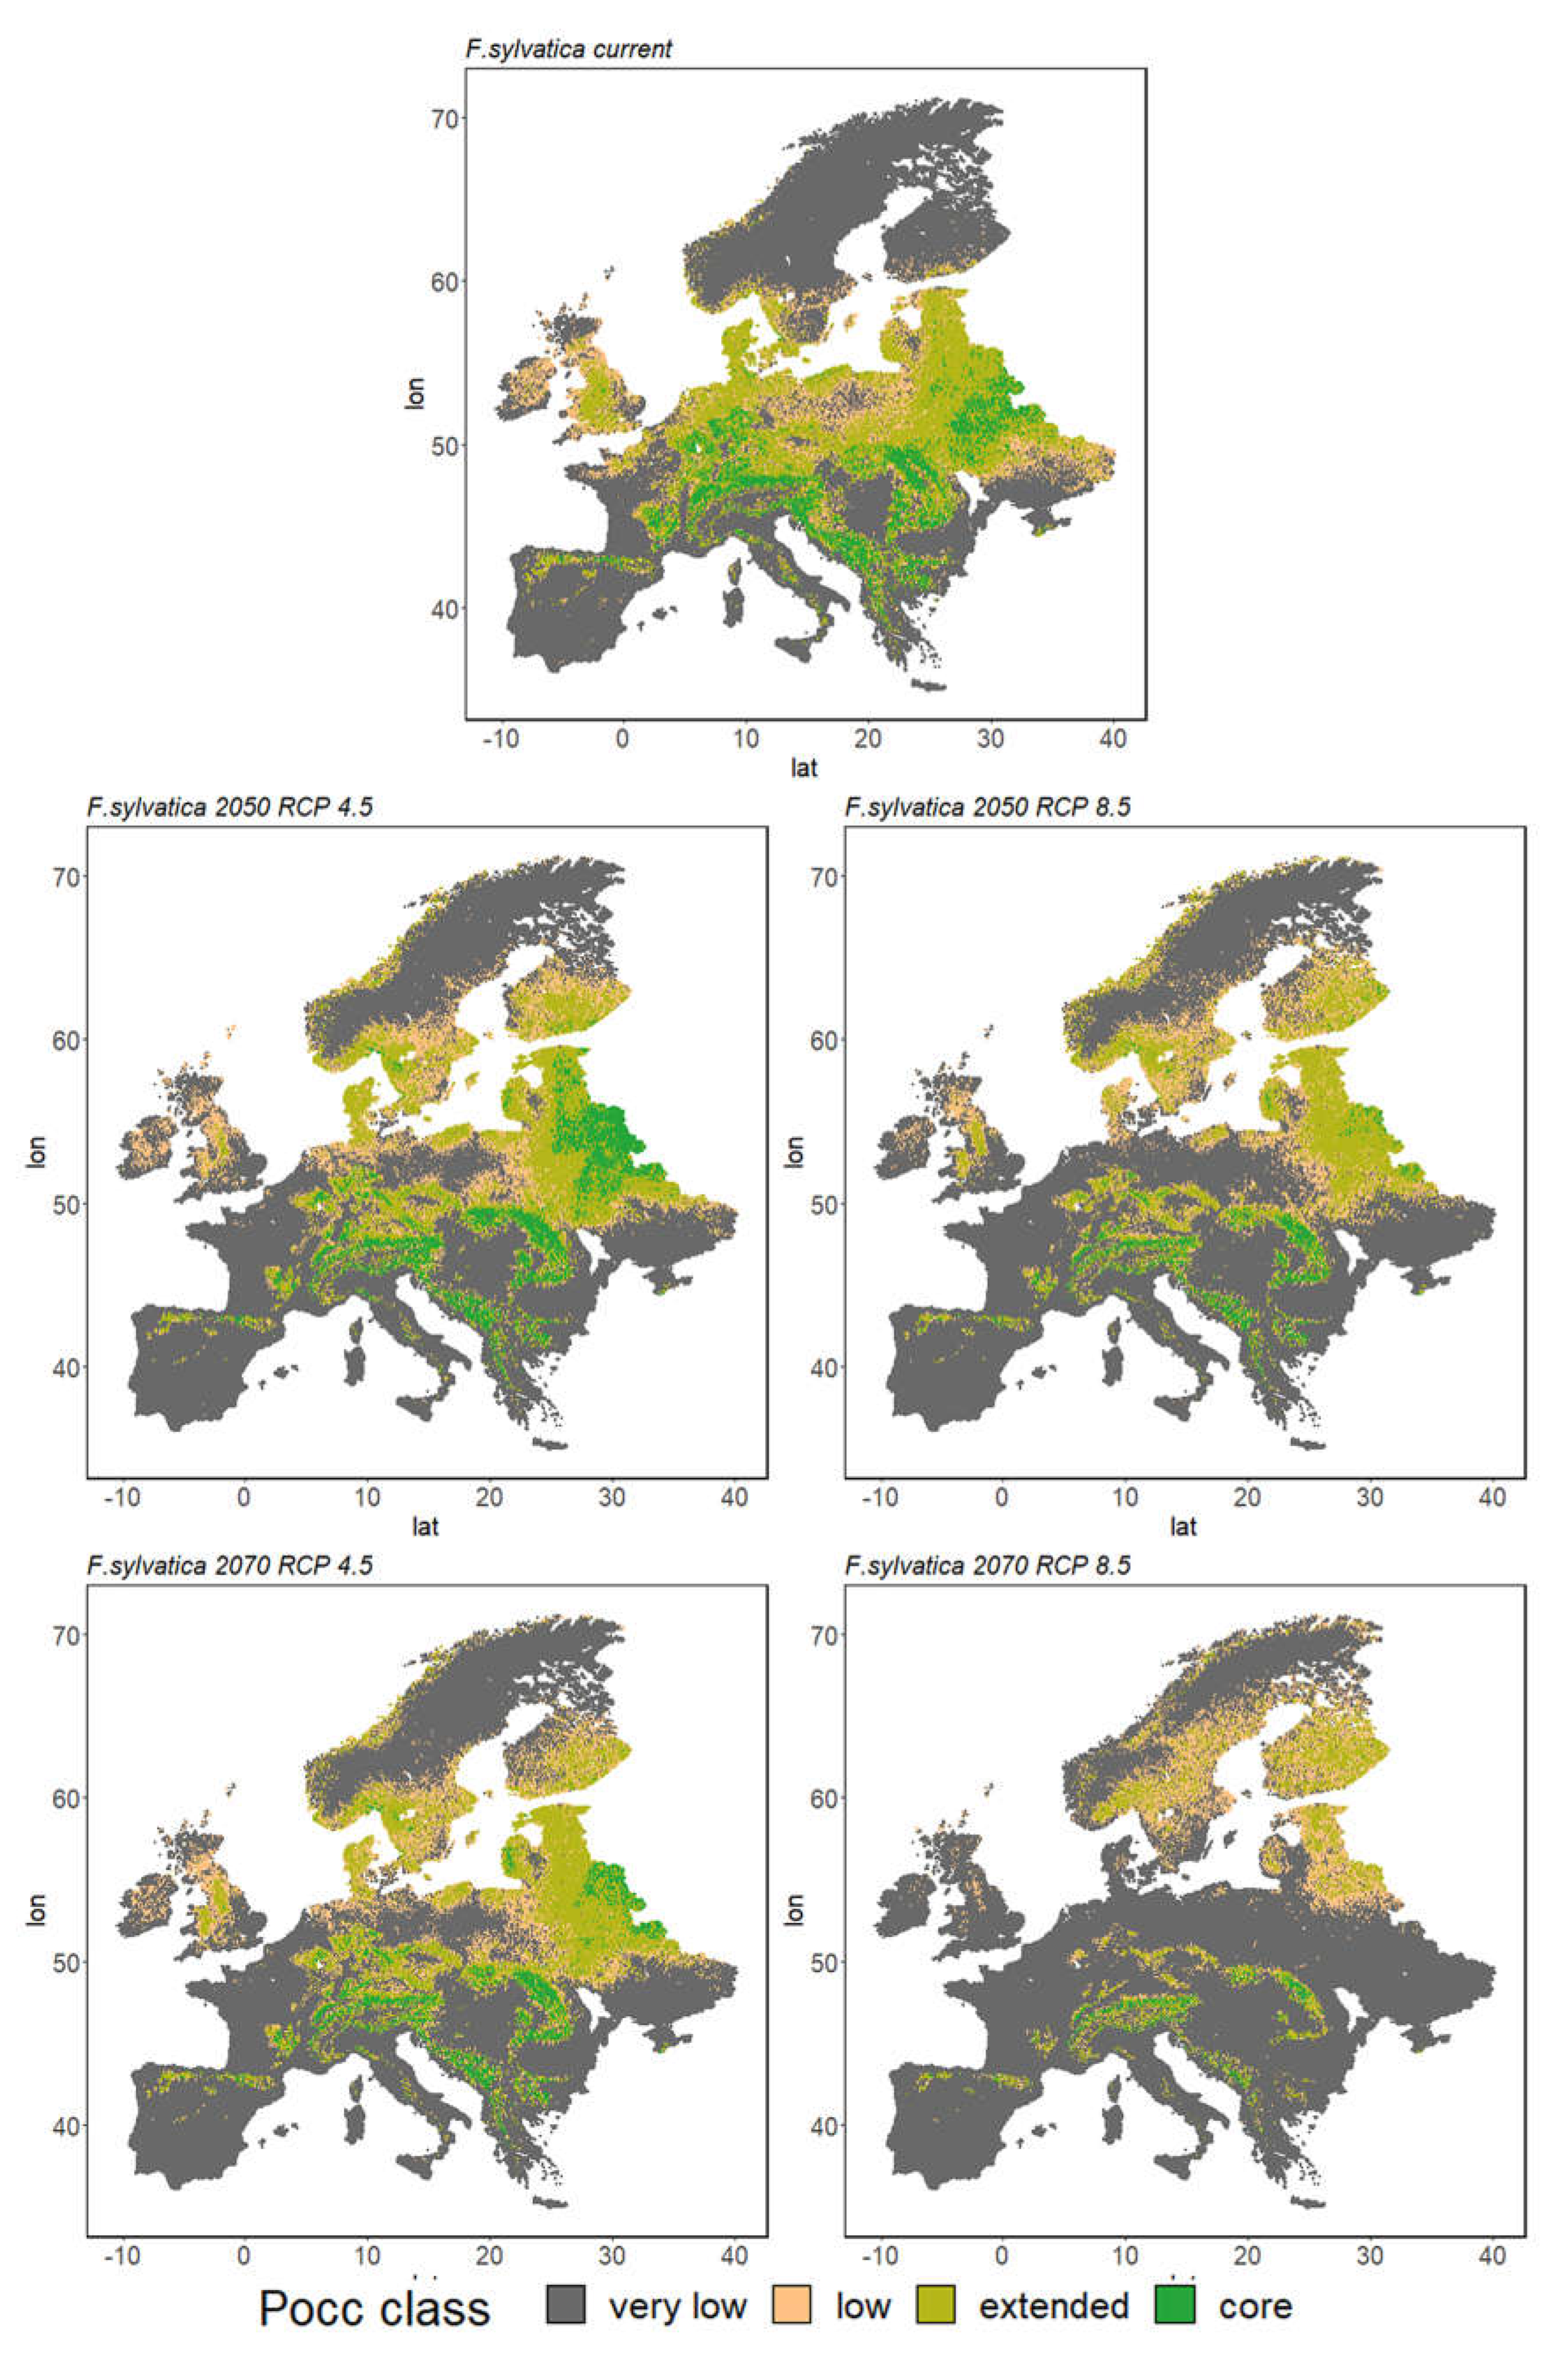
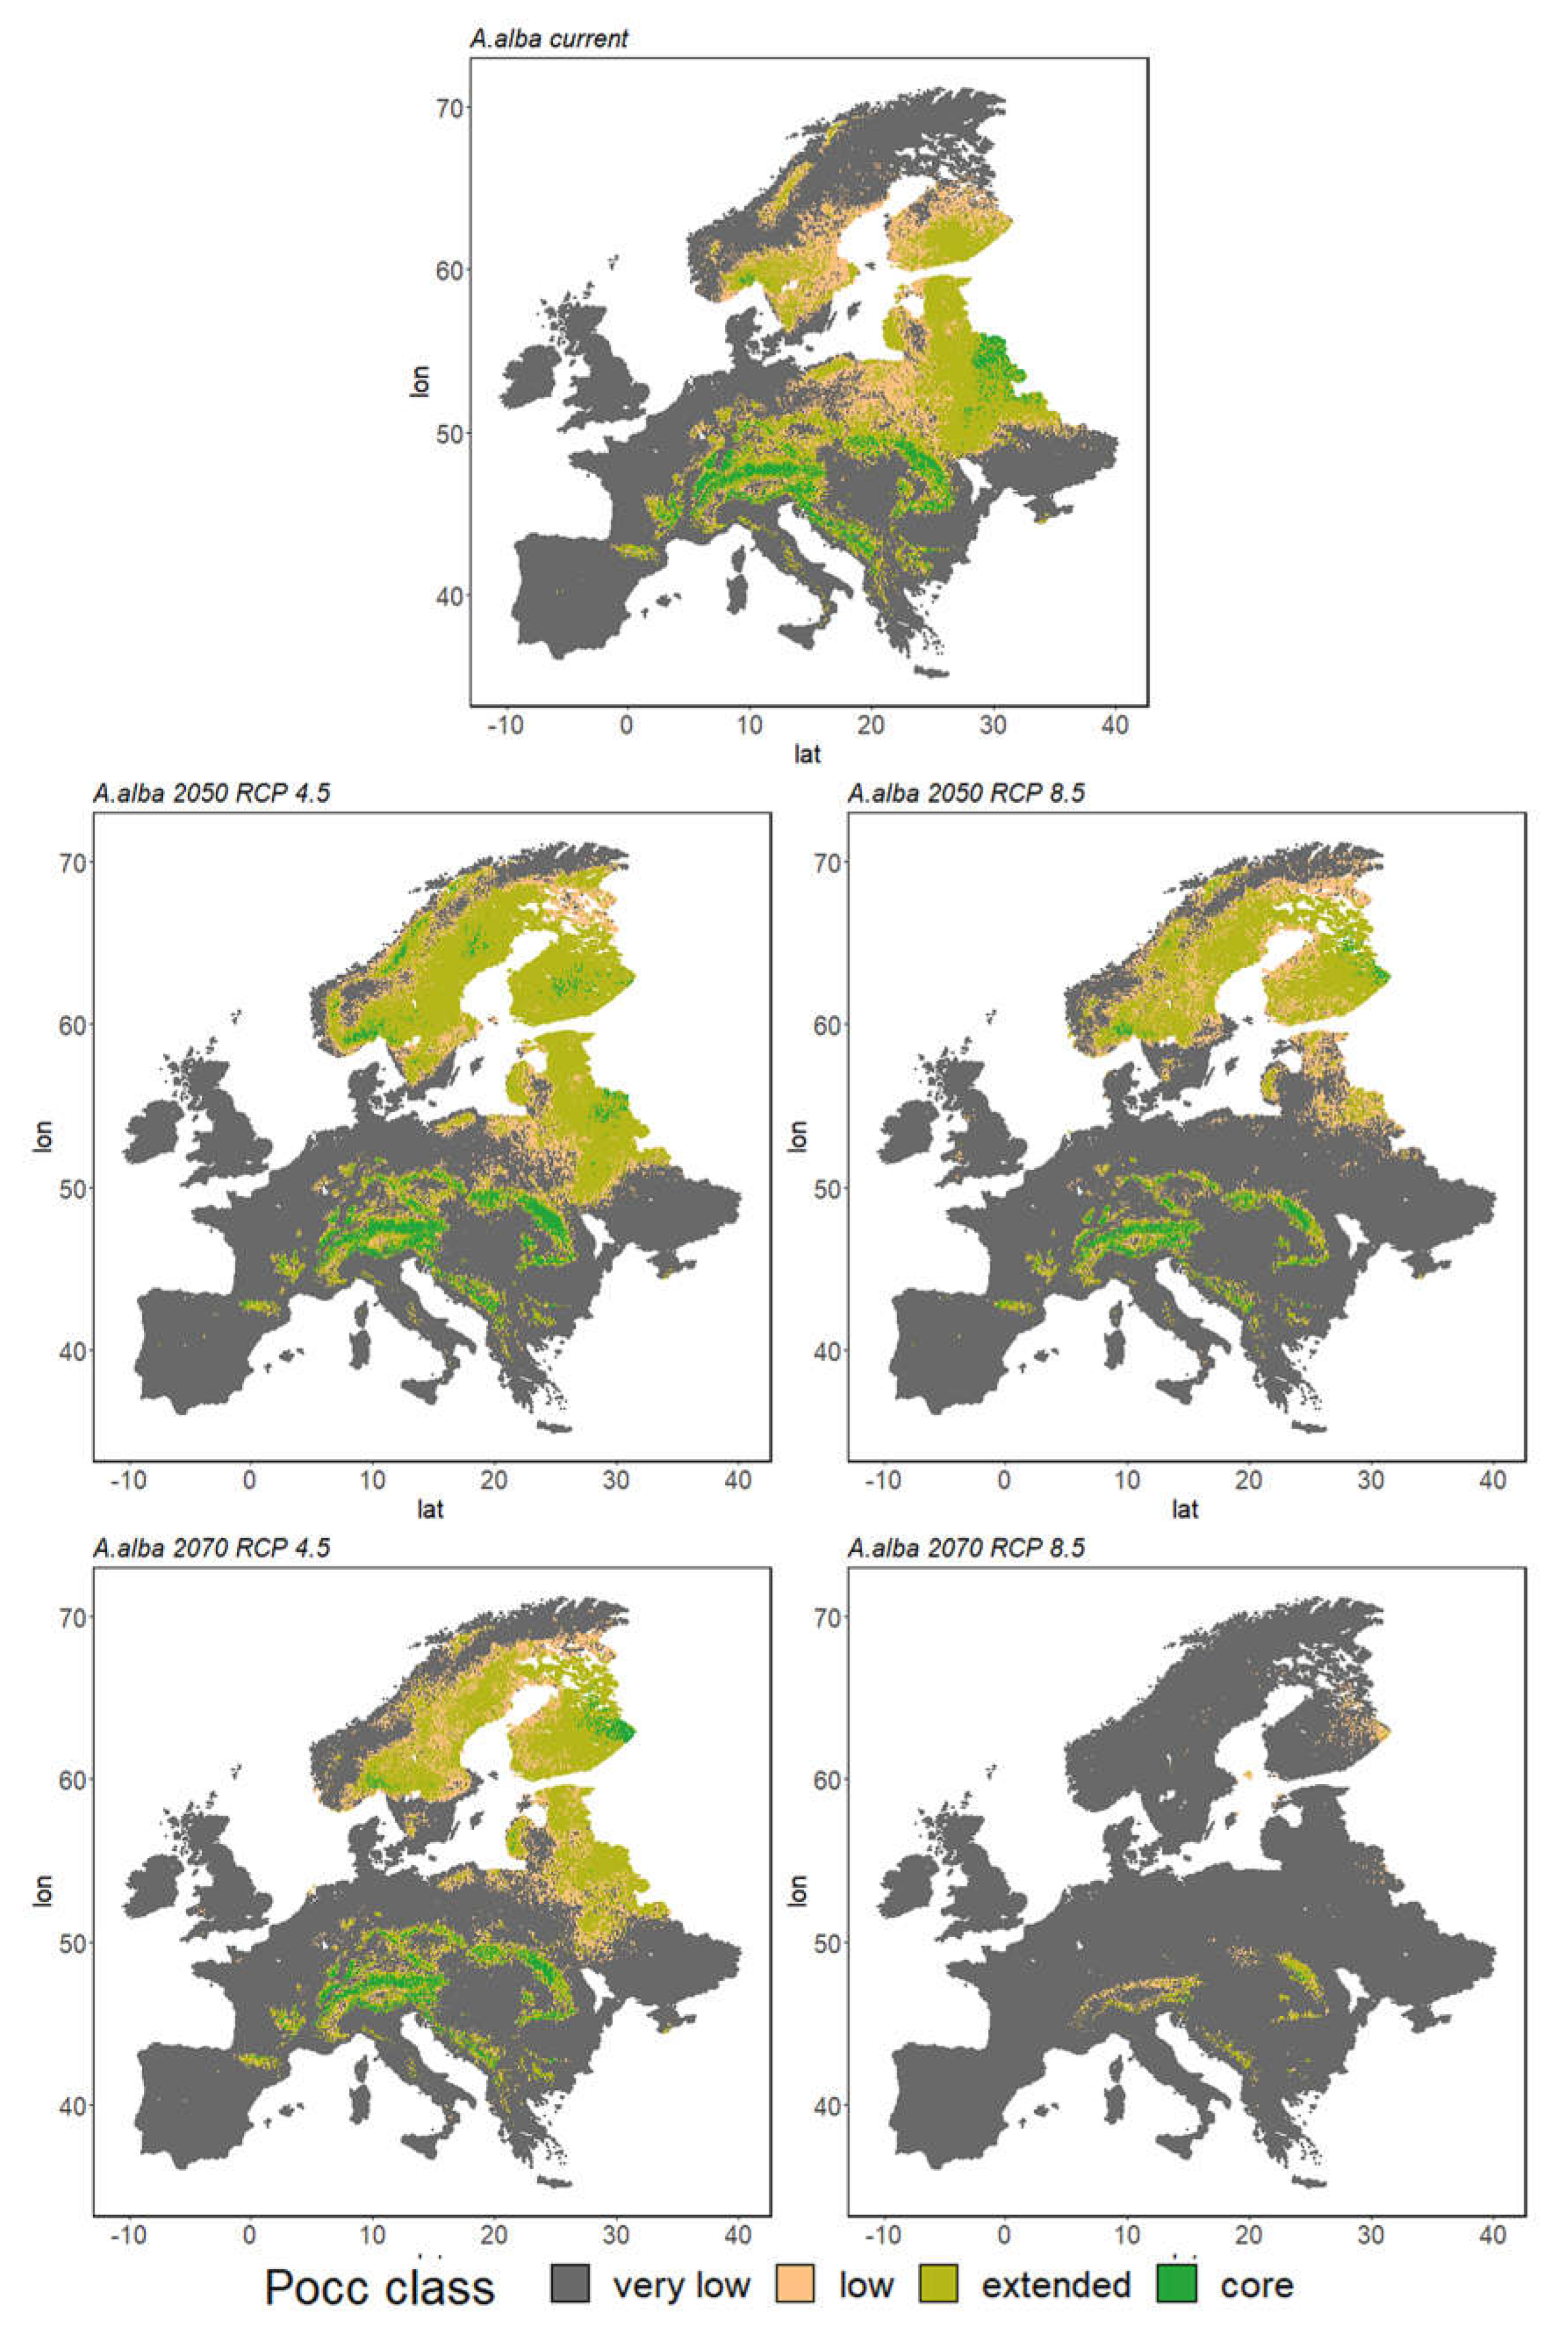
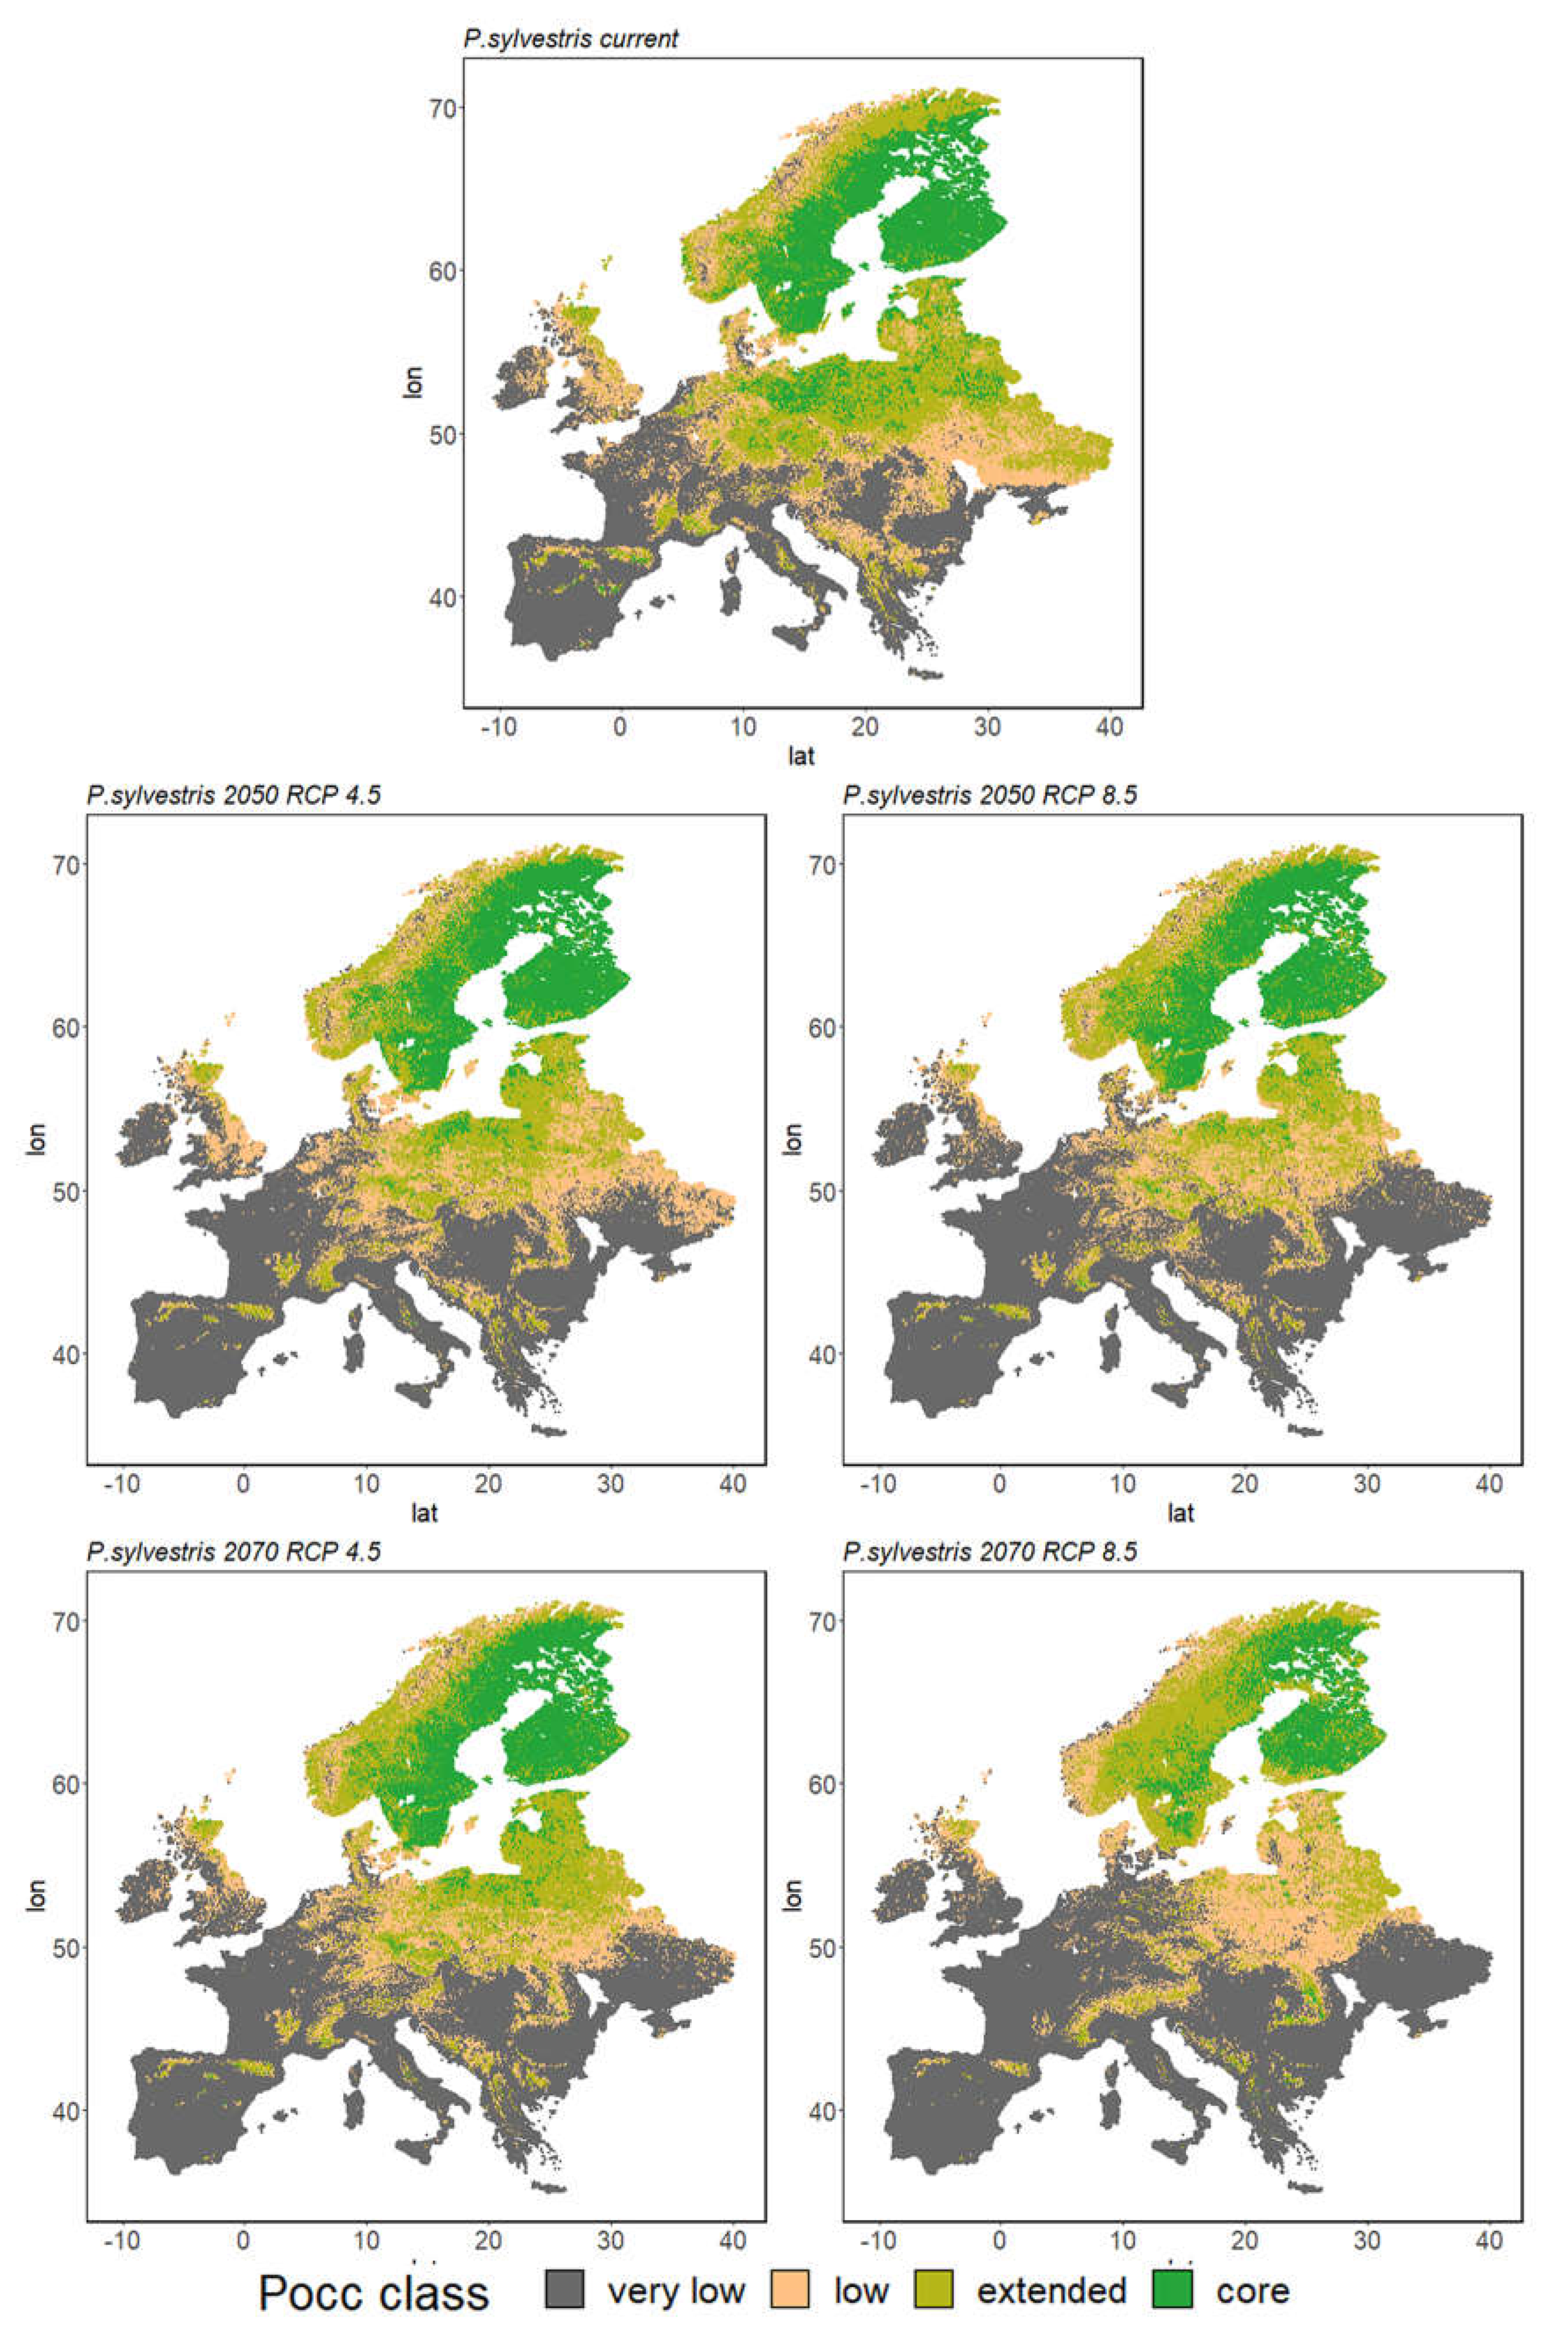
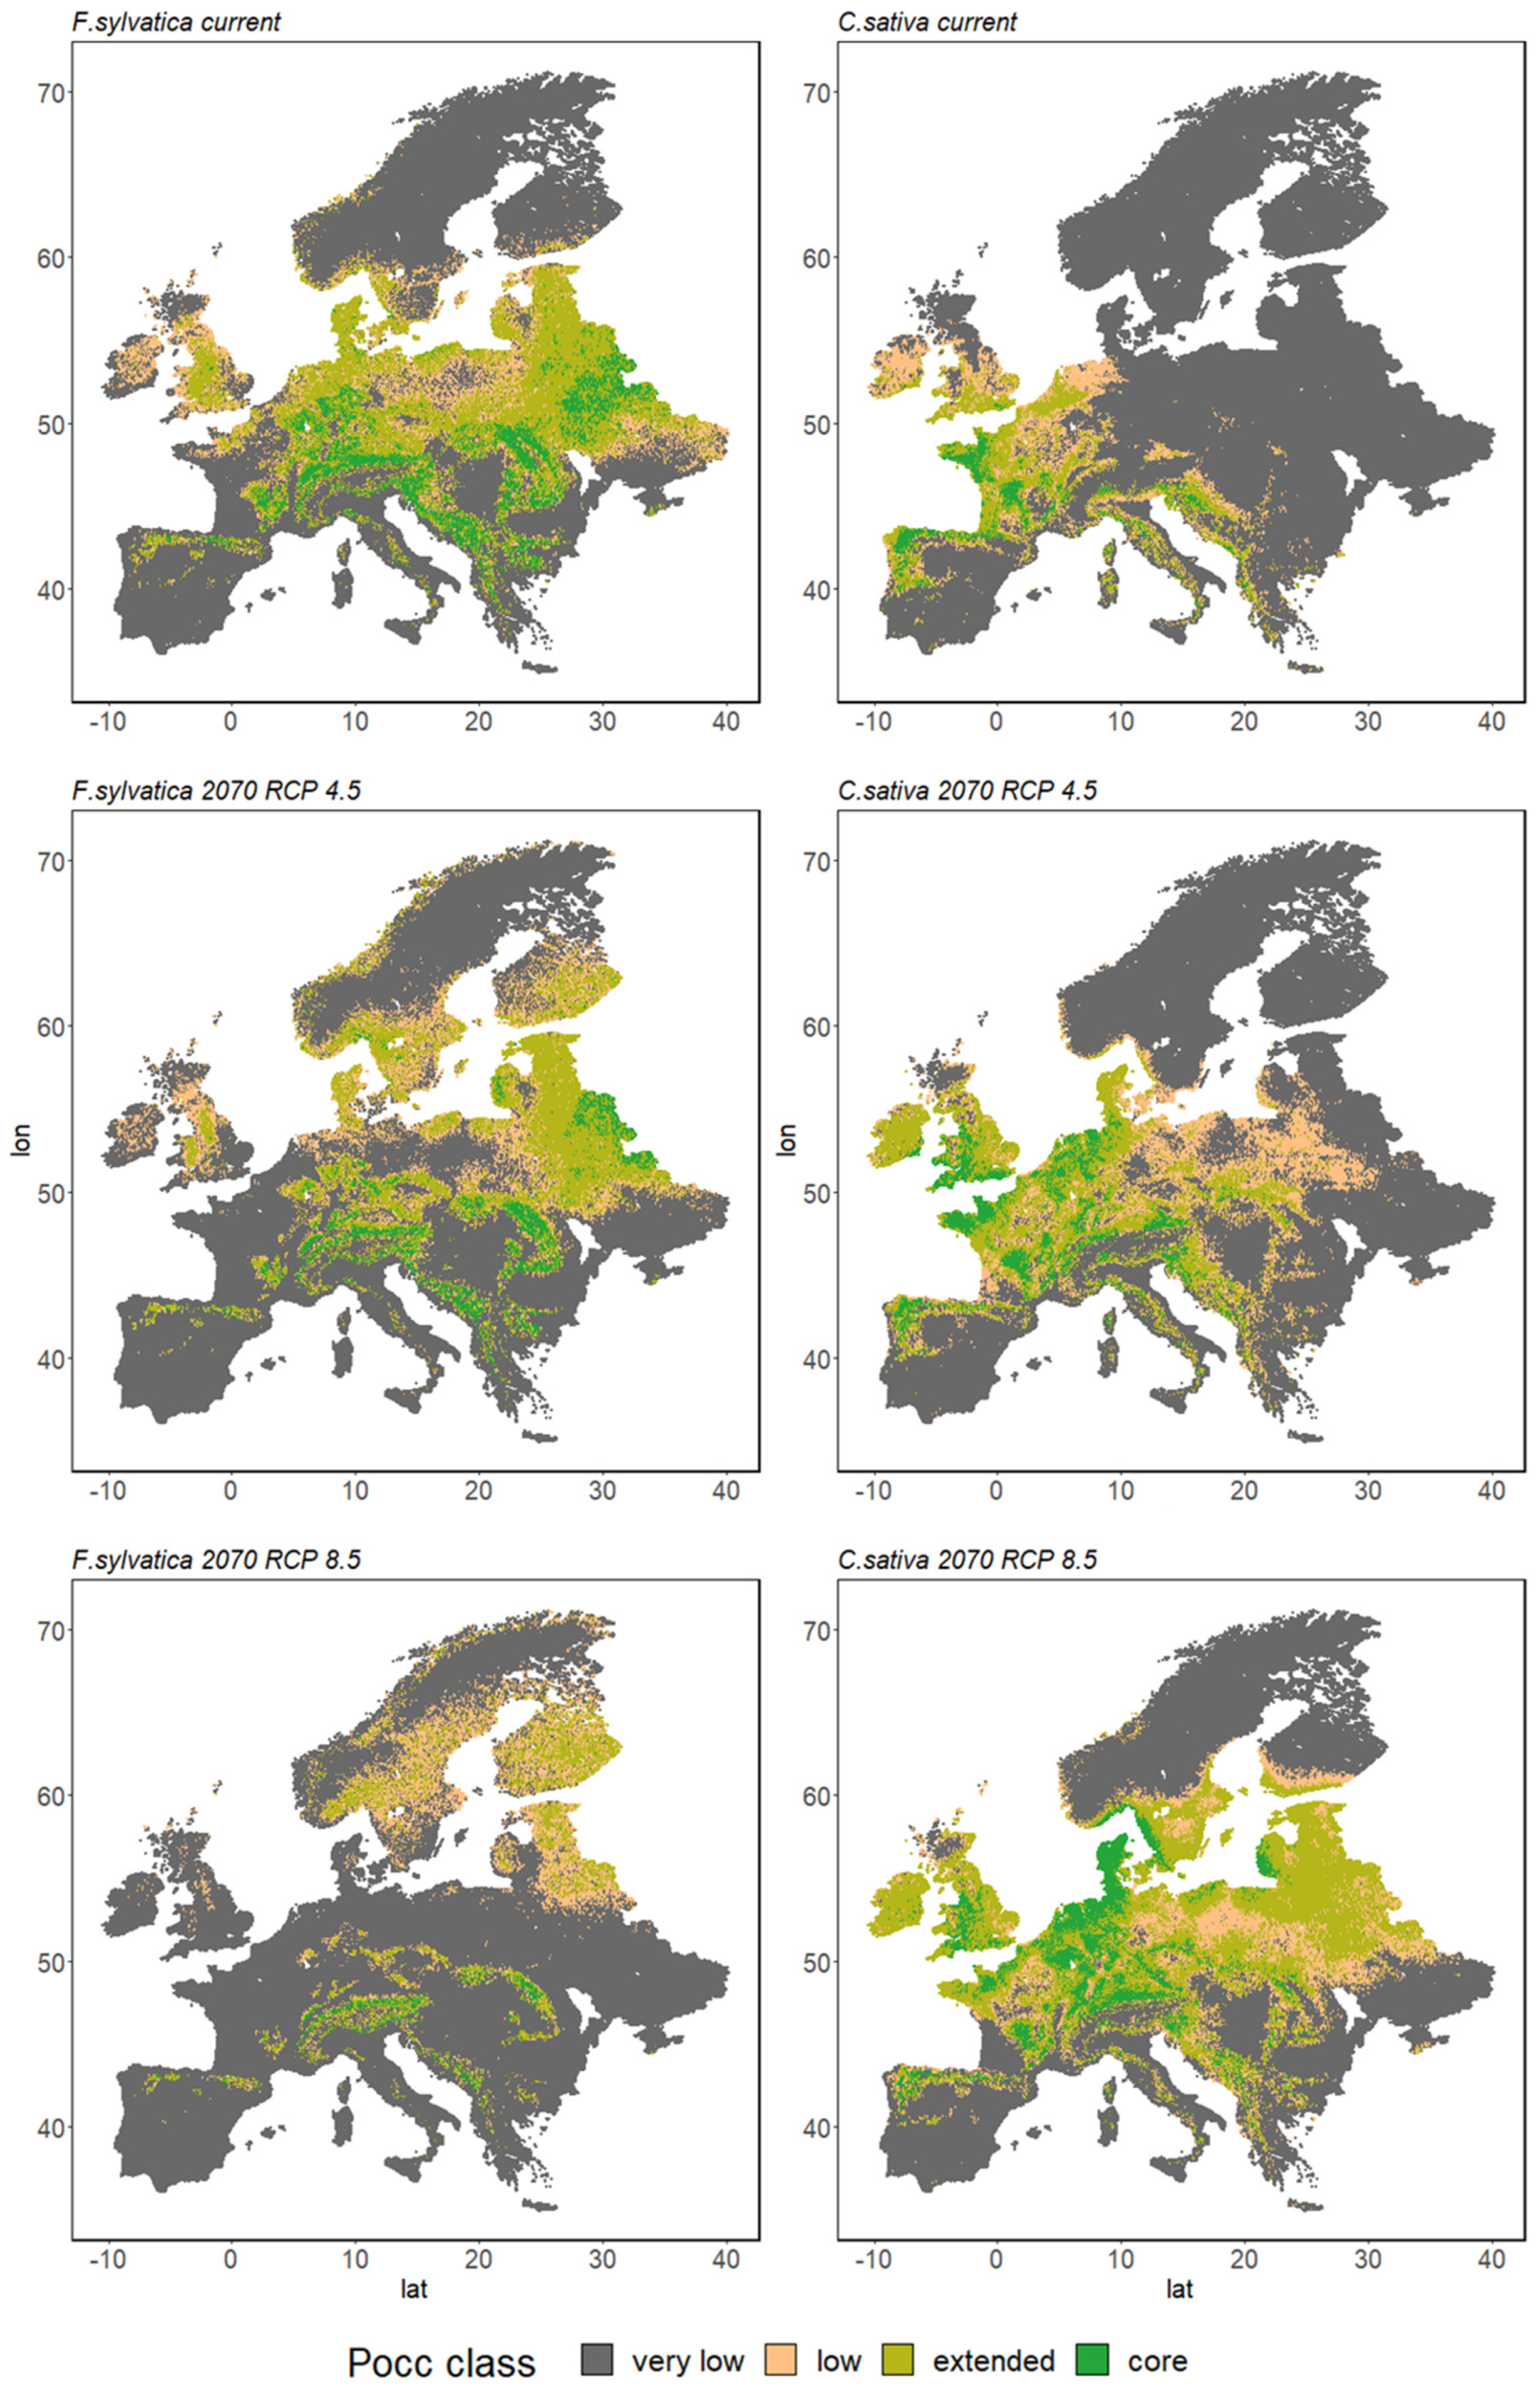
3.2.2. Species Range Shifts

Climate change effects are projected to cause stark shifts in Pocc ranges across modelled species, predominately directed to the north east. With regard to climate change, the magnitude of change accelerates under high emission scenario RCP 8.5. Despite the range size of Q. petraea and C. betulus being projected to be relatively stable under climate change, showing only mild contractions under RCP 8.5 by 2070, they too are projected to undergo a profound range shift with just 18% and 36% of their current range remaining stable in the Pocc class. Among the major tree species, P. sylvestris retains the most stable distribution potential within its current range, with 58% and 29% remaining stable under RCP 4.5 and RCP 8.5, respectively, in 2070. Corresponding to its range decline under high emission scenarios, A. alba maintains a steady Pocc class in just 2% of its current range in 2070 under RCP 8.5. However, for F. sylvatica and P. abies, a small fraction of their current range remains stable in Pocc class in that time slice under RCP 8.5 (8% and 11%, respectively).
Despite Pocc class changes in more than 50% of their current range under RCP 8.5, S. torminalis (45%) and U. laevis (43%) retain the most stable ranges among the species studied. While C. betulus and C. sativa are projected to maintain a stable Pocc class within 36% and 33% of their current distribution in 2070 under RCP 8.5, respectively, among minor alternative tree species, B. pendula and A. pseudoplatanus show the most drastic decline within their current distribution with 12% and 9% remaining stable, respectively.

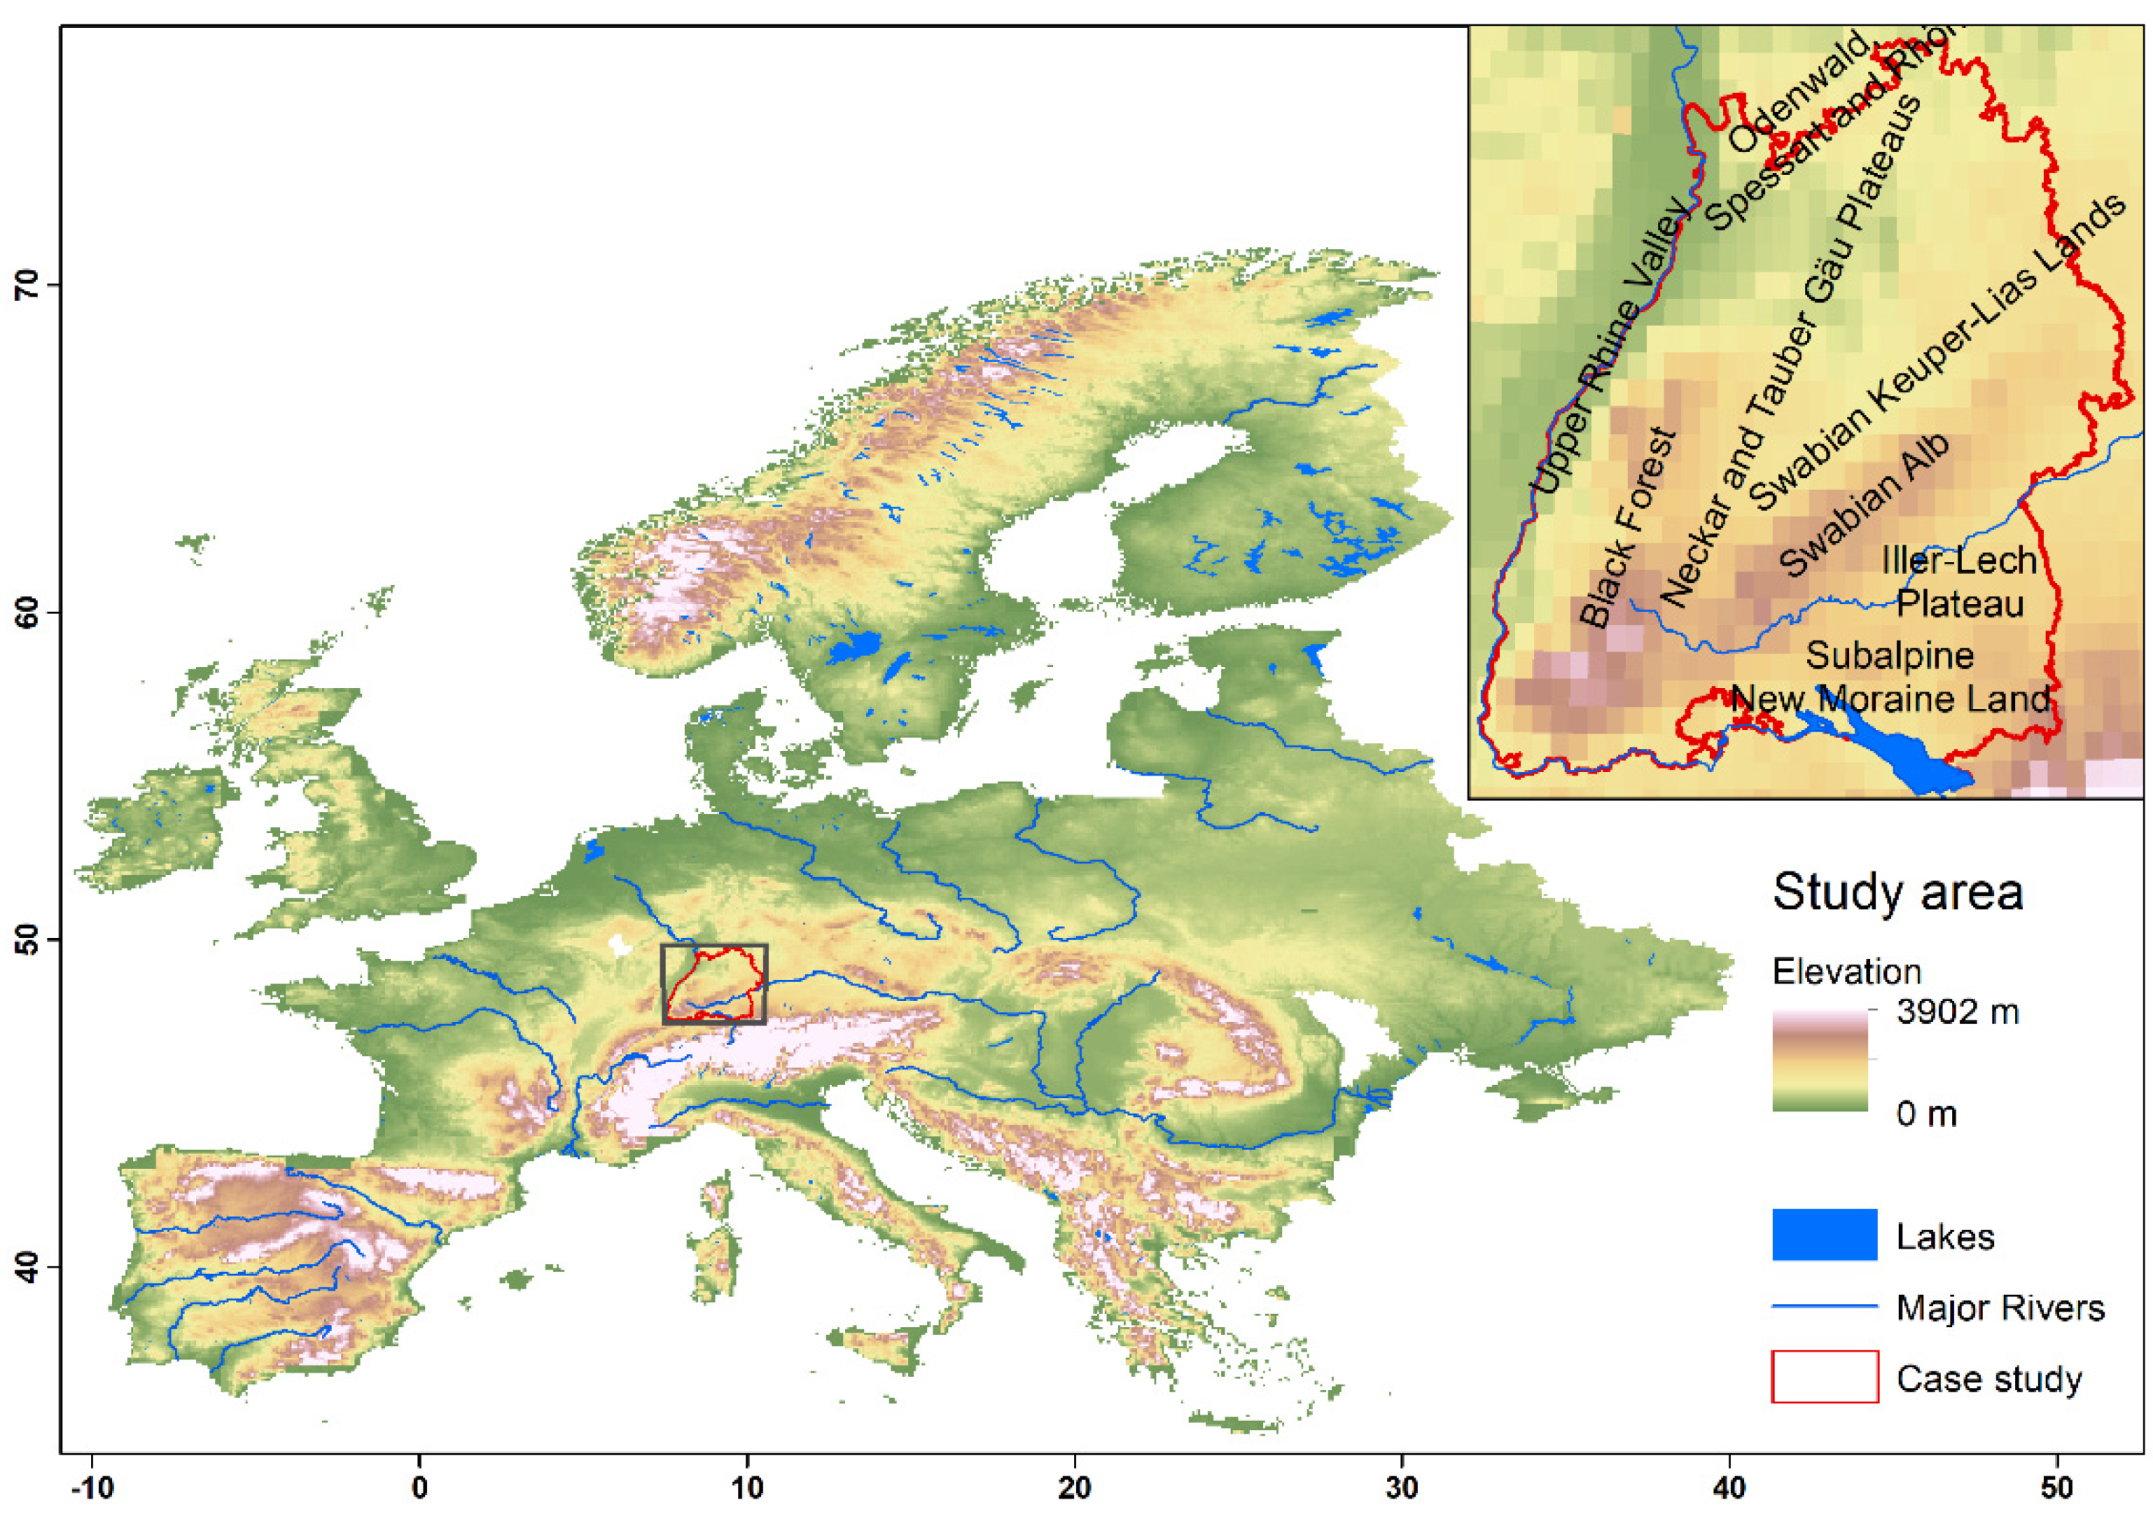
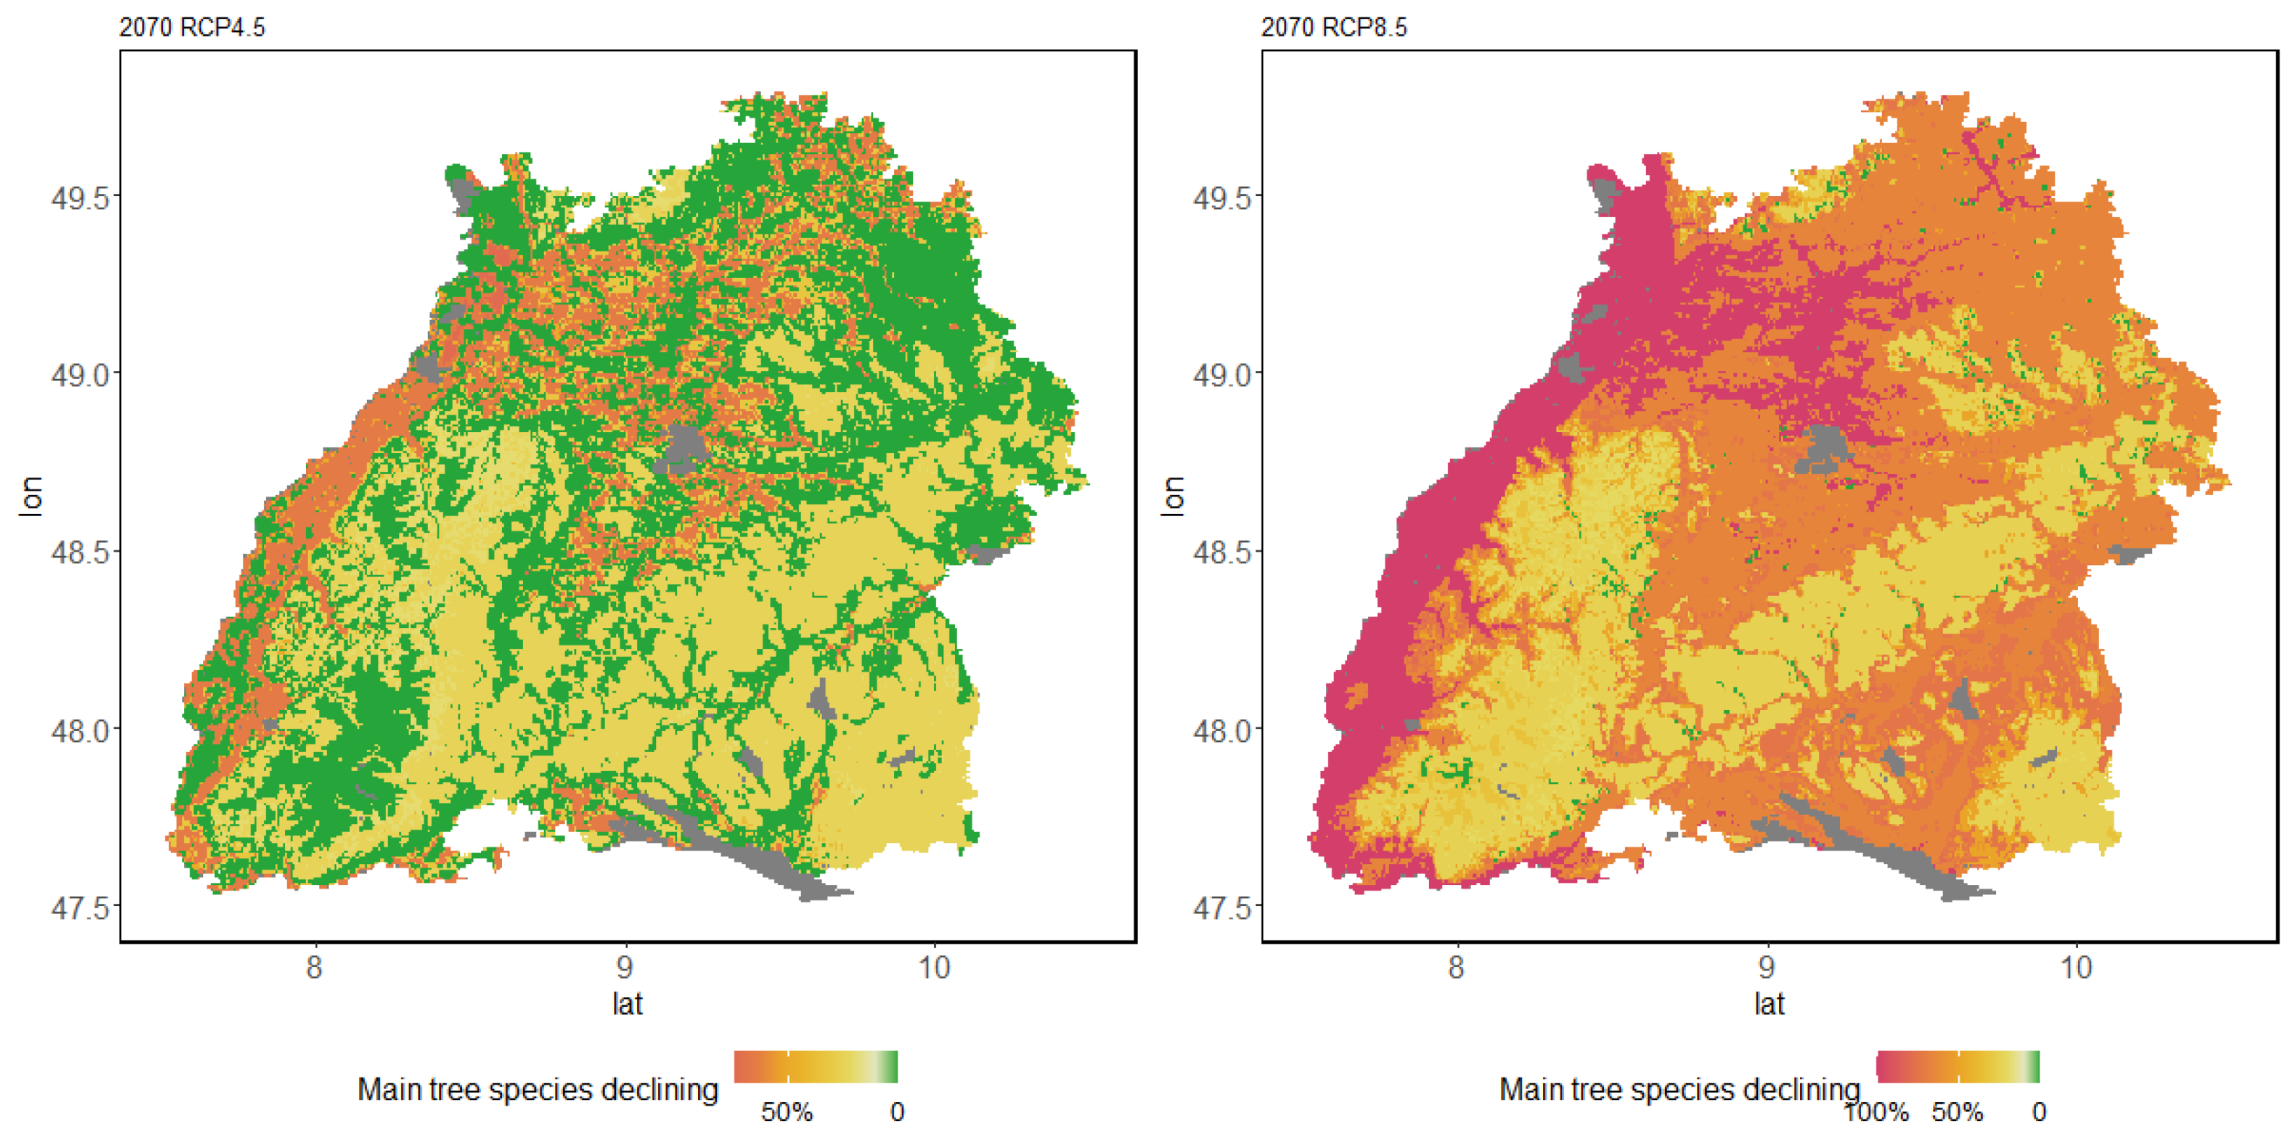
3.3. Range Dynamics in the Case Study of Baden-Wuerttemberg

3.3.1. Major Tree Species Decline

As for the European tree species range dynamics, the RCP scenarios have a strong influence on the probability of occurrence among tree species in Baden-Württemberg. Under the mid-emission scenario (RCP 4.5), decline in major tree species distribution potential is moderate, with 54% of the area losing at least 25% of their currently major tree species with a high Pocc and 15.3% of the area losing 50% or more of their major tree species currently holding a high occurrence potential in 2070 (Figure 6). Most affected from declining major tree species distribution are the Rhine valley and the lower northern Gäu plateaus, widely losing 50% or more of major tree species. Stable major tree species distribution potential occurs in large areas of the Hohenlohe plains and at high altitudes in the black forest.
In contrast, the high emission scenario causes a stark decline in local distribution potential of European major tree species, with 97% and 69% of the area losing more than 25% and 50% respectively. In 17% of the case study area, all major tree species modelled lose their distribution potential. This is especially the case in the Rhine valley and the lower northern Gäu plateaus. The midlands are projected to lose the majority of major tree species distribution potential while the uplands such as the Black Forest (to the West of the case study) and the Swabian Alp (stretching from the Southwest to the East) show the smallest decrease in major tree species occurrence potential. Only at the highest altitudes of the southern Black Forest, which allows for P. abies to persist, does the stable major tree species Pocc remain.

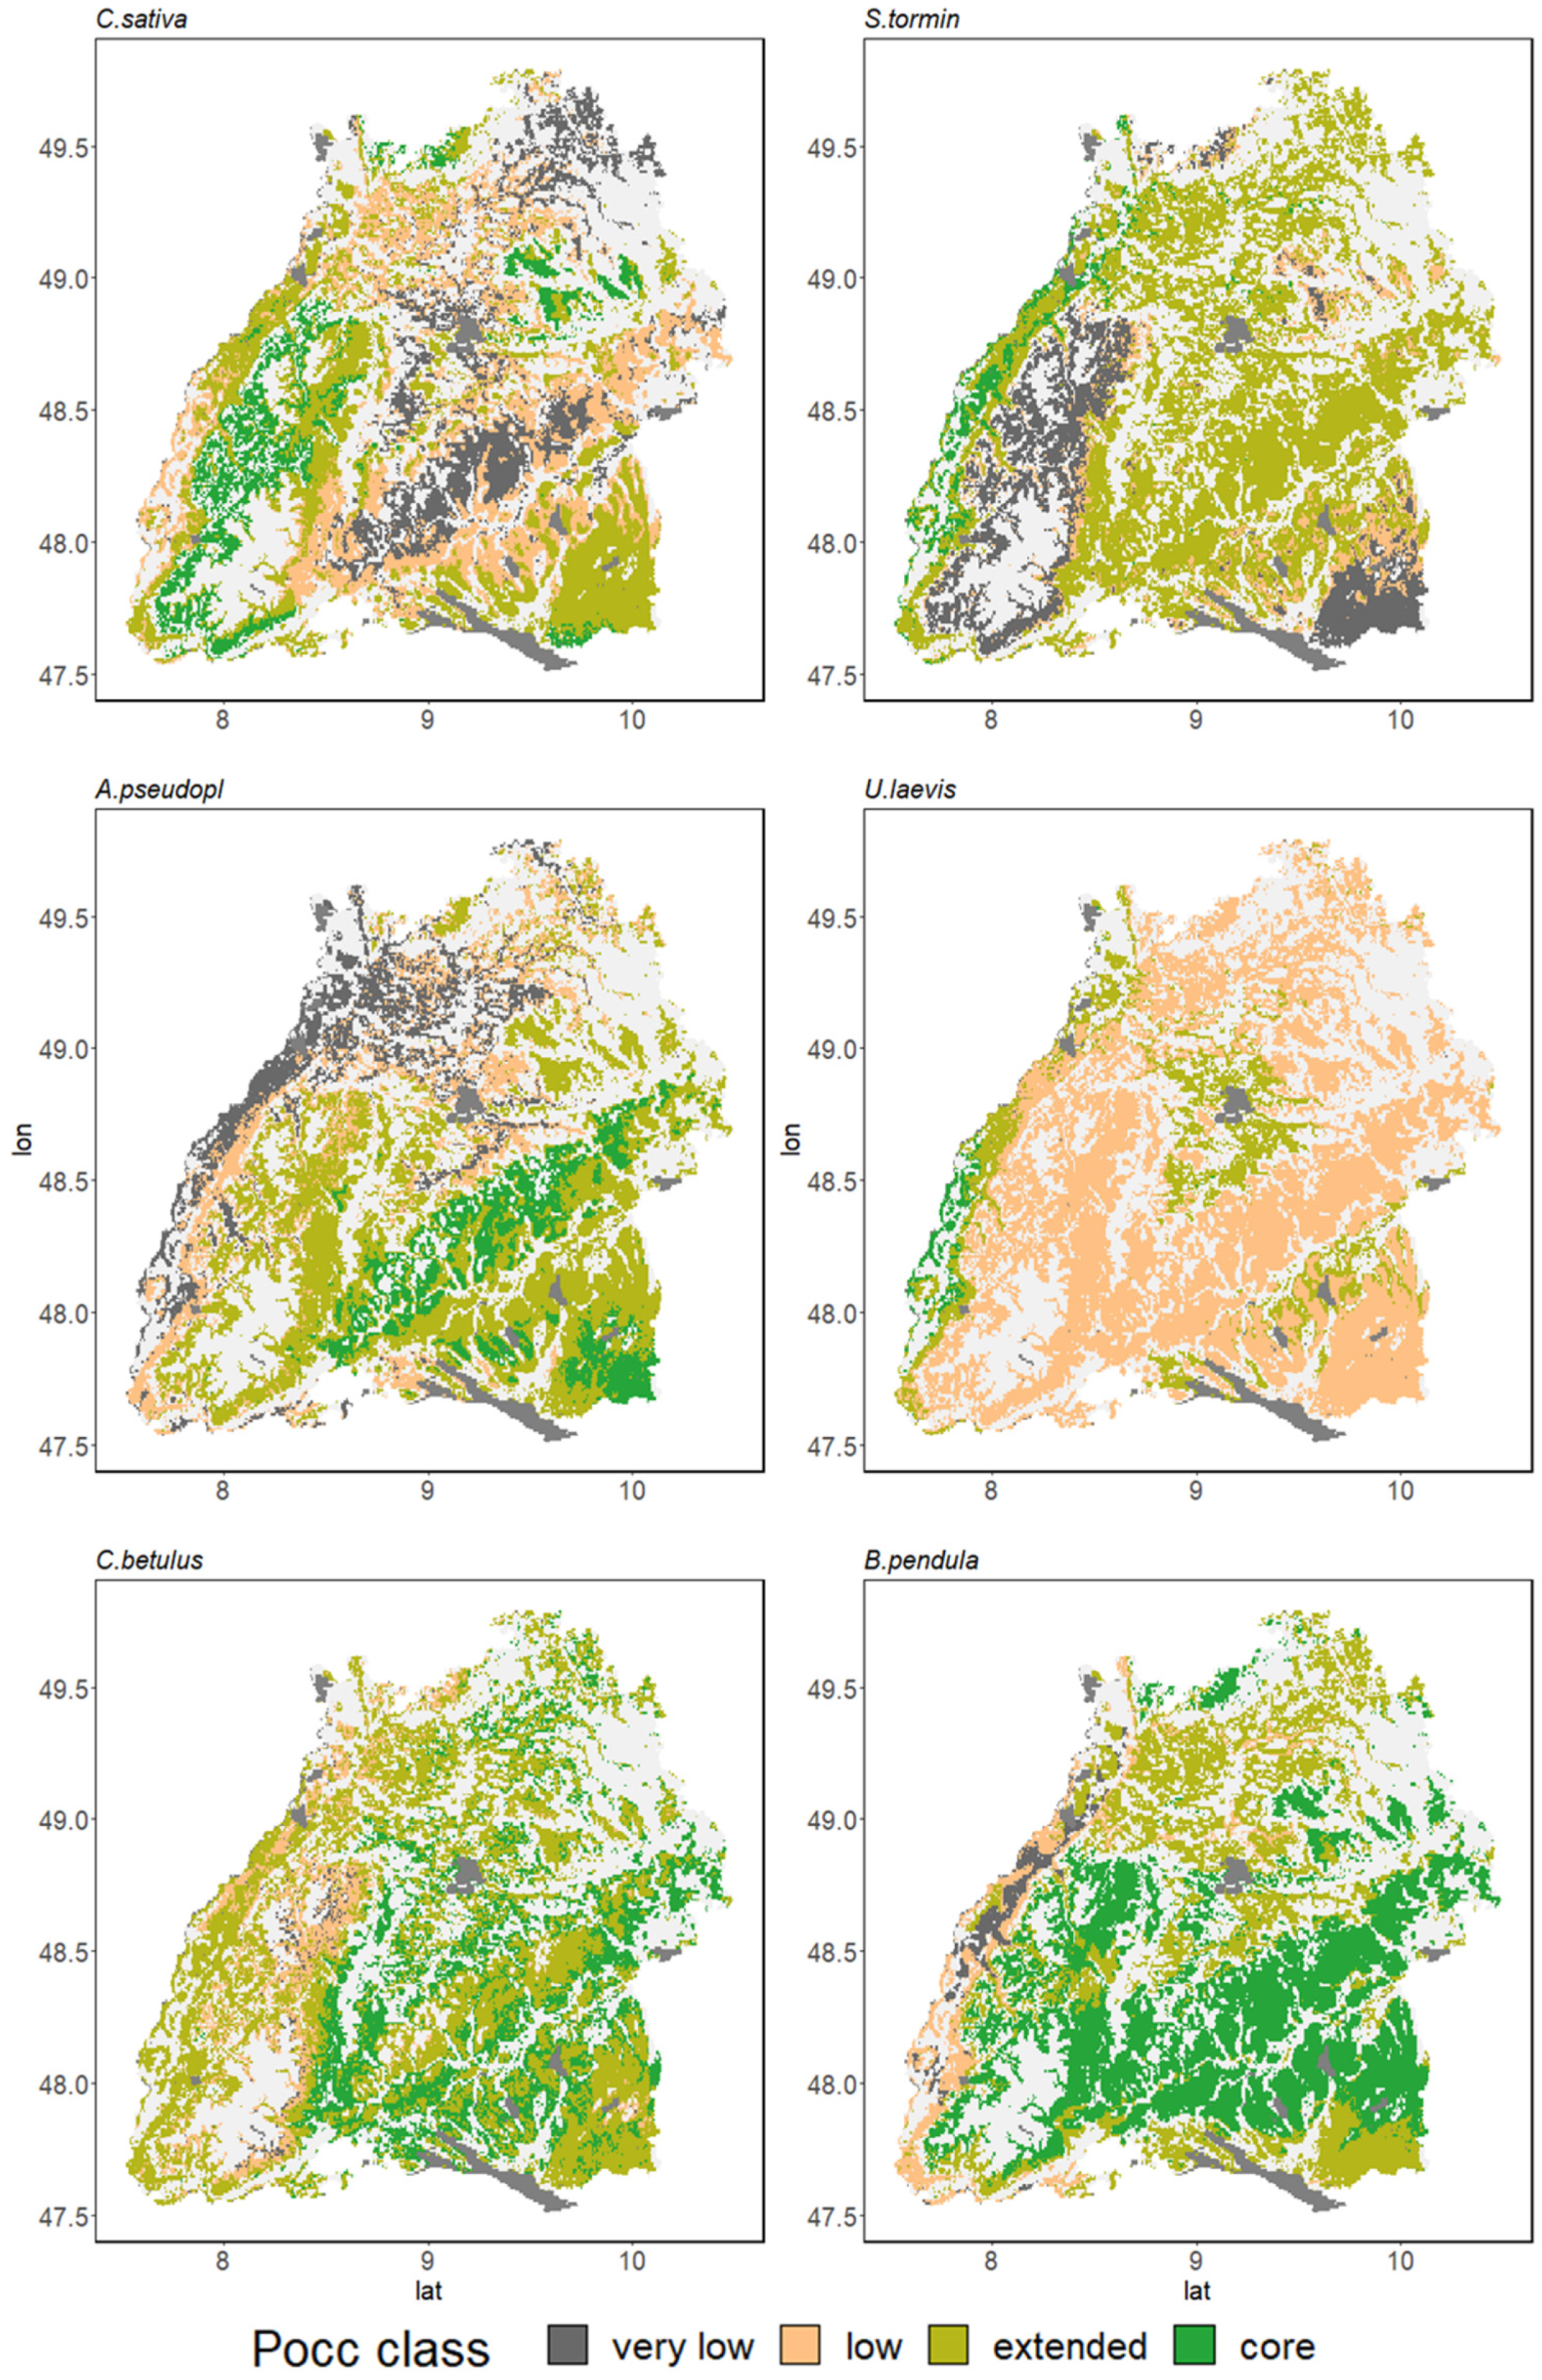
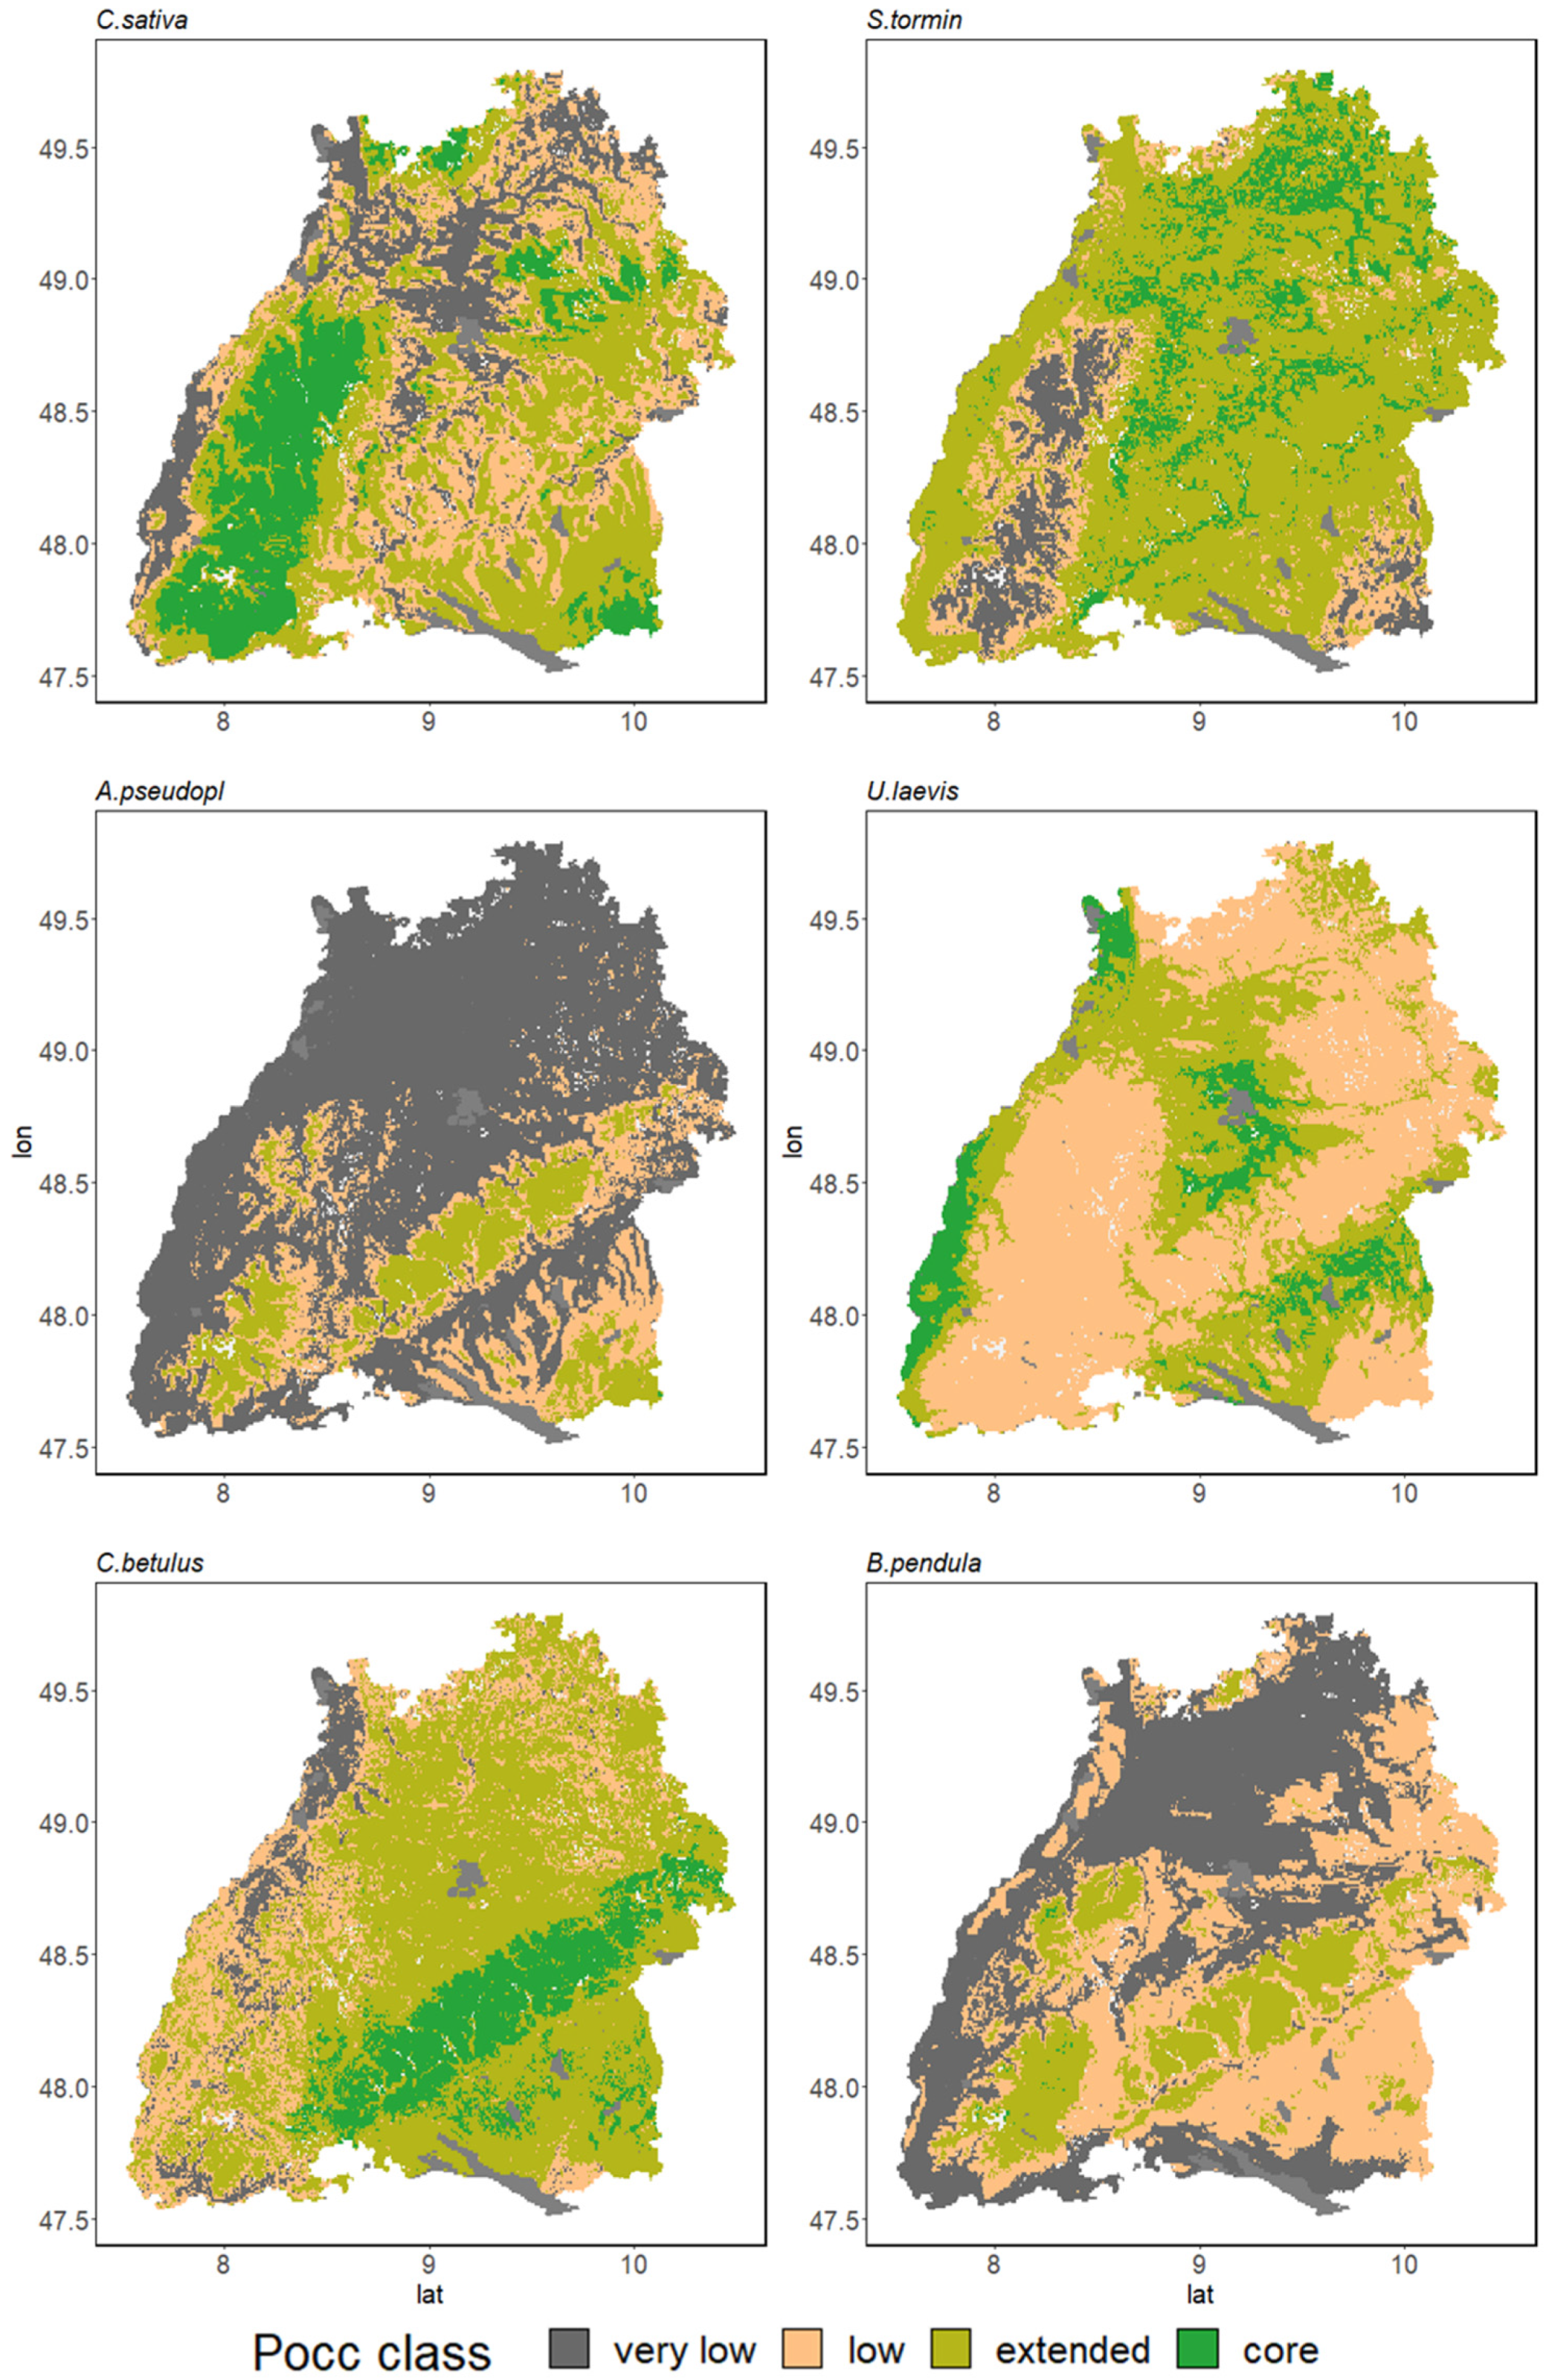
3.3.2. Conversion Potential of Alternative European Natives

Under the mid emission scenario, on average 64% of the area where major tree species lose their occurrence potential holds occurrence potential among the alternative species assessed. B. pendula and C. betulus are the species with the highest distribution potential in areas of Pocc decline among major tree species in Baden-Württemberg (Figure 7). B. pendula features extended Pocc in 89% of that area with its core Pocc located in the high and midlands such as the Black Forest, the Swabian Alp and the alpine foothills, while the Rhine valley is projected to largely feature a low occurrence potential. C. betulus is projected to feature core and extended Pocc in 88% of the area where major tree species decline. While its core occurrence potential lies in the midlands to the eastern Black Forest and surrounding the Swabian Alp, the higher altitudes of the Black Forest remain of low Pocc. Moreover, with an extended Pocc of 70% and 64%, respectively, S. torminalis and A. pseudoplatanus feature a high distribution potential area where major tree species decline, occupying contrasting centers, however. While the core Pocc of S. torminalis is located in the Rhine valley with extended Pocc in the midlands and the Swabian Alps, uplands such as the Black Forest, the Odenwald and the Alpine Foreland feature very low Pocc. In contrast the core Pocc of A. pseudoplatanus is located in the Alpine Foreland and the Swabian Alp, while with lower elevation the Rhine valley and the Kraichgau show very low Pocc. C. sativa and U. laevis show more regional patterns of potential distribution. C. sativa features an extended Pocc throughout 50% of that area, with a very high prevalence of core Pocc in higher altitudes of the Black Forest, the Odenwald and the Swabian-Franconian Forest but also featuring extended distribution potential in the Alpine Foreland. The distribution potential of U. laevis is highly localized. With an extended Pocc of 19% of the area, its core Pocc is limited to parts of the Rhine valley; the Neckar Basin features extended Pocc.
Under the high emissions scenario, the area of mean extended Pocc among the studied minor alternative tree species where the major tree species forfeit their distribution potential is lower compared to the mid-emission scenario (46%). Strongest declines in extended Pocc are projected for B. pendula and A. pseudoplatanus with 16% and 13% remaining, respectively (Figure 8). Both species lose nearly all their core Pocc within the study area, only remaining in the higher parts of the Black Forest, the Swabian Alps as well as in parts of the Alpine Foreland. S. torminalis and C. betulus are the alternative tree species with the highest distribution potential throughout all areas in Baden-Württemberg where major tree species decline. While the extended Pocc of S. torminalis increases to 80% of the area in question, the core Pocc lies within the northern and central midlands of the case study area. The higher elevations of the Black Forest and the Alpine Foreland remain largely unoccupied. Conversely, the extended Pocc of C. betulus decreases compared to the mid-emission scenario. 72% of that area features an extended Pocc for C. betulus, with the core Pocc stretching along the Swabian Alp and the extended Pocc primarily located in eastern and central Baden-Württemberg. Northern parts of the lower Rhine valley, the upper Rhine valley and elevated parts of the Black Forest are projected to show a low Pocc. Under high emission scenarios the share of area with extended Pocc for C. sativa further increases to 56% where the major tree species decline. Moreover, extending throughout the uplands of the Black Forest, the Odenwald, Swabian-Franconian Forest and the Alpine Foreland, C. sativa features the highest share of core Pocc among the studied alternative tree species. C. sativa remains absent in the lowlands of the Kraichgau, the Neckar Basin and southern parts of the lower Rhine valley. With 42% the extended Pocc of U. laevis increases the strongest under the high emission scenario compared to the mid-emission scenario among the minor alternative tree species studied. Under RCP 8.5, the core Pocc of U. laevis is located along the Rhine valley, at the Neckar basin and along the Danube plains while the extended Pocc stretches across all lowland areas of Baden-Württemberg.

4. Discussion

4.1. Growing Urgency: Major Tree Species Decline across Europe

Corresponding with previous studies [13,55] our models project a marked northeasterly range shift. However, for most assessed tree species, range expansions at the leading edge do not match the rate of contraction at the trailing edge within their current range, causing stark range contractions. This is true especially under high emission scenarios. Among the major tree species, only Q. petraea was projected to maintain a relatively stable niche size across all RCPs, featuring the only range size increase among major tree species under RCP 4.5. Contrasting this with the findings of Dyderski et al. [40], who identified Q. petraea as a “winner” of climate change, we find a mild range size increase only under mid-emission scenarios, while under the high emission scenario contractions are pronounced despite being the lowest among the major tree species studied. This corresponds with Walentowski et al. [15], who found that despite climate change the Franconian plateau in central Europe remains within the climatic envelope of Q. petraea. After Q. petraea, P. sylvestris was least affected by climate change scenarios, while also maintaining the most stable range of high Pocc. The high dynamic in projected Pocc among major tree species under high emission scenarios highlights the stark effect of unmitigated climate change on their potential distribution. A. alba, P. abies and F. sylvatica are all projected to lose more than 2/3 of their current range size by 2070 under RCP 8.5. An especially strong contrast between climate scenarios is shown by the range size dynamic of A. alba, with only a very small fraction of its current range size left by 2070 under RCP 8.5. The response of A. alba to climate change is debated, with conflicting predictions spanning from range contractions to increased range size [56]. While our findings support the hypotheses of a stark contraction in range size under the high emission scenario, Tinner et al. [57] suggest that the current distribution of A. alba is strongly confined by anthropogenic influence highlighting historical evidence of thermophilus A. alba populations and a limited understanding of the species’ ecology. While showing very strong declines in range size under the high emission scenario, P. abies and F. sylvativa also feature the highest projected range contractions under the mid-emission scenario among the studied major tree species. With the projected range contractions supported by prior studies [13,55] and coupled with the prevalence of P. abies and F. sylvatica throughout European forest ecosystems, climate change induced impacts are very likely to have strong implications on the composition of European forest ecosystems. The shifts in distribution potential away from the current major tree species towards Mediterranean oak dominated biomes has been linked with declining economic returns and a reduced carbon sequestration potential [23,58].
In addition to stark contractions in the distribution potential of European major tree species, the high climate change-induced range shift dynamic adds to the need for local adaptation measures. Already under mid-emission scenarios, all major tree species but P. sylvestris retain less than half of their Pocc classes within their current range by 2070. By far most of their occurrence potential is lost within their current ranges by the end of the century under high emission scenarios. Moreover, migration barriers, fragmented forests, and persistence of tree species under climate change hamper their range shifts. As observed latitudinal range shifts have been found to considerably lag climatic changes, concerns over the ability of tree species to keep up pace with a changing climate are growing [59,60]. Divergence in occurrence between juvenile and adult trees is not always caused by climate change, however, but commonly occurs due to ontogenetic niche shifts, complicating assertions on the rate of changing distribution patterns [61]. In response, assisted migration has been proposed to speed up tree migration by introducing them to a suitable location outside of their current range [62]. Moreover, recognition of trees as holobionts is on the rise, fueled by recent advances in the field highlighting the importance of their microbiome for interactions with the environment [63,64]. Thus, an improved knowledge of interrelations of tree species with their symbiome and pathobiome in the context of a changing environment holds the potential to further refine our understanding of forest ecosystems responses to climate change [65,66,67,68].
Accompanying northeasterly range shifts, the central European uplands are projected to be refuges maintaining occurrence potential for the studied European major tree species under the mid emission scenario. However, P. abies and A. alba in particular largely forfeit their occurrence probability in the central European uplands under the high emission scenario. Moreover, recent investigations on demographic performance of trees in Europe link the trailing warm and dry edge with lower survival rates and shorter lifespans compared to the median climate within the range among European tree species [69]. Furthermore, warming in summer was found to have a detrimental effect on the survival of F. sylvatica, A. alba and Quercus spp. while warmer winters lowered the survival of P. abies in 95-Year observations across Baden-Württemberg [70]. This highlights that even under persistent occurrence, demographic performance is likely to be adversely altered at their trailing edge, calling for adaptation measures at those locations. This reduced performance is further exacerbated by an increasing intensity and frequency of extreme events [71], which P. abies is especially prone to [72,73]. The strong decline of major tree species throughout the case study under the high emission scenario RCP 8.5 is supported by findings of Mette et al. [74] indicating the lack of P. abies and F. sylvatica in climate analogue twin regions of the Franconian Keuper hill-lands in the central European upland region under RCP 8.5.

4.2. Adapting to Climate Change with Minor Natives

We show that most of the studied minor European natives maintain or expand their distribution potential under climate change. However, depending on the emission scenario, accompanied range shifts strongly alter their local occurrence potential. Across Europe, C. sativa, S. torminalis and U. laevis showed a consistent distribution potential throughout the course of the century under both emission scenarios, making them promising prospects for adaptation of European forests to climate change. Similarly, C. betulus would maintain its distribution potential across scenarios. This potential is in accordance with the results from a variety of other studies [13,74]. In contrast, the distribution of B. pendula and A. pseudoplatanus is strongly hampered by climate change, limiting their potential as alternative tree species. However, local adaptation options are more differentiated, as highlighted by the variable distribution potential in areas of major tree species decline within the case study. Under mid-emission scenarios the selected native alternative tree species hold the potential to play an important role for adapting European forests to climate change.
In the case study we showed that this set of tree species is suited to persist in diverse and variable ecoregions and is suited for further consideration in local adaptation measures and field trials. Furthermore, this case study highlights the implications of an uncertain societal response level to curb and mitigate greenhouse gas emissions. Under mid emission scenarios, B. pendula has a high potential as an alternative tree species with its core Pocc encompassing most of the area where major tree species decline. Conversely, under the high emission scenario, B. pendula loses nearly all of its core Pocc within that area with only parts of the uplands remaining. A similar dynamic can be observed for A. pseudoplatanus, whose germination and productivity were found to be susceptible to drought [75,76]. Moreover, the drought susceptibility of this isohydric species is underlined in studies of its leaf gas exchange [77].
The remaining four alternative European tree species are viable alternatives in the variable ecoregions of the Baden-Württemberg under high emission scenarios. Among the studied alternative tree species, C. sativa is projected to be most promising in the uplands, where it shows the highest occurrence potential among studied species throughout the upland regions across scenarios. Under the high emission scenario, its distribution potential expands further to the southwestern midlands. C. sativa provides diverse options for utilization and management growing in high forests, coppice stands and orchards. However, high susceptibility to chestnut blight hampers the potential of C. sativa without sufficient breeding efforts [78]. In contrast to C. sativa, S. torminalis shows a reversed pattern with a high potential as an alternative under climate change throughout Baden-Württemberg apart from the uplands. If supported by silvicultural management, S. torminalis can produce exceptionally valuable timber [18]. While our model projections identify C. betulus to have a high potential as an alternative tree species in the face of climate change under both emission scenarios, its core Pocc shifts from the western and central midlands of Baden-Württemberg to the Swabian Alp. Nonetheless an extended Pocc throughout the entire central and western part of the area of the case study suggest a high potential for C. betulus to contribute to climate change adapted forests regardless of the climate scenario. In accordance, the species was found to have high resistance to drought among five European tree species in a study of its leaf gas exchange [77]. While historically of major importance as a coppice tree, C. betulus was also found to feature an exceptionally high saproxylic beetle diversity across three German ecoregions [79]. With its broad climatic amplitude, the very minor U. laevis occurs across Europe in scattered populations stretching from southern Finland to Southern Spain [80,81]. However, U. laevis occurrence is mostly restricted to riparian forests and plains with sufficient ground water access, while showing an exceptionally high tolerance to flooding and waterlogging [80,82]. Thus, its growing distribution potential in the thermophile lowlands and Rhine valley throughout Baden-Württemberg make U. laevis a promising prospect in the areas with the highest occurrence decline among major tree species. Nonetheless, it needs to be stressed that the species-specific site requirements tie its prospect to riparian forests and sites with sufficient ground water access.
Changes in tree species composition and the loss of key species as a result of harsh drying and warming has been projected to cause stark alterations in the productivity of forest ecosystems [22] and to be detrimental to their economic value [23]. However, tree species diversity was found to positively influence forest productivity in Europe [83,84], especially under climate change [22], and to fostered stability of ecosystem service provision in general [1,85]. Thus, next to serving as an alternative candidate tree species, minor native tree species can play a vital role in the diversification of forest ecosystems in response to climate change. Tree species diversity has been linked with resilience of forest ecosystems and the stability of ecosystem services they can provide [1,12,22,85]. Increasing response diversity is a major adaptation pathway in the face of the high level of uncertainty linked with the magnitude and impacts of climate change [12]. Moreover, diversification of tree species can foster the resistance of major tree species to climatic extremes [86] as well as a warmer and drier climate [87]. This highlights that minor European native trees hold a largely untapped potential to play a more prominent role for multiple climate change adaptation strategies.
Being inert systems with slow transformational processes under current management regimes, the adaptation of forest ecosystems to shifting distribution potential of European tree species could be fueled by adapted management practice [88]. Integrating stakeholders through participatory approaches is key for leverage of transformational change [89]. While the promotion of minor European natives comes with a lower risk potential compared to non-native tree species, where special care is paramount to avoid unforeseen ecological consequences [90], changes in tree species compositions with European natives will have implications for the shape of forest ecosystems nonetheless, also requiring careful observation [8]. Similarly, the socio-economic implications of shifting tree species composition need to be anticipated and addressed. While most of the assessed alternative tree species provide valuable ecosystem services and economic utility, their use and management differ from coniferous major tree species with subsequent effects on the shape of associated forest ecosystems. A recent assessment of solutions to sustain the supply of forest ecosystem services identified a shift in management paradigms towards pluralistic ecosystem valuation as the primary strategic pathway, while promotion of climate smart forestry and resilience was ranked highest among assessed solutions [91]. Shifting away from a primarily production-focused forest management could foster the promotion of now minor native tree species and subsequently climate-smart forest ecosystems.
This study provides indications on the potential of minor European natives for adapting forests to climate change by quantifying their bioclimatic and edaphic distribution dynamics, setting a baseline for field trials and further studies informing a sustainable transformation of forest ecosystems in the face of climate change. However, while SDM is a useful tool to identify species occurrences, they are not suited to directly depict dynamic biotic interactions [30,92] or infer demographic and physiological processes such as abundance and fitness dynamics [93], which makes other model types, such as dynamic vegetation models or other empirical models describing one aspect or criterion of occurrence of a species at a time, very informative. Deducing management suggestions should be based on a multitude of criteria [94], while suggestions purely based on one model type bears the danger of overemphasizing certain criteria. Thus, our results should be perceived as partial indications of suitability rather than suitability itself. Further research on promising, locally adapted genetic variants and their potential under climate change could prove valuable for mediating the impact of climate change on tree species distribution in Europe [95].

5. Conclusions

In the face of stark declines in distribution potential and range shifts among European major tree species, our models highlight the urgency of transforming forest ecosystems under climate change. Range shifts and contractions are highly accelerated under the high emission scenario. Nonetheless, and across emission scenarios, C. sativa, U. laevis, S. tominalis and C. betulus expand or maintain their distribution potential where major tree species decline, thus holding the potential to substantially contribute to sustainably, adapting European forests to climate change. Promoting climate-smart forest ecosystems with now minor native species would be fostered by a shift in forest management paradigms away from a primarily production focus towards a more pluralistic ecosystem valuation.

Author Contributions

Conceptualization, A.T.A. and O.K.; methodology, O.K.; formal analysis, O.K.; investigation, O.K.; data curation, O.K., A.L.d.A. and H.H.; writing—original draft preparation, O.K.; writing—review and editing, A.T.A., H.H. and A.L.d.A.; visualization, O.K.; supervision, A.T.A.; project administration, A.T.A.; funding acquisition, A.T.A. All authors have read and agreed to the published version of the manuscript.

Funding

This research was funded by the state Ministry of Food, Rural Affairs and Consumer Protection of Baden-Wuerttemberg, through the grant “Notfallplan für den Wald in Baden-Württemberg” from the state budget 2020–2021.

Institutional Review Board Statement

Not applicable.

Data Availability Statement

The data presented in this study are available on request from the corresponding author.

Conflicts of Interest

The authors declare that they have no conflict of interest.

Appendix A

Figure A1. Summary of ensemble modelling procedures showing input data and modelling steps.
Sustainability 14 05213 g0a1
Figure A2. Probability of occurrence (Pocc) vs. the coefficient of variation (CV) for S. torminalis, C. betulus, Q. petraea, U. laevis, A. pseudolpatanoides, P. abies, A. alba, P. sylvestris and B. pendula ensemble models.
Sustainability 14 05213 g0a2
Table A1. Predicted share of Pocc classes throughout Europe under current climate and RCP 4.5 projections for C. sativa (Cs), S. torminalis (St), C. betulus (Cb), Q. petraea (Qp), U. laevis (Ul), A. pseudoplatanus (Ap), P. abies (Pa), F. sylvatica (Fs), A. alba (Aa), P. sylvestris (Ps) and B. pendula (Bp).
Sp.CurrentRCP 4.5
20502070
coreext.lowv.lowcoreext.lowv.lowcoreext.lowv.low
Aa5%20%11%65%4%23%7%66%3%16%8%72%
Ap7%31%10%52%2%25%12%61%1%21%14%64%
Bp8%27%14%51%12%18%14%56%7%18%16%59%
Cb11%25%14%50%8%30%16%46%8%30%17%45%
Cs3%10%9%78%5%17%12%66%6%18%15%62%
Fs9%26%12%53%9%19%11%61%5%19%11%64%
Pa13%29%8%50%8%19%7%67%9%15%7%69%
Ps14%26%22%39%11%19%20%50%11%20%17%52%
Qp9%27%12%51%17%27%11%46%11%29%12%48%
St6%31%7%56%5%36%8%51%5%36%7%51%
Ul7%21%39%33%15%20%34%31%19%18%36%27%
Table A2. Predicted share of Pocc classes throughout Europe under current climate and RCP 8.5 projections for C. sativa (Cs), S. torminalis (St), C. betulus (Cb), Q. petraea (Qp), U. laevis (Ul), A. pseudoplatanus (Ap), P. abies (Pa), F. sylvatica (Fs), A. alba (Aa), P. sylvestris (Ps) and B. pendula (Bp).
Sp.CurrentRCP 8.5
20502070
coreext.lowv.lowcoreext.lowv.lowcoreext.lowv.low
Aa5%20%11%65%2%12%7%79%0%1%1%97%
Ap7%31%10%52%1%10%14%75%0%7%12%80%
Bp8%27%14%51%6%14%16%63%1%12%13%74%
Cb11%25%14%50%8%31%18%43%7%29%21%43%
Cs3%10%9%78%7%20%15%58%9%30%13%49%
Fs9%26%12%53%4%16%11%69%1%7%9%82%
Pa13%29%8%50%8%12%6%74%2%10%4%85%
Ps14%26%22%39%10%17%17%56%6%16%18%61%
Qp9%27%12%51%9%30%13%48%3%26%14%57%
St6%31%7%56%5%36%8%51%11%33%9%48%
Ul7%21%39%33%20%18%36%26%21%14%33%32%
Figure A3. Classed occurrence probability of C. sativa. Today, in 2050 and in 2070 under RCP 4.5 and RCP 8.5.
Sustainability 14 05213 g0a3
Figure A4. Classed occurrence probability of C. betulus today, in 2050 and in 2070 under RCP 4.5 and RCP 8.5.
Sustainability 14 05213 g0a4
Figure A5. Classed occurrence probability of S. torminalis today, in 2050 and in 2070 under RCP 4.5 and RCP 8.5.
Sustainability 14 05213 g0a5
Figure A6. Classed occurrence probability of Q. petraea today, in 2050 and in 2070 under RCP 4.5 and RCP 8.5.
Sustainability 14 05213 g0a6
Figure A7. Classed occurrence probability of A. pseudoplatanus today, in 2050 and in 2070 under RCP 4.5 and RCP 8.5.
Sustainability 14 05213 g0a7
Figure A8. Classed occurrence probability of P. abies today, in 2050 and in 2070 under RCP 4.5 and RCP 8.5.
Sustainability 14 05213 g0a8
Figure A9. Classed occurrence probability of F. sylvatica today, in 2050 and in 2070 under RCP 4.5 and RCP 8.5.
Sustainability 14 05213 g0a9
Figure A10. Classed occurrence probability of A. alba today, in 2050 and in 2070 under RCP 4.5 and RCP 8.5.
Sustainability 14 05213 g0a10
Figure A11. Classed occurrence probability of P. sylvestris today, in 2050 and in 2070 under RCP 4.5 and RCP 8.5.
Sustainability 14 05213 g0a11
Figure A12. Classed occurrence probability of B. pendula today, in 2050 and in 2070 under RCP 4.5 and RCP 8.5.
Sustainability 14 05213 g0a12
Figure A13. Classed occurrence probability of U. laevis today, in 2050 and in 2070 under RCP 4.5 and RCP 8.5.
Sustainability 14 05213 g0a13
Figure A14. Probability of occurrence (Pocc) dynamics throughout the century among major (left) and alternative (right) tree species across Europe under RCP 4.5. Bars indicate the share of Pocc classes for each time slice while the alluvials represent the flow between classes over time.
Sustainability 14 05213 g0a14

References

  1. Ray, D.; Bathgate, S.; Moseley, D.; Taylor, P.; Nicoll, B.; Pizzirani, S.; Gardiner, B. Comparing the provision of ecosystem services in plantation forests under alternative climate change adaptation management options in Wales. Reg. Environ. Chang. 2014, 15, 1501–1513. [Google Scholar] [CrossRef] [Green Version]
  2. Schuldt, B.; Buras, A.; Arend, M.; Vitasse, Y.; Beierkuhnlein, C.; Damm, A.; Gharun, M.; Grams, T.E.E.; Hauck, M.; Hajek, P.; et al. A first assessment of the impact of the extreme 2018 summer drought on Central European forests. Basic Appl. Ecol. 2020, 45, 86–103. [Google Scholar] [CrossRef]
  3. La Porta, N.; Capretti, P.; Thomsen, I.M.; Kasanen, R.; Hietala, A.M.; Von Weissenberg, K. Forest pathogens with higher damage potential due to climate change in Europe. Can. J. Plant Pathol. 2008, 30, 177–195. [Google Scholar] [CrossRef]
  4. Beckage, B.; Gross, L.J.; Lacasse, K.; Carr, E.; Metcalf, S.S.; Winter, J.M.; Howe, P.D.; Fefferman, N.; Franck, T.; Zia, A.; et al. Linking models of human behaviour and climate alters projected climate change. Nat. Clim. Chang. 2018, 8, 79–84. [Google Scholar] [CrossRef]
  5. O’Neill, B.C.; Kriegler, E.; Ebi, K.L.; Kemp-Benedict, E.; Riahi, K.; Rothman, D.S.; van Ruijven, B.J.; van Vuuren, D.P.; Birkmann, J.; Kok, K.; et al. The roads ahead: Narratives for shared socioeconomic pathways describing world futures in the 21st century. Glob. Environ. Chang. 2017, 42, 169–180. [Google Scholar] [CrossRef] [Green Version]
  6. Shepherd, T.G. Atmospheric circulation as a source of uncertainty in climate change projections. Nat. Geosci. 2014, 7, 703–708. [Google Scholar] [CrossRef]
  7. Yousefpour, R.; Hanewinkel, M. Climate Change and Decision-Making Under Uncertainty. Curr. For. Rep. 2016, 2, 143–149. [Google Scholar] [CrossRef] [Green Version]
  8. Millar, C.I.; Stephenson, N.L.; Stephens, S.L. Climate change and forests of the future: Managing in the face of uncertainty. Ecol. Appl. 2007, 17, 2145–2151. [Google Scholar] [CrossRef]
  9. Seidl, R.; Lexer, M.J. Forest management under climatic and social uncertainty: Trade-offs between reducing climate change impacts and fostering adaptive capacity. J. Environ. Manag. 2013, 114, 461–469. [Google Scholar] [CrossRef]
  10. Hörl, J.; Keller, K.; Yousefpour, R. Reviewing the performance of adaptive forest management strategies with robustness analysis. For. Policy Econ. 2020, 119, 102289. [Google Scholar] [CrossRef]
  11. Bolte, A.; Ammer, C.; Löf, M.; Madsen, P.; Nabuurs, G.-J.; Schall, P.; Spathelf, P.; Rock, J. Adaptive forest management in central Europe: Climate change impacts, strategies and integrative concept. Scand. J. For. Res. 2009, 24, 473–482. [Google Scholar] [CrossRef]
  12. Mori, A.S.; Lertzman, K.P.; Gustafsson, L.; Cadotte, M. Biodiversity and ecosystem services in forest ecosystems: A research agenda for applied forest ecology. J. Appl. Ecol. 2017, 54, 12–27. [Google Scholar] [CrossRef]
  13. Thurm, E.A.; Hernandez, L.; Baltensweiler, A.; Ayan, S.; Rasztovits, E.; Bielak, K.; Zlatanov, T.M.; Hladnik, D.; Balic, B.; Freudenschuss, A.; et al. Alternative tree species under climate warming in managed European forests. For. Ecol. Manag. 2018, 430, 485–497. [Google Scholar] [CrossRef]
  14. Buras, A.; Menzel, A. Projecting Tree Species Composition Changes of European Forests for 2061–2090 under RCP 4.5 and RCP 8.5 Scenarios. Front. Plant Sci. 2018, 9, 1986. [Google Scholar] [CrossRef] [Green Version]
  15. Walentowski, H.; Falk, W.; Mette, T.; Kunz, J.; Bräuning, A.; Meinardus, C.; Zang, C.; Sutcliffe, L.M.E.; Leuschner, C. Assessing future suitability of tree species under climate change by multiple methods: A case study in southern Germany. Ann. For. Res. 2017, 60, 101–126. [Google Scholar] [CrossRef] [Green Version]
  16. Sousa-Silva, R.; Verbist, B.; Lomba, Â.; Valent, P.; Suškevičs, M.; Picard, O.; Hoogstra-Klein, M.A.; Cosofret, V.-C.; Bouriaud, L.; Ponette, Q.; et al. Adapting forest management to climate change in Europe: Linking perceptions to adaptive responses. For. Policy Econ. 2018, 90, 22–30. [Google Scholar] [CrossRef]
  17. Vinceti, B.; Manica, M.; Lauridsen, N.; Verkerk, P.J.; Lindner, M.; Fady, B. Managing forest genetic resources as a strategy to adapt forests to climate change: Perceptions of European forest owners and managers. Eur. J. For. Res. 2020, 139, 1107–1119. [Google Scholar] [CrossRef]
  18. Pyttel, P.; Kunz, J.; Bauhus, J. Growth, regeneration and shade tolerance of the Wild Service Tree (Sorbus torminalis (L.) Crantz) in aged oak coppice forests. Trees 2013, 27, 1609–1619. [Google Scholar] [CrossRef]
  19. Thurm, E.A.; Falk, W. Standortsansprüche seltener Baumarten. AFZ-DerWald. 2019, pp. 32–35. Available online: https://www.researchgate.net/publication/335033693_Standortsanspruche_seltener_Baumarten (accessed on 22 April 2022).
  20. de Rigo, D.; Bosco, C.; San-Miguel-Ayanz, J.; Houston Durrant, T.; Barredo, J.I.; Strona, G.; Caudullo, G.; Di Leo, M.; Boca, R. Forest resources in Europe: An integrated perspective on ecosystem services, disturbances and threats. In European Atlas of Forest Tree Species; San-Miguel-Ayanz, J., de Rigo, D., Caudullo, G., Houston Durrant, T., Mauri, A., Eds.; Publication Office of the European Union: Luxembourg, 2016. [Google Scholar]
  21. Orsi, F.; Ciolli, M.; Primmer, E.; Varumo, L.; Geneletti, D. Mapping hotspots and bundles of forest ecosystem services across the European Union. Land Use Policy 2020, 99, 104840. [Google Scholar] [CrossRef]
  22. Morin, X.; Fahse, L.; Jactel, H.; Scherer-Lorenzen, M.; Garcia-Valdes, R.; Bugmann, H. Long-term response of forest productivity to climate change is mostly driven by change in tree species composition. Sci. Rep. 2018, 8, 5627. [Google Scholar] [CrossRef] [Green Version]
  23. Hanewinkel, M.; Cullmann, D.A.; Schelhaas, M.-J.; Nabuurs, G.-J.; Zimmermann, N.E. Climate change may cause severe loss in the economic value of European forest land. Nat. Clim. Chang. 2012, 3, 203–207. [Google Scholar] [CrossRef]
  24. Eggers, J.; Holmgren, S.; Nordström, E.-M.; Lämås, T.; Lind, T.; Öhman, K. Balancing different forest values: Evaluation of forest management scenarios in a multi-criteria decision analysis framework. For. Policy Econ. 2019, 103, 55–69. [Google Scholar] [CrossRef]
  25. Balana, B.B.; Mathijs, E.; Muys, B. Assessing the sustainability of forest management: An application of multi-criteria decision analysis to community forests in northern Ethiopia. J. Environ. Manag. 2010, 91, 1294–1304. [Google Scholar] [CrossRef]
  26. Schwenk, W.S.; Donovan, T.M.; Keeton, W.S.; Nunery, J.S. Carbon storage, timber production, and biodiversity: Comparing ecosystem services with multi-criteria decision analysis. Ecol. Appl. 2012, 22, 1612–1627. [Google Scholar] [CrossRef] [PubMed]
  27. de Avila, A.L.; Häring, B.; Rheinbay, B.; Brüchert, F.; Hirsch, M.; Albrecht, A. Artensteckbriefe 2.0 Alternative Baumarten im Klimawandel—Eine Stoffsammlung; Forstliche Versuchs- und Forschungsanstalt Baden-Württemberg (FVA): Freiburg, Germany, 2021. [Google Scholar]
  28. Booth, T.H. Species distribution modelling tools and databases to assist managing forests under climate change. For. Ecol. Manag. 2018, 430, 196–203. [Google Scholar] [CrossRef]
  29. Pecchi, M.; Marchi, M.; Burton, V.; Giannetti, F.; Moriondo, M.; Bernetti, I.; Bindi, M.; Chirici, G. Species distribution modelling to support forest management. A literature review. Ecol. Model. 2019, 411, 108817. [Google Scholar] [CrossRef]
  30. Zurell, D.; Jeltsch, F.; Dormann, C.F.; Schröder, B. Static species distribution models in dynamically changing systems: How good can predictions really be? Ecography 2009, 32, 733–744. [Google Scholar] [CrossRef]
  31. Thuiller, W. Patterns and uncertainties of species’ range shifts under climate change. Glob. Chang. Biol. 2004, 10, 2020–2027. [Google Scholar] [CrossRef]
  32. Mauri, A.; Strona, G.; San-Miguel-Ayanz, J. EU-Forest, a high-resolution tree occurrence dataset for Europe. Sci. Data 2017, 4, 160123. [Google Scholar] [CrossRef] [PubMed] [Green Version]
  33. Guisan, A.; Thuiller, W.; Zimmermann, N.E. Habitat Suitability and Distribution Models: With Applications in R; Cambridge University Press: Cambridge, UK, 2017. [Google Scholar]
  34. Gardner, A.S.; Maclean, I.M.D.; Gaston, K.J.; Serra-Diaz, J. Climatic predictors of species distributions neglect biophysiologically meaningful variables. Divers. Distrib. 2019, 25, 1318–1333. [Google Scholar] [CrossRef] [Green Version]
  35. Karger, D.N.; Conrad, O.; Bohner, J.; Kawohl, T.; Kreft, H.; Soria-Auza, R.W.; Zimmermann, N.E.; Linder, H.P.; Kessler, M. Climatologies at high resolution for the earth’s land surface areas. Sci. Data 2017, 4, 170122. [Google Scholar] [CrossRef] [PubMed] [Green Version]
  36. Hengl, T.; Mendes de Jesus, J.; Heuvelink, G.B.; Ruiperez Gonzalez, M.; Kilibarda, M.; Blagotic, A.; Shangguan, W.; Wright, M.N.; Geng, X.; Bauer-Marschallinger, B.; et al. SoilGrids250m: Global gridded soil information based on machine learning. PLoS ONE 2017, 12, e0169748. [Google Scholar] [CrossRef] [PubMed] [Green Version]
  37. Kolb, E.; Mellert, K.H.; Göttlein, A. Nährstoffstatus naturnaher Böden in Europa. Wald. Landsch. Nat. 2019, 18, 5–13. [Google Scholar]
  38. Dormann, C.F.; Elith, J.; Bacher, S.; Buchmann, C.; Carl, G.; Carré, G.; Marquéz, J.R.G.; Gruber, B.; Lafourcade, B.; Leitão, P.J.; et al. Collinearity: A review of methods to deal with it and a simulation study evaluating their performance. Ecography 2013, 36, 27–46. [Google Scholar] [CrossRef]
  39. Brun, P.; Thuiller, W.; Chauvier, Y.; Pellissier, L.; Wüest, R.O.; Wang, Z.; Zimmermann, N.E. Model complexity affects species distribution projections under climate change. J. Biogeogr. 2019, 47, 130–142. [Google Scholar] [CrossRef]
  40. Dyderski, M.K.; Paz, S.; Frelich, L.E.; Jagodzinski, A.M. How much does climate change threaten European forest tree species distributions? Glob. Chang. Biol. 2018, 24, 1150–1163. [Google Scholar] [CrossRef]
  41. Goberville, E.; Beaugrand, G.; Hautekeete, N.C.; Piquot, Y.; Luczak, C. Uncertainties in the projection of species distributions related to general circulation models. Ecol. Evol. 2015, 5, 1100–1116. [Google Scholar] [CrossRef]
  42. Porfirio, L.L.; Harris, R.M.; Lefroy, E.C.; Hugh, S.; Gould, S.F.; Lee, G.; Bindoff, N.L.; Mackey, B. Improving the use of species distribution models in conservation planning and management under climate change. PLoS ONE 2014, 9, e113749. [Google Scholar] [CrossRef] [Green Version]
  43. Dubrovsky, M.; Trnka, M.; Holman, I.P.; Svobodova, E.; Harrison, P.A. Developing a reduced-form ensemble of climate change scenarios for Europe and its application to selected impact indicators. Clim. Chang. 2014, 128, 169–186. [Google Scholar] [CrossRef]
  44. Kaini, S.; Nepal, S.; Pradhananga, S.; Gardner, T.; Sharma, A.K. Representative general circulation models selection and downscaling of climate data for the transboundary Koshi river basin in China and Nepal. Int. J. Climatol. 2020, 40, 4131–4149. [Google Scholar] [CrossRef] [Green Version]
  45. Fajardo, J.; Corcoran, D.; Roehrdanz, P.R.; Hannah, L.; Marquet, P.A.; Kriticos, D. GCMcompareR: A web application to assess differences and assist in the selection of general circulation models for climate change research. Methods Ecol. Evol. 2020, 11, 656–663. [Google Scholar] [CrossRef] [Green Version]
  46. Moss, R.H.; Edmonds, J.A.; Hibbard, K.A.; Manning, M.R.; Rose, S.K.; van Vuuren, D.P.; Carter, T.R.; Emori, S.; Kainuma, M.; Kram, T.; et al. The next generation of scenarios for climate change research and assessment. Nature 2010, 463, 747–756. [Google Scholar] [CrossRef] [PubMed]
  47. Rogelj, J.; Meinshausen, M.; Knutti, R. Global warming under old and new scenarios using IPCC climate sensitivity range estimates. Nat. Clim. Chang. 2012, 2, 248–253. [Google Scholar] [CrossRef]
  48. Swets, J.A. Measuring the accuracy of diagnostic systems. Science 1988, 240, 1285–1293. [Google Scholar] [CrossRef] [Green Version]
  49. Ferro, C.A.T.; Stephenson, D.B. Extremal Dependence Indices: Improved Verification Measures for Deterministic Forecasts of Rare Binary Events. Weather Forecast. 2011, 26, 699–713. [Google Scholar] [CrossRef] [Green Version]
  50. Allouche, O.; Tsoar, A.; Kadmon, R. Assessing the accuracy of species distribution models: Prevalence, kappa and the true skill statistic (TSS). J. Appl. Ecol. 2006, 43, 1223–1232. [Google Scholar] [CrossRef]
  51. Thuiller, W.; Georges, D.; Engler, R.; Breiner, F.; Georges, M.D.; Thuiller, C.W. Package ‘Biomod2’; Species Distribution Modeling within an Ensemble Forecasting Framework. CRAN. 2021. Available online: https://cran.r-project.org/web/packages/biomod2/biomod2.pdf (accessed on 23 April 2022).
  52. Jiménez-Valverde, A. Prevalence affects the evaluation of discrimination capacity in presence-absence species distribution models. Biodivers. Conserv. 2021, 30, 1331–1340. [Google Scholar] [CrossRef]
  53. Hanewinkel, M.; Cullmann, D.A.; Michiels, H.G.; Kandler, G. Converting probabilistic tree species range shift projections into meaningful classes for management. J. Environ. Manag. 2014, 134, 153–165. [Google Scholar] [CrossRef]
  54. R Core Team. R: A Language and Environment for Statistical Computing, Version 4.0.5; Programming Language; The R Project for Statistical Computing: Vienna, Austria, 2021. [Google Scholar]
  55. Chakraborty, D.; Móricz, N.; Rasztovits, E.; Dobor, L.; Schueler, S. Provisioning forest and conservation science with high-resolution maps of potential distribution of major European tree species under climate change. Ann. For. Sci. 2021, 78, 26. [Google Scholar] [CrossRef]
  56. Mauri, A.; De Rigo, D.; Caudullo, G. Abies alba in Europe: Distribution, habitat, usage and threats. In European Atlas of Forest Tree Species; Publication Office of the European Union: Luxembourg, 2016; pp. 48–49. [Google Scholar]
  57. Tinner, W.; Colombaroli, D.; Heiri, O.; Henne, P.D.; Steinacher, M.; Untenecker, J.; Vescovi, E.; Allen, J.R.M.; Carraro, G.; Conedera, M.; et al. The past ecology of Abies alba provides new perspectives on future responses of silver fir forests to global warming. Ecol. Monogr. 2013, 83, 419–439. [Google Scholar] [CrossRef] [Green Version]
  58. Hanewinkel, M.; Hummel, S.; Cullmann, D.A. Modelling and economic evaluation of forest biome shifts under climate change in Southwest Germany. For. Ecol. Manag. 2010, 259, 710–719. [Google Scholar] [CrossRef]
  59. Liang, Y.; Duveneck, M.J.; Gustafson, E.J.; Serra-Diaz, J.M.; Thompson, J.R. How disturbance, competition, and dispersal interact to prevent tree range boundaries from keeping pace with climate change. Glob. Chang. Biol. 2018, 24, e335–e351. [Google Scholar] [CrossRef] [PubMed]
  60. Sittaro, F.; Paquette, A.; Messier, C.; Nock, C.A. Tree range expansion in eastern North America fails to keep pace with climate warming at northern range limits. Glob. Chang. Biol. 2017, 23, 3292–3301. [Google Scholar] [CrossRef] [PubMed]
  61. Heiland, L.; Kunstler, G.; Ruiz-Benito, P.; Buras, A.; Dahlgren, J.; Hülsmann, L. Divergent occurrences of juvenile and adult trees are explained by both environmental change and ontogenetic effects. Ecography 2022, 2022, e06042. [Google Scholar] [CrossRef]
  62. Iverson, L.R.; McKenzie, D. Tree-species range shifts in a changing climate: Detecting, modeling, assisting. Landsc. Ecol. 2013, 28, 879–889. [Google Scholar] [CrossRef]
  63. Mishra, S.; Hättenschwiler, S.; Yang, X. The plant microbiome: A missing link for the understanding of community dynamics and multifunctionality in forest ecosystems. Appl. Soil Ecol. 2020, 145, 103345. [Google Scholar] [CrossRef]
  64. Plomion, C.; Bastien, C.; Bogeat-Triboulot, M.-B.; Bouffier, L.; Déjardin, A.; Duplessis, S.; Fady, B.; Heuertz, M.; Le Gac, A.-L.; Le Provost, G.; et al. Forest tree genomics: 10 achievements from the past 10 years and future prospects. Ann. For. Sci. 2016, 73, 77–103. [Google Scholar] [CrossRef] [Green Version]
  65. Bettenfeld, P.; Fontaine, F.; Trouvelot, S.; Fernandez, O.; Courty, P.-E. Woody Plant Declines. What’s Wrong with the Microbiome? Trends Plant Sci. 2020, 25, 381–394. [Google Scholar] [CrossRef]
  66. Doonan, J.M.; Broberg, M.; Denman, S.; McDonald, J.E. Host-microbiota-insect interactions drive emergent virulence in a complex tree disease. Proc. Biol. Sci. 2020, 287, 20200956. [Google Scholar] [CrossRef]
  67. Ware, I.M.; Van Nuland, M.E.; Yang, Z.K.; Schadt, C.W.; Schweitzer, J.A.; Bailey, J.K. Climate-driven divergence in plant-microbiome interactions generates range-wide variation in bud break phenology. Commun. Biol. 2021, 4, 748. [Google Scholar] [CrossRef]
  68. Van Nuland, M.E.; Ware, I.M.; Schadt, C.W.; Yang, Z.; Bailey, J.K.; Schweitzer, J.A. Natural soil microbiome variation affects spring foliar phenology with consequences for plant productivity and climate-driven range shifts. New Phytol. 2021, 232, 762–775. [Google Scholar] [CrossRef]
  69. Kunstler, G.; Guyennon, A.; Ratcliffe, S.; Rüger, N.; Ruiz-Benito, P.; Childs, D.Z.; Dahlgren, J.; Lehtonen, A.; Thuiller, W.; Wirth, C.; et al. Demographic performance of European tree species at their hot and cold climatic edges. J. Ecol. 2020, 109, 1041–1054. [Google Scholar] [CrossRef]
  70. Maringer, J.; Stelzer, A.-S.; Paul, C.; Albrecht, A.T. Ninety-five years of observed disturbance-based tree mortality modeled with climate-sensitive accelerated failure time models. Eur. J. For. Res. 2020, 140, 255–272. [Google Scholar] [CrossRef]
  71. Lorenz, R.; Stalhandske, Z.; Fischer, E.M. Detection of a Climate Change Signal in Extreme Heat, Heat Stress, and Cold in Europe From Observations. Geophys. Res. Lett. 2019, 46, 8363–8374. [Google Scholar] [CrossRef] [Green Version]
  72. Vitali, V.; Buntgen, U.; Bauhus, J. Silver fir and Douglas fir are more tolerant to extreme droughts than Norway spruce in south-western Germany. Glob. Chang. Biol. 2017, 23, 5108–5119. [Google Scholar] [CrossRef] [PubMed]
  73. Vitasse, Y.; Bottero, A.; Cailleret, M.; Bigler, C.; Fonti, P.; Gessler, A.; Levesque, M.; Rohner, B.; Weber, P.; Rigling, A.; et al. Contrasting resistance and resilience to extreme drought and late spring frost in five major European tree species. Glob. Chang. Biol. 2019, 25, 3781–3792. [Google Scholar] [CrossRef]
  74. Mette, T.; Brandl, S.; Kölling, C. Climate Analogues for Temperate European Forests to Raise Silvicultural Evidence Using Twin Regions. Sustainability 2021, 13, 6522. [Google Scholar] [CrossRef]
  75. Broadmeadow, M.S.J.; Ray, D.; Samuel, C.J.A. Climate change and the future for broadleaved tree species in Britain. For. Int. J. For. Res. 2005, 78, 145–161. [Google Scholar] [CrossRef] [Green Version]
  76. Morecroft, M.D.; Stokes, V.J.; Taylor, M.E.; Morison, J.I.L. Effects of climate and management history on the distribution and growth of sycamore (Acer pseudoplatanus L.) in a southern British woodland in comparison to native competitors. Forestry 2008, 81, 59–74. [Google Scholar] [CrossRef] [Green Version]
  77. Li, S.; Feifel, M.; Karimi, Z.; Schuldt, B.; Choat, B.; Jansen, S. Leaf gas exchange performance and the lethal water potential of five European species during drought. Tree Physiol. 2016, 36, 179–192. [Google Scholar] [CrossRef] [Green Version]
  78. Conedera, M.; Tinner, W.; Krebs, P.; de Rigo, D.; Caudullo, G. Castanea sativa in Europe: Distribution, habitat, usage and threats. In European Atlas of Forest Tree Species; San-Miguel-Ayanz, J., de Rigo, D., Caudullo, G., Houston Durrant, T., Mauri, A., Eds.; Publication Office of the European Union: Luxembourg, 2016; p. e0125e. [Google Scholar]
  79. Gossner, M.M.; Wende, B.; Levick, S.; Schall, P.; Floren, A.; Linsenmair, K.E.; Steffan-Dewenter, I.; Schulze, E.-D.; Weisser, W.W. Deadwood enrichment in European forests—Which tree species should be used to promote saproxylic beetle diversity? Biol. Conserv. 2016, 201, 92–102. [Google Scholar] [CrossRef]
  80. Venturas, M.; Fuentes-Utrilla, P.; López, R.; Perea, R.; Fernández, V.; Gascó, A.; Guzmán, P.; Li, M.; Rodríguez-Calcerrada, J.; Miranda, E.; et al. Ulmus laevis in the Iberian Peninsula: A review of its ecology and conservation. Iforest-Biogeosci. For. 2015, 8, 135–142. [Google Scholar] [CrossRef] [Green Version]
  81. Vakkari, P.; Rusanen, M.; Kärkkäinen, K. High Genetic Differentiation in Marginal Populations of European White Elm (Ulmus laevis). Silva Fenn. 2009, 43, 185–196. [Google Scholar] [CrossRef] [Green Version]
  82. Li, M.; López, R.; Venturas, M.; Pita, P.; Gordaliza, G.G.; Gil, L.; Rodríguez-Calcerrada, J. Greater resistance to flooding of seedlings of Ulmus laevis than Ulmus minor is related to the maintenance of a more positive carbon balance. Trees 2015, 29, 835–848. [Google Scholar] [CrossRef]
  83. Danescu, A.; Albrecht, A.T.; Bauhus, J. Structural diversity promotes productivity of mixed, uneven-aged forests in southwestern Germany. Oecologia 2016, 182, 319–333. [Google Scholar] [CrossRef]
  84. Pretzsch, H.; del Río, M.; Ammer, C.; Avdagic, A.; Barbeito, I.; Bielak, K.; Brazaitis, G.; Coll, L.; Dirnberger, G.; Drössler, L.; et al. Growth and yield of mixed versus pure stands of Scots pine (Pinus sylvestris L.) and European beech (Fagus sylvatica L.) analysed along a productivity gradient through Europe. Eur. J. For. Res. 2015, 134, 927–947. [Google Scholar] [CrossRef] [Green Version]
  85. Albrich, K.; Rammer, W.; Thom, D.; Seidl, R. Trade-offs between temporal stability and level of forest ecosystem services provisioning under climate change. Ecol. Appl. 2018, 28, 1884–1896. [Google Scholar] [CrossRef] [Green Version]
  86. Vacek, Z.; Vacek, S.; Slanař, J.; Bílek, L.; Bulušek, D.; Štefančík, I.; Králíček, I.; Vančura, K. Adaption of Norway spruce and European beech forests under climate change: From resistance to close-to-nature silviculture. Cent. Eur. For. J. 2019, 65, 129–144. [Google Scholar] [CrossRef] [Green Version]
  87. Neuner, S.; Albrecht, A.; Cullmann, D.; Engels, F.; Griess, V.C.; Hahn, W.A.; Hanewinkel, M.; Hartl, F.; Kolling, C.; Staupendahl, K.; et al. Survival of Norway spruce remains higher in mixed stands under a dryer and warmer climate. Glob. Chang. Biol. 2015, 21, 935–946. [Google Scholar] [CrossRef] [Green Version]
  88. Schelhaas, M.-J.; Nabuurs, G.-J.; Hengeveld, G.; Reyer, C.; Hanewinkel, M.; Zimmermann, N.E.; Cullmann, D. Alternative forest management strategies to account for climate change-induced productivity and species suitability changes in Europe. Reg. Environ. Chang. 2015, 15, 1581–1594. [Google Scholar] [CrossRef] [Green Version]
  89. Priebe, J.; Reimerson, E.; Hallberg-Sramek, I.; Sténs, A.; Sandström, C.; Mårald, E. Transformative change in context—stakeholders’ understandings of leverage at the forest–climate nexus. Sustain. Sci. 2022. [Google Scholar] [CrossRef]
  90. Schmidt, M.; Mölder, A.; Schönfelder, E.; Engel, F.; Schmiedel, I.; Culmsee, H. Determining ancient woodland indicator plants for practical use: A new approach developed in northwest Germany. For. Ecol. Manag. 2014, 330, 228–239. [Google Scholar] [CrossRef]
  91. Hernández-Morcillo, M.; Torralba, M.; Baiges, T.; Bernasconi, A.; Bottaro, G.; Brogaard, S.; Bussola, F.; Díaz-Varela, E.; Geneletti, D.; Grossmann, C.M.; et al. Scanning the solutions for the sustainable supply of forest ecosystem services in Europe. Sustain. Sci. 2022. [Google Scholar] [CrossRef]
  92. Zurell, D.; Thuiller, W.; Pagel, J.; Cabral, J.S.; Munkemuller, T.; Gravel, D.; Dullinger, S.; Normand, S.; Schiffers, K.H.; Moore, K.A.; et al. Benchmarking novel approaches for modelling species range dynamics. Glob. Chang. Biol. 2016, 22, 2651–2664. [Google Scholar] [CrossRef] [PubMed]
  93. Lee-Yaw, J.A.; McCune, J.L.; Pironon, S.; Sheth, S.N. Species distribution models rarely predict the biology of real populations. Ecography 2021. [Google Scholar] [CrossRef]
  94. Diaz-Balteiro, L.; Romero, C. Making forestry decisions with multiple criteria: A review and an assessment. For. Ecol. Manag. 2008, 255, 3222–3241. [Google Scholar] [CrossRef]
  95. Peterson, M.L.; Doak, D.F.; Morris, W.F. Incorporating local adaptation into forecasts of species’ distribution and abundance under climate change. Glob. Chang. Biol. 2019, 25, 775–793. [Google Scholar] [CrossRef]
Figure 1. The study area within Europe, its elevation, major rivers and lakes as well as the case study of Baden-Württemberg with its main natural regions.
Sustainability 14 05213 g001
Figure 2. Probability of occurrence (Pocc) vs. the coefficient of variation (CV) for F. sylvatica and C. sativa ensemble models.
Sustainability 14 05213 g002
Figure 3. Comparison of the ranges of explanatory variables for the major tree species F. sylvatica and the alternative tree species C. sativa.
Sustainability 14 05213 g003
Figure 4. Classed occurrence probability of F. sylvativa and C. sativa. today and in 2070 under RCP 4.5 and RCP 8.5.
Sustainability 14 05213 g004
Figure 5. Probability of occurrence (Pocc) dynamics throughout the century among major (left) and alternative (right) tree species across Europe under RCP 8.5. Bars indicate the share of Pocc classes for each time slice, while the alluvials represent the flow between classes over time. See Appendix A for RCP 4.5.
Sustainability 14 05213 g005
Figure 6. Share of major tree species losing their extended and core Pocc by 2070 under RCP 4.5 and RCP 8.5 compared to the current climate in Baden-Württemberg.
Sustainability 14 05213 g006
Figure 7. Occurrence probability (Pocc) of minor alternative tree species in Baden-Württemberg in 2070 under RCP 4.5 where major tree species decline. The area where major tree species show stable extended and core Pocc was excluded from the analysis (light grey).
Sustainability 14 05213 g007
Figure 8. Occurrence probability of minor alternative tree species in Baden-Württemberg in 2070 under RCP 8.5 where major tree species decline. The area where major tree species show stable extended and core Pocc was excluded from the analysis (light grey).
Sustainability 14 05213 g008
Table 1. Edaphic and bioclimatic explanatory variables used for ensemble species distribution models for C. sativa (Cs), S. torminalis (St), C. betulus (Cb), Q. petraea (Qp), U. laevis (Ul), A. pseudoplatanus (Ap), P. abies (Pa), F. sylvatica (Fs), A. alba (Aa), P. sylvestris (Ps) and B. pendula (Bp). Species specific explanatory variable selection is indicated by the “√” symbol.
Expl. VariablesSourceCsStCbQpUlApPaFsAaPsBp
Climate
Bio 1[35]
Bio 5[35]
Bio 6[35]
Bio 12[35]
Bio 18[35]
Bio 19[35]
CCIown computation
GDD5own computation
Soil
soil pH[36]
available water content[36]
soil nutrient status[37]
Table 2. Ensemble model scores for the studied tree species.
SpeciesSE 1SP 1TSSSEDIAUC
Abies alba0.9180.8110.7300.8710.932
Acer pseudoplatanus0.8650.7130.5780.7490.866
Betula pendula0.8320.7520.5840.7570.867
Carpinus betulus0.8570.7410.5980.7590.880
Castanea sativa0.8790.7700.6490.8030.892
Fagus sylvatica0.8620.7410.6030.7740.883
Picea abies0.9100.8180.7280.8660.928
Pinus sylvestris0.8500.7830.6330.7870.897
Quercus petraea0.8840.7400.6240.7850.887
Sorbus torminalis0.8990.7400.6390.8410.903
Ulmus laevis0.8290.7930.6220.7830.886
Mean0.8710.7640.6350.7980.893
1 at maxTSS.
Publisher’s Note: MDPI stays neutral with regard to jurisdictional claims in published maps and institutional affiliations.

