1. Introduction
Rapid urbanisation is leading to rising levels of demand for the distribution of goods and associated parking needs in cities [
1]. An increased level of demand for parking and changes to parking infrastructure is further evident from increasing levels of construction activities associated with new infrastructures such as light rails and residential towers. These increased levels of demand cause not only major disruptions, reducing the amount of on-street parking [
2], but also reduce other parking options due to changes to current parking infrastructure, including the planned demolition of existing carparks [
3]. Furthermore, increased urbanisation with the surge in freight transport movements has resulted in a hazardous impact on public health, the environment, and the quality of life in urban areas [
4].
Parking within the broader topic of transport planning has been investigated from a range of perspectives, including parking infrastructure planning across a range of parking facilities (e.g., off-street and kerbside (on-street)) in urban cities, parking policies, and parking assessments. Parking infrastructure relates to facilities and requirements in metropolitan cities and other large established areas such as university campuses and sporting venues [
5,
6]. Parking infrastructure comprises a range of facilities which includes kerbside parking in city centres and private multi-storey carparks. On the other hand, parking policy is an integral part of the parking assessment. It is mainly the question for policymakers at the local government/council level, focusing on types of kerbside parking allocation, parking time limits, and pricing of parking. Parking assessment is a continuing work for various stakeholders due to the changing environment in many metropolitan cities, increasing level of infrastructure, commercial and residential developments, increasing demand for different types of parking (e.g., freight and servicing activities), and changes to existing parking infrastructure [
7].
The parking infrastructure of the kerbside and off-street parking supply is continuously changing due to various factors such as urban redevelopment and minimum parking requirements. It is recognised that minimum parking requirements exacerbate all problems associated with increasing demand, leading to higher vehicle ownership, more car ownership, and poor air quality [
5]. These problems are further compounded when the parking infrastructure is impacted by city infrastructure development, particularly when existing parking spaces are reduced, and demand is increased due to population growth and construction activities [
3].
Various studies have reported on parking assessments from different perspectives and viewpoints, including evaluation of parking infrastructure from constraint and/or opportunity for urban development [
5], energy management for a large-scale electric vehicle charging-enabled municipal parking deck [
8], the costs and benefits of inner-city parking using network optimisation [
9], and the effectiveness of on-street parking pricing schemes under changing conditions [
7] using different pricing strategies [
10]. Recently, Tran, Yang, and Huang [
11] investigated traffic and transportation planning-related indicators and identified on-street parking within broader parking infrastructure as a significant indicator of sustainable transportation infrastructure rating systems. Some studies have investigated the demand for parking influenced by other factors including changes in parking cost shifting demand and their interaction on cruising for parking [
12,
13], a tradeoff between cruising and walking cost [
14], and pricing elasticity of parking occupancy and associated supply restrictions [
15]. Latent demand as part of demand not realised has also been studied, particularly demand modelling incorporating cruise-around searching [
16,
17]. It is recognised that measuring the share of traffic that is cruising for parking is a significant portion of parking demand [
16]. There is growing recognition that parking assessment is critical for any future infrastructure development, particularly when current infrastructure is affected during the construction stage and expected/planned changes to existing parking facilities.
Substantial research examines parking in urban cities, national parks, and public lands by consideration of various factors impacting transportation planning, urban challenges for parking occupancy detection, overall parking assessment, the role played by social norms, communication responsibility, and institutional environment in regulating parking behaviour and the social impacts of shared transportation [
5,
7,
18,
19,
20,
21,
22,
23,
24]. Those factors impacting the availability of parking include (i) possible closure of existing kerbside parking due to new public transport infrastructure such as light rails, (ii) increasing demand due to population growth, (iii) increasing freight and servicing activities, (iv) changes to other parking facilities (e.g., closure of existing carparks for developing new residential and commercial buildings), (v) real-time availability for on-street parking in an urban environment, and (vi) the impact of a sharp increase in construction volume (activity) and the development zone’s compaction [
25]. However, most of these studies have focused on these factors with limited consideration of future impact including rapid growth in construction activities and infrastructure changes. Furthermore, those research studies have not considered inter-dependencies of those factors on overall parking assessment. In contrast, many cities are continuously impacted by many rapidly changing conditions over many years of infrastructure development and population growth [
2]. Parking assessment of current demand/usage and capacity, as well as future impacts on overall parking requirements and supply due to population growth and infrastructure development, is lacking. Therefore, the research questions of this study are: (i) what the current demand on existing parking infrastructure is, mainly influenced by construction activities and (ii) how future impact scenarios will impact the overall parking needs in a rapidly changing urban city. To address the broader research question on parking assessment of a rapidly changing urban city, the Parramatta CBD (one of the fastest-growing cities in Australia) was selected for this research. The research was carried out using the assessment of current parking behaviour based on survey data and simulation modelling of future kerbside impact scenarios.
The research paper is structured as follows. Next, a background of the current parking infrastructure in the Parramatta CBD is presented. This is followed by the research methodology providing details of the data collection methods, analysis, and modelling and simulation used in the assessment. The results are presented next. Finally, findings, discussion, and conclusions are presented by outlining recommendations for policymakers for developing TDM strategies on off-street and kerbside parking, limitations, and practical implications.
2. Background of Current Parking Infrastructure—Parramatta CBD
The Parramatta CBD is one of the most rapidly changing cities in Australia, with major infrastructure projects in progress including the Parramatta Light Rail and Sydney Metro West rail line. The proposed light-rail project will have a major impact on the current parking infrastructure of off-street (e.g., multi-storey carparks) and kerbside parking facilities.
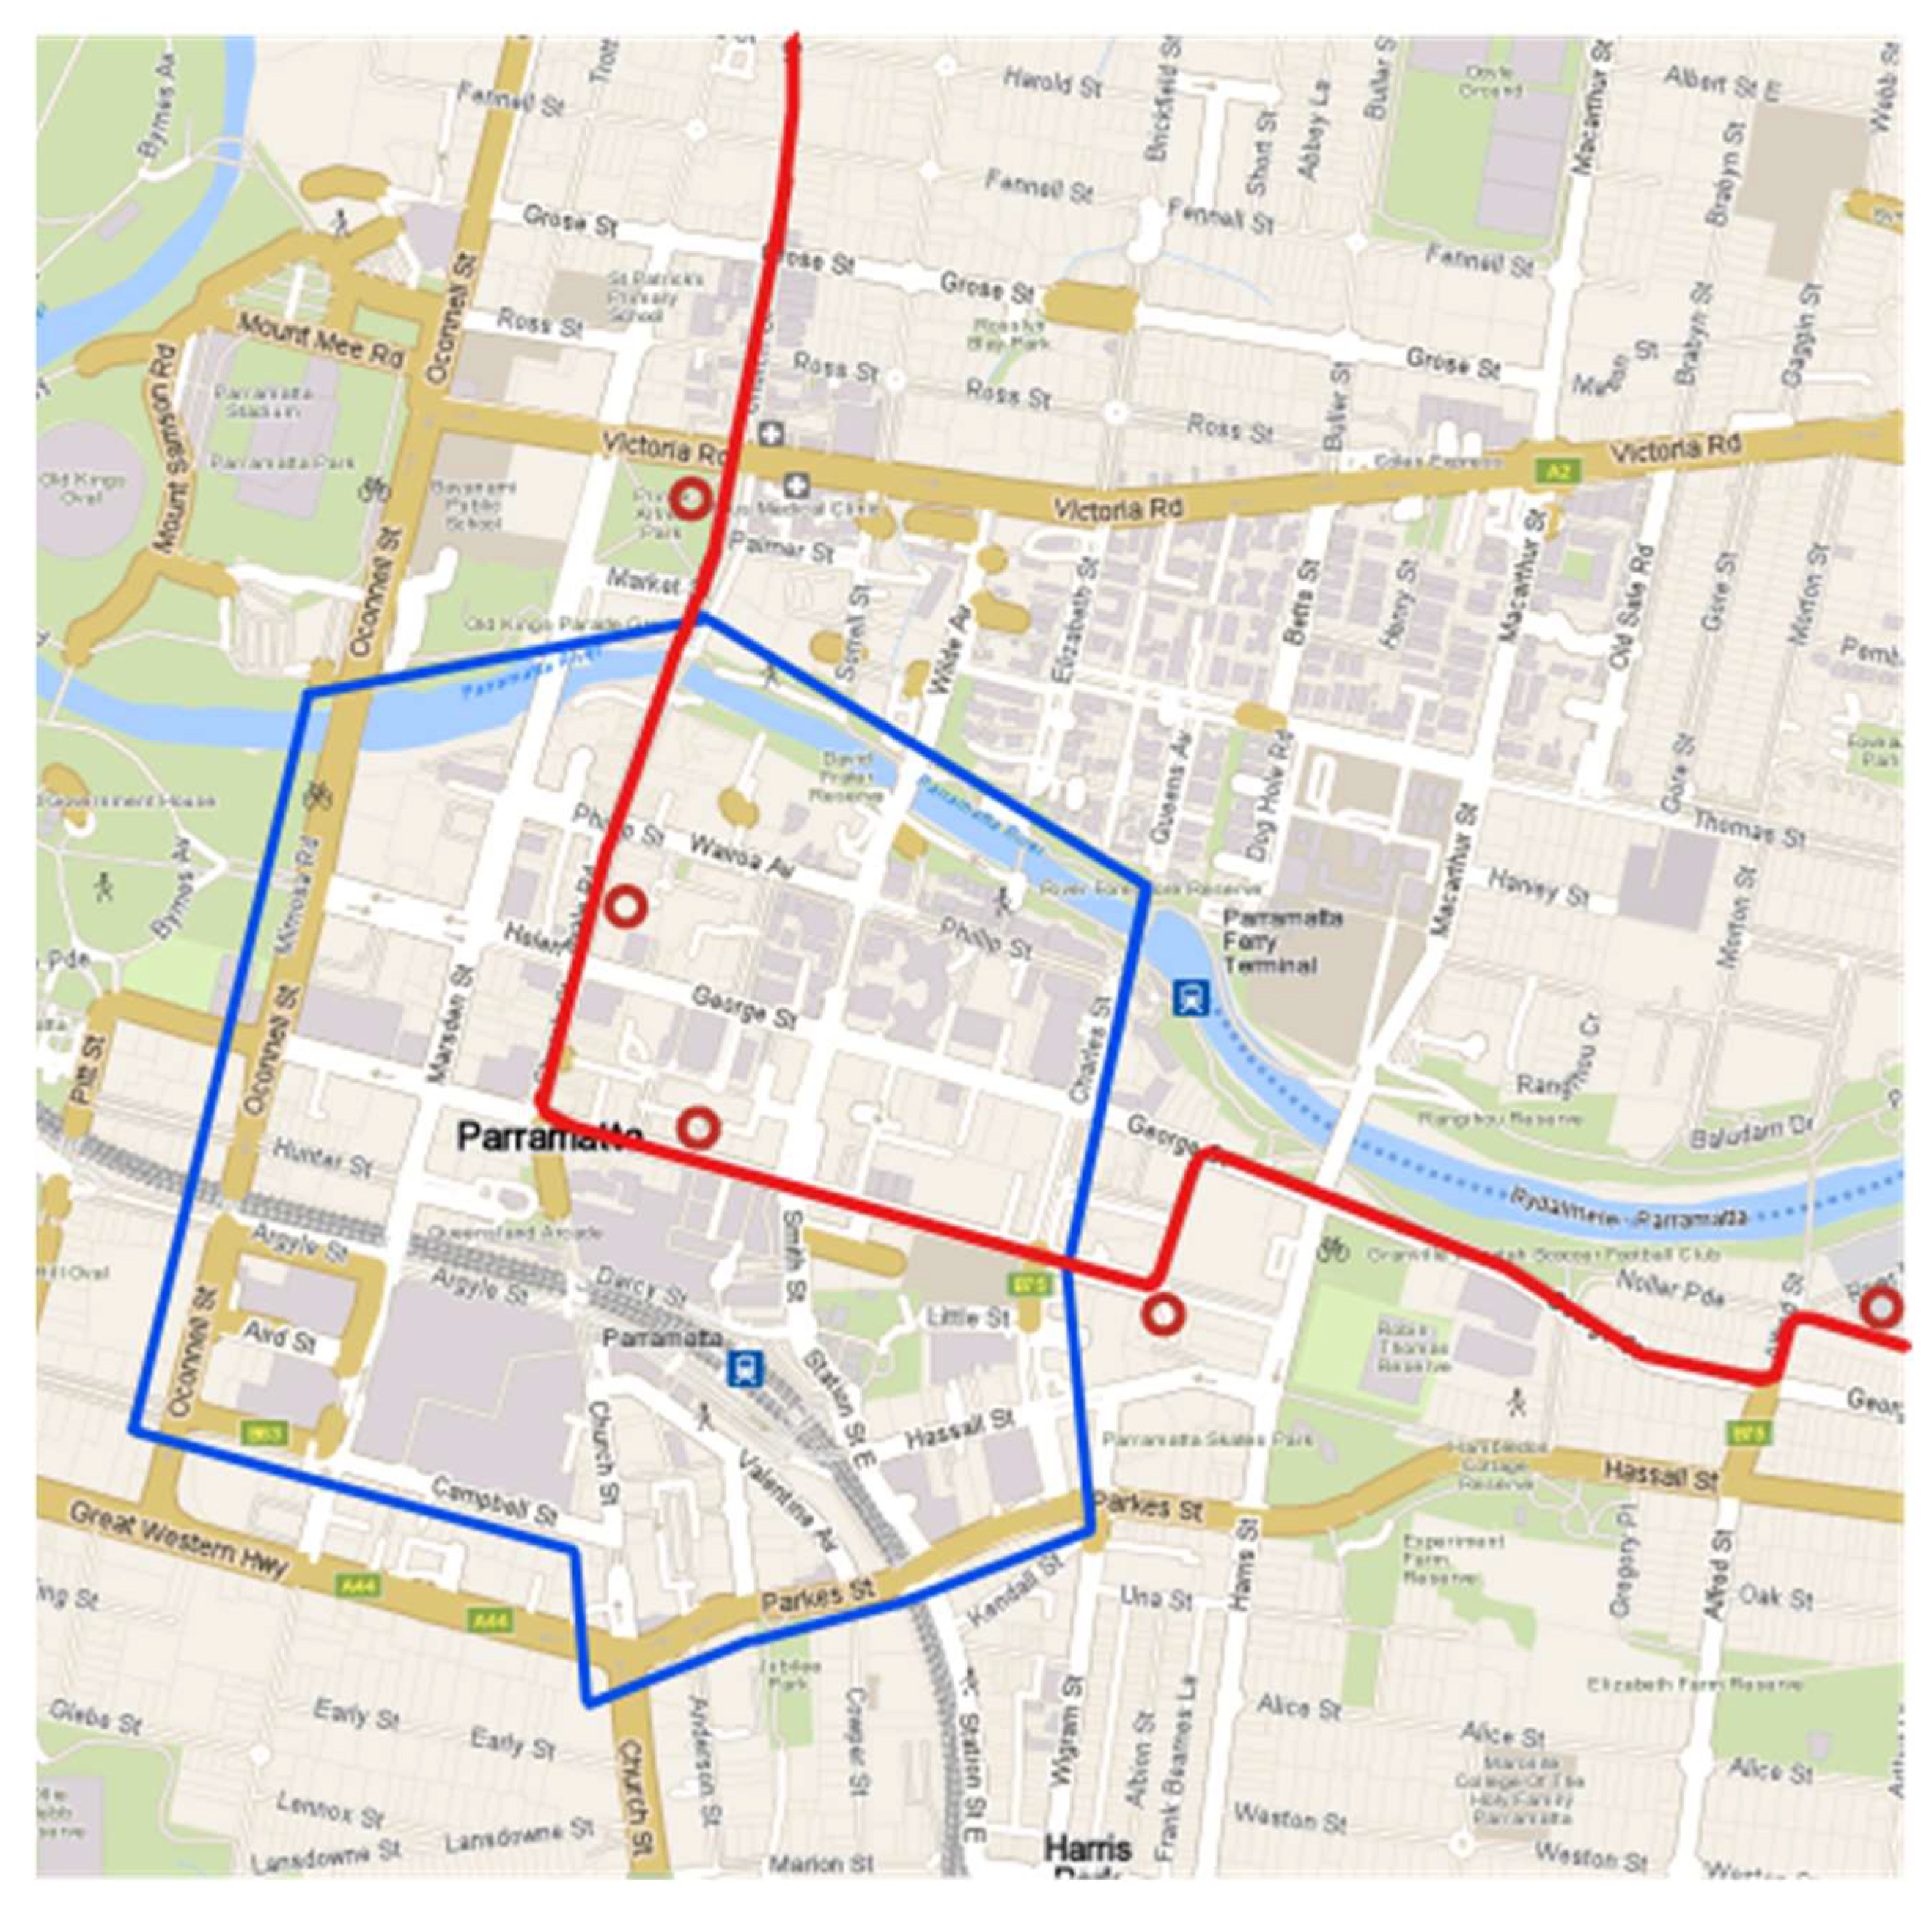
Figure 1 shows the map of the planned route of light-rail infrastructure and the parking study area in Parramatta CBD on a 2 km × 2 km map. The parking study area of short-term parking (STP) and freight activity space (FAS), defined by the boundaries of the area (shown in blue), is about 0.78 km
2 (i.e., 0.91 km × 0.86 km).
The second major change expected in the Parramatta CBD is ongoing road infrastructure development, which also impacts the current kerbside parking infrastructure. Moreover, there are several other residential and commercial infrastructure projects that are in the pipeline, including a large number of applications for commercial office development in the Parramatta CBD [
2,
26]. There are two stages of impact on kerbside parking due to these projects. First, there is an immediate impact on kerbside parking demand due to increased demand by construction activities. Second, there is an expected demand increase and potential changes to demand composition (e.g., short-term parking and freight/servicing activities), influenced by the development completion and subsequent occupation of those buildings by residents and businesses.
The next major change is the reduction of existing parking facilities, due to other developments in the Parramatta CBD. There are three public multi-storey carparks. Two of them are flagged for demolition to make way for other developments. Commuter carparks on the fringe of the CBD are likely to be the replacement. While there is some sense in this approach from a land-value perspective, the overall profile of commuter parking could be impacted by this approach. However, tradespersons using the carpark on Horwood Place are likely to be using kerbside due to its convenient proximity to the large city-centre developments such as Parramatta Square (a major commercial development site), particularly if the worker is carrying tools to the site. All of these expected changes and the resulting impact on overall kerbside parking behaviour from the perspective of usage with time and bottleneck are complex to visualise and are required to be investigated for developing TDM strategies for all stakeholders. This is further impacted by changes to demand impacted by population growth and thereby an increased demand in the parking needs of construction workers, freight services, and other users of city facilities.
Furthermore, Transport for NSW (TfNSW) of the NSW government is overseeing the overall transport/parking planning to be fed into the overall planning of the infrastructure development in the Parramatta CBD. TfNSW observed a significant number of construction workers parking in multi-storey parking facilities in the Parramatta CBD to work on nearby building sites. While TfNSW supports the use of off-street parking facilities, there are likely implications to the broader community should the off-street parking provision change. The Horwood Place carpark that was central to this study and is highly frequented by construction workers is scheduled for closure, with the area to be redeveloped. TfNSW set this as a priority area for further investigation within the city infrastructure development planning framework. Although several other factors including cost, alternatives to commuting by public transport, and willingness to walk from a distant carpark could influence the overall parking behaviour, the scope of this research is limited to investigating parking assessment in the context of key areas of growing construction activity, infrastructure changes, and the impact of population growth. Therefore, this research focused on the implications of impact scenarios, incorporating the expected demand increase and changes to the parking infrastructure over the next six years.
In addressing the broader research question of parking assessment in a rapidly changing urban city, using the case of the Parramatta CBD with the implications outlined above, the broader aim of this research is to assess the traffic/parking impact of ongoing high demand from construction workers and limited future off-street parking supply as the basis for developing TDM strategies. Therefore, the key objectives of this investigation/research are to:
Gain an understanding of parking behaviour of construction workers at a council carpark by trip purpose, site destination, and user through a survey of workers using the carpark;
Illustrate and analyse/forecast expected future kerbside parking demand due to population and construction growth as well as capacity reduction due to infrastructure development;
Develop and execute a traffic/parking simulation model of baseline scenario (current demand/usage and supply) and various kerbside impact scenarios, including expected demand increase and reduction/changes of/to existing kerbside and carpark capacity, and
Provide evidence-based information on parking assessment in Parramatta CBD and guidelines to key stakeholders of infrastructure planning for developing TDM strategies.
This research was carried out using surveys (manual and video-capture) for data collection and a simulation approach for modelling of the baseline scenario and future impact scenarios. Details of the research approach, including methods adopted for data collection and analysis, are outlined next.
3. Research Methodology
The research study adopted a holistic approach of modelling parking behaviour and simulation of impact scenarios to illustrate the impact of future changes to parking demand and capacity changes in a rapidly changing metropolitan city. The overall approach involved three stages: (i) worker intercept survey at the selected carpark, using a behavioural questionnaire, (ii) the carpark data using camera and ticket data and kerbside parking usage using video/camera and manual data collection, and (iii) modelling and simulation of baseline and impact scenarios. The first two stages mainly involved survey data, the carpark usage using video/camera and ticket data and the kerbside parking usage using video/camera and manual data. Analysis of kerbside and carpark data was used to model the baseline simulation model. Details of data collection involved in the first two stages are presented next. This is followed by the details of the third stage of modelling and simulation of baseline and impact scenarios.
3.1. Data Collection
3.1.1. Worker Intercept Survey Data Collection
The worker intercept survey (
Appendix A) was designed to gather a deeper understanding of the drivers for construction workers’ choice in parking at the subject carpark. Surveyors at four entry/exit points of the carpark intercepted construction workers and collected responses using Google Form. The survey was conducted over two working days, two shifts each day: (i) 7 May 2019, 6 a.m.–9 a.m. and 11 a.m.–2 p.m.; and (ii) 8 May 2019, 6 a.m.–9 a.m. and 12 p.m.–3 p.m.
3.1.2. Carpark Data Collection—Video/Camera and Ticket Data (Provided by TfNSW)
Carpark parking data consisted of video and ticket data of parking events at Horwood Place carpark for six continuous days (Monday 6 May 2019 to Saturday 11 May 2019) and was provided by TfNSW. The ticket data provided details on vehicle arrival times and exit times. The camera data provided details on vehicle arrival times and vehicle type. To determine parking duration, vehicle arrivals from the camera data were matched with the unique vehicle arrival and exit times from ticket data.
The matching process required both datasets to be cleaned and synchronised first. Available ticket data were matched with camera data for 06 May to 11 May to form a synchronised dataset. The synchronised dataset consists of arrival times and vehicle types ascertained from camera data and parking duration derived from ticket data. Hourly parking time distributions were then developed for use in the carpark parking model. It is also noted that some records had no matching dwell time information after synchronisation; however, this is related to a small percentage of entries (about 3%). By evaluating parking duration distributions for parking events of each hour and then by sampling from these distributions, the missing information was reconstructed. That is, for camera records with no matching ticket data, a parking duration was assumed using hourly parking distributions. Distributions of parking duration of parking events in each hour are modelled using triangular distributions with mean, minimum, and maximum duration using camera data and are shown in
Appendix B.
The intercept survey data were then matched with the synchronised dataset using the arrival time, parking duration (as claimed by construction workers and actual), and vehicle type. More than 90% of parking events were consolidated by matching all three categories and using the correctly matched camera and ticket data. For other cases, at least one of the attributes was matched. This resulted in a synchronised dataset that included all carpark data and construction worker usage data.
3.1.3. Kerbside Parking Demand Data Collection
Using the kerbside assessment conducted in 2017 [
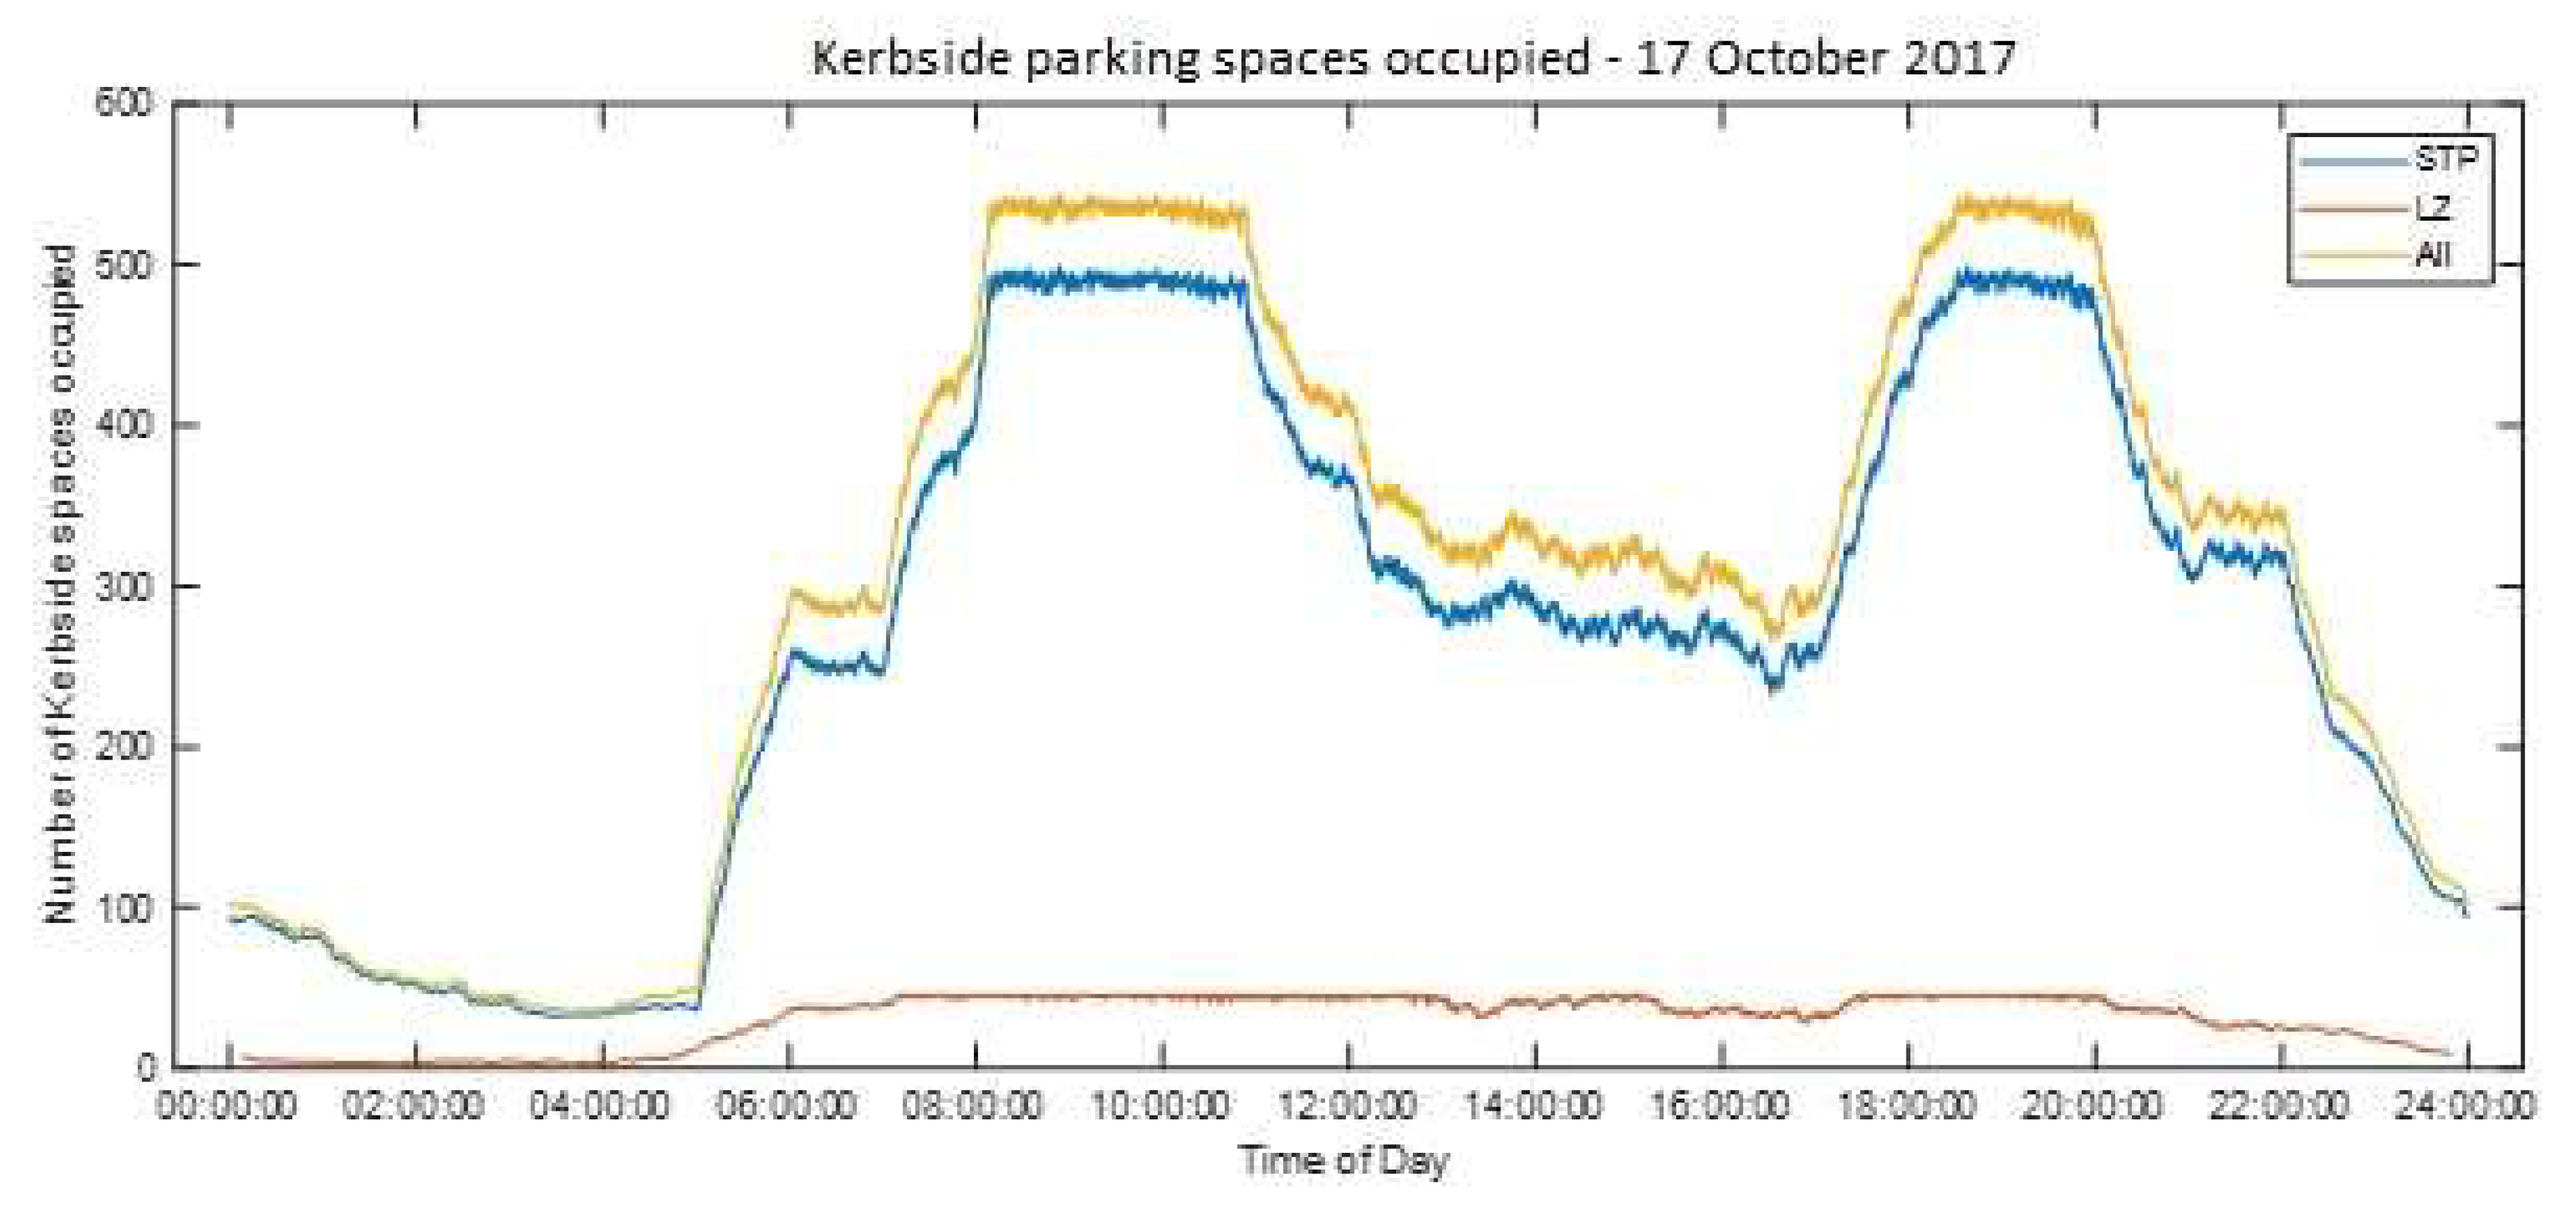
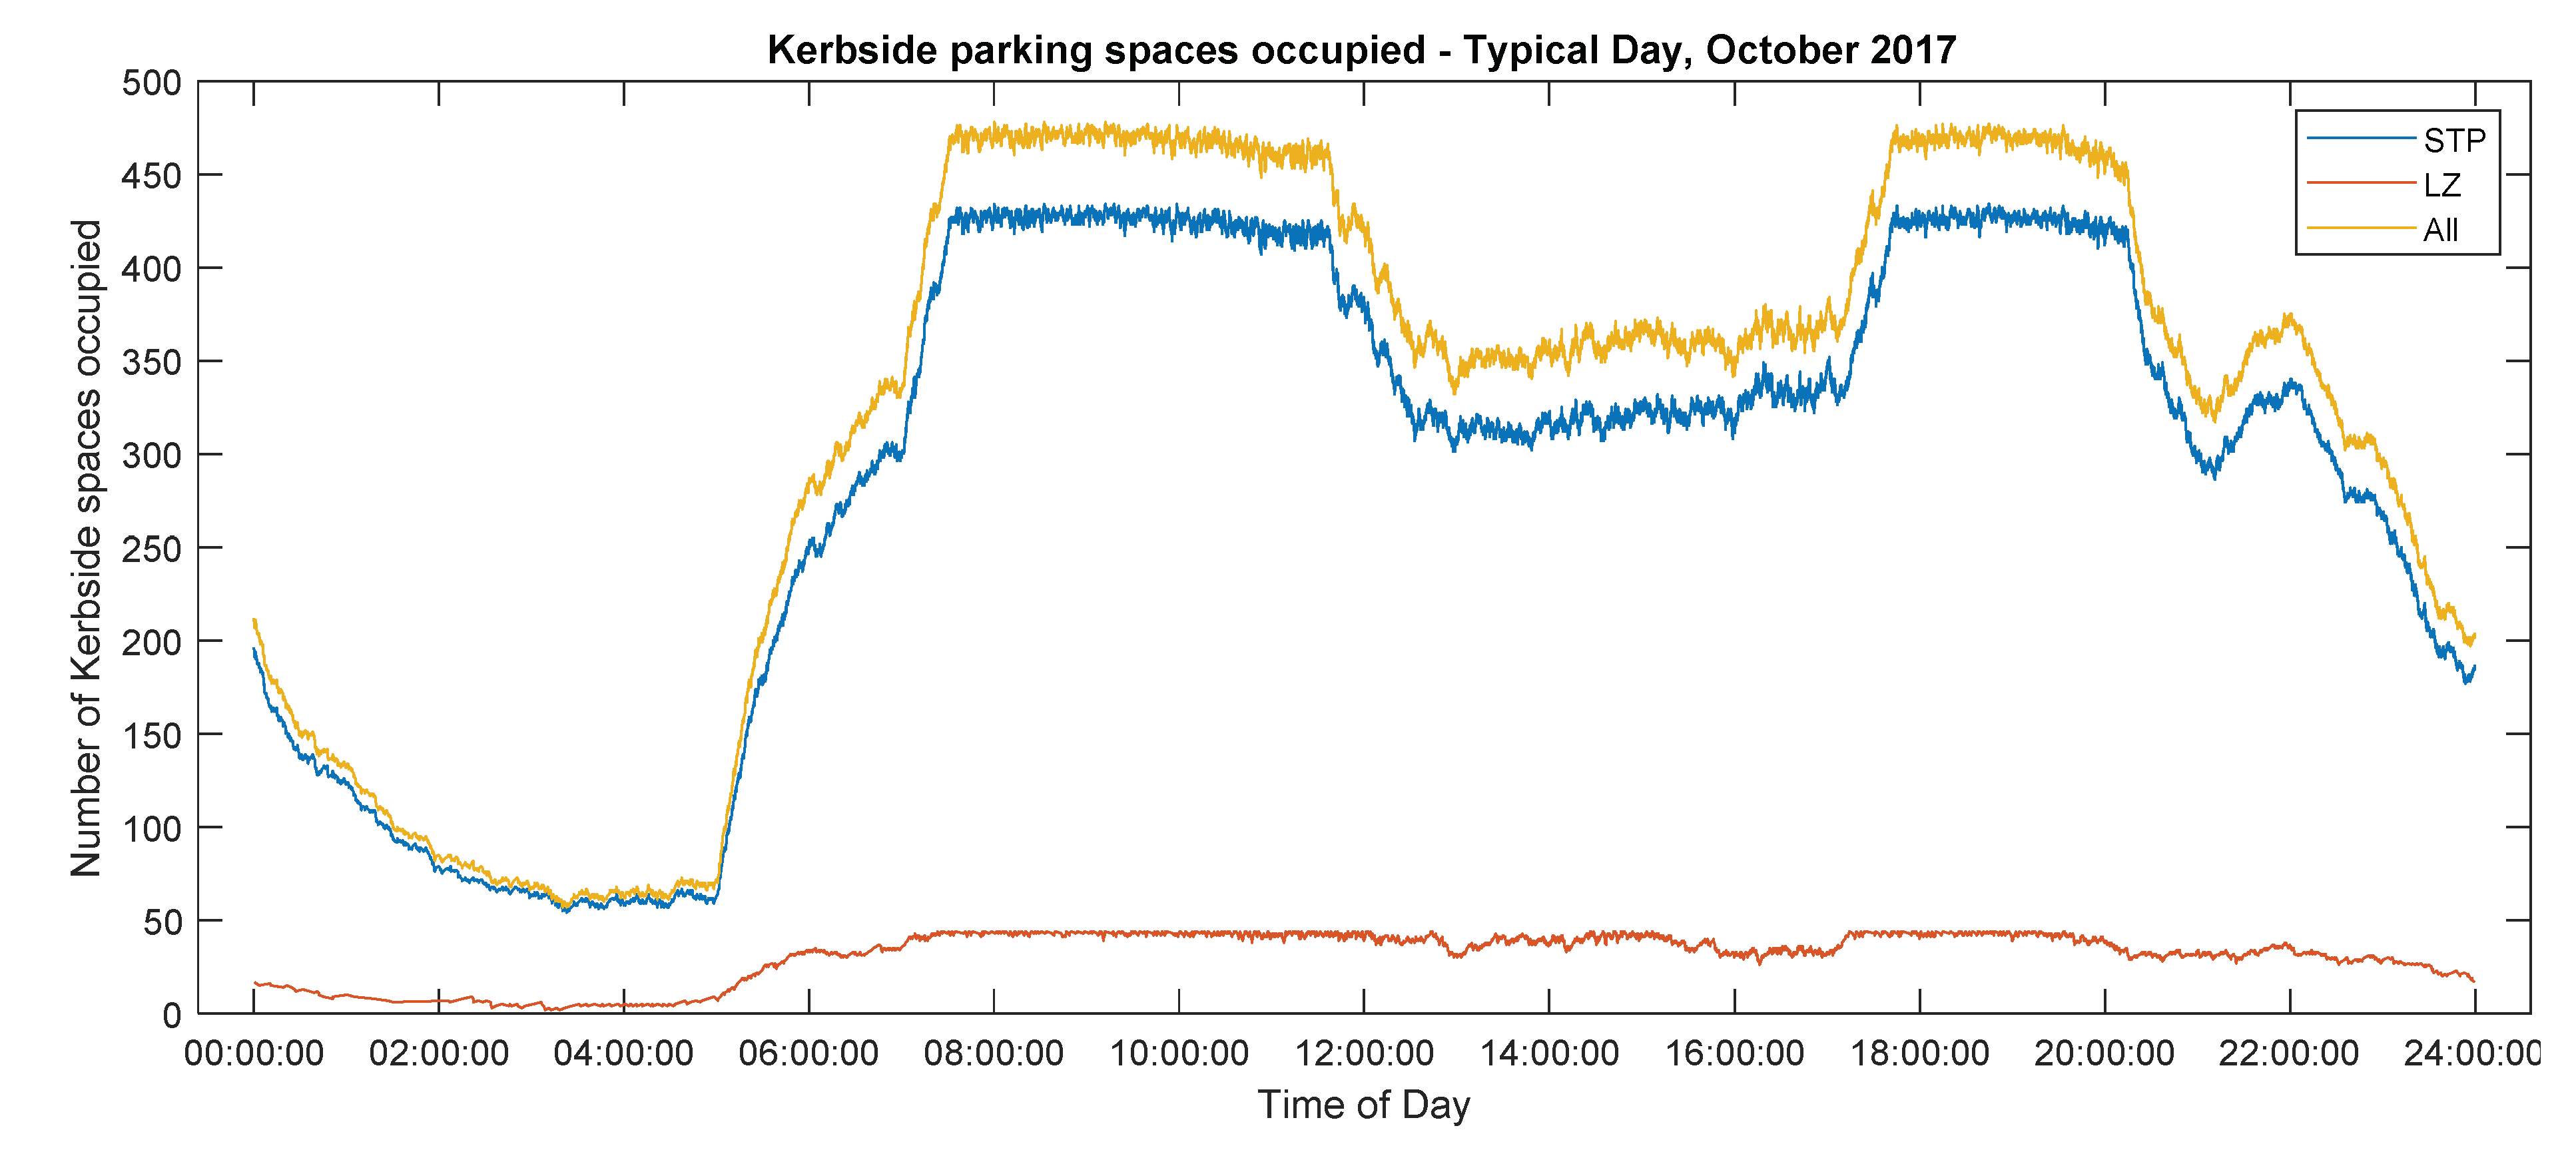
3], which involved both manual data collection and video data provided by TfNSW, a “typical day” scenario was constructed. Typical day model provides kerbside parking usage on a typical weekday. This model was verified using 2019 kerbside demand data and was found to be a reliable representation of the Parramtta CBD parking. To adopt kerbside video/camera data collected in 2017, provided by TfNSW for the purpose baseline modelling, kerbside video/camera data was validated using a small-scale kerbside parking survey in 2019 (carried out by TfNSW). Data gathered in the 2017 kerbside assessment included camera data (provided by TfNSW) and manually collected data on parking usage over two days. Manual data collection was limited, covering only a limited period (7 a.m.–4pm) over two days (17–18 October 2017) using a few selected parking spaces of limited parking segments in Parramatta CBD. The purpose of the validation was to ensure no significant discrepancy between current kerbside parking usage compared to usage in 2017, before incorporating the 2017 data into modelling. The validation of 2017 kerbside data using a small-scale parking survey carried out by the TfNSW over two days (7–8 May 2019) concluded that the data gathered in 2017 remains valid and reliable for use in the development of the traffic/parking baseline simulation model.
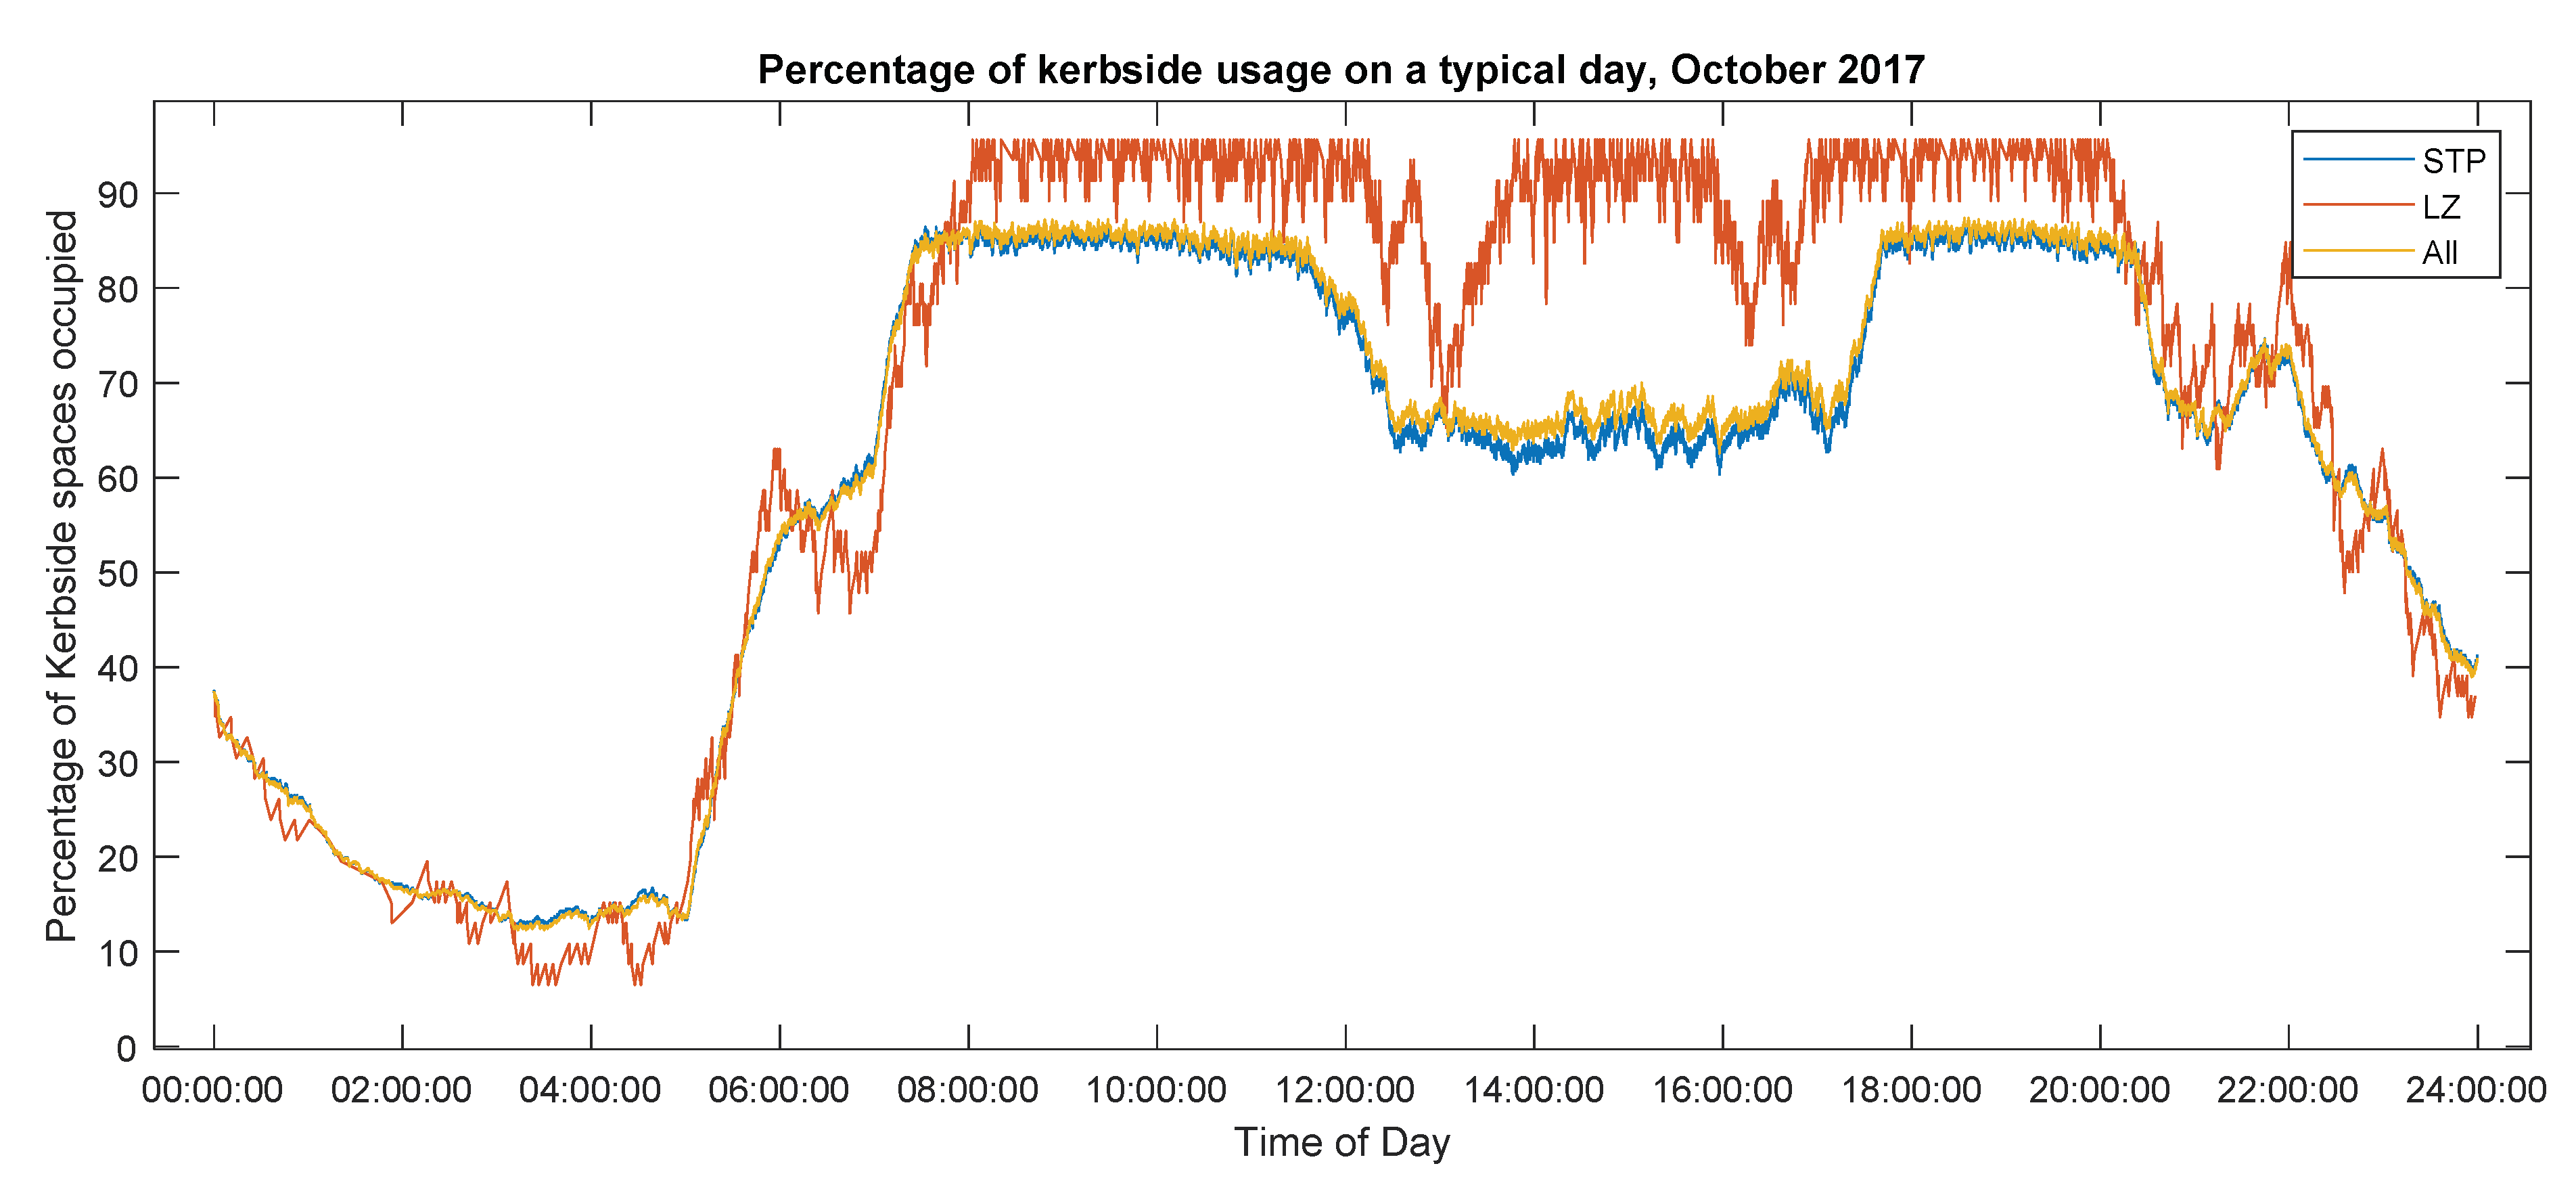
To overcome limitation of scope of manual data collection in 2017 using a few selected parking segments, the camera data of kerbside parking events on the broader scope of parking segments over five workdays were used for the basic analysis of kerbside parking demand and baseline model. Using the 2017 video/camera data collection, a “typical day” parking scenario that utilises 31 STP and 8 LZ parking spaces was constructed for modelling purposes.
The camera dataset was carefully checked for any missing data, overlapping data, and outliers (e.g., parking events with more than 24 h durations). The refinement and checking produced a dataset comprised of typical day behaviour:
Parking events for 84 short-term parking (STP) spaces and 28 loading (LZ) parking spaces in Parramatta CBD;
Arrival time and exit time of each of these parking events, 24 h a day over one week (16–20 October 2017).
This refined dataset is assumed to be a reliable representation of the whole Parramatta CBD kerbside parking space (501 STP and 46 LZ spaces in Parramatta CBD) and was used as the primary input to the Phase 3 simulation model.
4. Modelling and Simulation of Baseline and Kerbside Impact Scenarios
The goal of the simulation modelling is to model (i) current parking demand on kerbside parking spaces in the Parramatta CBD and at the Horwood Place carpark and (ii) kerbside impact scenarios, incorporating expected/forecasted future capacity/demand changes.
A baseline simulation model that represents the current kerbside parking demand around the centre of the CBD and the Horwood Place carpark was developed as the first step. This incorporated both kerbside and carpark usage for a typical day scenario. The simulation model is developed as a discrete-event simulation using hourly parking duration distributions, hourly parking arrival rates, and parking capacities as the main inputs. The simulation modelling platform used was Flexsim [
27], and the analysis of results was performed using MATLAB [
28] and Microsoft Excel.
4.1. Analysis and Modelling of Kerbside Parking Usage
Model inputs on arrival rates and parking durations for kerbside modelling were obtained using camera data of video capture during the one week of 16–20 October as part of the 2017 kerbside assessment [
3]. The kerbside camera dataset consists of parking events on 84 STP and 28 LZ spaces. Parking duration was modelled for all available 2017 weekday kerbside data by evaluating duration distribution for events of each hour.
Appendix B shows the resulting parking distributions thus determined and an example of a parking distribution validation for STP parking zones.
A simulation model of the “typical day” was built using FlexSim. The simulation model was verified against the expected parking usage and arrivals. The typical day scenario was then extended to the baseline simulation model by appropriately evaluating hourly arrival rates to reflect the baseline (2019) kerbside scenario. The baseline kerbside model takes into consideration the kerbside capacity of 501 STP and 46 LZ parking spaces. It is assumed that about 30–45 s is taken/used between parking events. Since the average length of stay on a kerbside parking space (STP and LZ) is around 28 min [
3], this accounts for approximately 8–10% of kerbside parking capacity that is not being utilised. Therefore, it is assumed that 90% utilisation is full kerbside capacity.
4.2. Analysis and Modelling of Carpark Usage
The carpark data (both camera and ticket data) were analysed for hourly arrival rates, parking duration (dwell time) of each event by hourly intervals, and percentage of usage over a five-workday period, the selected day of the week and a typical day of the week as the representatives of a weekday for the baseline model of 2019 parking demand. In this analysis, a synchronised carpark dataset was developed by matching each parking event recorded in the camera dataset and ticket dataset, using key characteristics (e.g., entry/exit times of camera data and parking duration in the ticket dataset) of the parking events of each hour.
Appendix C shows distributions of parking duration of hourly carpark events using synchronised camera/ticket and survey data. Parking events by construction workers are matched with the already synchronised data of camera and ticket data of carpark parking events. The synchronisation of construction worker parking events with ticket/camera data is based on the matching of common measures of respective records. In this case, common measures include:
- (1)
Time in and/or time out of ticket/camera data and time of worker interception on arrival at the carpark or leaving work, allowing about 3–5 min interval between recorded times;
- (2)
Type of vehicle noted by both synchronised and intercept survey records;
- (3)
Parking duration recorded by ticket data and noted in the intercept survey.
The analysis of camera data showed that the carpark has a similar usage across all weekdays, and the intercept survey for 8 May 2019 was a more robust representation of weekday behaviour of construction worker parking activity compared to the 7 May 2019 dataset (which has some missing construction worker intercepts). The Horwood Place carpark parking model was developed by consolidating the results of the intercept survey and camera and ticket data for 08 May 2019. Inputs to the model included hourly arrival rates and parking time distributions (
Appendix C).
4.3. Baseline Model
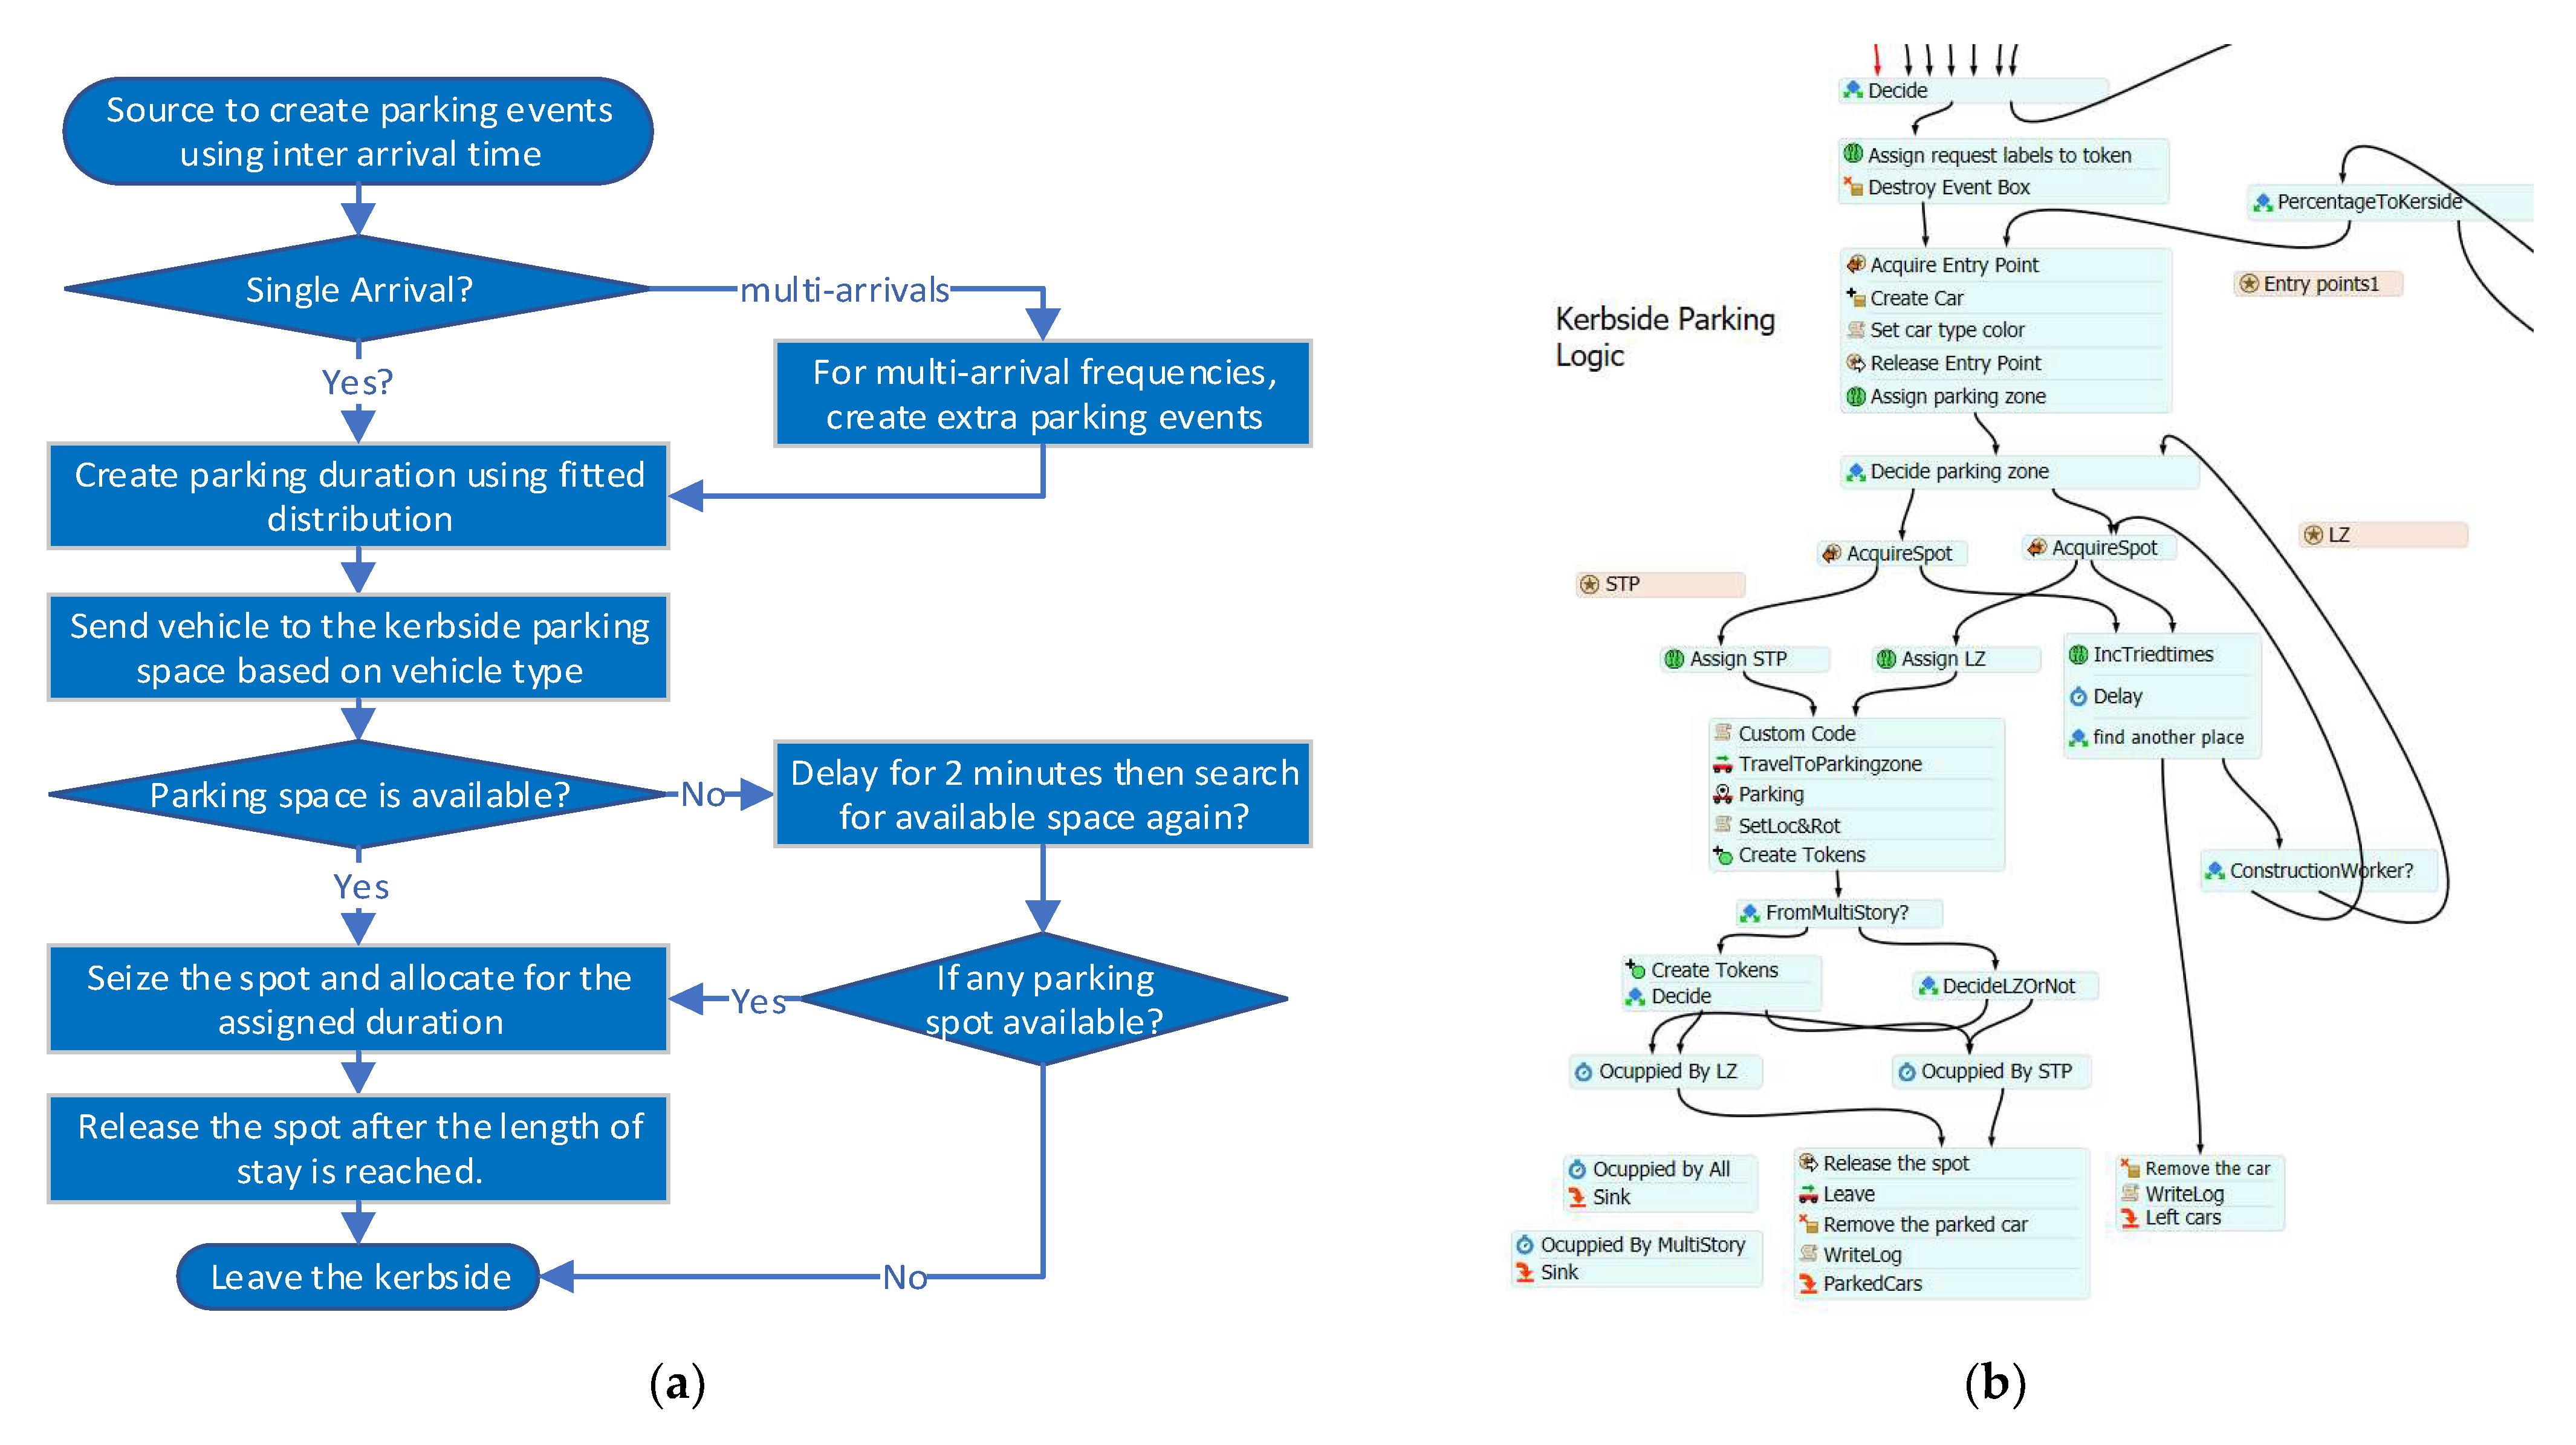
A carpark baseline model was developed on the Flexsim software platform using the overall synchronised dataset. The model was verified using the hourly arrival rates and parking durations of the events generated by the simulation models. The baseline simulation model reflects the current parking scenario for kerbside parking segments around the centre of the Parramatta CBD and the Horwood Place carpark. The traffic/parking simulation baseline model was developed as a discrete-event simulation using hourly parking duration distributions, hourly parking arrival rates, and parking capacities as the main inputs. The parking duration is modelled by evaluating all available weekday kerbside parking data by evaluating the parking duration distribution for parking events of each hour. The kerbside parking logic and baseline traffic/parking simulation models are shown in
Figure 2.
4.4. Modelling of Impact Scenarios
Kerbside impact scenarios (
Table 1) are modelled by extending the baseline model using the forecast of the growth of construction activities, population and freight activities, and capacity changes for the six years from 2020 to 2025.
The estimated population growth in the Parramatta CBD is shown in
Table 2. The year-to-year demand growth of kerbside parking is projected using the population growth rate [
29].
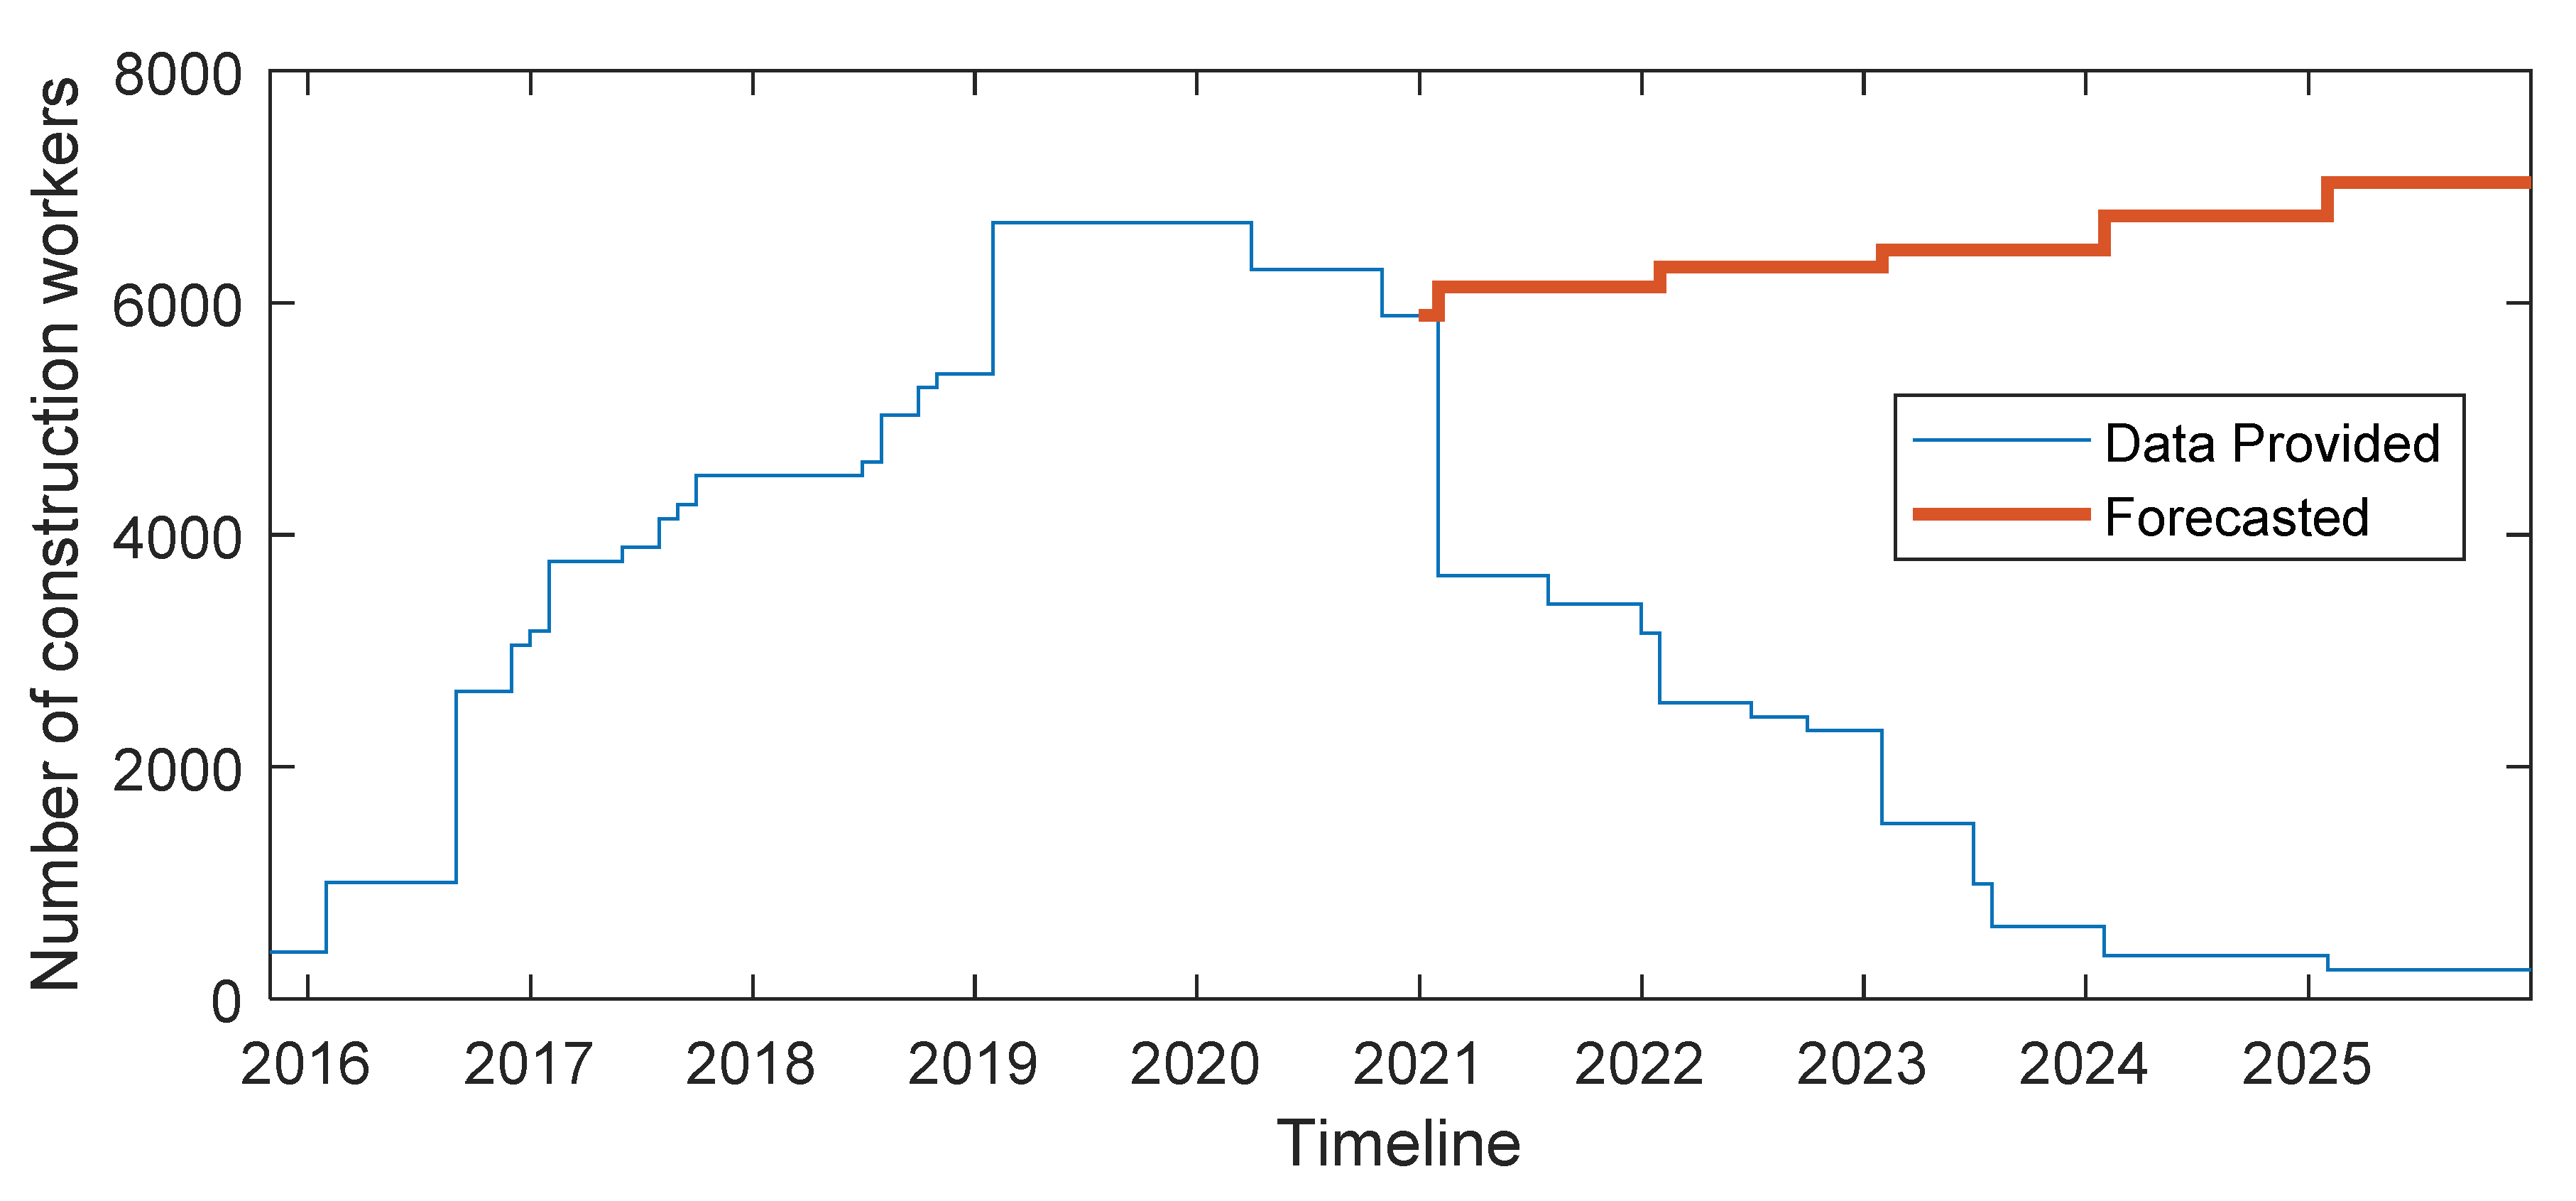
According to TfNSW’s growth estimation, an increase in freight and servicing activity is assumed to be 10–15% annually from 2019 to 2025. Therefore, a 12.5% increase in demand due to freight and servicing is assumed for each year. The construction worker forecast was developed for the period 2020–2025 and is shown in
Figure 3. The year-to-year growth rate developed was used in predicting the number of construction workers who may use the carpark if available.
Since the methodology involved a set of datasets, collected through a manual survey and video-captured camera data over two different timeframes and synchronised using carefully selected methods as outlined above, a number of assumptions were made and limitations were noted. Those assumptions and limitations are given in
Appendix D.
5. Results
Parking data were analysed under two areas of investigation:
- (1)
Analysis of current parking demand on kerbside and carpark, including construction worker demand using intercept survey;
- (2)
Analysis of both current and future parking demand, including kerbside impact scenarios influenced/generated by construction activities and population and freight activity growth in the future (2020–2025), using traffic/parking simulation models.
The current parking demand was analysed using qualitative and quantitative methods, including patterns of parking behaviour and observations. The results of the simulation of kerbside impact scenarios were analysed using key analytical/statistical measures and illustrations.
5.1. Construction Worker Intercept Survey Data Analysis and Results
Results of construction worker intercept survey data are presented using analysis of information gathered under each question, and the observations are presented below.
5.1.1. Intercept Survey Results by Each Survey Question
The difference of responses between the two days in
Table 3 can be attributed to the fact that some of the “No” responses were not recorded on the first day. The low response rate of the first day can be explained by the fact that the second 3 h survey window was from 11 a.m. to 2 p.m., which was one hour earlier than the second day. As such, the second-day dataset is assumed as the best representative of the weekday behaviour of construction worker parking in the Parramatta CBD.
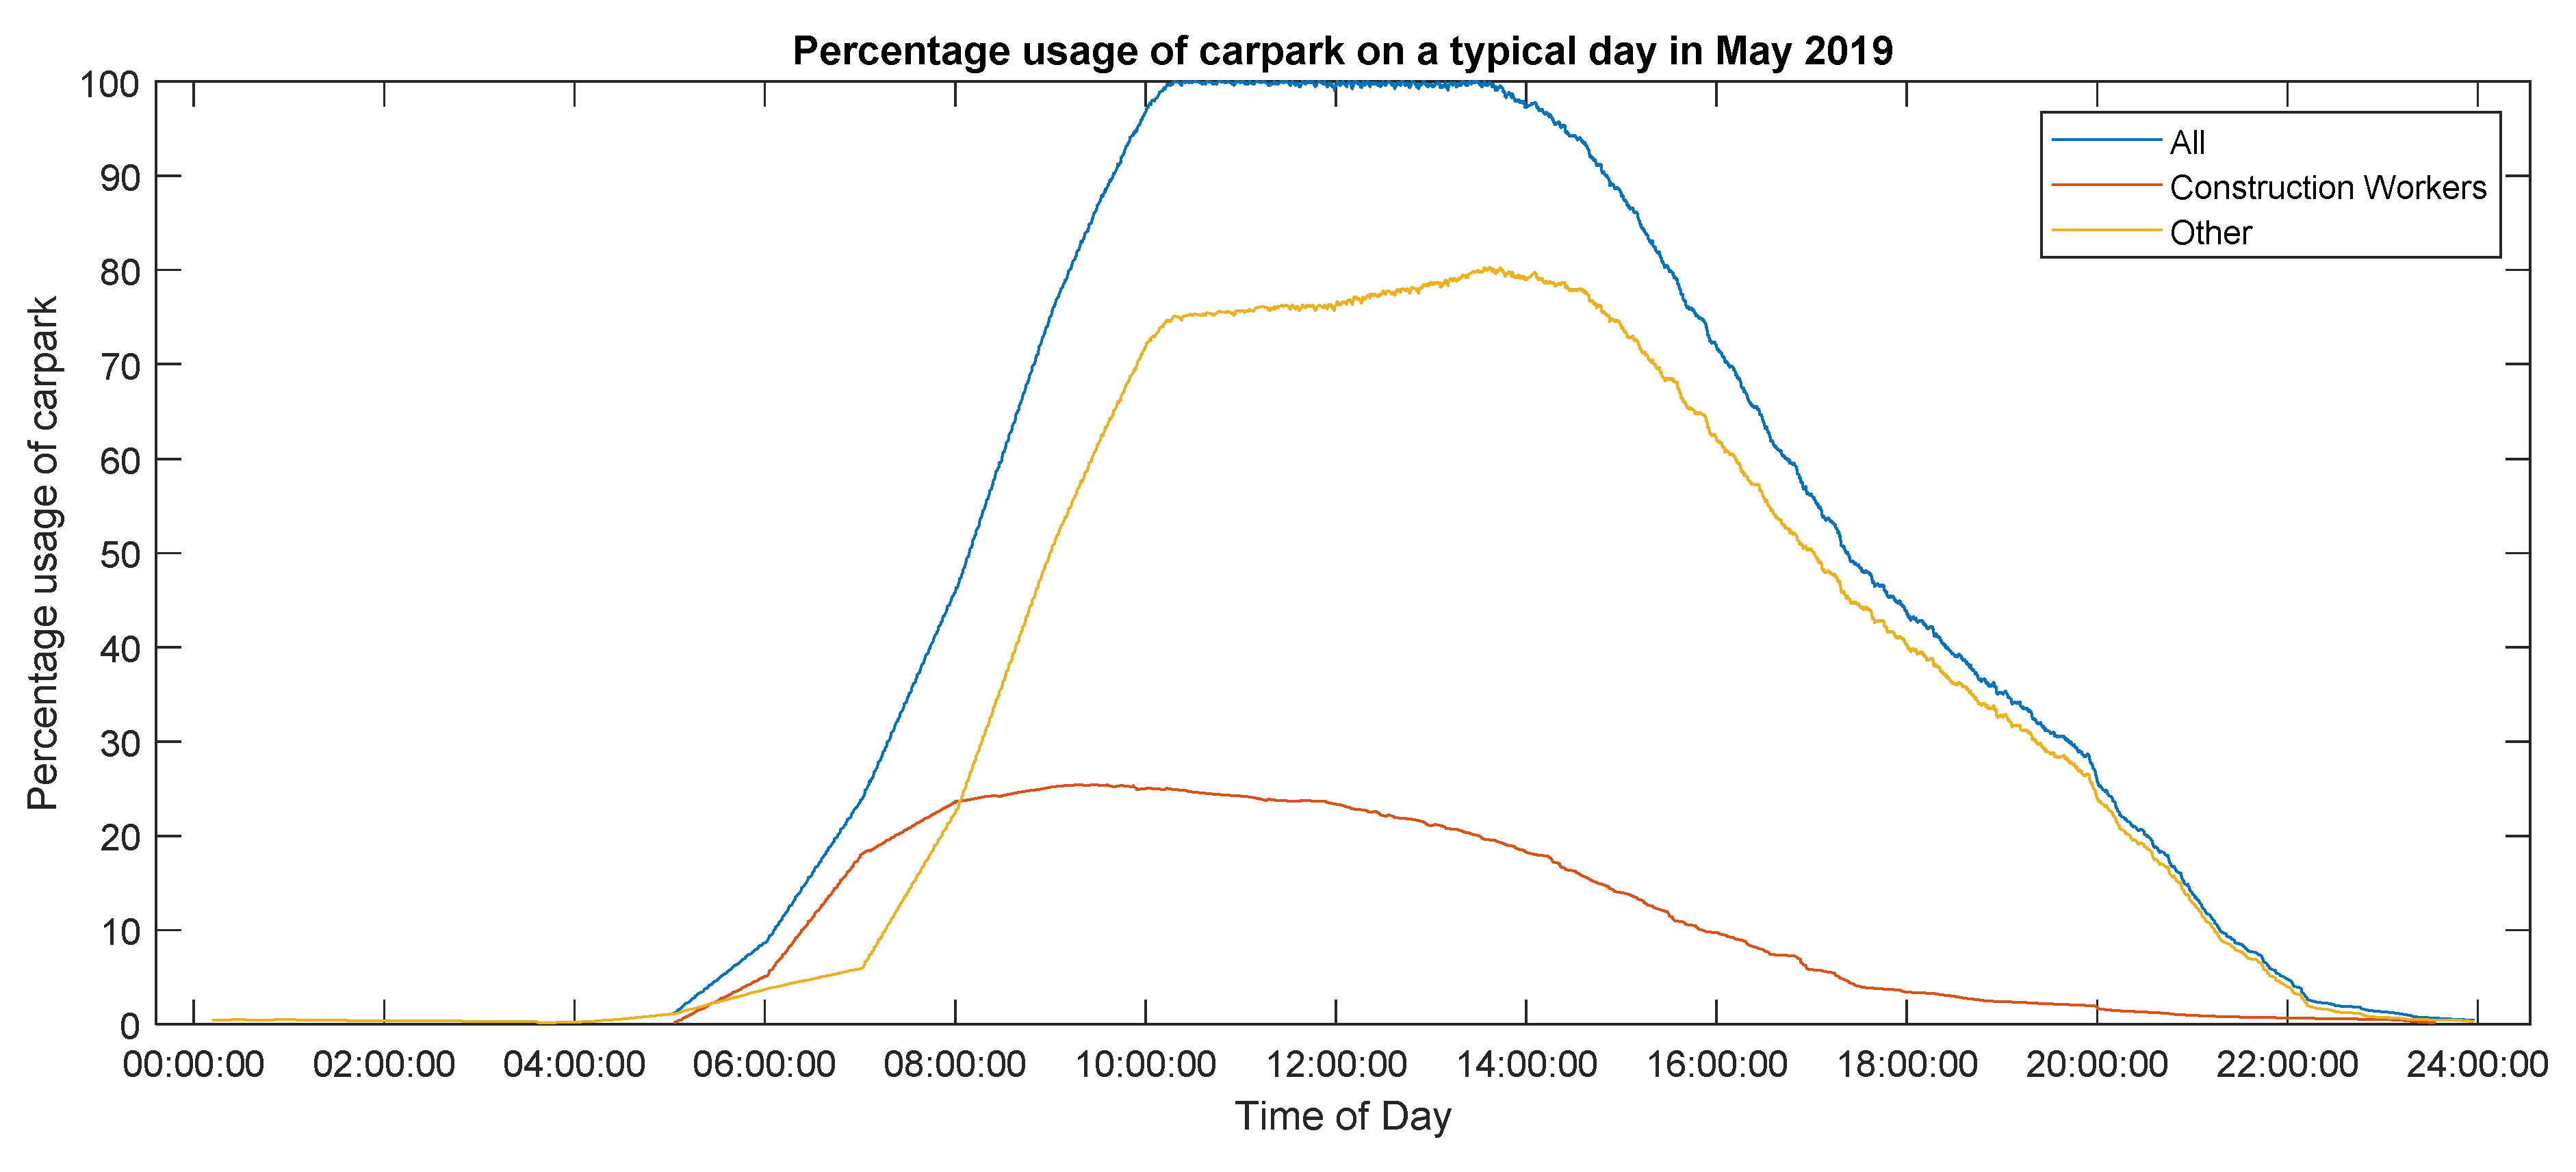
It was also noted that the utilisation of the carpark by construction workers is significant, which is about 28% of total carpark capacity, based on the 8 May dataset. It was also noted that more than 50% of workers intercepted (110 out of 214 on the second day) were willing to participate in the survey. We also observed a considerable number of users carpooling to their worksite. However, our survey did not capture all users of a single vehicle, rather only one user of the pooled vehicle. This means that the total number of intercepted workers does not represent the total number of construction workers using the carpark. Overall, responses to the consent to participate in the survey were very positive, with an overall agreement of around 53%, ranging from 56% on 7 May and around 51% on 8 May. The slight difference in agreement between the two days is attributed to not recording some of the “No” responses on 07 May.
- b.
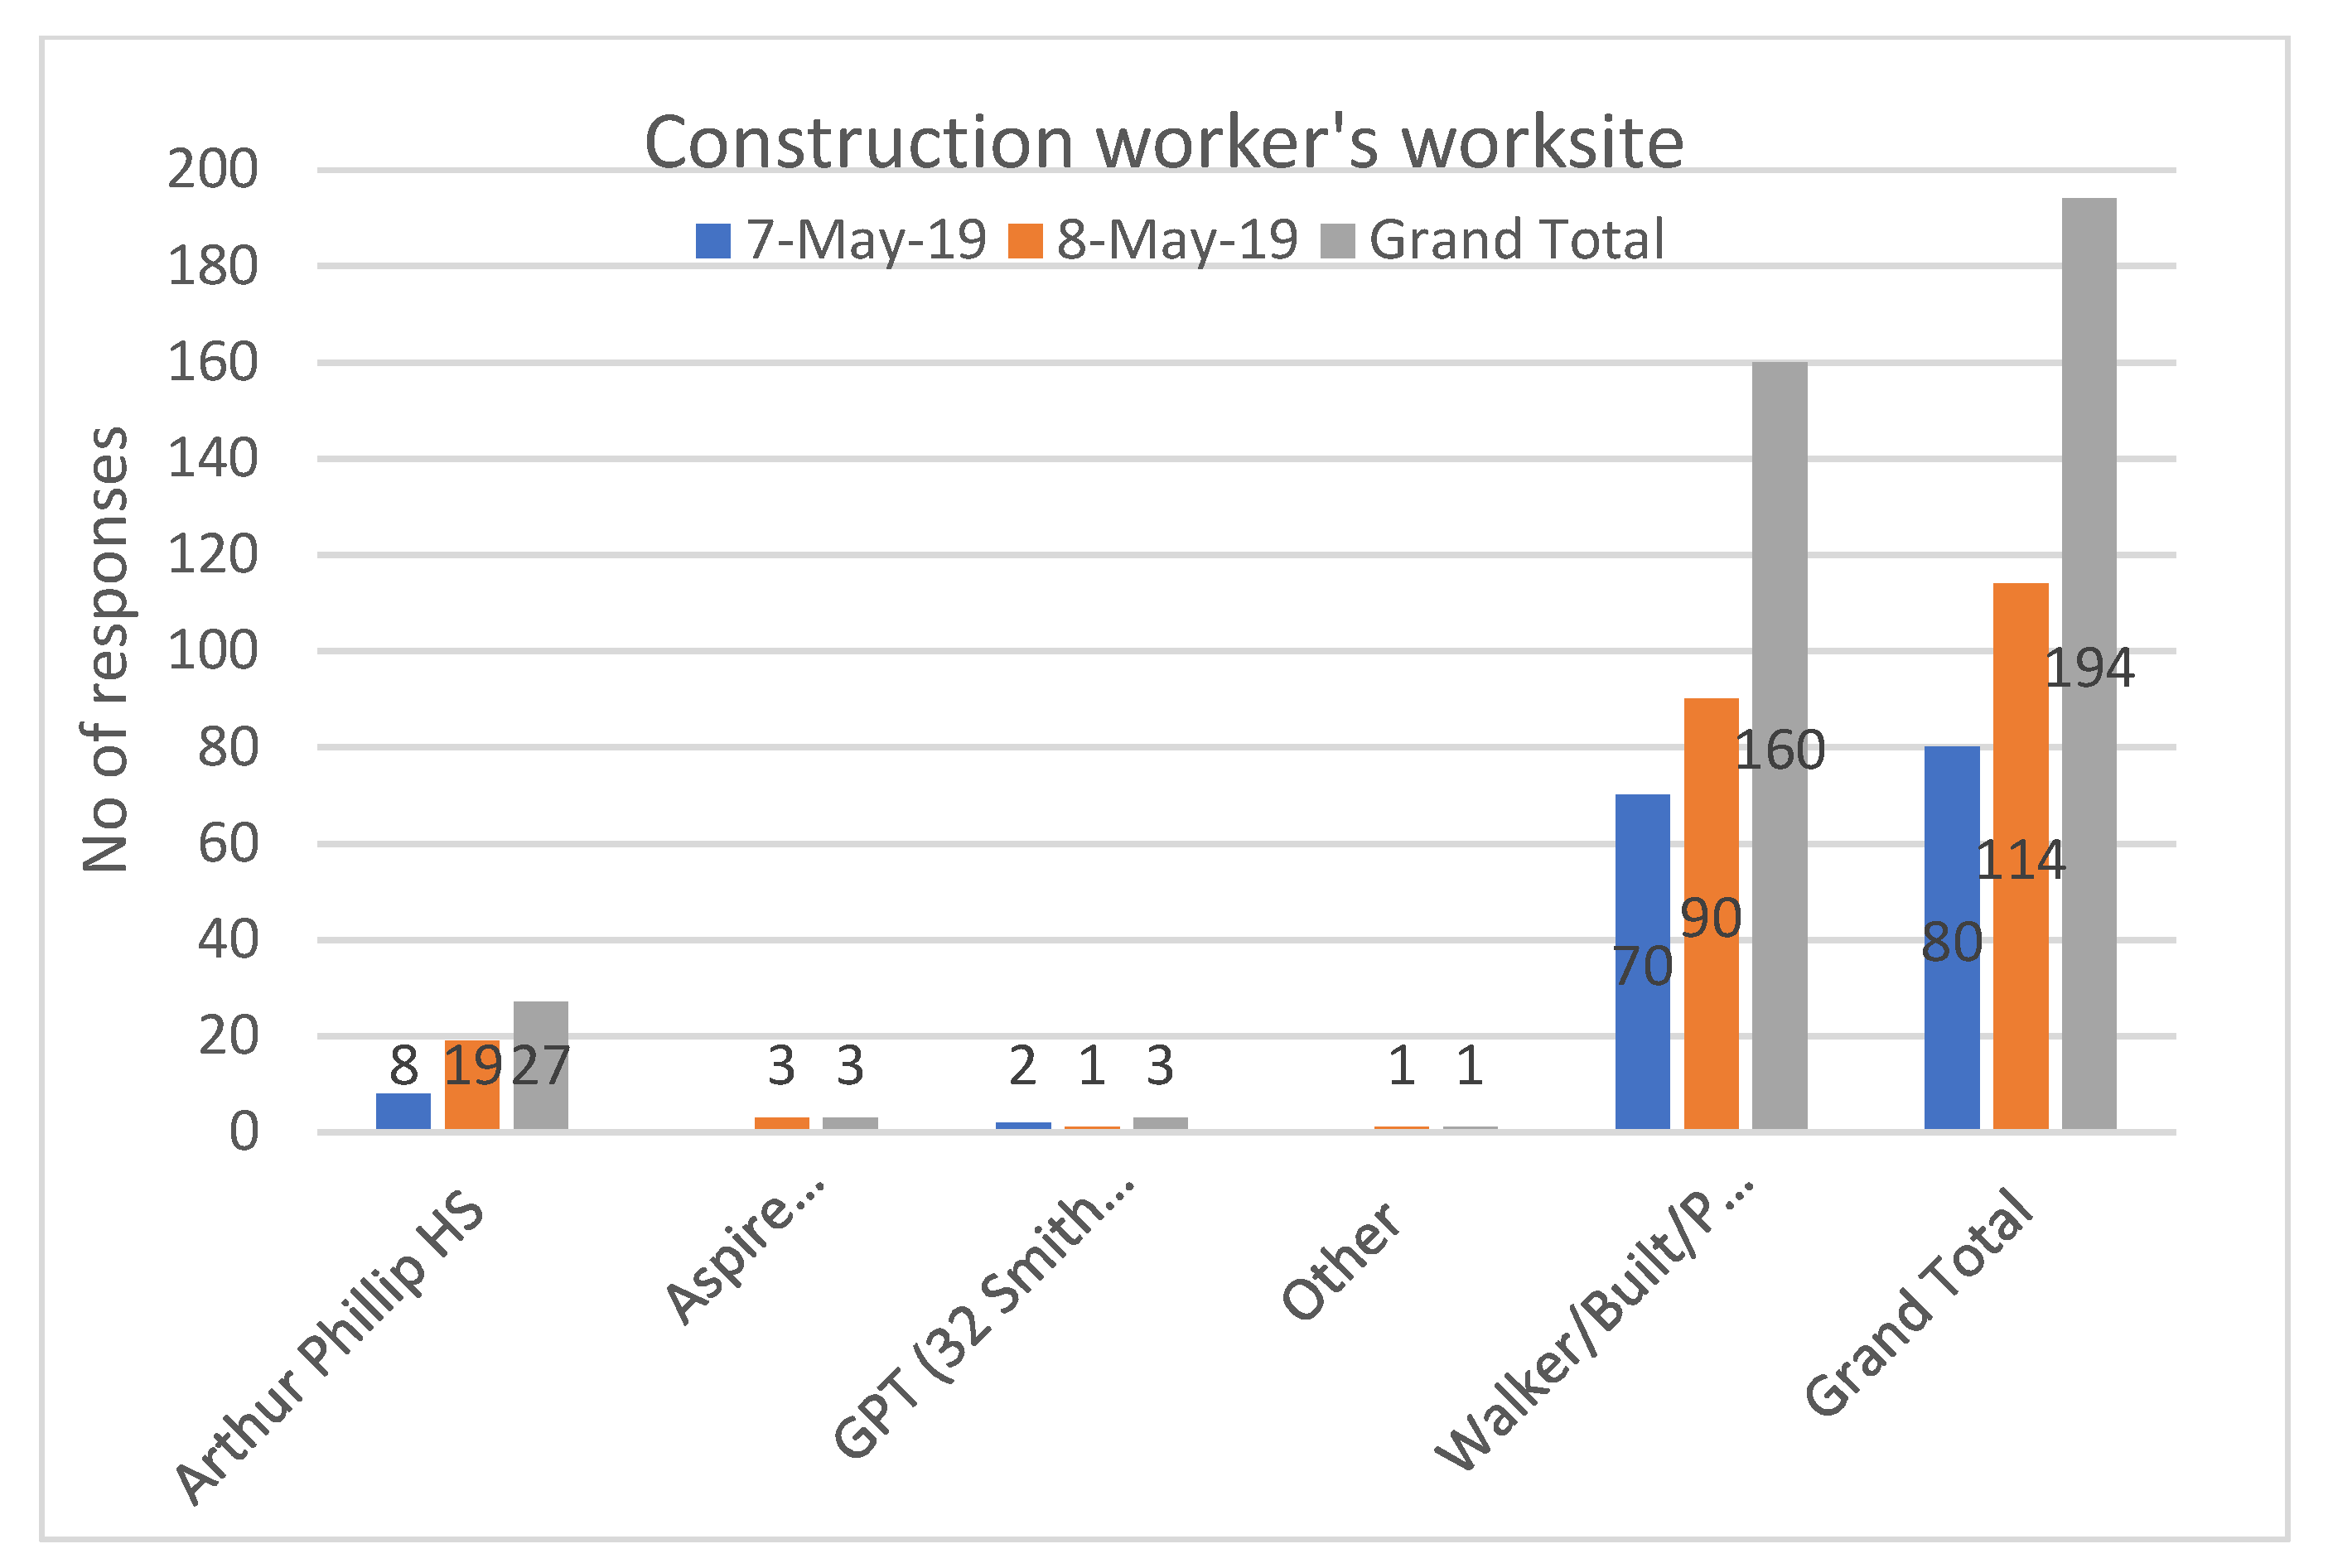
Construction worker worksite: What construction site are you coming from/going to?
The purpose of this question is to capture the construction worker’s worksite (included a few options, including main sites around Horwood Place carpark).
Figure 4 shows the distribution of responses to this question.
The majority of workers worked at the Walker/Built/PSQ site (82%), followed by the Arthur Phillip High School site (14%). This could be mainly due to the proximity of the site and the large number of workers in each site. The carpark’s proximity to these worksites makes carrying tools much easier.
- c.
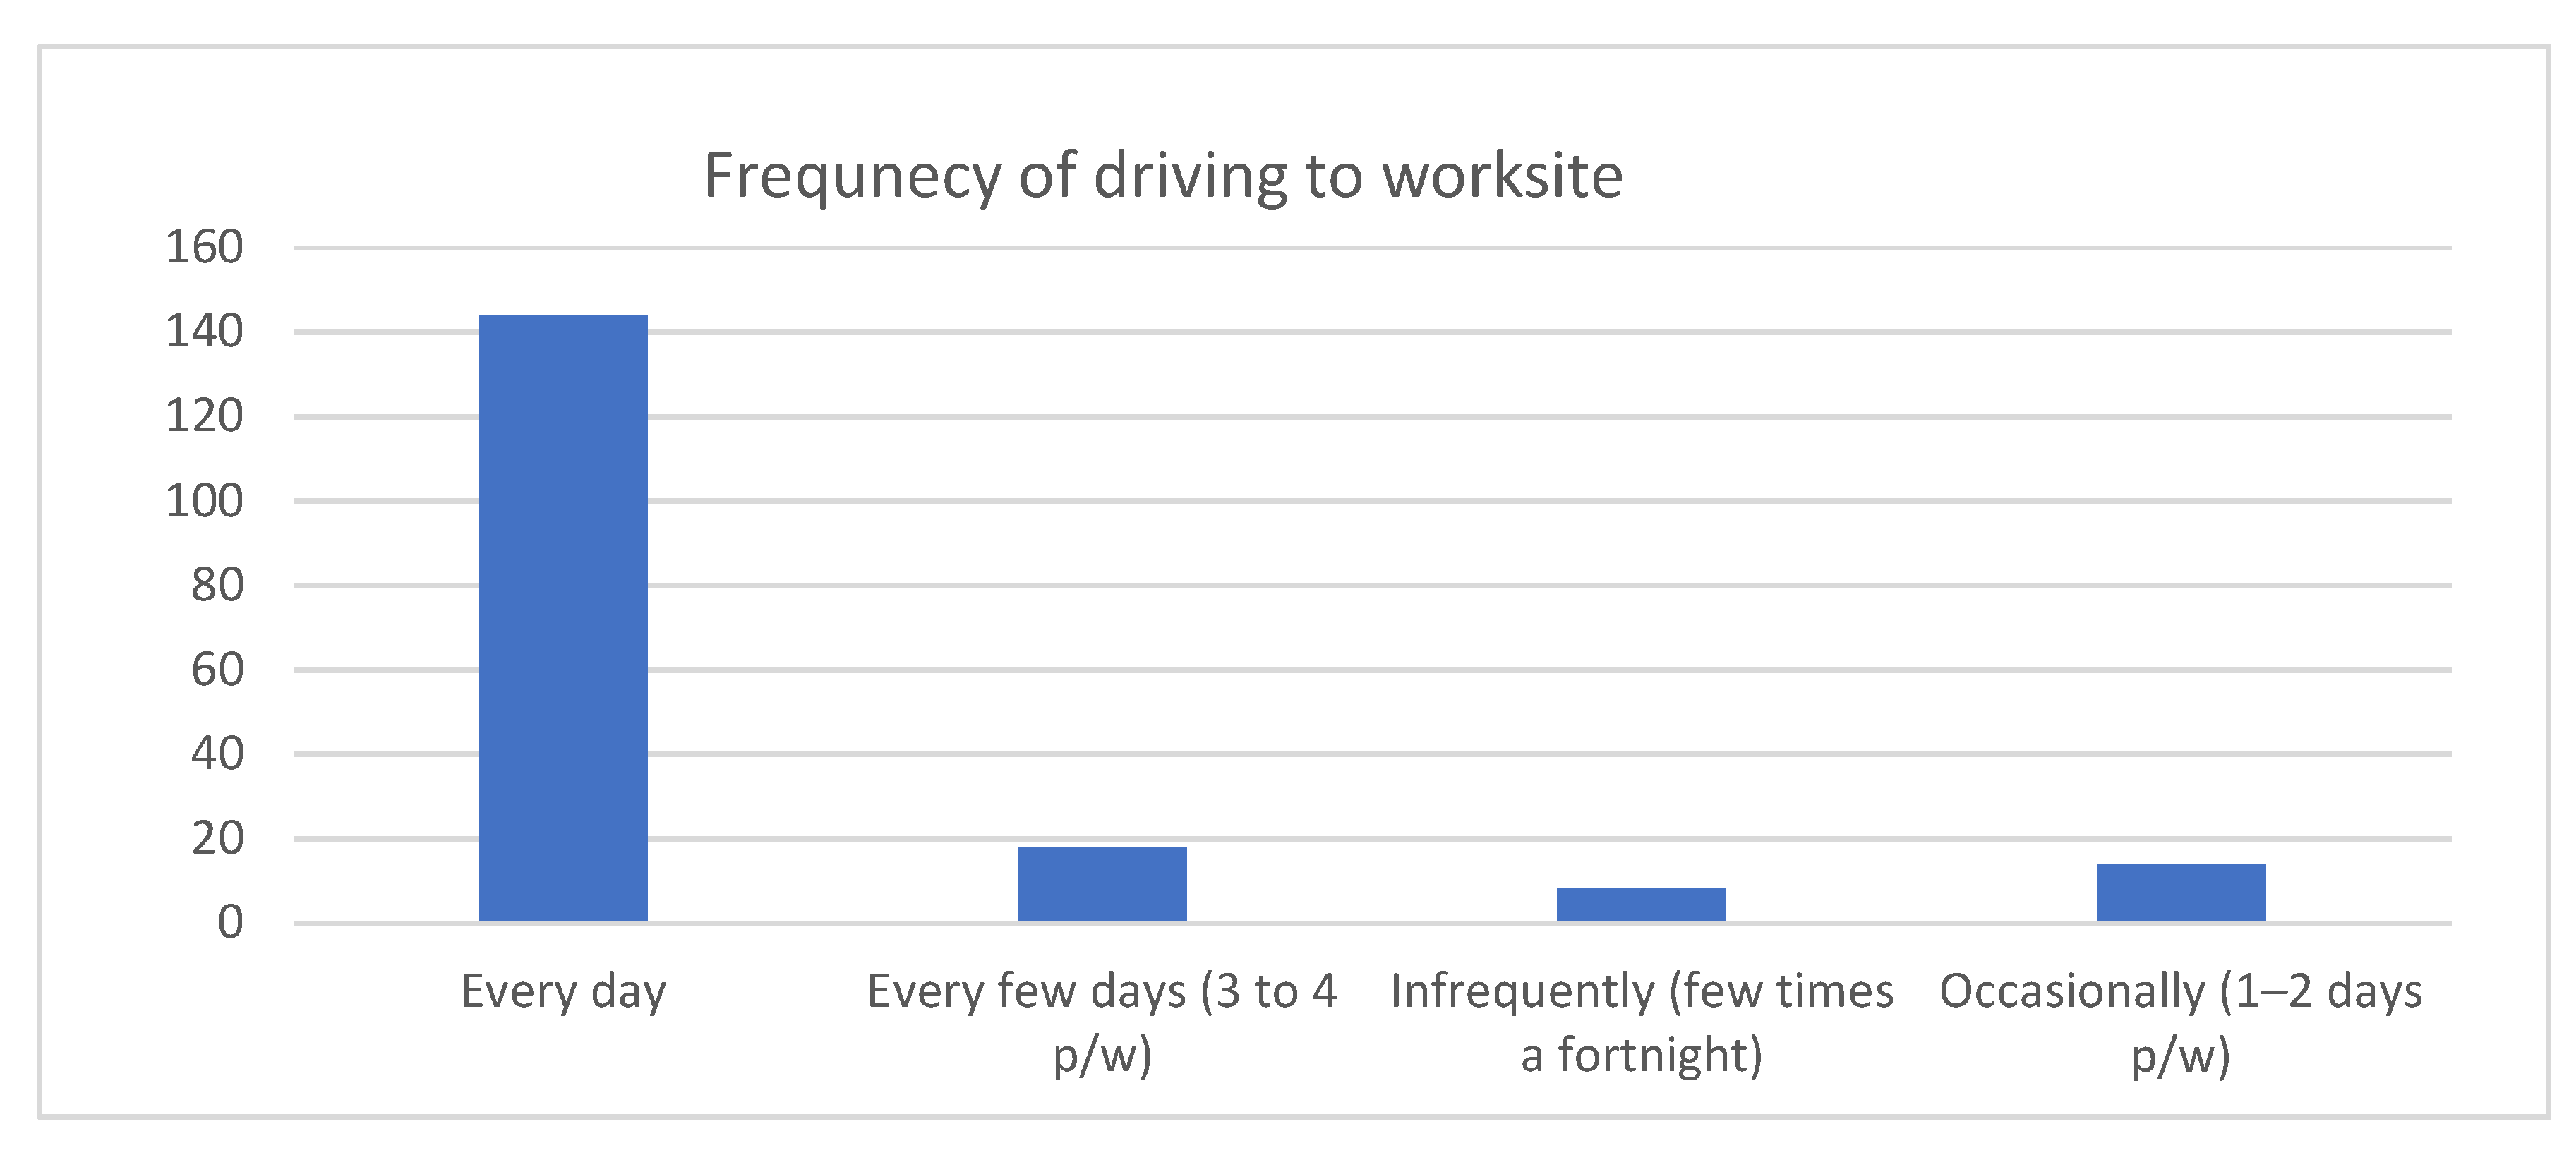
Frequency of driving to the site: How often do you drive to site?
The majority of construction workers were driving to their worksite every day (78%), as illustrated in
Figure 5. The percentage of workers driving to their worksite for three or more days is about 88%. Therefore, it can reliably be assumed that the daily construction worker parking behaviour (i.e., hours of parking) is a good representation of weekday behaviour.
Based on the 8 May results, about 28% of the carpark was occupied by construction workers. The majority of them worked at the PSQ site (about 83%) and arrived before 7 a.m. Construction workers who used the carpark parked there every day more than 78% of the time. At least 75% of construction workers used the carpark for more than 6 h.
- d.
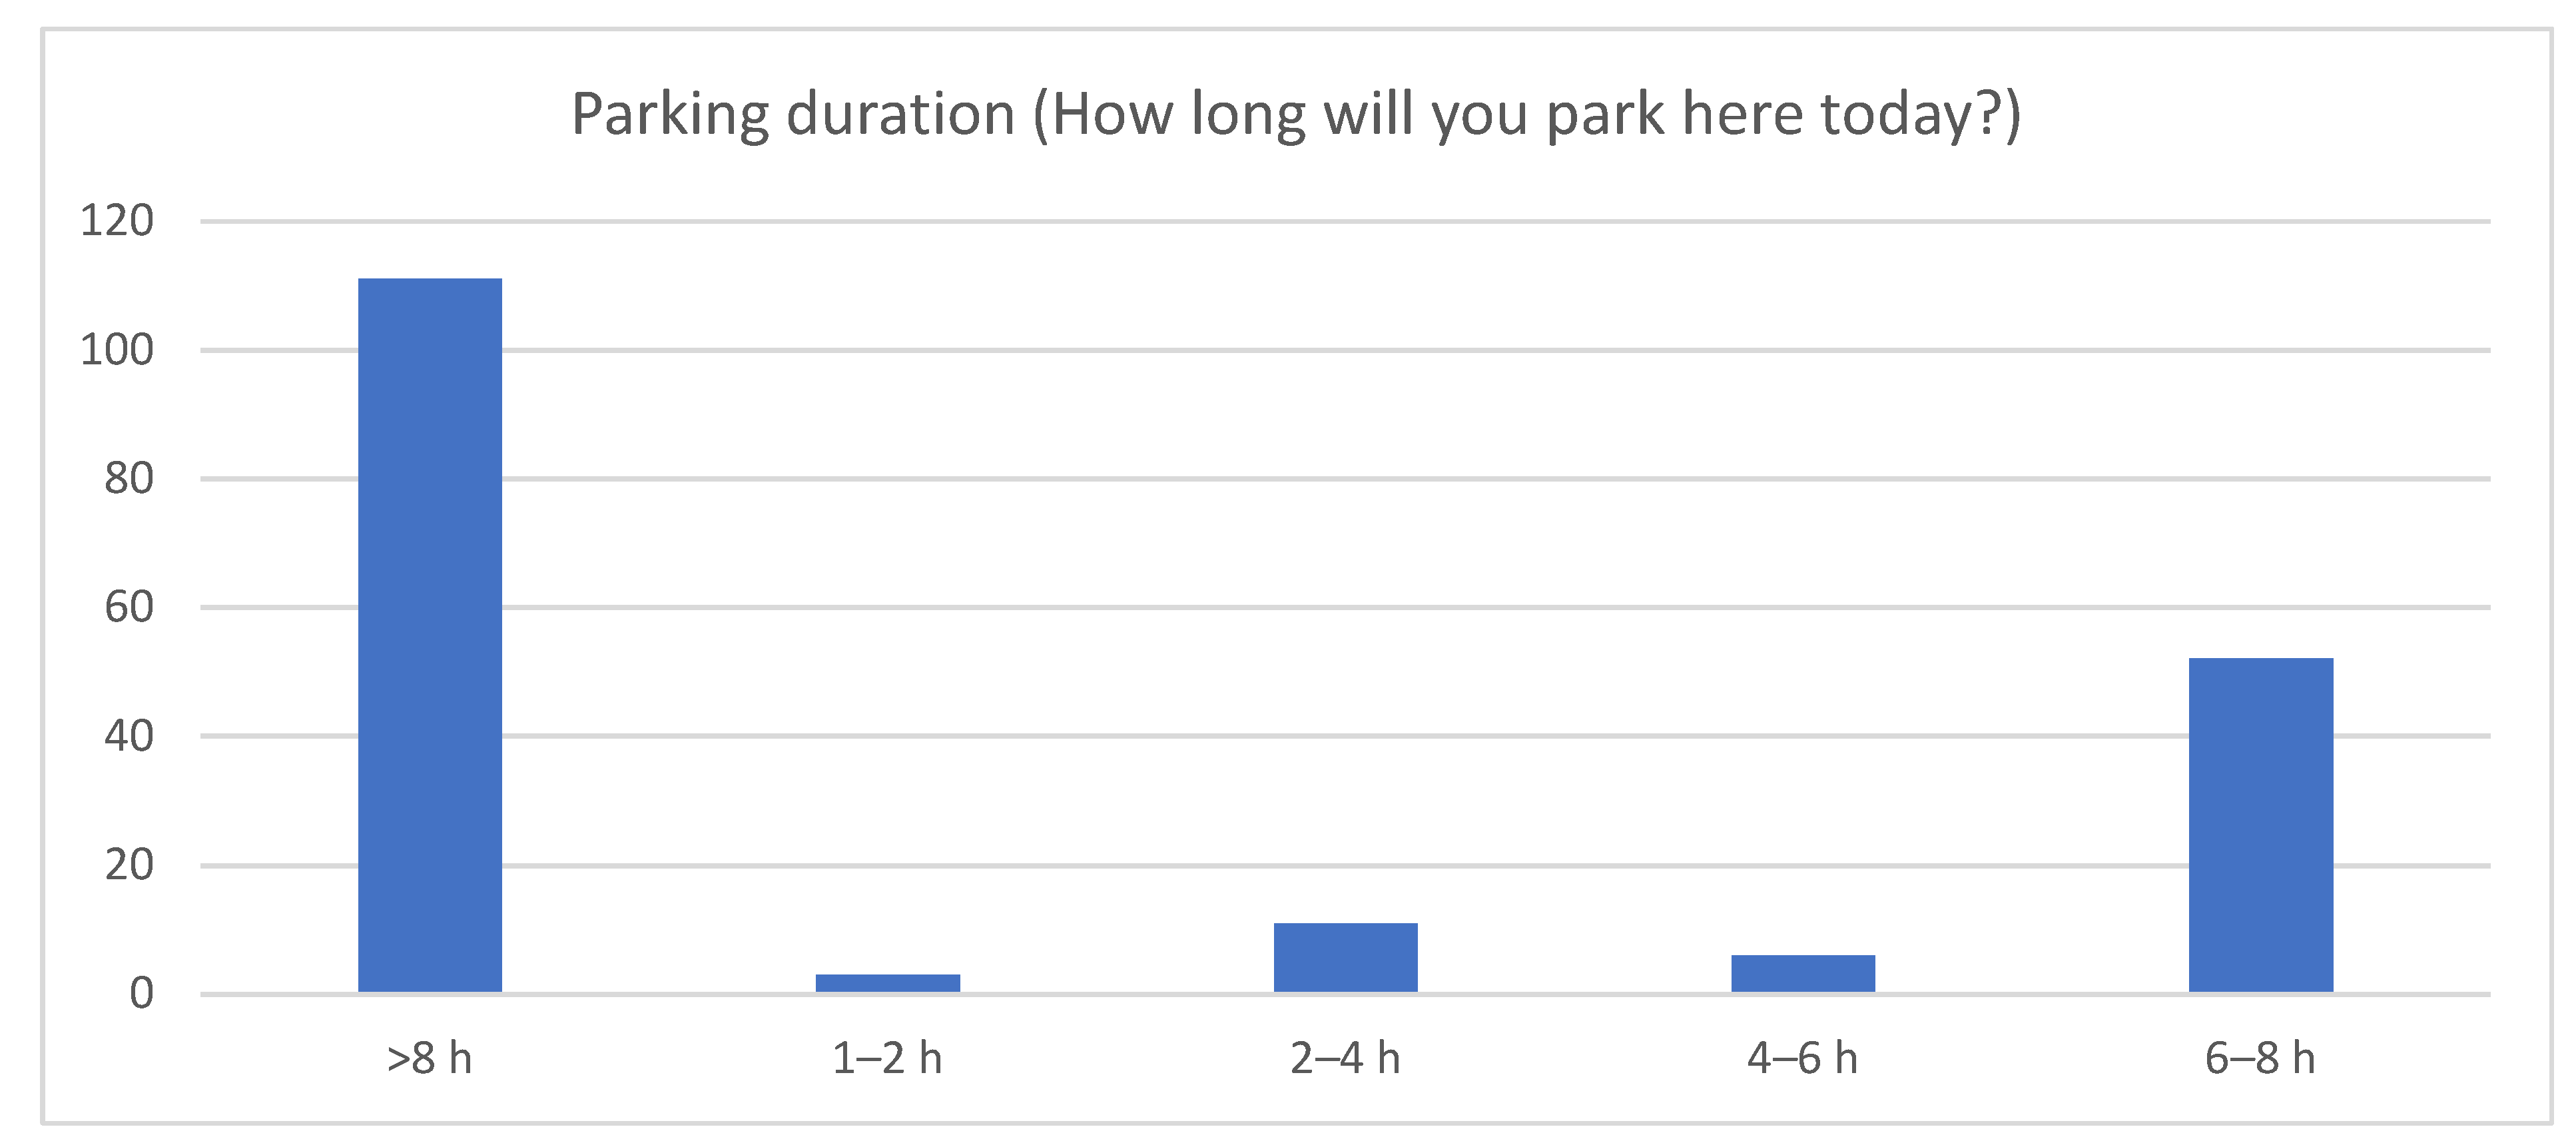
Parking duration: How long will you park here today?
As shown in
Figure 6, a significant number of construction workers parked for more than 6 h and accounted for 89% of intercepted workers, including 61% parking for more than 8 h. Considerable parking activity was also observed before the start of the intercept data collection at 6 a.m. on both days. Overall, there were 50 to 55 vehicles parked at the carpark by 5:50 a.m. and 5:55 a.m., respectively, on 08 May. Thus, it is reasonable to assume that 50–60 vehicles park from 5:00 a.m. to 6:00 a.m., and the majority of those cars are parked by construction workers. Based on the information that 61% of construction workers were parking for more than 8 h, it is reasonable to assume a majority of those who arrived between 5 and 6 a.m. are construction workers and park for more than 8 h. Therefore, construction worker arrivals are purely based on intercept data and observations (e.g., 5 a.m. to 6 a.m.) using the 8 May 2019 data. It can be noted from the above analysis of all vehicle and construction worker arrivals that construction workers use around a quarter of the capacity of the carpark during the peak time.
- e.
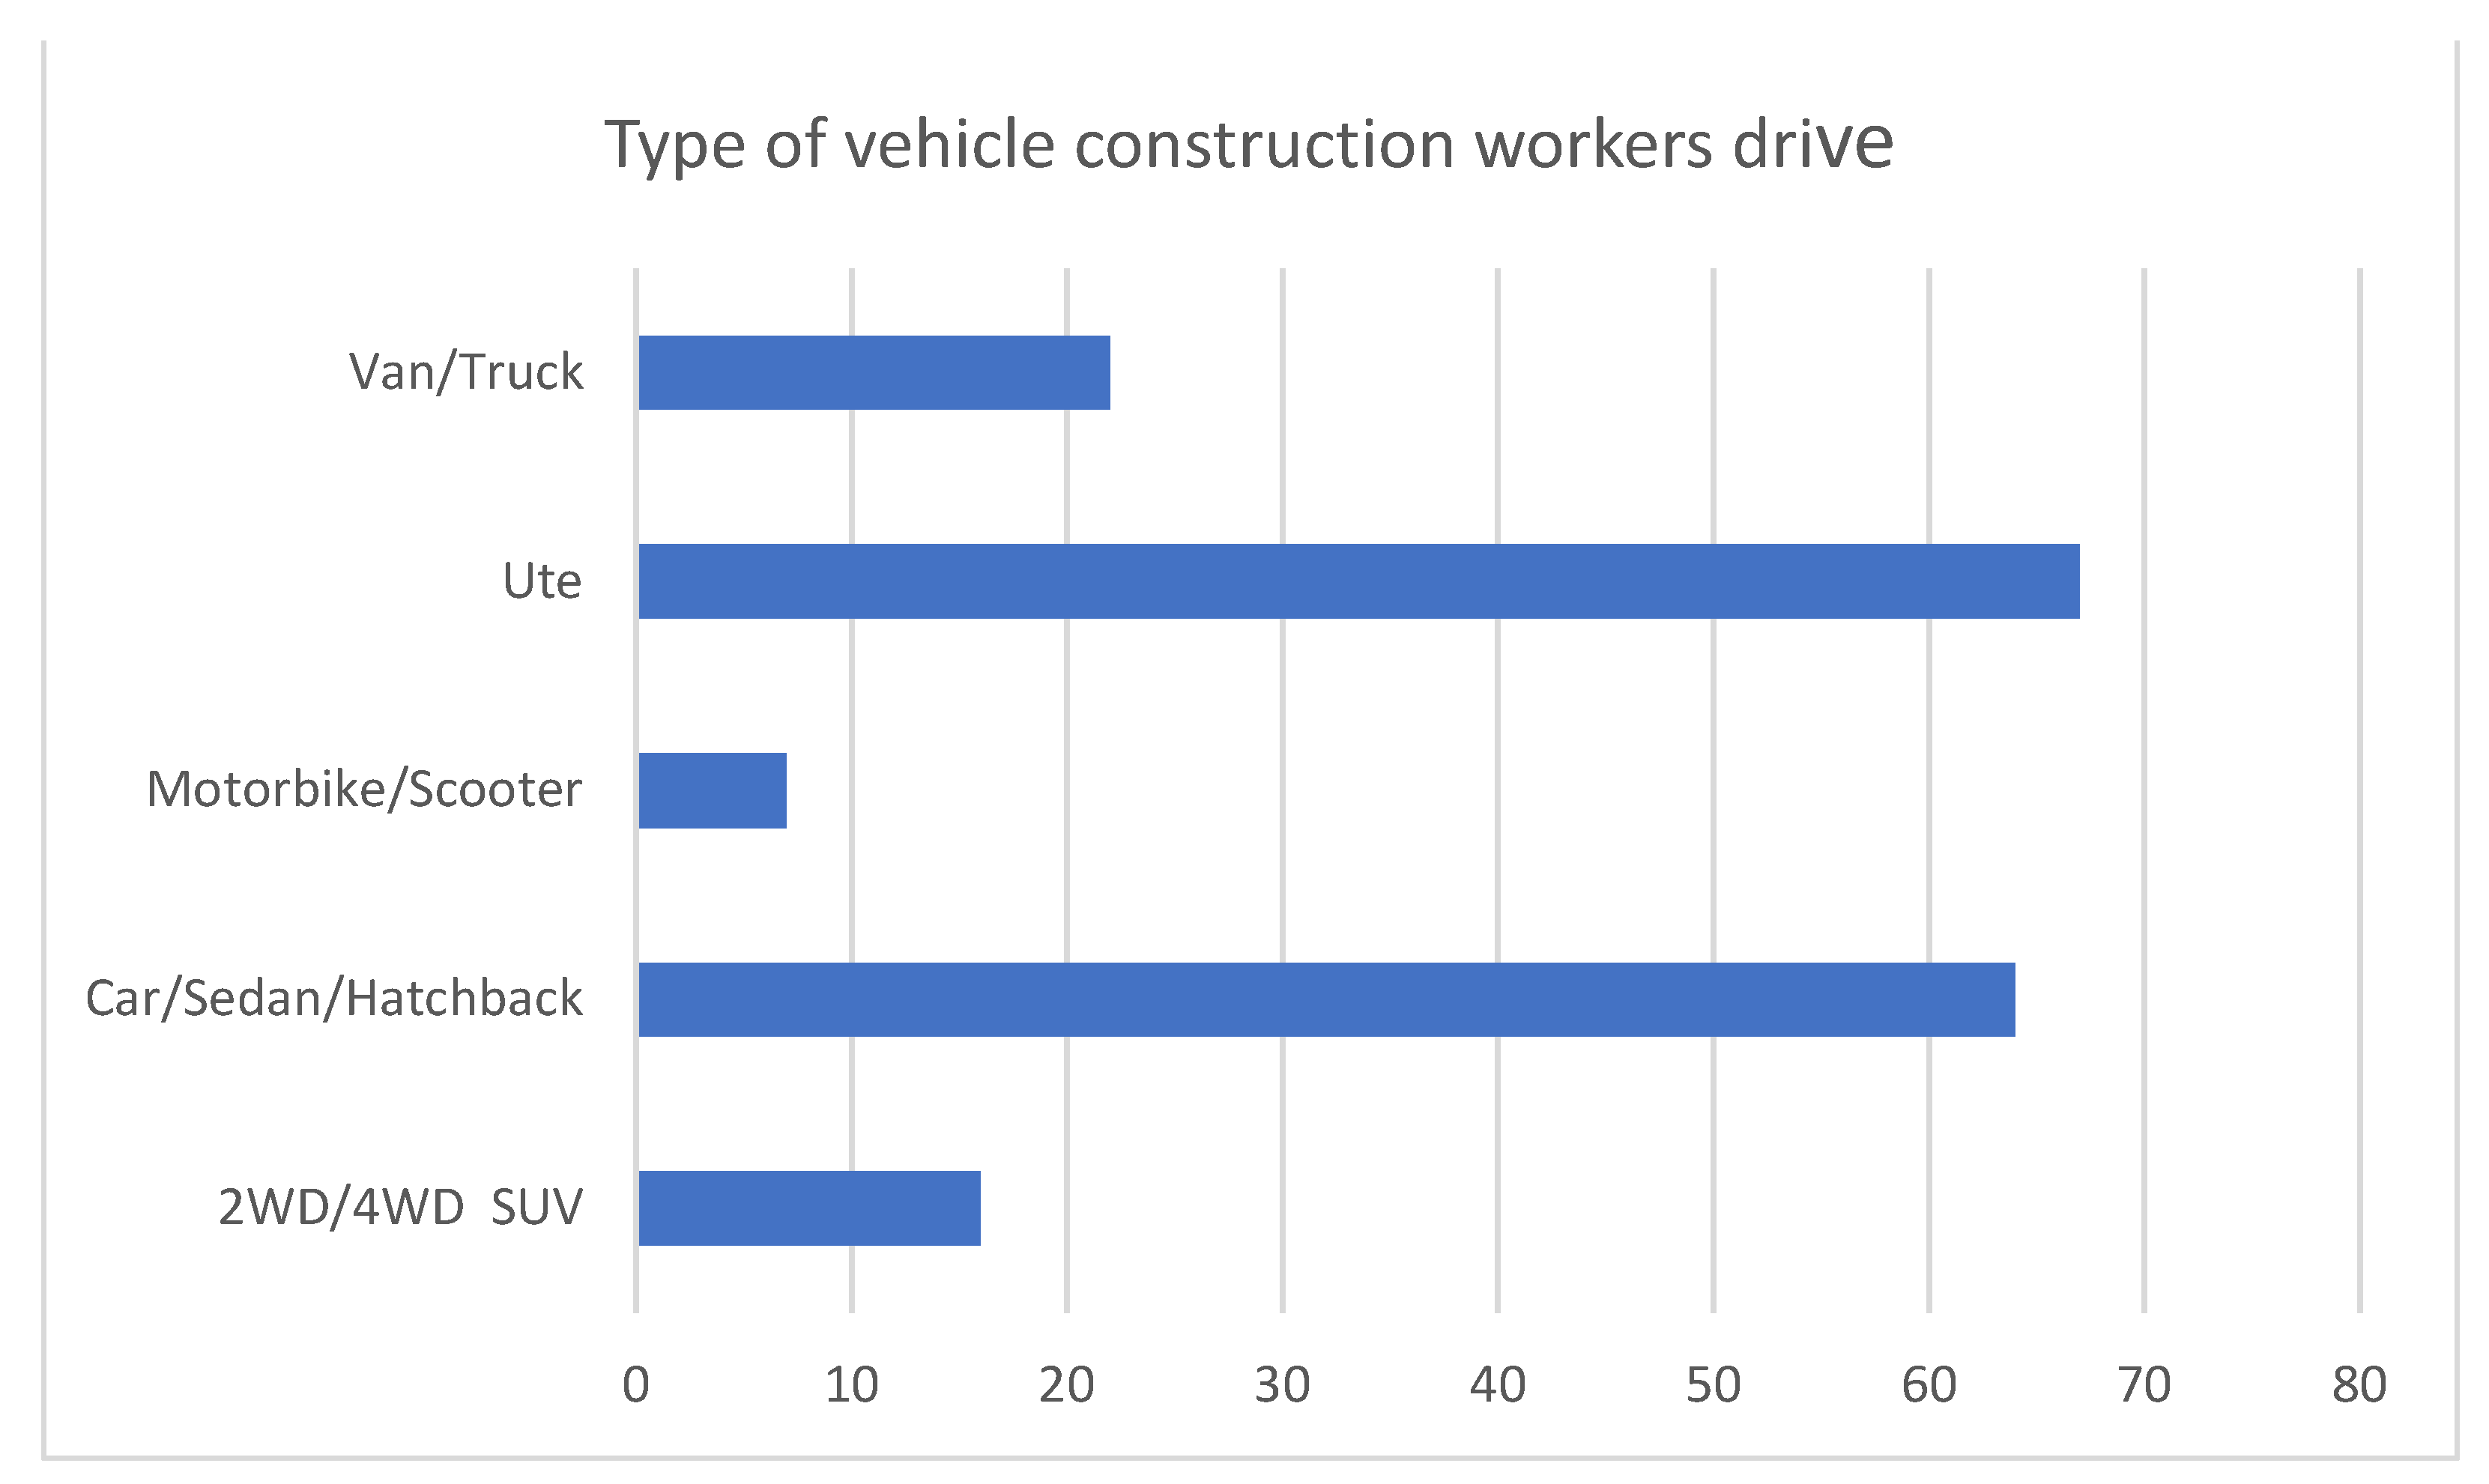
Vehicle type: What sort of vehicle do you drive?
This question aims to explore any noticeable pattern by the type of vehicle for different purposes, including carrying heavy tools.
Figure 7 shows that the utes (utility vehicles) represent the largest proportion vehicle type, very closely followed by car/sedan/hatchback. When vehicle types are categorised into two groups: commuter (car/sedan/hatchback and motorbike/scooter) and large vehicles (van/truck and 2WD/4WD/SUV), 60% of construction workers use large vehicles. To some extent, this complements the observation of some construction workers carrying tools to their worksite.
- f.
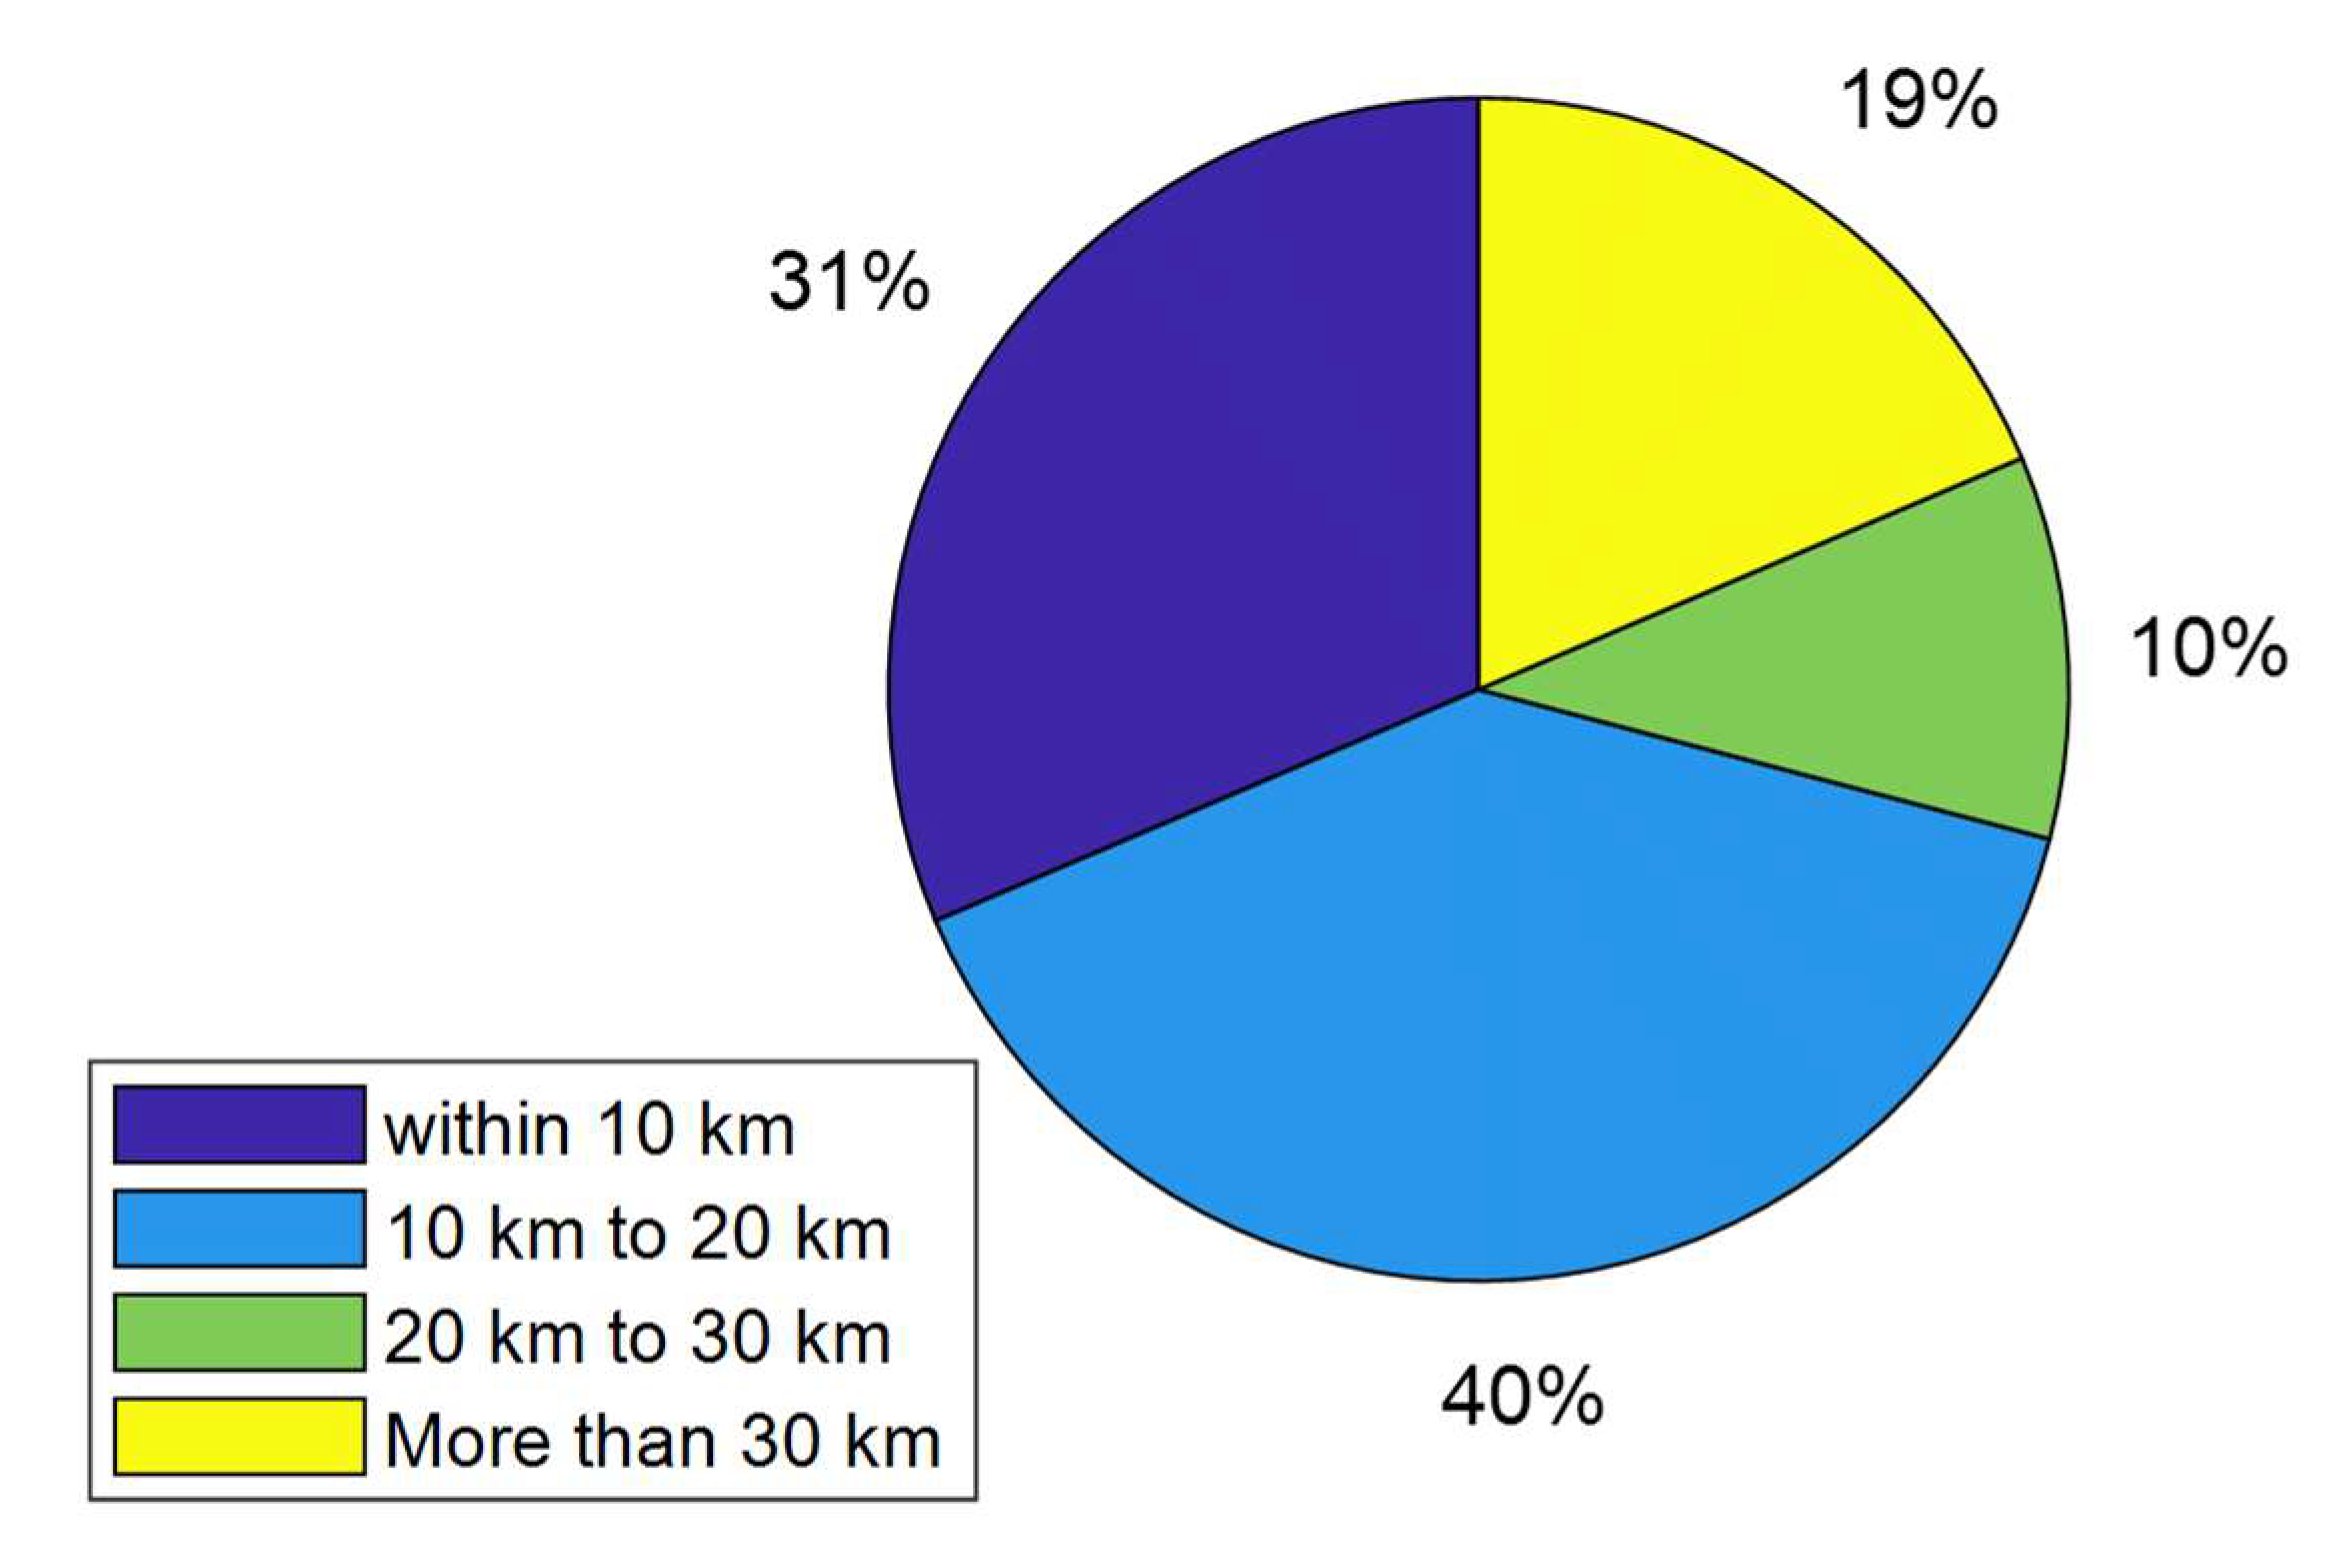
Travel distance: Can you tell us what postcode you drove from?
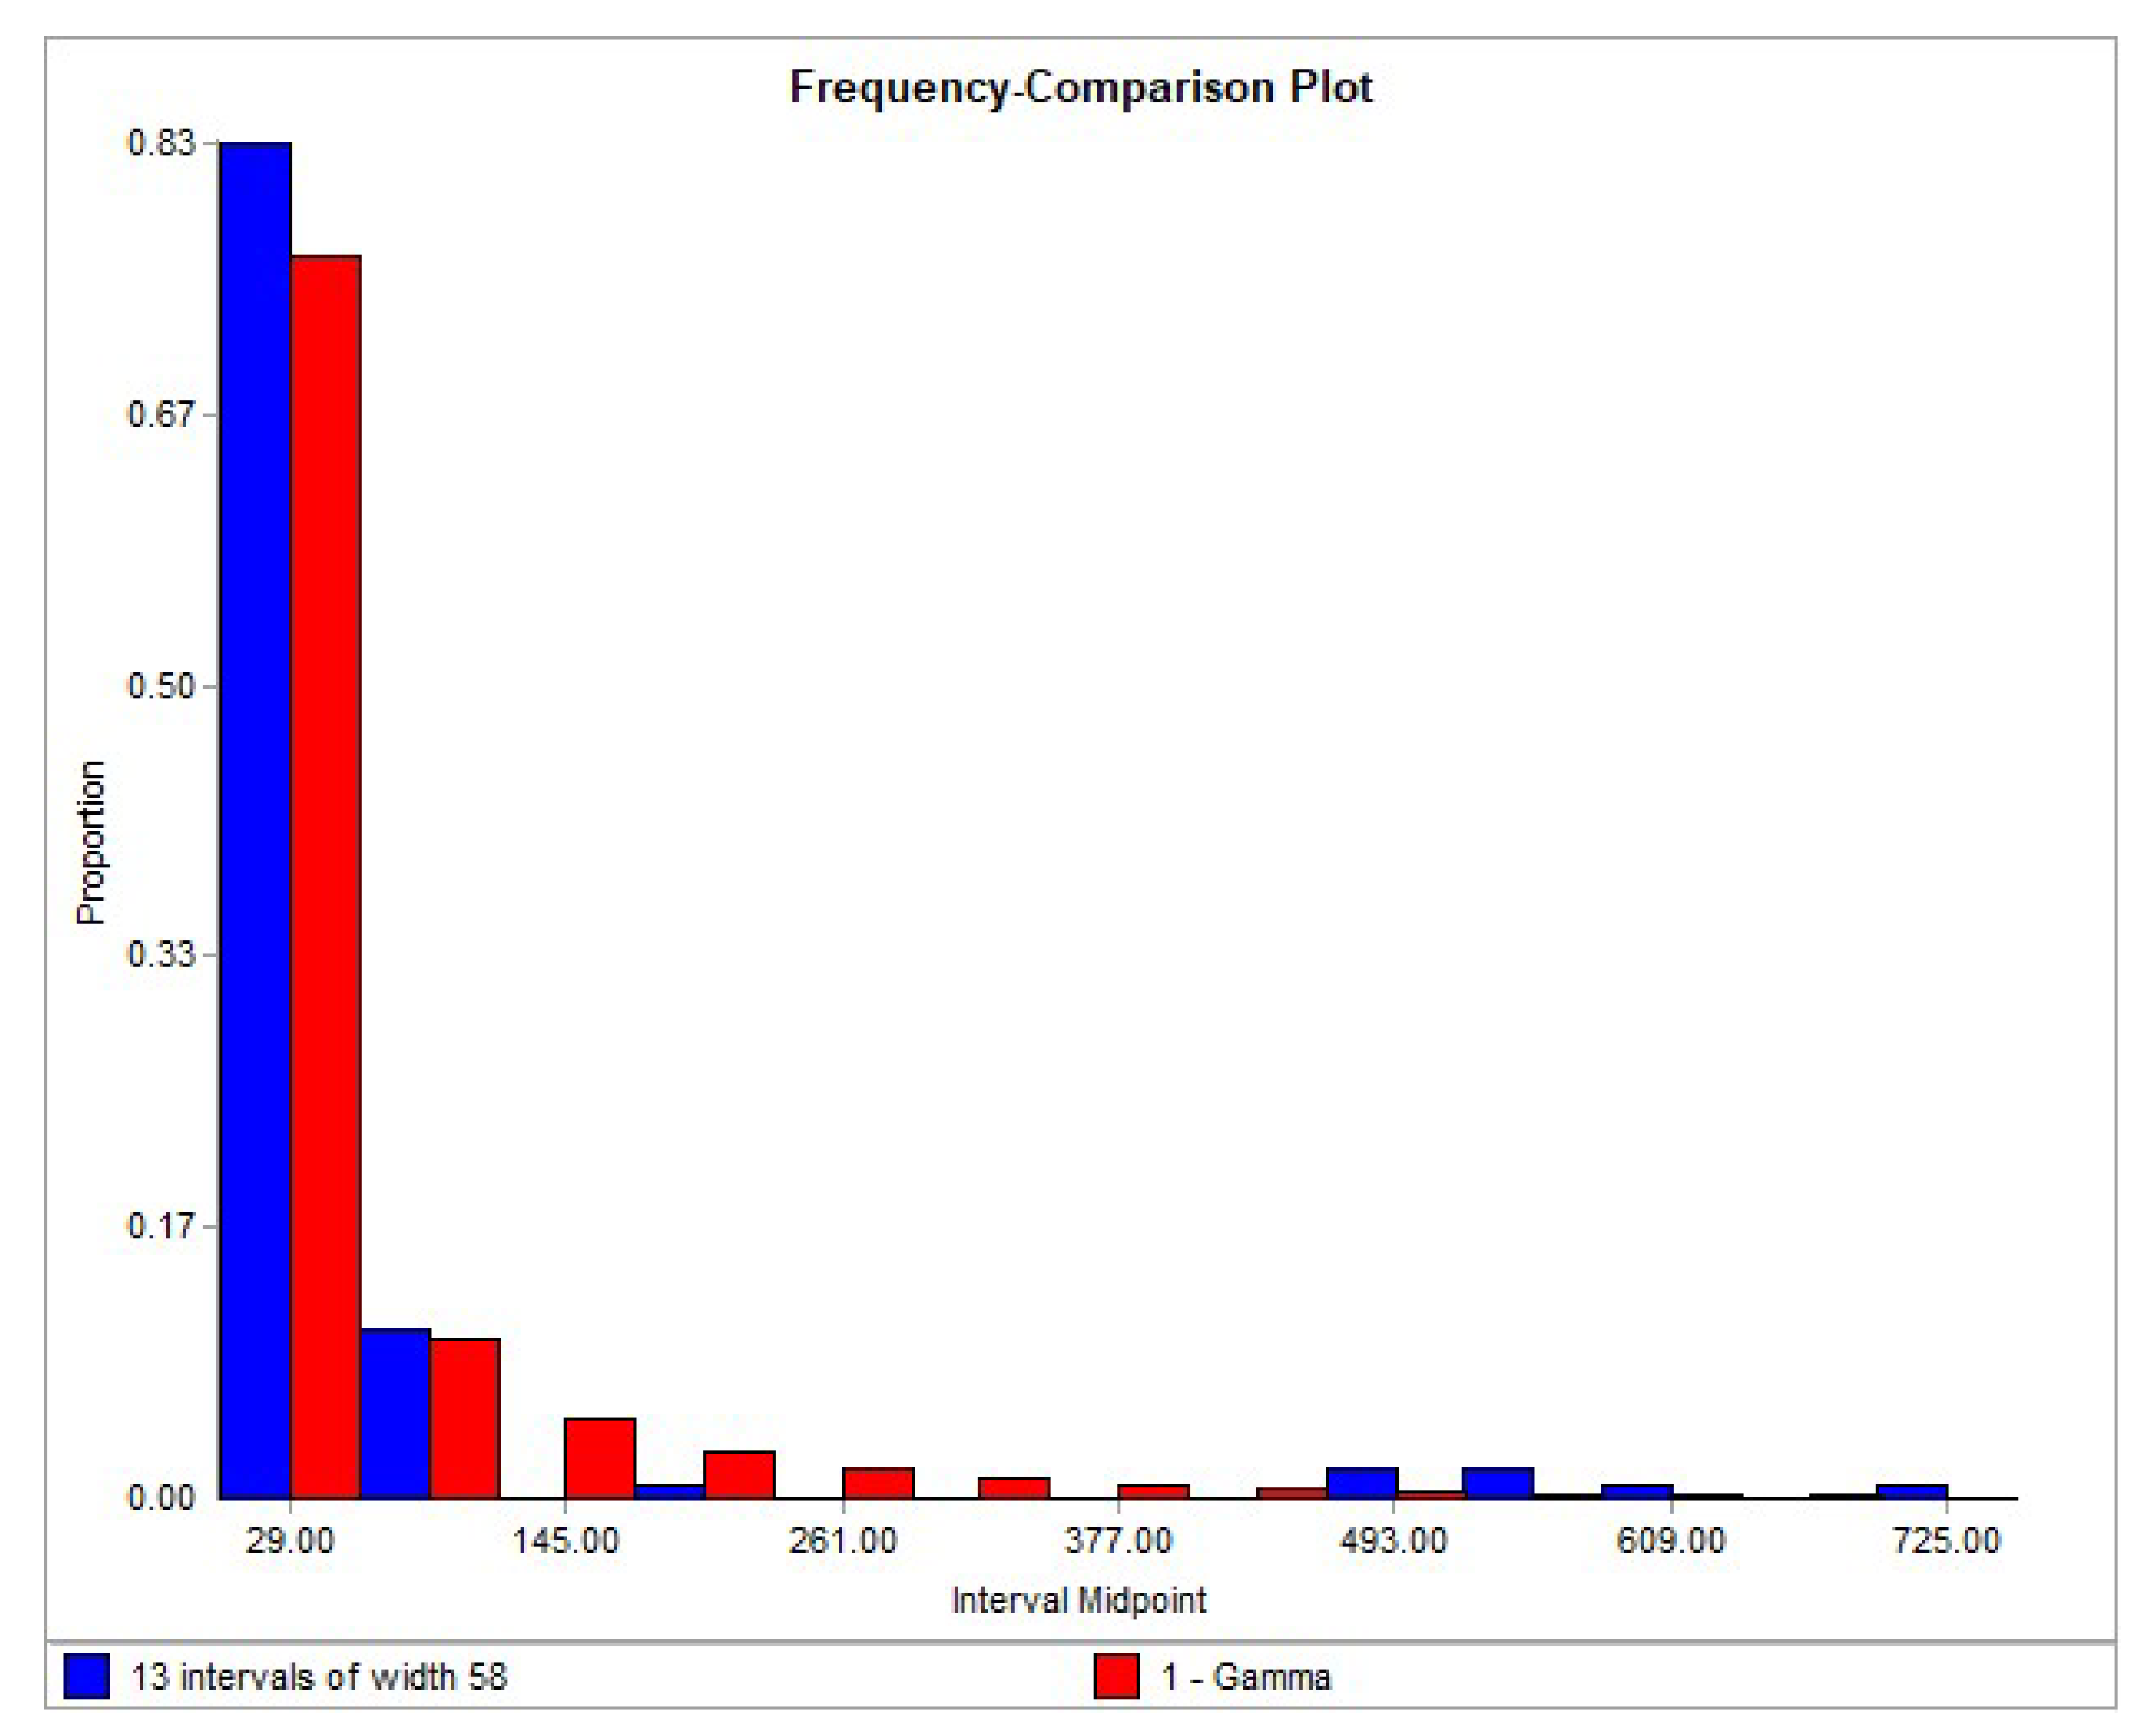
This question is mainly for assessing the distance construction workers travel by vehicle. This assessment/information could be useful for making some judgment on construction workers’ acceptance of using public transport if the carpark is closed. It can be noted from
Figure 8 that the majority of construction workers (39.5%) drive between 10 km and 20 km. Overall, more than two-thirds of construction workers (70.9%) drive only up to 20 km to their worksite. This suggests that the time to their worksite could not be an issue if the construction workers were to use public transport (assuming very frequent peak-hour public transport and easy access to public transport from those postcodes).
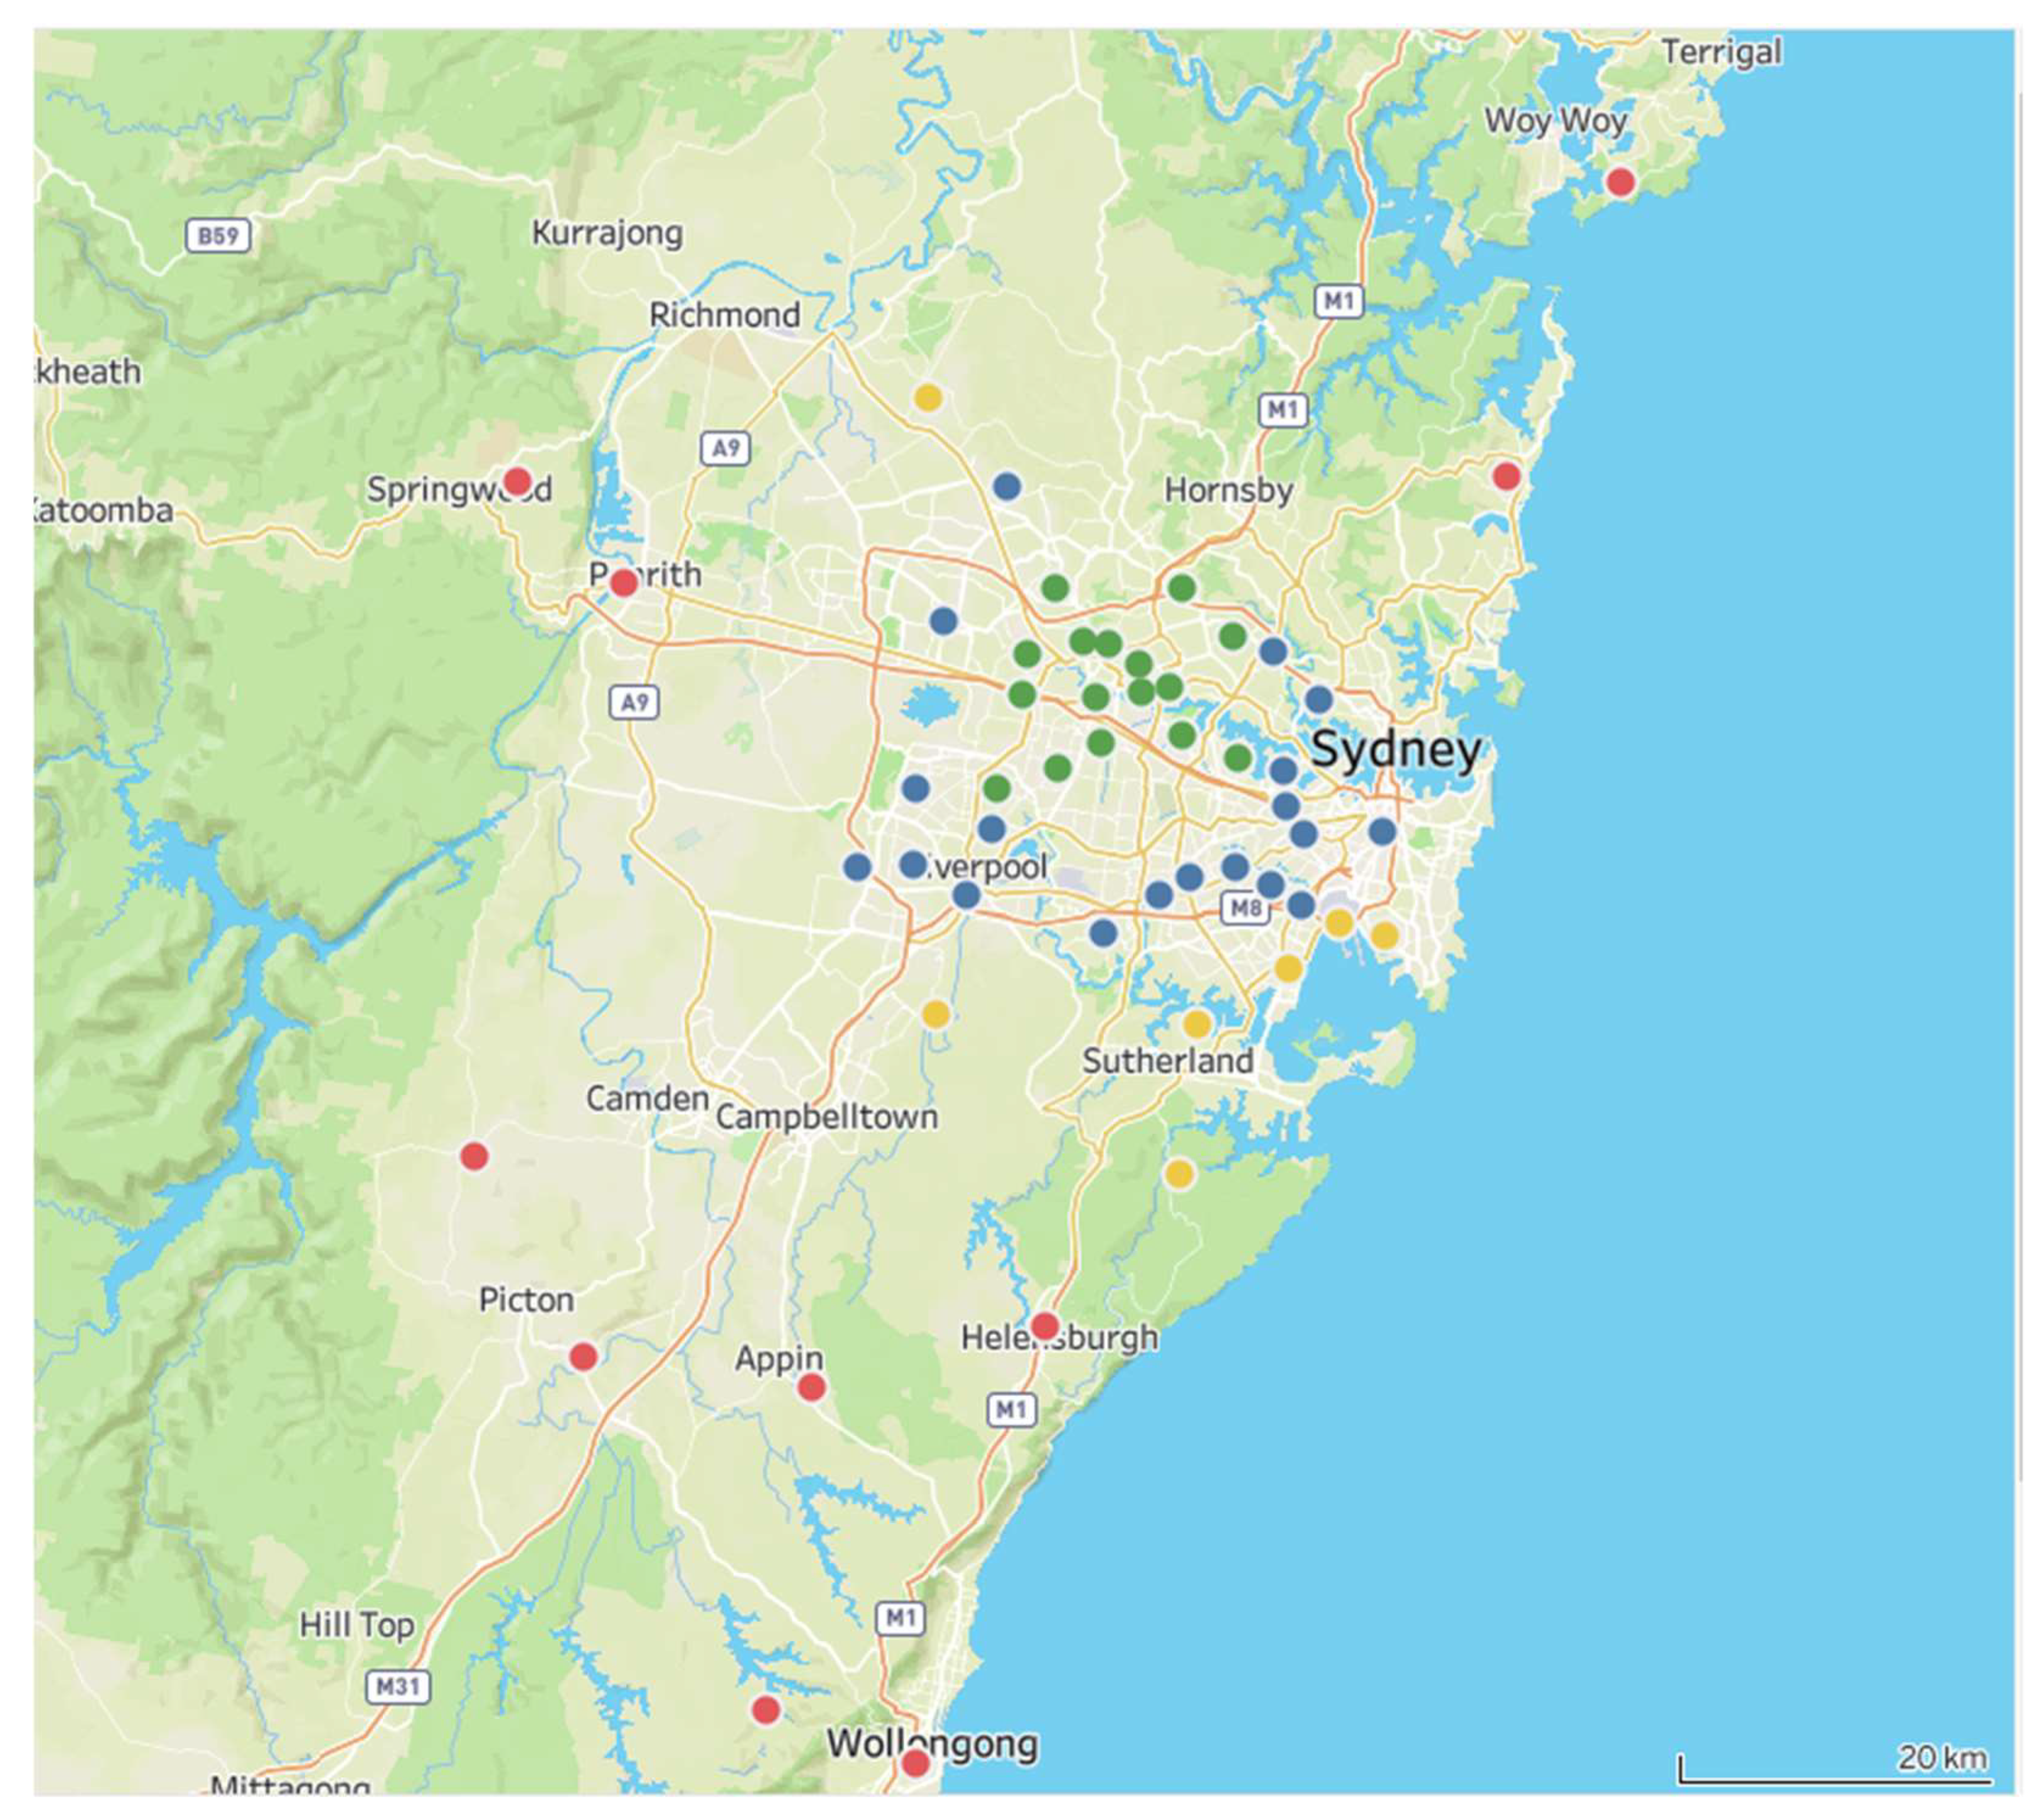
It can be noted from
Figure 9 that a significant concentration of construction workers is within a 20 km circle from the Parramatta CBD. Similarly, construction workers outside 20 km circle seem to be spread all around the Parramatta CBD, with significant proportions in the south and southwest of Sydney.
- g.
Did the company organise for you to park here?
This question measures the extent to which the worker’s employer arranges off-street parking for employees.
It can be noted from
Table 4 that a large percentage of workers (45% and 54% on 7 and 8 May 2019) did not respond to this question. Of all responses, it is noted that a large proportion (i.e., 37% compared to 17.4%; 27.1% compared to 19.2%) of workers parked at their own cost.
- h.
Observations
The survey also recorded observations on the company name, trade (electrician, surveyor, labourer, etc.), and whether the driver was carrying tools. It was also observed that there were multiple occupants in some vehicles noted at one entry point. There were only a very few records with the company name recorded (9 and 16 on 7 and 8 May 2019, respectively). Observations on the type of trade indicated that more than 50% of the construction workers were labourers. About 29% of construction workers were observed to carry tools to their worksite from the carpark. Another observation was that some construction workers made multiple trips to their vehicle to collect or drop off tools during their work shifts.
5.1.2. Summary—Intercept Survey Results
Intercept survey results and parking observations show that the majority of carpark users in the early hours are construction workers, including around 98% of arrivals from 5–7 a.m., followed by 36% from 7–8 a.m. and 13% from 8–9 a.m. Overall, there was a considerable percentage (28%) of carpark usage by construction workers, with the majority (around 90%) parking for more than 6 h. A majority (82%) of construction workers who participated in the survey worked at the Walker/Built/PSQ site. Similarly, a significant percentage of construction workers (78%) drove to their worksite.
The breakdown of vehicle types driven by the construction workers shows that the category of car/sedan/hatchback/motorbike accounts for 40%, compared to 60% of the category of 2WD/4WD/ute/van/truck. Many workers parked at their own cost. It is also noted that 29% of construction workers were observed to carry tools to their site, indicating that the proximity of the carpark to their site was an important factor in parking location choice.
Since construction worker arrivals were higher in the early hours of the day, and the majority of workers parked for more than 6 h, the non-availability of the multi-storey carpark in the future could impact kerbside parking in the Parramatta CBD, in particular in the vicinity of the carpark, making other users have less choice for their parking needs during the peak time of the day.
5.2. Analysis and Results of Carpark Capacity and Parking Demand/Usage Using Camera/Ticket Data
Analysis of multi-storey carpark usage/capacity was carried out as the basis for better understanding of the overall parking demand at current times, leading to developing a baseline traffic/parking simulation model incorporating both the kerbside and multi-storey carpark demand. Carpark demand and usage/utilisation were analysed using a weekly dataset (Monday, 6 May–Friday, 10 May 2019). Although data are available for Saturday, 11 May 2019, it was not used for the main analysis since it does not represent a weekday demand. The analysis is presented under the following areas/categories:
5.2.1. Overall Carpark Demand and Usage/Utilisation over One Week
It can be noted from
Figure 10 and that capacity utilisation of the carpark was approximately around the same level over the first four days of the week (Monday, 6 May to Thursday, 9 May 2019), while the capacity utilisation for Friday, 10 May 2019 showed a slight decrease. There was a very significant drop in demand/capacity utilisation on Saturday, 11 May 2019 compared to the demand from Tuesday, 7 May to Thursday, 9 May.
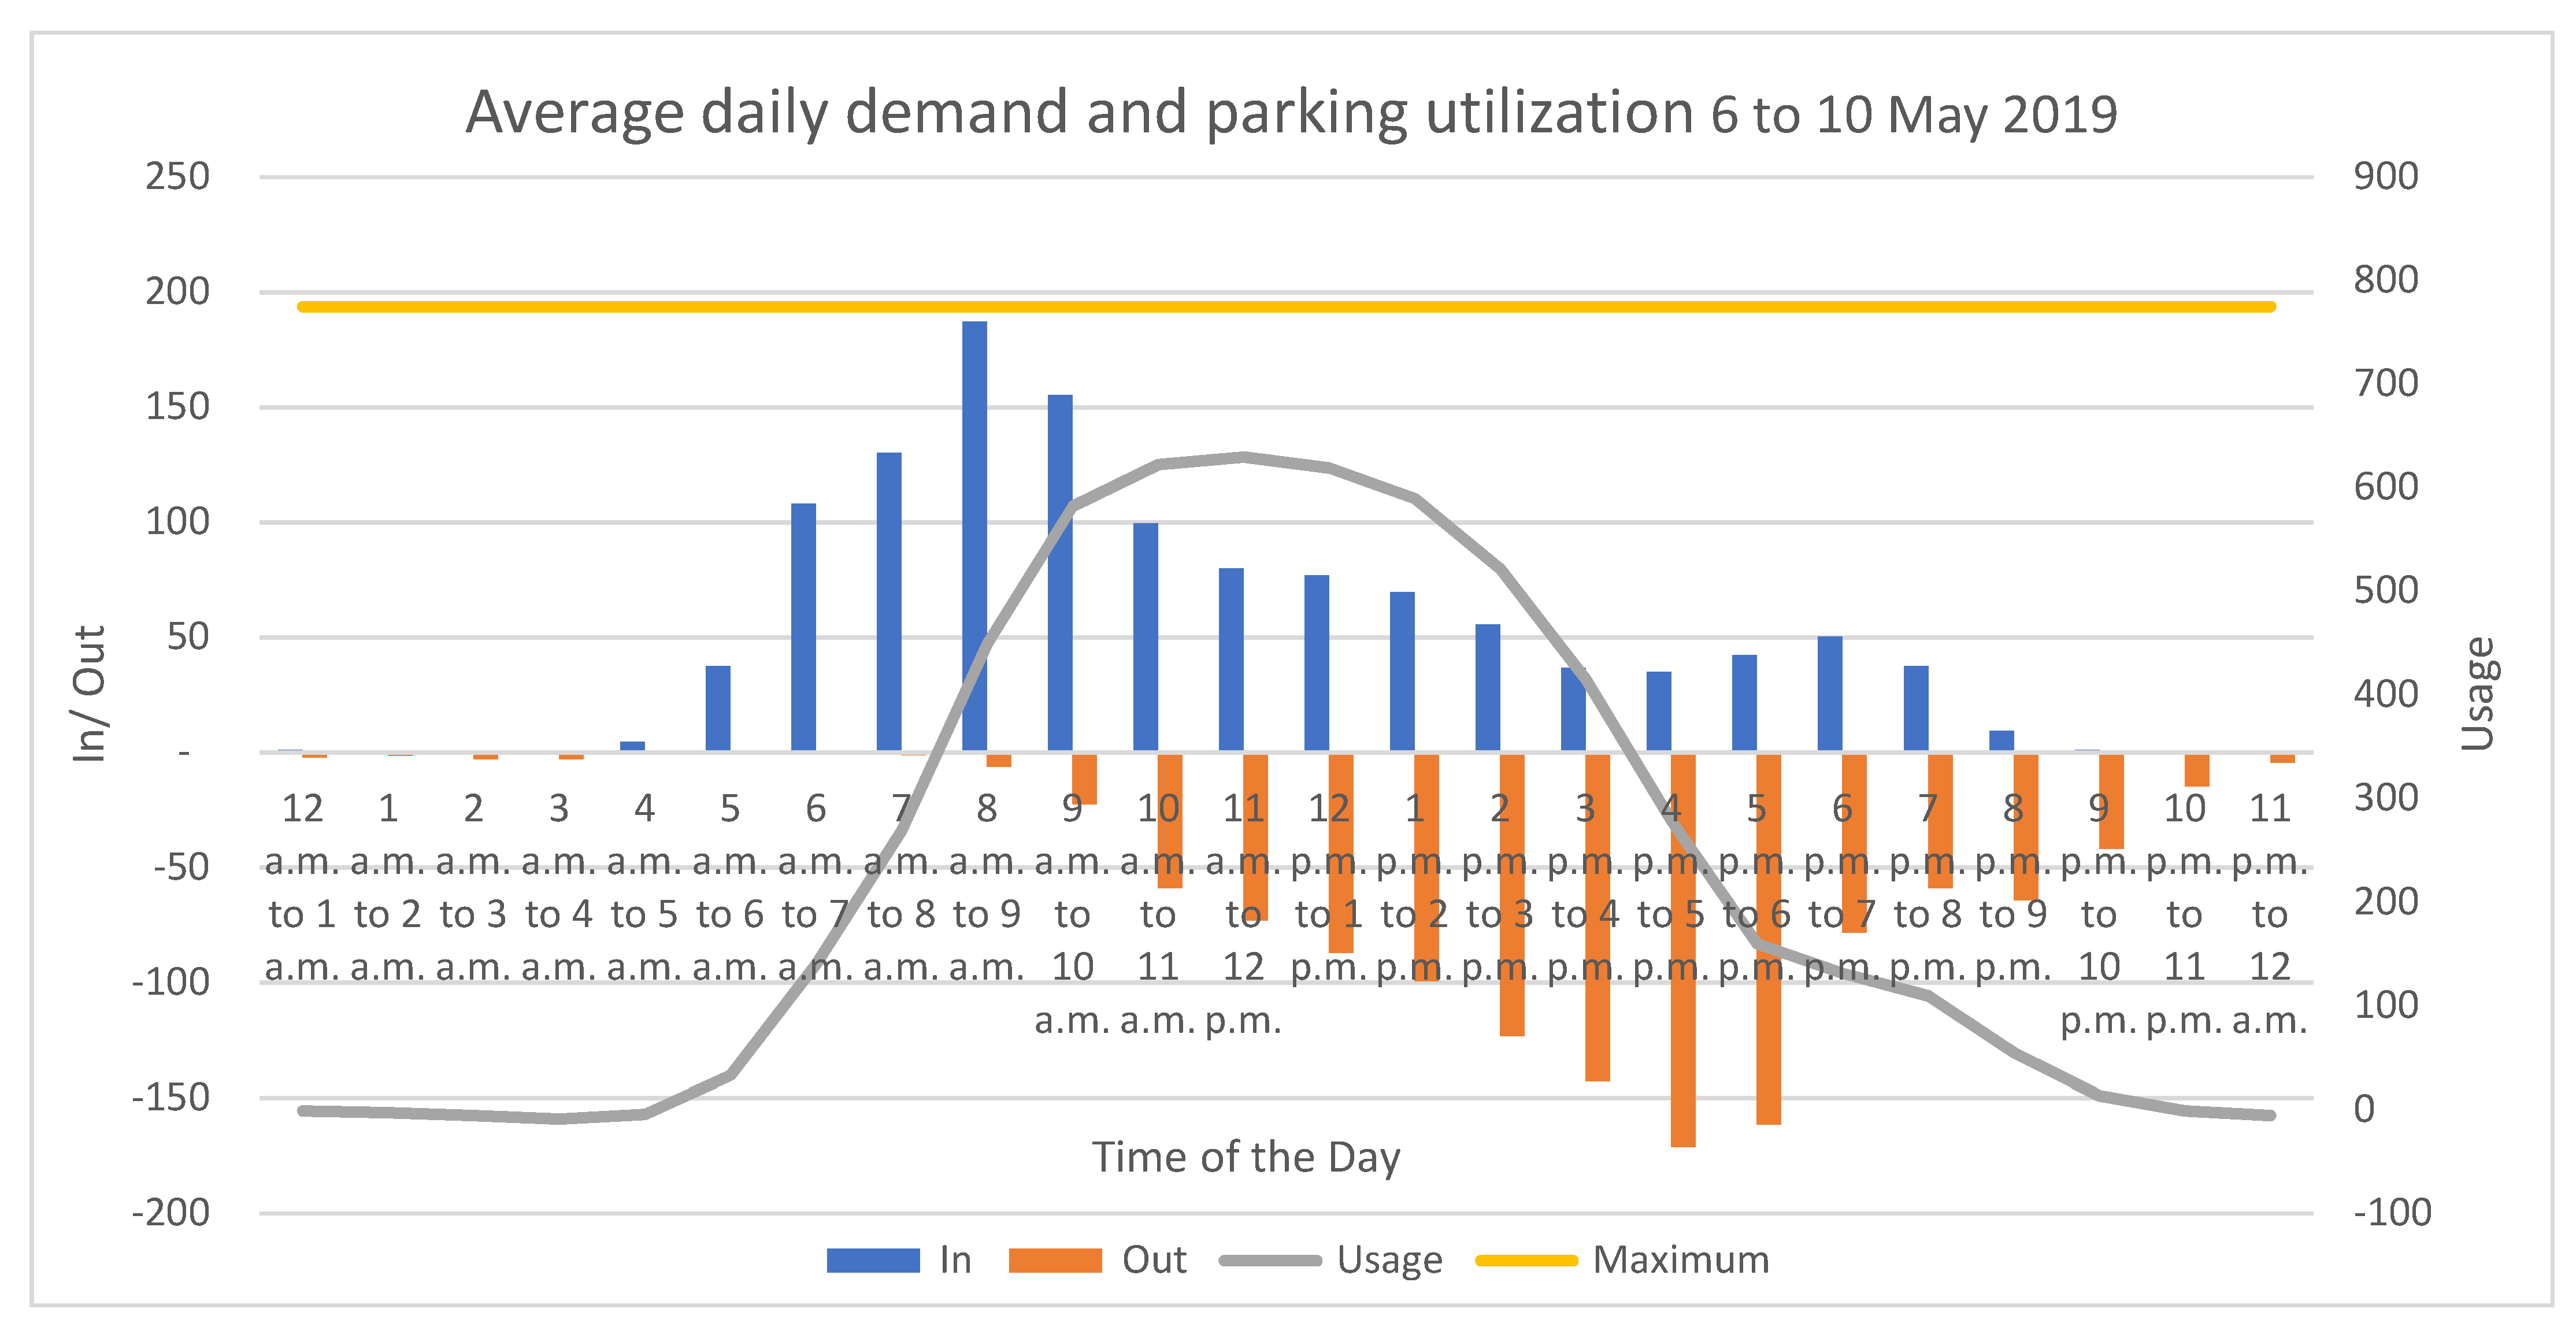
When the daily average arrivals, exits, and usage by each hour of the day (6 to 10 May, excluding Saturday, 11 May) are considered, parking demand and usage/utilisation on average (
Figure 11) seem to be slightly below the full capacity. In this case, the maximum usage/utilisation was around 98% of the total capacity, and it was recorded from 11 a.m. to 12 p.m.
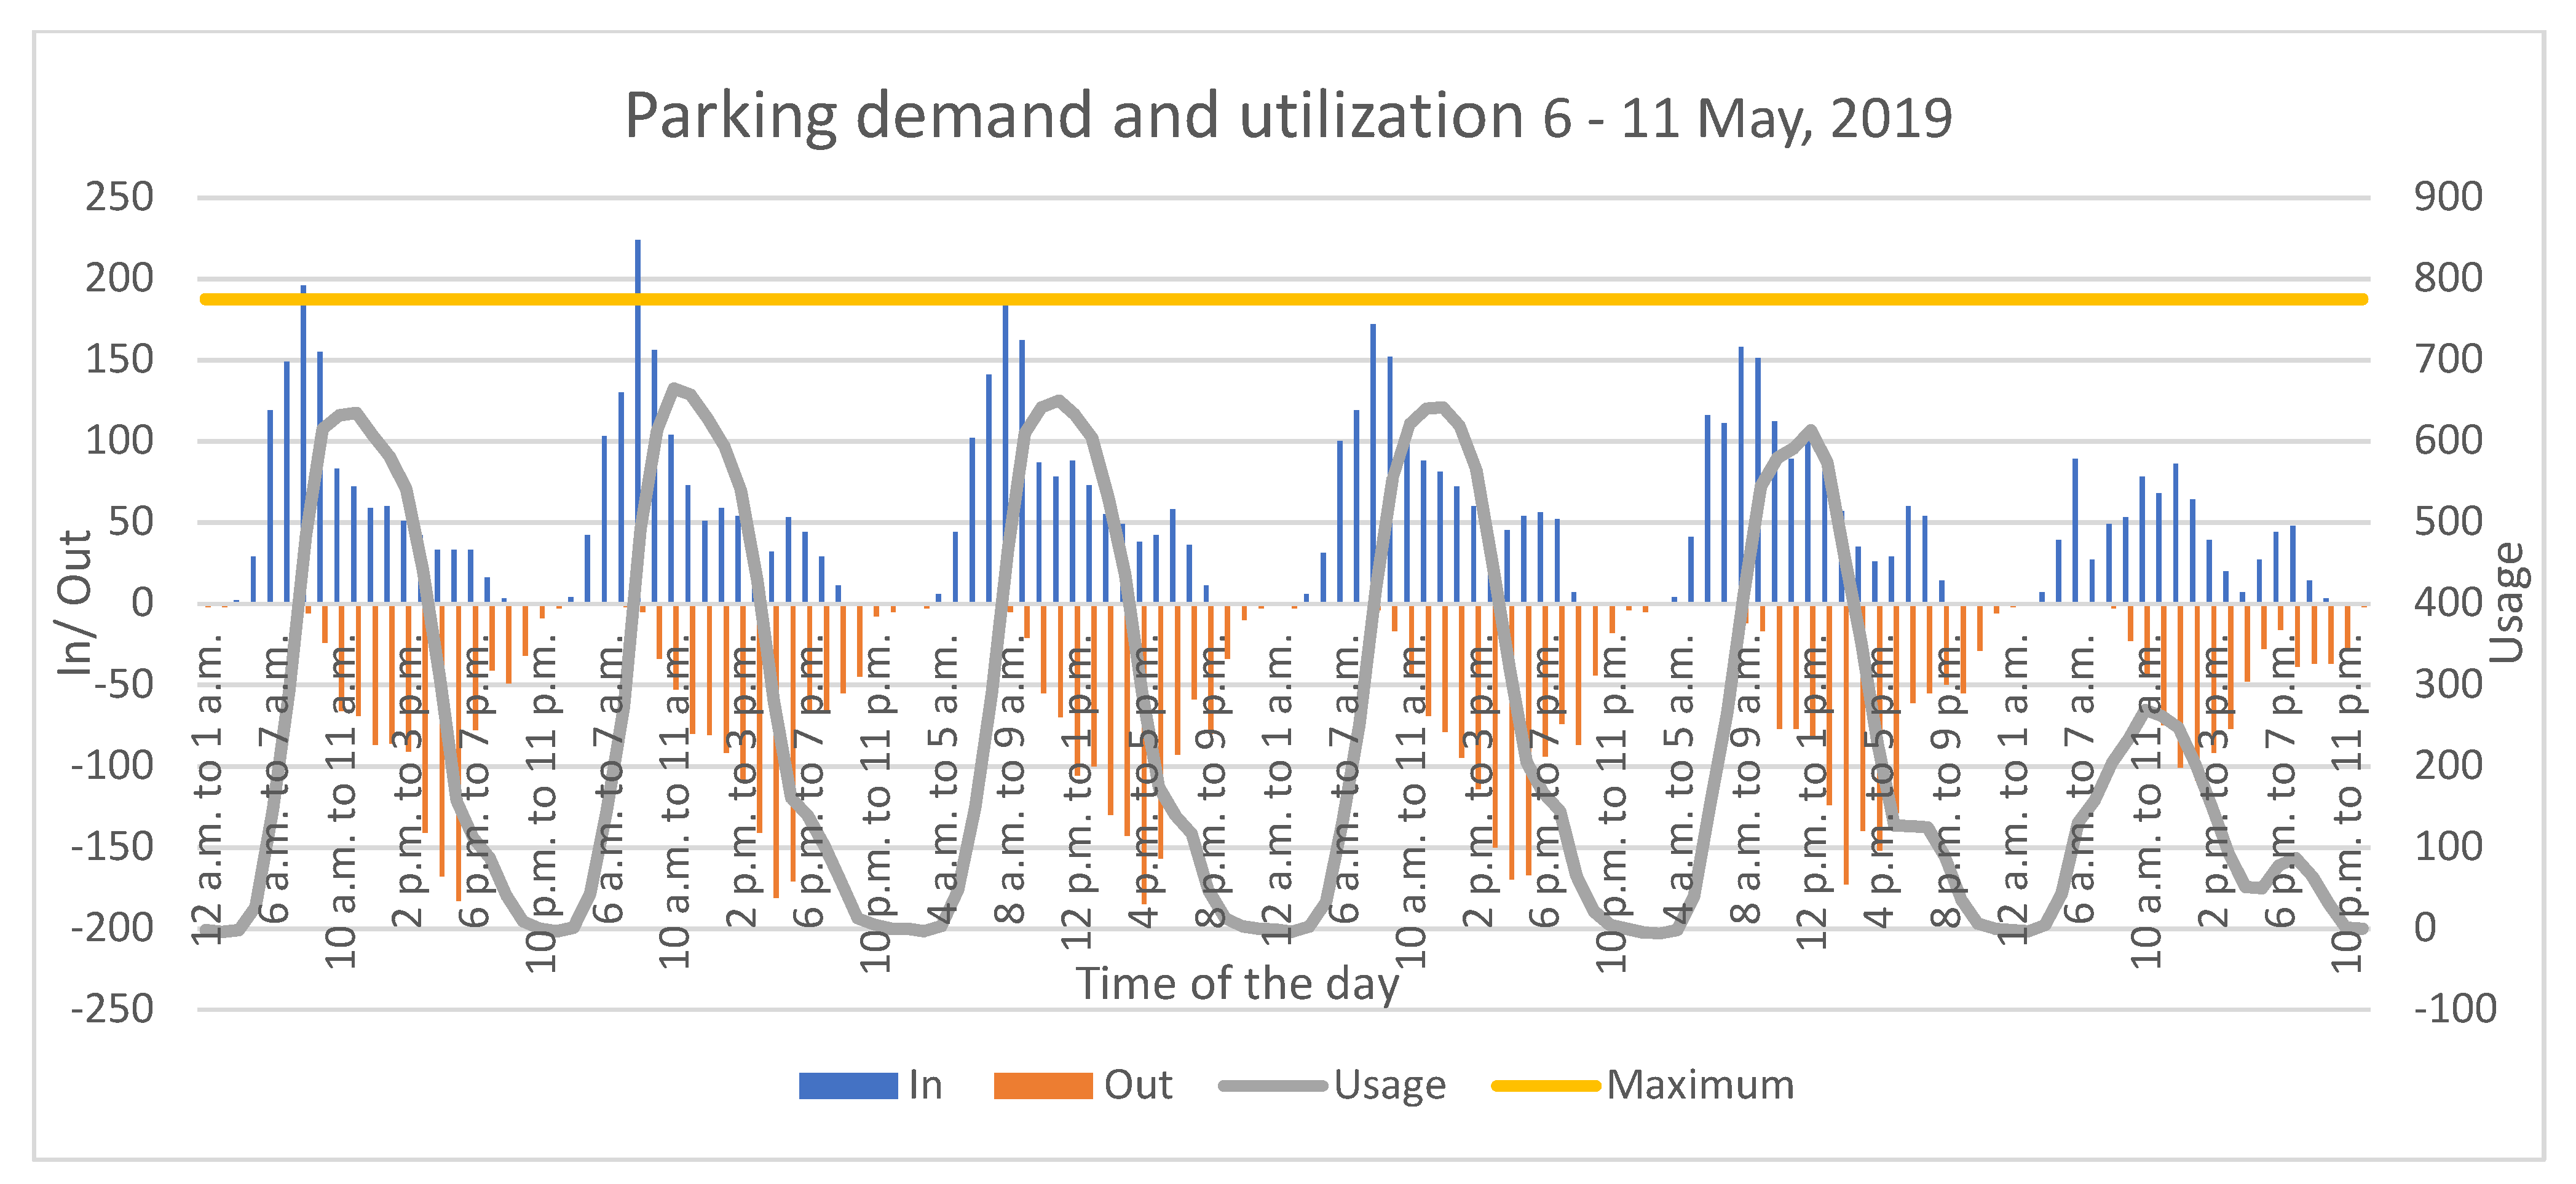
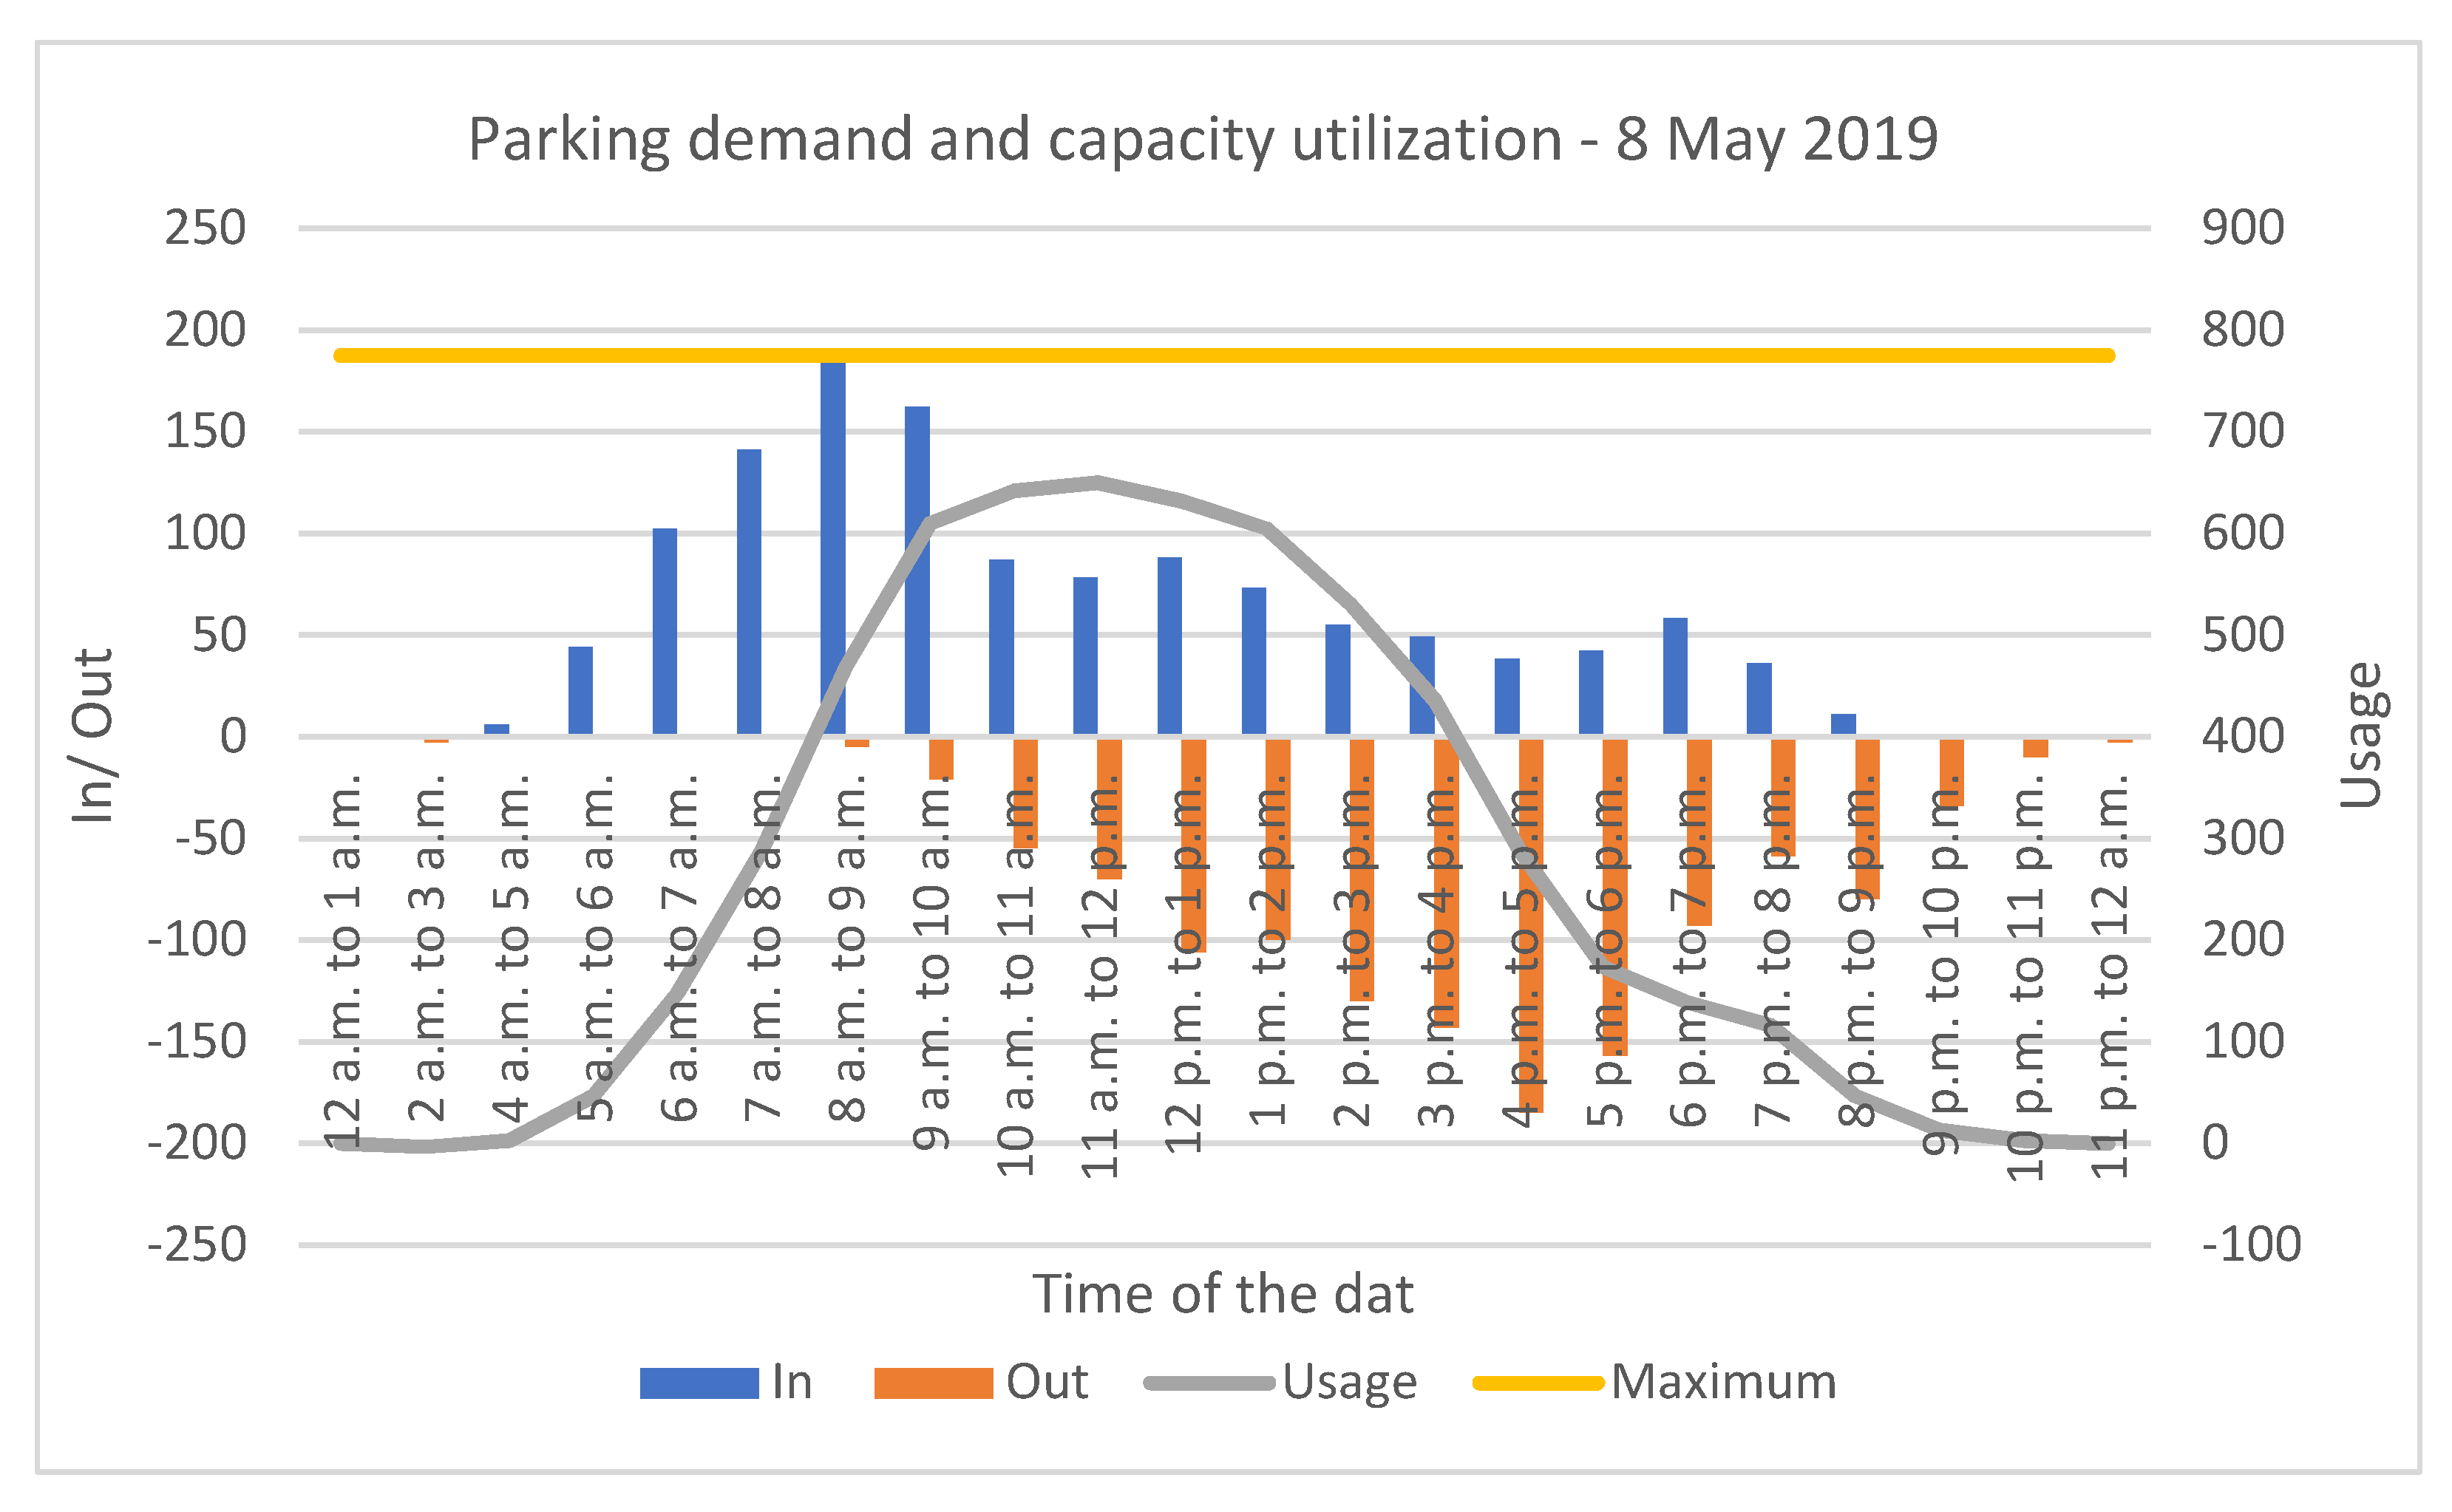
5.2.2. Demand and Carpark Usage/Utilisation over Hourly Intervals of One Selected Workday of the Week
Figure 12 illustrates the carpark utilisation on 8 May 2019 using hourly arrivals and departures, which shows that the carpark utilisation reached its full capacity from 11 a.m. to 12 p.m. Overall, the carpark operated around its maximum capacity only for a short period of the day, between 10 a.m. and 1 p.m.
5.3. Traffic/Parking Simulation Model Results and Analysis
Traffic/parking simulation model results and analysis are presented under three main categories: (i) results of the baseline model, (ii) results of the impact scenarios, and (iii) analysis of saturation levels and periods, based on baseline and impact scenarios.
5.3.1. Baseline Model of Kerbside and Carpark Demand/Usage and Results
The baseline simulation model of parking events using hourly arrivals and best-fit distribution of parking duration for parking events at each hour is closely reproduced by a distribution of the actual dataset and is shown in
Figure 13.
Since the baseline model closely reproduces kerbside and multi-storey parking usage, the baseline model can reliably be used to model the four scenarios outlined above, incorporating various kerbside impact situations (
Table 1).
As shown in
Figure 14, the carpark is full between 10:14 a.m. and 1:40 p.m. This is aligned with the carpark usage noted from the analysis of carpark data reported earlier [
3]. Similar to multi-storey parking usage reproduced by the baseline model, kerbside parking usage is reproduced based on the arrival rate and parking duration obtained from camera data.
The kerbside usage using the baseline simulation model in
Figure 15 shows usage of above 90% of capacity from 8:08 a.m. to 10:54 a.m. Kerbside usage of 90% or more is assumed to be full capacity due to potential loss of time between parking events, particularly when a large proportion of kerbside parking is designated as STP and average parking time on STP is short during peak period. In the case of the Parramatta CBD, there are 501 STP spaces, compared to only 56 LZ parking spaces. According to [
3], the average parking time during peak time is 27 min, leading to more than 20 parking events on average on a single parking space during the peak period (7 a.m. to 5 p.m.) on a weekday.
The kerbside parking events and percentage of parking events of a typical day using the baseline model are shown in
Figure 16 and
Figure 17.
It can be noted from
Figure 16 and
Figure 17 that kerbside parking is full and is shown at two time intervals (from around 7:32 a.m. to 11:00 a.m. and 6:00 p.m. to 8:00 p.m.).
5.3.2. Analysis of Kerbside Impact Scenarios with Construction Workers’ Displacement onto the Kerbside
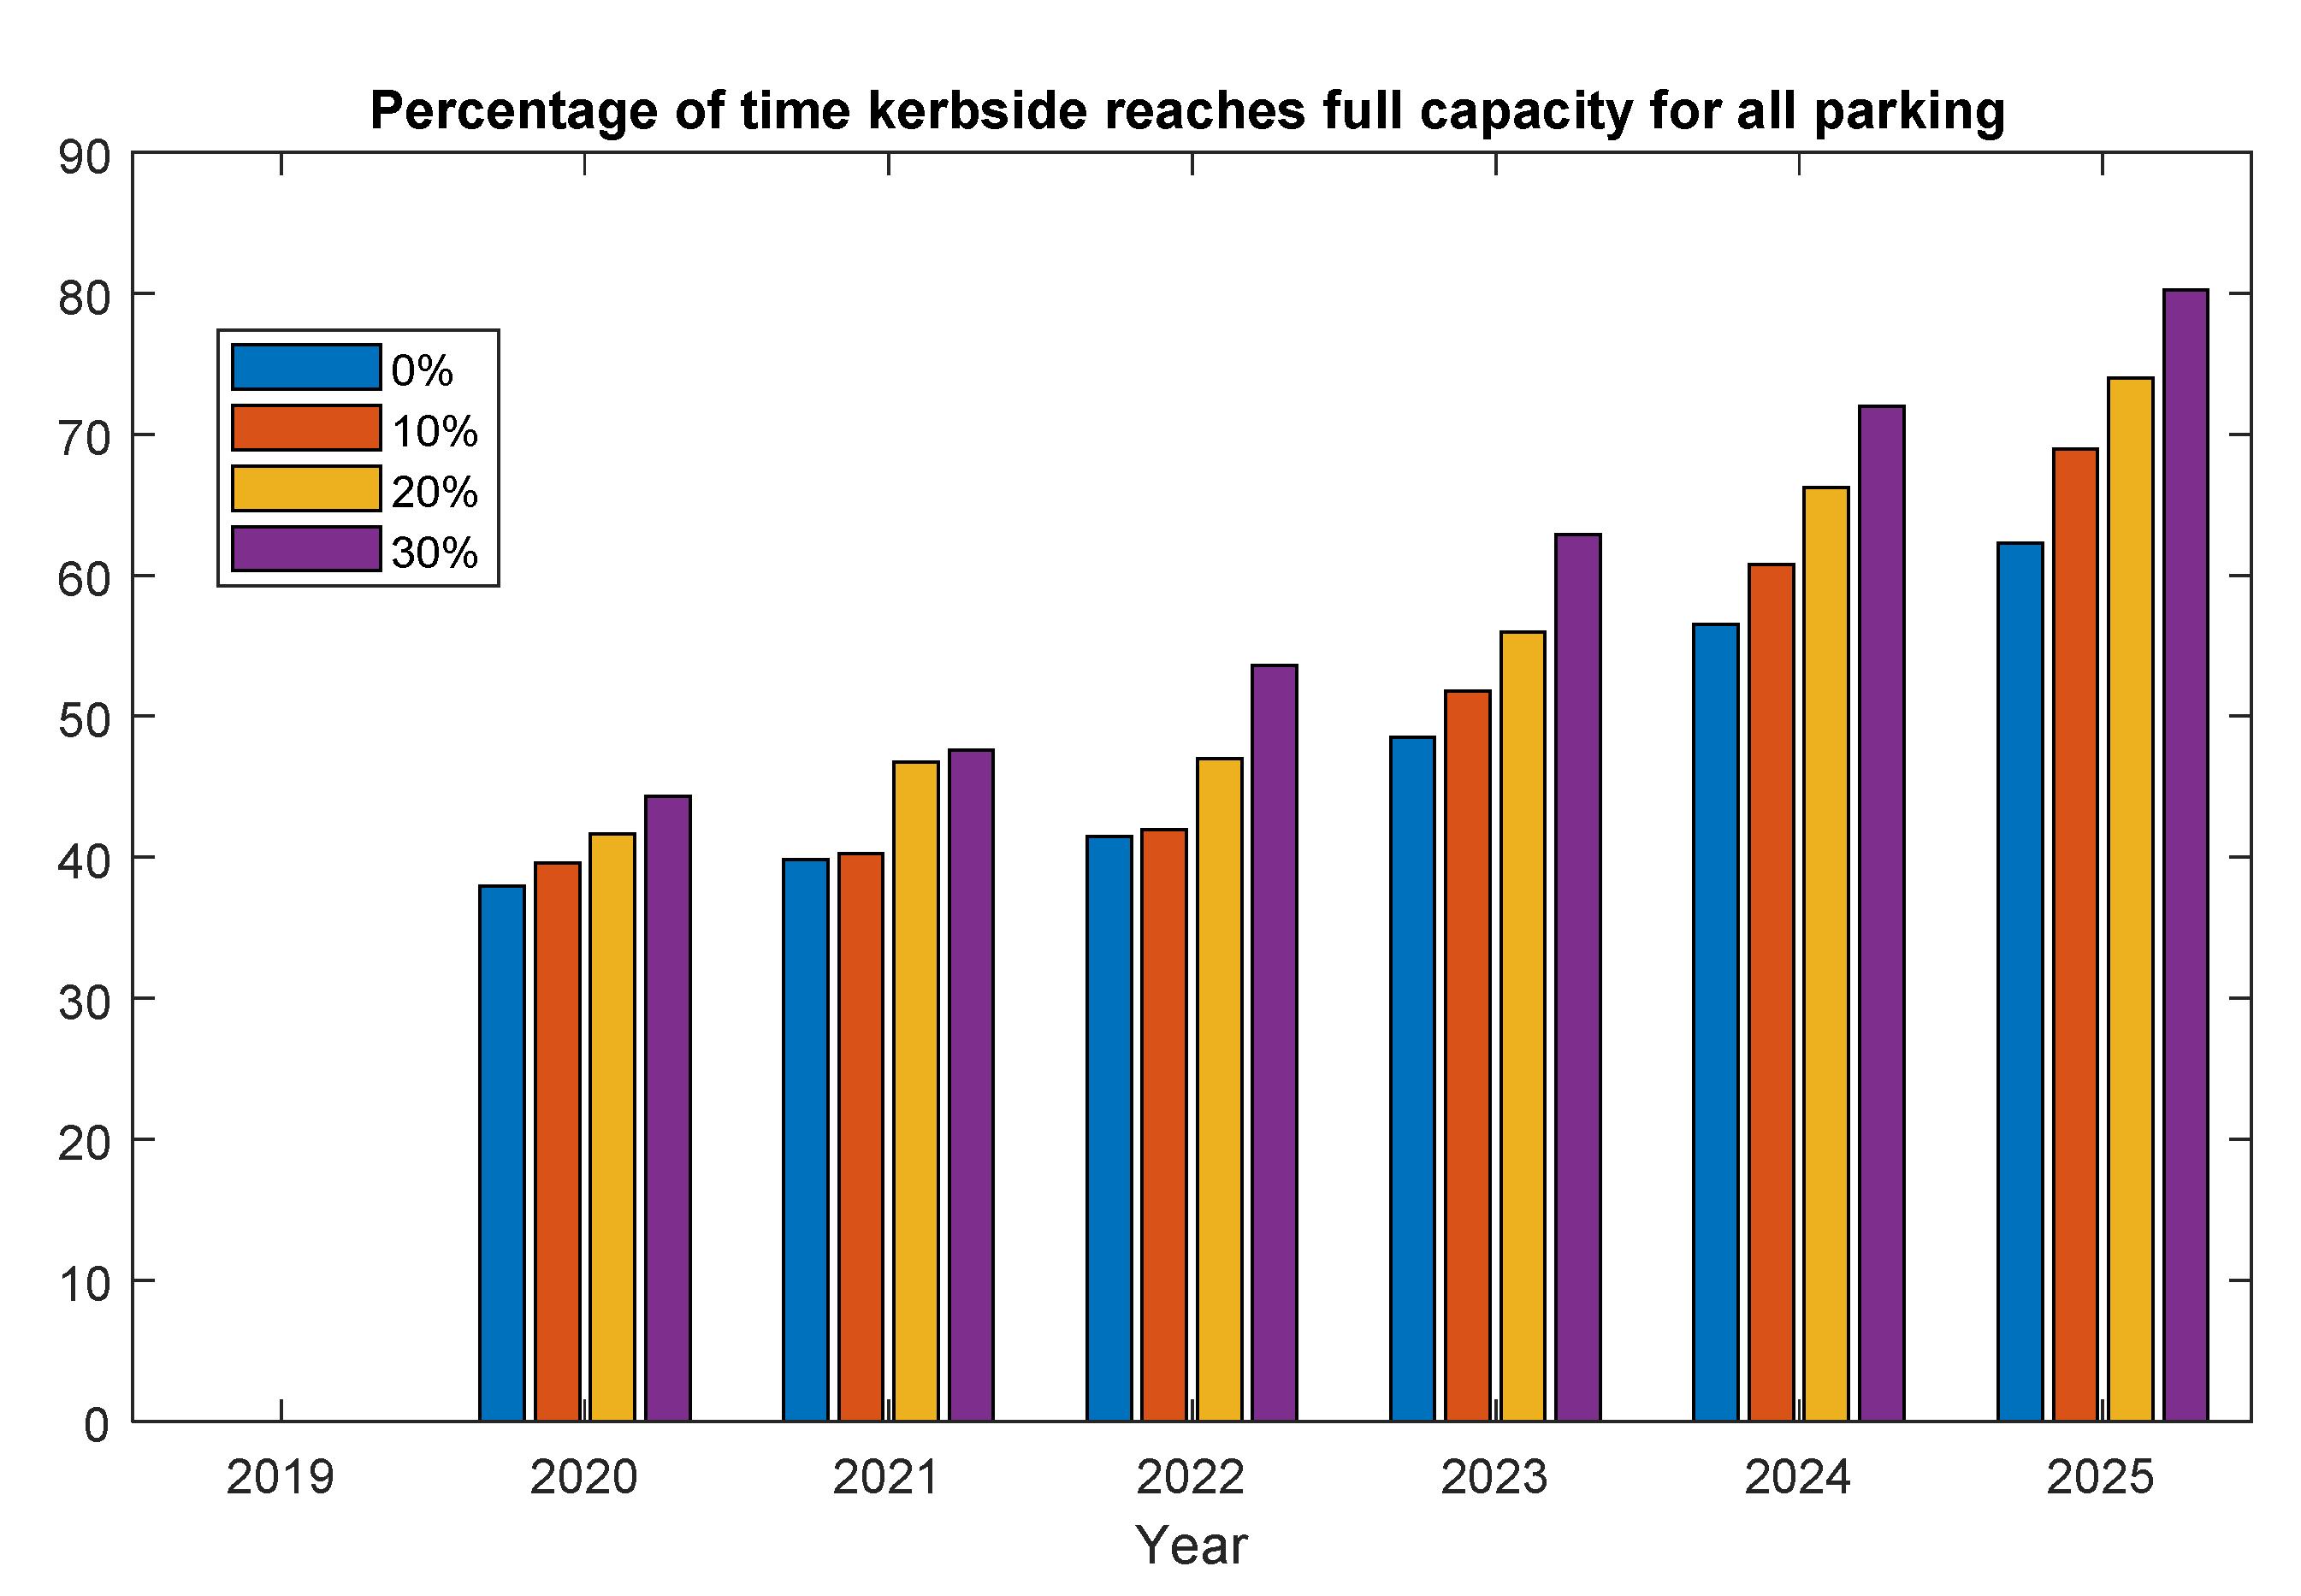
Four scenarios were tested for construction workers’ displacement as a result of lack of carpark availability (from closure or proximity). The scenarios tested zero displacements through to 30 percent.
Figure 18 illustrates that with an assumption of the ongoing static provision of parking supply, each kerbside impact scenario has a full-capacity usage period (saturation period). Even with a baseline scenario of zero displacements, the level of saturation increases from less than 40 to over 60 percent of the time between 6 a.m. and 6 p.m. by 2025. With 30 percent of driving construction workers using the spaces, the saturation point is reached over 80 percent of the time with 90% assumed as the practical operational maximum utilisation.
Overall, the results of the parking assessment presented above are based on the simulation of four impact scenarios, using the expected demand growth and changes to parking infrastructure (e.g., kerbside and carparks) over six years. Research studies on the broader topic of parking assessment have adopted several methods including simulation of traffic and parking demand, empirical assessment of parking requirements and capacities using hypotheses testing, and modelling of parking occupancy using sensor technologies. Since the simulation approach is common in the context of general parking assessment studies, the results presented could be generalized from the perspective of parking assessment in the context of growing demand and infrastructure changes. For example, the workers’ replacement on kerbside parking as a result of a lack of carpark availability could be generalized as a basis for simulating priority users of any carpark when using the simulation approach for parking with impact scenarios of similar context.
6. Research Findings
The majority of workers parking in the carpark were working on the Parramatta Square construction site, which is a major construction site with approximately 2000 workers. Although the majority of construction is assumed to use public transport, it was found that there was about 10% of workers (about 150–200) who were driving to the carpark, and vehicles often had multiple occupancies. It was discovered from follow-up observations that parking is very localised to nearby construction sites. It was also found from the construction worker forecast developed for the period 2020–2025 that there is a significant year-to-year growth rate, making some implications for meeting parking demand on both the carpark and kerbside, particularly when the carpark near the major construction is closed as planned in 2021.
It was found that each kerbside impact scenario has a saturation period, indicating that spare kerbside capacity noted in the baseline has already taken up by the least impact situation (scenario one in 2020). Furthermore, the saturation period is increasing with the year and level of impact on kerbside identified by the percentage of displacement of construction workers from the carpark onto the kerbside. The impact on the kerbside is very significant, in particular, as overall usage of kerbside with current demand is less than full capacity over most of the time of the peak period of the day (6 a.m. to 6 p.m.).
Furthermore, there is a significant increase in the percentage of peak time with full kerbside utilisation in 2020–2025 due to the kerbside impact scenarios considered, from the lowest impact, scenario one, in 2020 to the most extreme impact, scenario four, in 2025. This means that the impact is not only significant in 2020 but also increasing over the years, reaching about 66% of the peak time with full kerbside utilisation in 2025.
Aside from construction activity, kerbside demand, including for loading zones, will also be impacted by population and commerce (e.g., freight activities) growth in the Parramatta CBD. This was noted by the considerable increase in the saturation of the zero-displacement scenario.
7. Discussion and Conclusions
Based on the findings of construction worker parking behaviours presented earlier, it can be assumed that construction sites will move, and parking demands will move with them. With scheduled construction programs set to continue in the Parramatta CBD, there will continue to be a large number of construction workers. They will not have an issue parking, as they arrive early. In the assessment of traffic entering the carpark, it is calculated that they account for 98 percent of arrivals between 5 a.m. and 6 a.m., with drivers predominantly staying for over six hours. The most likely scenario is that construction workers’ parking demands are met by available carparks whilst other drivers arriving later to seek parking may be displaced.
Aside from construction activity, kerbside demand including for loading zones will also be impacted by population and commerce growth in the Parramatta CBD. This is illustrated by the considerable increase in the saturation of the kerbside parking, even with zero displacements of construction workers (scenario one).
The findings of this investigation suggest that there could be implications for other construction sites in the Parramatta CBD that are not as close to transport interchanges or adjacent to carparks. In such circumstances, workers potentially carrying tools may have the first choice of kerbside parking, therein displacing other drivers by selecting spots close to sites. The closure of carparks could also influence/generate kerbside parking demand.
While construction traffic management plans (CTMPs) have not yet been received for many proposed developments, the expected growth rate of construction worker employment in the Parramatta CBD for the next six years, based on the knowledge of the development pipeline, can have implications for developing such CTMPs. While CTMPs typically aim to promote public transport for workers, for some it will not be a feasible option. Even in the very near future (with a reduced amount of kerbside space available), if 10 percent of construction workers drove and used kerbside space, they would require 123 percent of all the Parramatta CBD kerbside spaces, which are occupied for the day already by 6.30 a.m.
Proximity is important for workers arriving with tools. It is reasonable as part of CTMPs to ask proponents to therefore consider approaches for workers parking in proximity to their site. With many construction jobs available across Sydney, considerations such as parking provision, location, and ease of access could become critical in attracting a good and reliable workforce. Overall, the outcomes of this research project have directly influenced the planning framework for the Parramatta Light Rail project, a two-way track spanning 12 km, and future zoning and infrastructure development in Parramatta. This planning framework now identifies (i) the importance of evidence-based travel demand management strategies for construction companies, (ii) modelling to inform decision making concerning future zoning and infrastructure development, and (iii) the requirement to prioritise the parking needs of a broader cross-section of users in the Parramatta CBD.
The simulation approach adopted for parking assessment in the context of growing construction activity and infrastructure changes illustrated through a case study can be generalized for parking assessment in other contexts as evident from exploring sustainable business models in the context of urban infrastructure settings using agent-based simulation applied to the city of Copenhagen [
4] and using a modelling approach to examine different traffic scenarios in a university campus [
20]. Similarly, some studies have adopted an empirical approach for assessing parking requirements and capacities in residential development settings [
21]. One of the common characteristics of all these studies is the modelling of scenarios under respective contexts towards validating models and/or hypotheses for addressing the research questions. Therefore, the simulation approach adopted in this research is a well-established approach to modelling various parking/traffic scenarios.
8. Future Research Directions and Limitations
In this research, kerbside impact scenarios have been tested taking into account growth factors and parking scenarios. The Flexsim simulation model that has been developed could be used further to evaluate other comprehensive growth and utilisation what-if scenarios, in particular kerbside impact from the perspective of saturation times over a 6-year period.
The evidence-based information using this research investigation can be used to develop TDM strategies and guidelines as follows:
Consider when developing parking management approaches as the Parramatta CBD grows;
Use as key input to TDM strategies for construction companies and their workers;
As an assessment approach in concurrent significant construction traffic management plans to assess the implications of parking demand on the local area;
Extend and adapt the proposed model to incorporate other transport requirements and parking uses.
The proposed approach of surveys of current parking behaviour and simulation of future impact scenarios could be easily adopted and tested with existing parking/traffic data from other cities, making the developed models more generic within a broader traffic/parking assessment context for developing TDM strategies for various stakeholders, depending on the context of parking demand, supply, and future changes. However, the study is limited to surveys of actual parking demand without considering latent demand, mainly drivers cruising/searching for an available spot during the peak period of the day. Furthermore, the scope of the investigation into the parking assessment was limited to consideration of only key factors such as growing construction activity, infrastructure changes, and the impact of expected population growth over the next six years. Moreover, the simulation of impact scenarios did not take into account the increase in parking demand resulting from progressive land use (customers) and developing transport infrastructure (light rail).


