Article

Effects of Increasing Salinity by Drip Irrigation on Total Grain Weight Show High Yield Potential of Putative Salt-Tolerant Mutagenized Wheat Lines

1
Department of Biological and Environmental Sciences, University of Gothenburg, P.O. Box 461, 405 30 Gothenburg, Sweden
2
The Salt Doctors, Vloedlijn 47, 1791 HK Den Burg, The Netherlands
3
Department of Farm Technology, Wageningen University, P.O. Box 17, 6700 AA Wageningen, The Netherlands
4
Faculty of Environmental Sciences and Natural Resource Management, Norwegian University of Life Sciences, P.O. Box 5003, 1433 Aas, Norway
5
Department of Pure and Applied Biochemistry, University of Lund, P.O. Box 124, 221 00 Lund, Sweden
*
Author to whom correspondence should be addressed.
Sustainability 2022, 14(9), 5061; https://doi.org/10.3390/su14095061
Submission received: 31 January 2022 / Revised: 2 April 2022 / Accepted: 8 April 2022 / Published: 22 April 2022
(This article belongs to the Special Issue Drought and Salinity Tolerance in Crops for Sustainable Agriculture)

Abstract

:
Twenty-three lines from a mutagenized Bangladeshi BARI Gom-25 wheat population that included previously identified salt-tolerant lines, and the BARI Gom-25 control variety, were cultivated in a drip-irrigated salinity test field at Salt Farm Texel, Netherlands, to assess their performance during salt stress in European climatic conditions. Lines were tested at irrigation salinity levels of 1, 4, 8, 12, 16, and 20 dS m−1 in four repetitions of plots with 24 plants per plot. Average plant height, tiller number, spike length, frequency of live plants, and total grain weight (TGW) were recorded as functions of seasonal mean pore water salinity in the soil. Increases in salinity triggered reductions in all evaluated variables of the assessed lines and the control variety. However, nine mutagenized lines had at least twofold higher mean TGW than the control variety, 18.73 ± 4.19 g/plot at 1–16 dS m−1 salinity levels. Common models of salt tolerance confirmed this pattern, but there were no clear differences in salinity tolerance parameter estimates between the mutagenized lines and the control variety. Thus, despite the apparent similarity in responses of all lines to salinity increase, we clearly identified lines that tended to have higher TGW at given salinities than the control variety. This higher TGW at the full range of salinity treatments indicates not only a possible higher salinity tolerance but a higher yield potential as well. The mechanisms involved clearly warrant further attention.

1. Introduction

There is an urgent need to increase food production; e.g., the FAO projected that a 70% increase would be required between 2005/7 and 2050 to meet the requirements of the burgeoning human population (www.fao.org (accessed on 17 January 2020)), despite problems associated with climate change, urbanization, and soil deterioration [1]. Wheat (Triticum aestivum) could play a major role in meeting these needs, as it accounts for more than 20% of total human food production globally [2]. Moreover, it can provide high yields, and wheat grain has high nutritional value, including high carbohydrate and protein contents [3]. However, soil salinity is a major constraint for wheat production globally, reducing crop yields by up to 60% in some areas and inhibiting its cultivation in others [4]. Thus, in numerous arid and semi-arid regions where wheat is an essential component of people’s diet, soil salinity causes deficiencies in food production [5].
Moreover, global climate change is accelerating soil salinization, especially in arid and semi-arid regions [6,7]. As a result, over a billion hectares of arable land, roughly 25% of the global terrestrial area, is affected by salinity annually. Furthermore, due to both primary salinization (driven by natural processes) and secondary salinization (driven anthropogenically, for instance, by inappropriate irrigation methods), this is expanding by approximately 10 million hectares annually [8,9].
Salinity tolerance is a complex trait that may involve morphological, physiological, and metabolic processes that counter salinity stress and can vary substantially among plants of different taxa and lineages [10]. For example, changes in ion transport mechanisms may enhance osmotic tolerance by reducing the entry of toxic ions into sensitive compartments and promoting tissue tolerance [10,11,12]. However, the fact that salinity has three main adverse effects on crops and other plants complicates breeding efforts. Firstly, elevated dissolved salts reduce the soil’s osmotic potential, hindering plants’ water absorption, similarly to drought [13]. Secondly, it can cause plants to absorb and accumulate toxic levels of salts in their leaves. Thirdly, excessive Na+ and Cl ions concentrations may hinder plants’ absorption of essential mineral nutrients, such as K+, Ca2+, and Mn2+ [14,15], thereby perturbing their ionic balances and metabolic processes [16].
The perturbance of metabolic processes diminishes plants’ growth, development, and yields, to degrees that depend on the severity of the salinity relative to their tolerance [17,18]. The developmental stage is also important, as plants are generally more susceptible to salinity during germination than in the seedling stage [11]. However, seed production, for example, grain yield of wheat [19] and seed set of rice [20], can be more severely affected by salinity than vegetative growth.
Wheat is a moderately salt-tolerant crop with a salinity threshold of 7.1 dS m−1 [21,22]. Effects of salinity stress on wheat growth, development, and grain yield have been extensively studied, but the knowledge about relative salt tolerance of wheat grains and the effect of salinity on grain quality is still limited [17]. However, studies [15,23] indicated that 7.5 and 15 dS m−1 salinity adversely affected yield, grain weight, spike length, number of grains, and grain filling of six wheat genotypes (9476, SARC-1, SARC-7, SARC-8, Bhakhar, and Saher 2000). Similarly, it was found that 15 dS m−1 salinity significantly reduced yield, yield components (particularly number of tillers and grain weight per plant), protein percentage, fat, and fiber contents of grains of the genotype Pasban-90 [17].
Despite breeding efforts using ancient relatives of bread wheat, strong salinity-tolerant varieties have still not been developed. This can be partly explained by so-called ‘linkage drag’, i.e., the possibility that the introduction of beneficial traits, such as salinity tolerance, through breeding may be accompanied by unfavorable traits, such as lodging, low baking quality, or poor threshing quality [24,25,26]. In addition, inadequate identification of physiological and morphological traits associated with salinity stress at specific growth stages and inconsistencies in genetic pools of accessible wheat varieties have also contributed to the limited success of breeding programs [27]. Nevertheless, the salinity tolerance of bread wheat has been enhanced through a breeding program involving evaluating plants in various developmental phases in greenhouse and field conditions during three growing seasons. A number of the resulting synthetic backcross lines exhibited greater salt tolerance than their parents [28]. Moreover, wheat growth under saline conditions has been improved by introducing (through crossing) an ancestral Na+ transporter gene into a commercial wheat variety [29].
Salinity tolerance is traditionally described using the model developed by Maas and Hoffman [30]. This model is often evaluated by a two-step linear regression of salinity versus (usually relative) yield. The first part of the resulting graph is flat until a threshold value is reached, then yield starts to decline as salinity increases. The key salt tolerance parameters are the salinity threshold (often expressed as ECpthr: electric conductivity of pore water) and the decline’s absolute or relative slope (S or S%). In addition, in field experiments where it is impossible to expose plants to zero salinity, the zero-observed-effect yield (Y0) must be estimated. A second common model is the S-shaped curve, described by [31], with two parameters: the soil salinity at which the yield is 50% of Y0 (ECp50) and a dimensionless slope parameter (p) describing the curvature. An advanced procedure for estimating parameters of these models was developed by [32], who focused on uncertainties of the estimates and advocated for the use of the EC90 value (the salinity at which the yield is 90% of Y0) as a more agronomically relevant parameter.
The salt tolerance parameters provide important indications of the effects of salinity relative to a variety’s growth in non-saline conditions. However, a variety may be more sensitive than others to salinity in terms of its threshold or EC90 value but still provide higher yields at a given salinity. Thus, the estimated yield at low or intermediate salinity is often the parameter of most interest to farmers because they want to maximize yields. Therefore, it is important to consider both relative tolerance and absolute yields (expressed as TGW in our study) at each field’s specific salinity level when selecting varieties in practice.
Using an ethyl methanesulphonate (EMS) mutagenized wheat population, several mutagenized lines were found to be more salt-tolerant relative to the observation of greater seed germination than the original Bangladeshi BARI Gom-25 variety in field trials in southern Bangladesh, where salt was present from the start in the soil (ECe > 7 dS m−1) [33]. Thus, molecular breeding via genetic manipulation performed at the DNA molecular level, induced by EMS, can efficiently produce salt-tolerant mutagenized lines as potential future varieties. Here, we report a complementary investigation with 23 of the 70 mutagenized wheat lines successfully tested in southern Bangladesh. However, the climatic conditions strongly differed, and salinity treatments were applied after the seedling stage with a controlled drip irrigation system. This research aimed to assess the lines’ TGW and their relative salt tolerance in efforts to translate their salinity tolerance at the germination stage to salt-tolerance parameters later in plant development. This was applied under more moderate European climate conditions to identify possible salt-tolerant, high-yielding varieties for future cultivation in Europe. Thus, if not outcompeting existing high-yielding European varieties, the lines can lay the ground for molecular markers to be used in breeding programs to adopt existing varieties to future increased saline conditions.

2. Materials and Methods

2.1. Plant Material and Experimental Design

The salinity tolerance of 23 mutagenized wheat lines and BARI-Gom 25, the control variety from which they were derived [33], was tested by cultivation in four replicates of plots subjected to 1, 4, 8, 12, 16, and 20 dS m−1 salinity treatments, providing 576 sets of records in total. In each (8 m × 1.25 m) plot, 4 four rows of 24 plants were sown with within- and between-row spacing of 10 and 30 cm, respectively. The sowing of the seeds took place on 10 May 2018, and the harvest took place on 17 August 2018. The experimental test field (latitude 53.0285377, longitude 4.7676436) is located on the island of Texel, Netherlands, and has been used to assess the salinity tolerance of many crops and crop varieties since 2012 [32,34,35]. Each plot was automatically drip-irrigated with a mixture of fresh water and seawater to the desired salt concentration, and the saline water was applied from 30 days after sowing until the end of the field trial. Drip-irrigation occurred daily with an average of 8.4 mm/day over the growth period. The saline water was applied in increasing increments of 4 dS m−1 each morning and evening (to avoid an osmotic shock) to reach 20 dS m−1 after three days in plots with the highest saline concentration. The seasonal average salinity of the soil was evaluated by measuring the EC of samples by various methods based on equivalent saturated paste EC (ECe), or directly as pore water EC (ECp), using suction cups placed under a vacuum. In this study, the seasonal mean ECp values were used, roughly equivalent to the soil ECe [35].

2.2. Field and Weather Conditions at the Salt Farm Texel

The soil at the Salt Farm Texel consists of about 93% sand, 3% loam, 2% clay, and 2% organic matter. The soil particle density is around 2.5 mg/m3, and the bulk soil density at saturation is around 1.5 mg/m3, with a field capacity pF of around 2. At the Texel test site, a base dose of nutrients consisting of compost, manure (both certified organic), and two types of organic fertilizer was applied. Compost added was 20 tons/ha, manure 12 tons/ha, and 1 ton/ha of each organic fertilizer, Orgevit, and Monterra Malt. The chemical composition of the added compost, manure, and fertilizers is visualized in Table 1. The sodium adsorption ratio (SAR, 1 M ammonium acetate) values obtained for the plots subjected to different salinity treatments were on average: 0.9 mmol/L (1 dS m−1), 3.5 mmol/L (4 dS m−1), 5.0 mmol/L (8 dS m−1), 6.4 mmol/L (12 dS m−1), 8.5 mmol/L (16 dS m−1), and 9.2 mmol/L (20 dS m−1). The pH observed in the field was in the range of 7.38–7.52. The level of available K and P based on H2O extraction (1:20, solid solution ratio, 1.5. h) were on average: 20.3 mg K/kg and 17 mg P/kg (1 dS m−1), 31.3 mg K/kg and 21.3 mg P/kg (4 dS m−1), 32.7 mg K/kg and 22.7 mg P/kg (8 dS m−1), 46.3 mg K/kg and 25.3 mg P/kg (12 dS m−1), 45.7 mg K/kg and 24.7 mg P/kg (16 dS m−1), and 46.3 mg K/kg and 20.3 mg P/kg (20 dS m−1).
From sowing (10 May) until harvest (17 August), a total amount of 101 mm of precipitation (rain) was recorded. The average temperatures observed were collected from: May, high 12.8–16.1 °C, low 7.8–10.6 °C; June, high 16.1–18.3 °C, low 10.6–13.3 °C; July, high 18.3–20 °C, low 13.3–15 °C; August, high 18.9–20 °C, low 14.4 °C (data collected at Texel airport near Salt Farm Texel, www.weatherspark.com (accessed on 20 March 2022)). Daily radiation sum: 2105 J/cm2 (data for De Kooij near Salt Farm Texel, www.knmi.nl (accessed on 20 March 2022)).

2.3. Phenotypic Measurements

Each mutagenized line’s growth and salinity tolerance and the BARI Gom-25 control variety were phenotypically assessed. The number of live plants, average plant height, and the average number of tillers per plant was measured in the field 70 days after sowing (DAS), when the inflorescences were emerging, at growth stage 58 according to the Zadoks scale [36]. Eight representative plants per line (including the control) were measured in the field to obtain average plant heights and numbers of tillers. All spikes of the plants in the field were harvested after 100 DAS, at the ripening, growth stage 90 [36]. On each sampling occasion, the spike material harvested from plants belonging to the same mutagenized line, salinity treatment, and plot replicate was placed in a separate sample bag and dried. Eight representative spikes were collected from each sample bag, photographed, measured, and calculated their average length. These eight spikes from each mutagenized line were separated from the other spikes before threshing. All harvested samples were threshed, including the separated eight-spike samples. Grain weight was collected for each separated eight-spike sample. The TGW was collected for the entire sample material, including the remaining and the separated eight-spike samples.

2.4. Data Analysis

Excel 2016 (MS Windows software, Version 16.0, Microsoft, Redmond, WA, USA) was used to clean the data and calculate the initial averages of the variables. TGW was statistically analyzed using Minitab 19 statistical software, State College, PA, USA [37]. A general linear model (GLM) was used to assess the differences between replicates (treated as a random factor), salinity, and lines. A histogram of residuals was used to assess the GLM’s validity. Tukey’s pairwise comparison was used to group significantly different means at the 95% confidence level. Grouping the differences between the BARI Gom-25 control and mutagenized wheat lines were made by Dunnett’s multiple comparisons at the 95% confidence level. Pearson correlation analysis (also with a 95% confidence threshold) was used to evaluate correlations between measured variables (the stronger the deviation of correlation coefficients from 0 to 1 or −1, the stronger the correlation between two variables). Data related to lines cultivated at 20 dS m−1 were removed from the final calculations due to their low yields at this salinity.
Estimates of model parameters were obtained to evaluate the relative salt tolerance of all mutagenized wheat lines and the BARI Gom-25 control using MATLAB and previously described statistical methods were applied to assess salinity effects on the TGW of each line and control [32]. Results regarding variations in TGW according to both the van Genuchten–Hoffman and Maas–Hoffman models are presented. Values presented in x ± y 186 format are means ± standard deviations, with n = 24.

3. Results

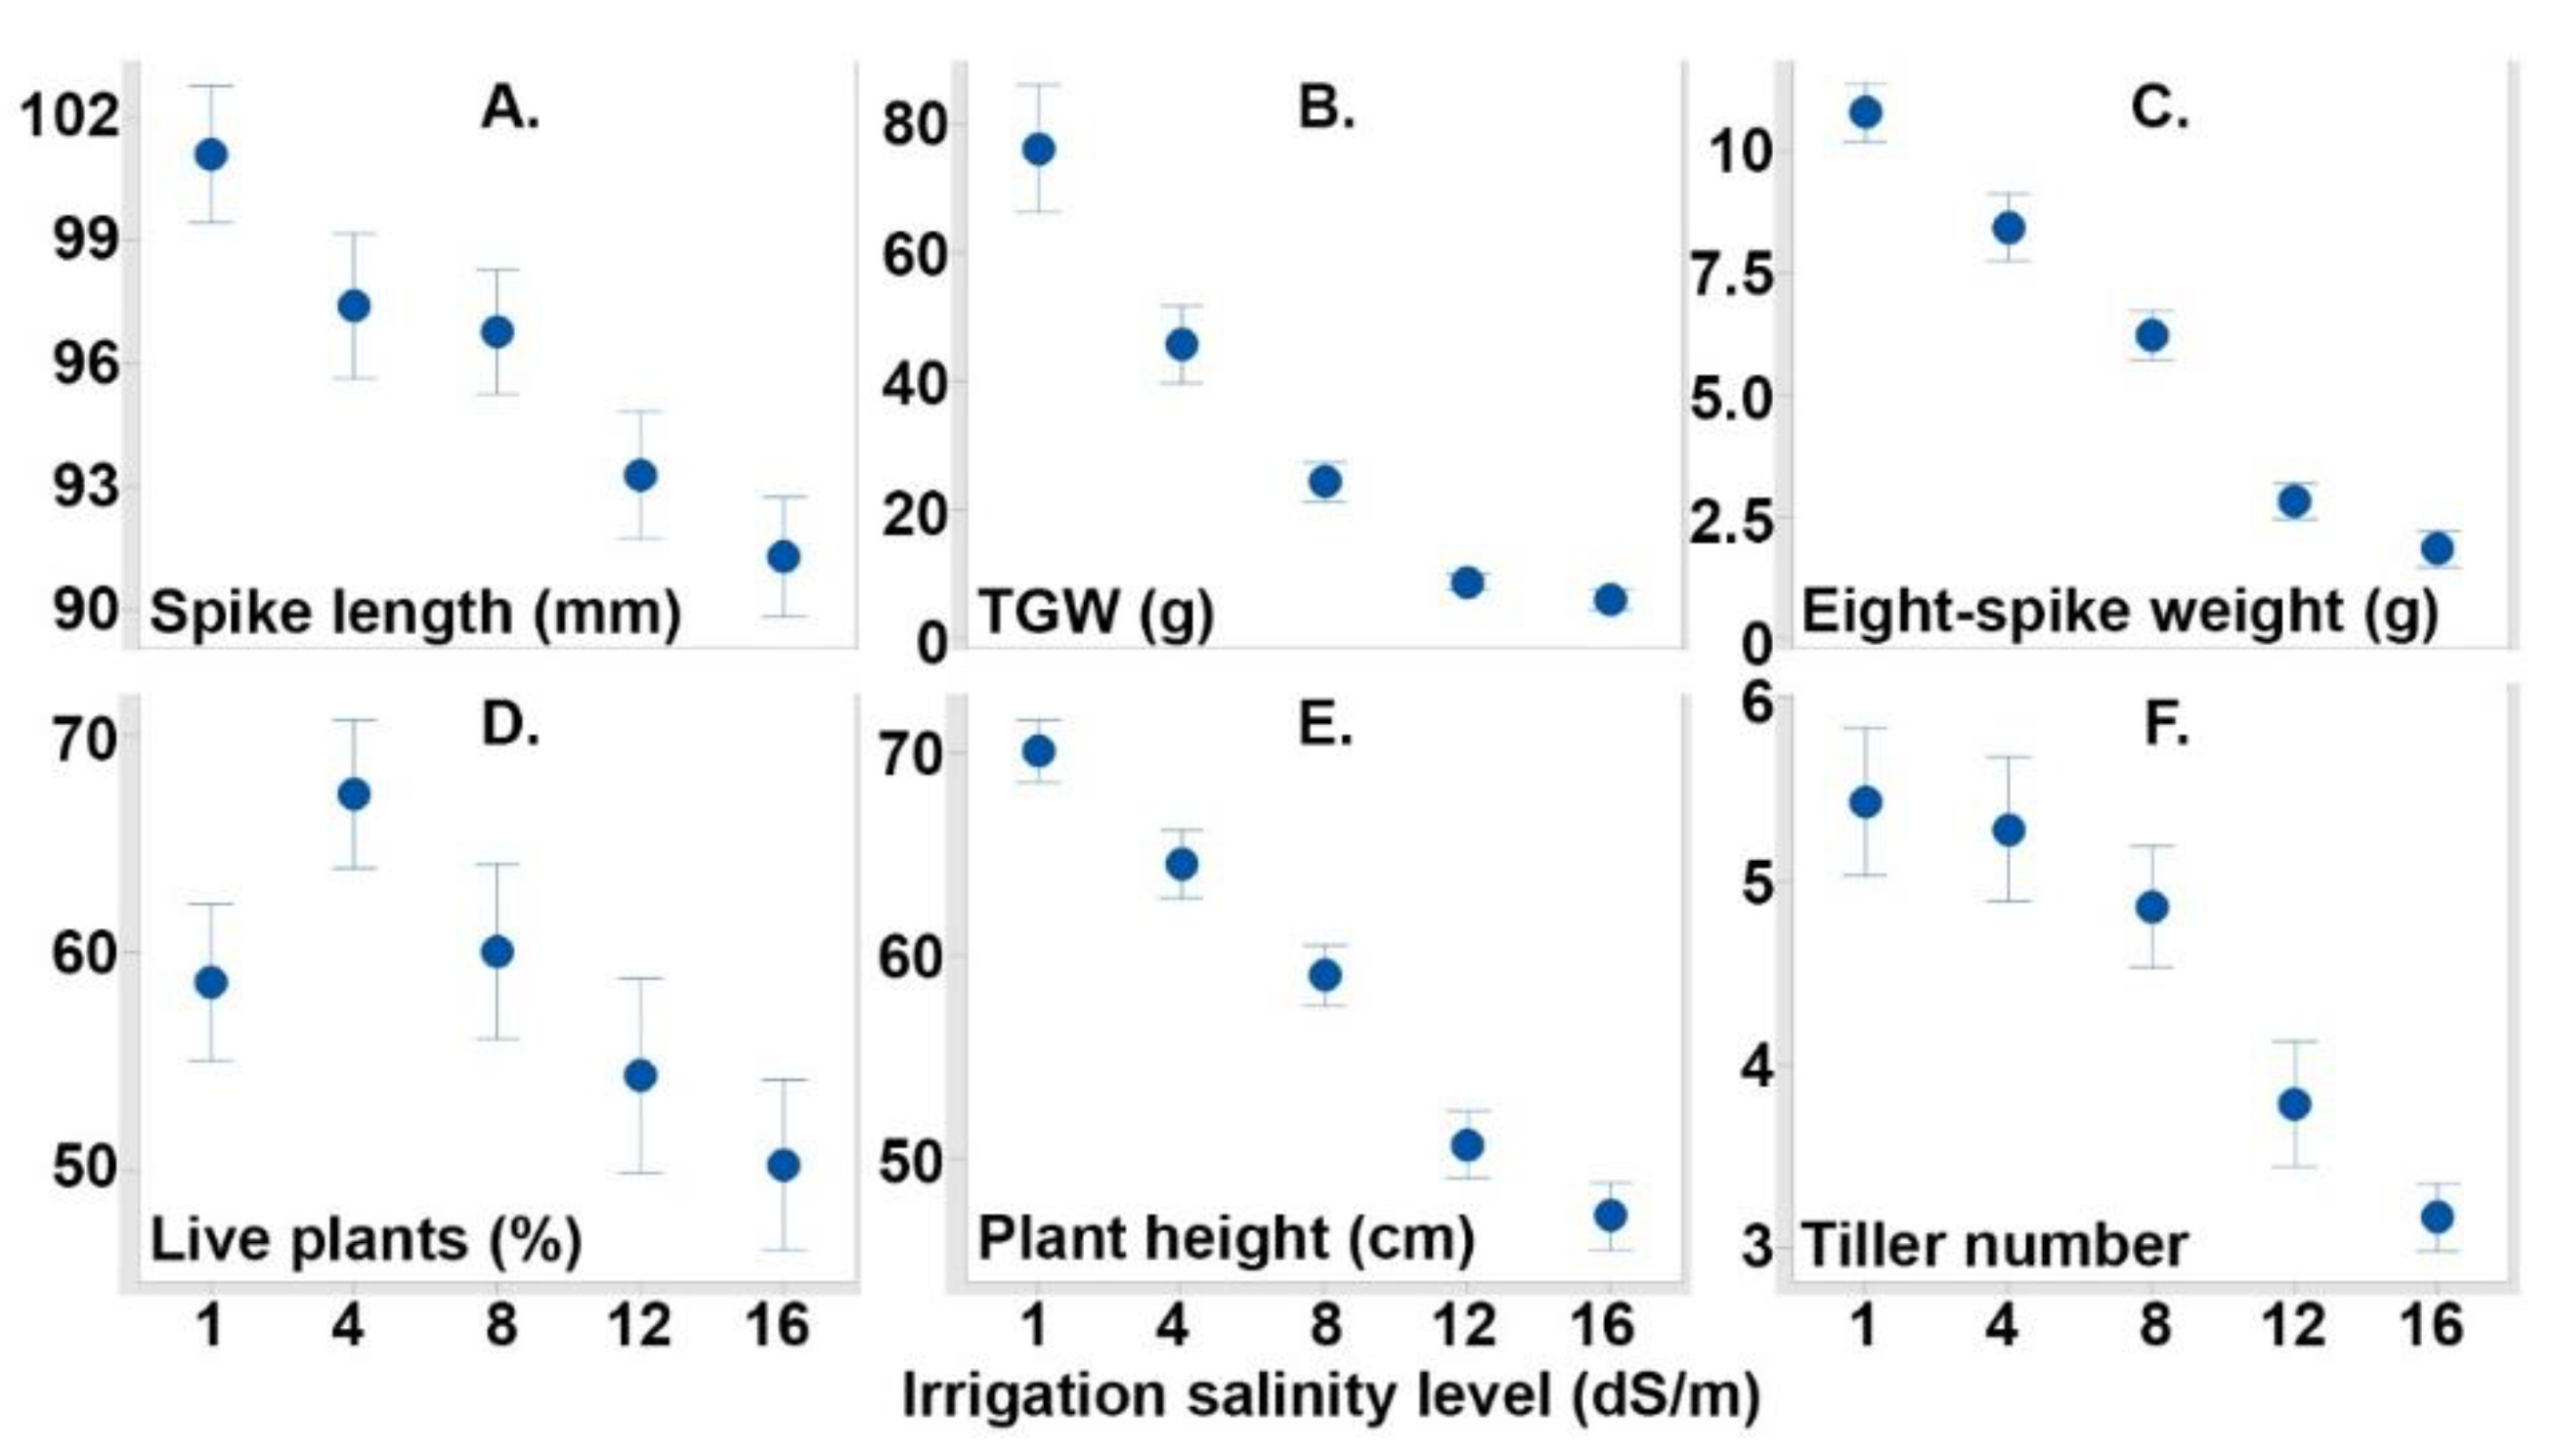
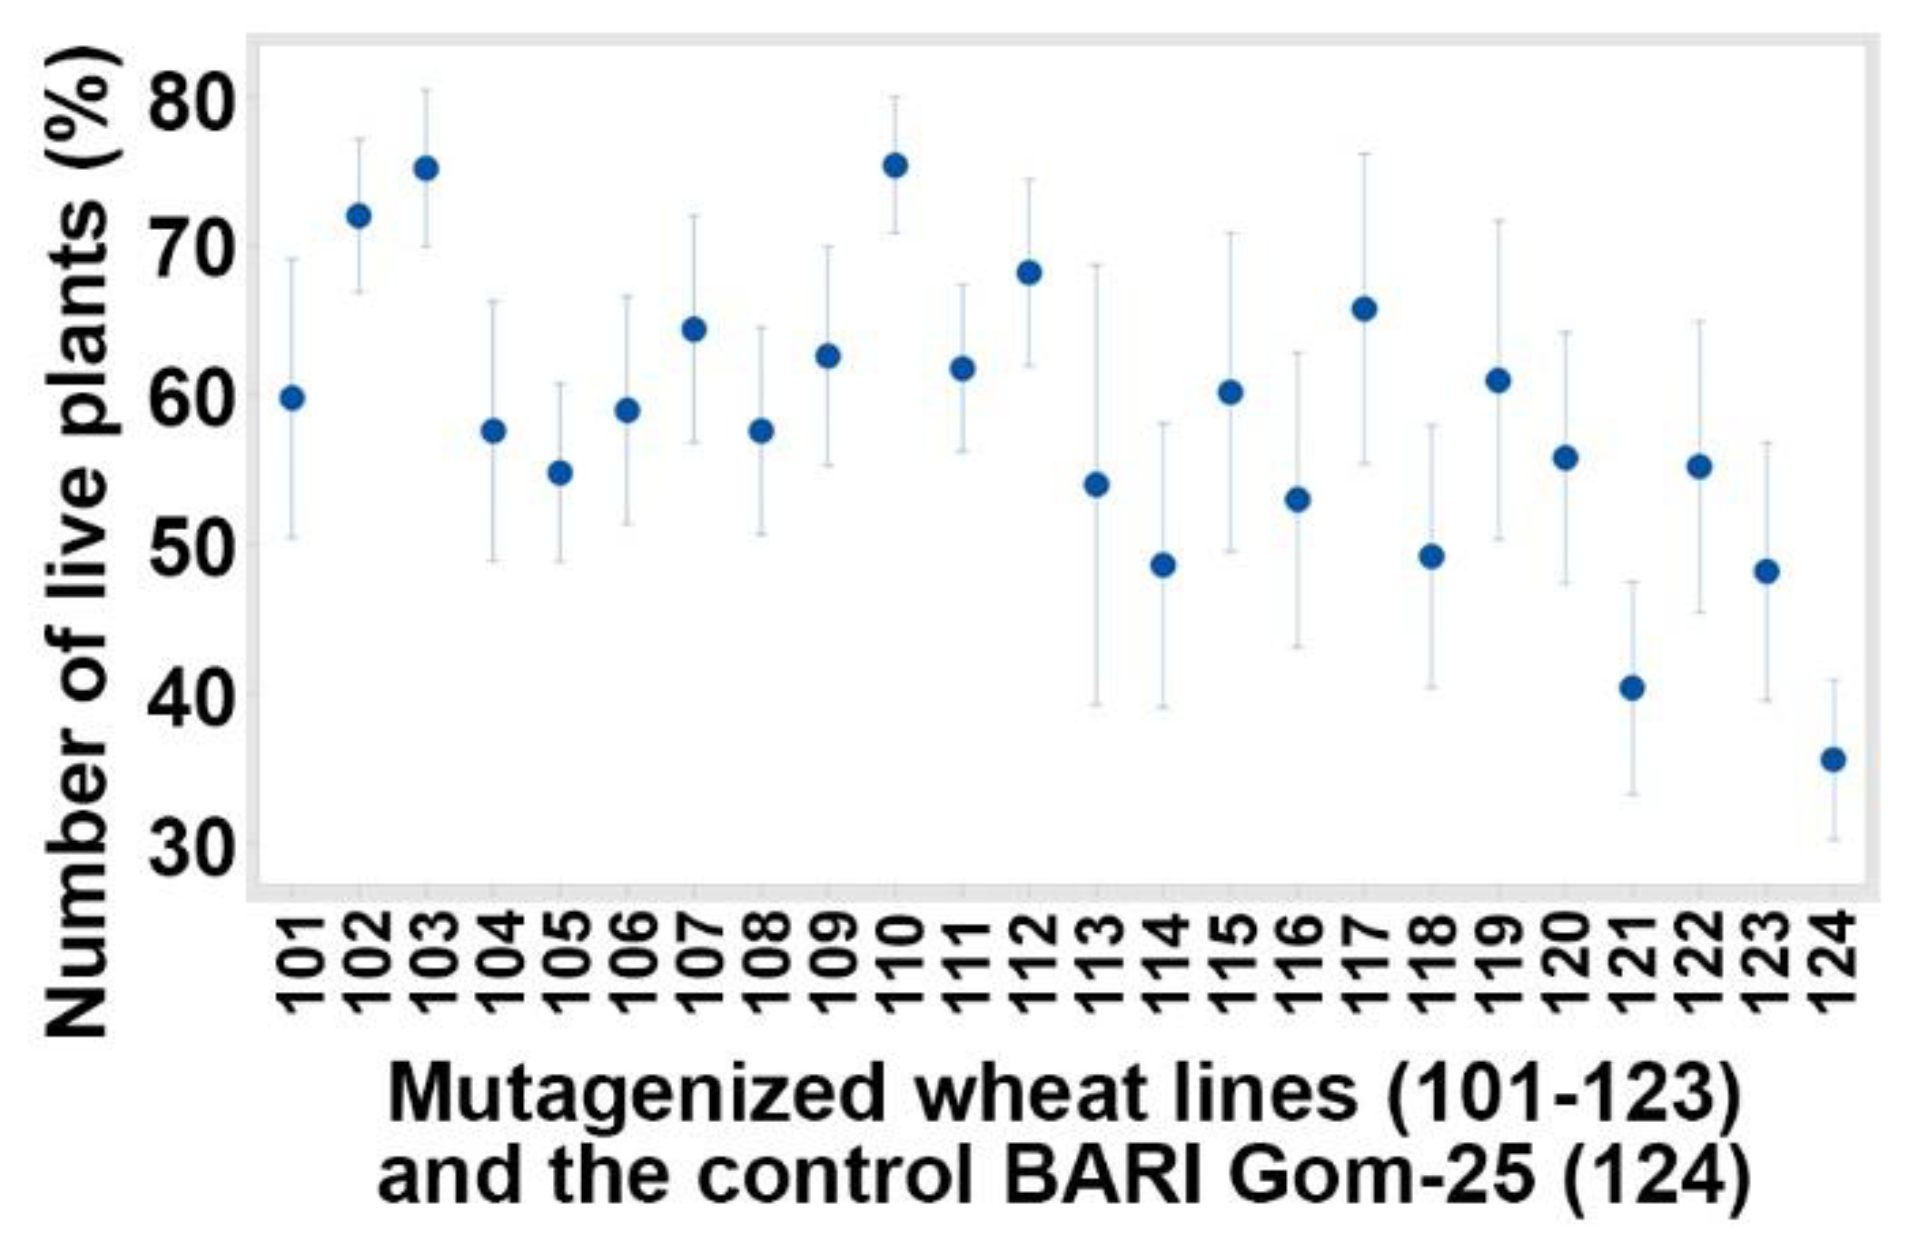
3.1. Evaluated Variables

Average spike length, total grain weight (TGW), eight-spikes length, percentage of live plants, plant height, and the number of tillers of all mutagenized lines and the control declined as soil salinity increased (Figure 1). The only exception was that the percentage of live plants was higher at 4 dS m−1 (67.29 ± 1.73%) than at 1 dS m−1 (58.67 ± 1.82%) (Figure 1). Moreover, Pearson correlation coefficients (e.g., −0.662 for TGW and salinity) confirmed that all the variables significantly declined as the irrigation salinity increased (Table 2). Other evaluated variables were significantly positively correlated with each other, e.g., spike length was correlated with TGW (coefficient: 0.360) and plant height with tiller number (coefficient: 0.468). Therefore, further analysis focused on TGW, which is the most relevant agronomical variable for farmers and other stakeholders.

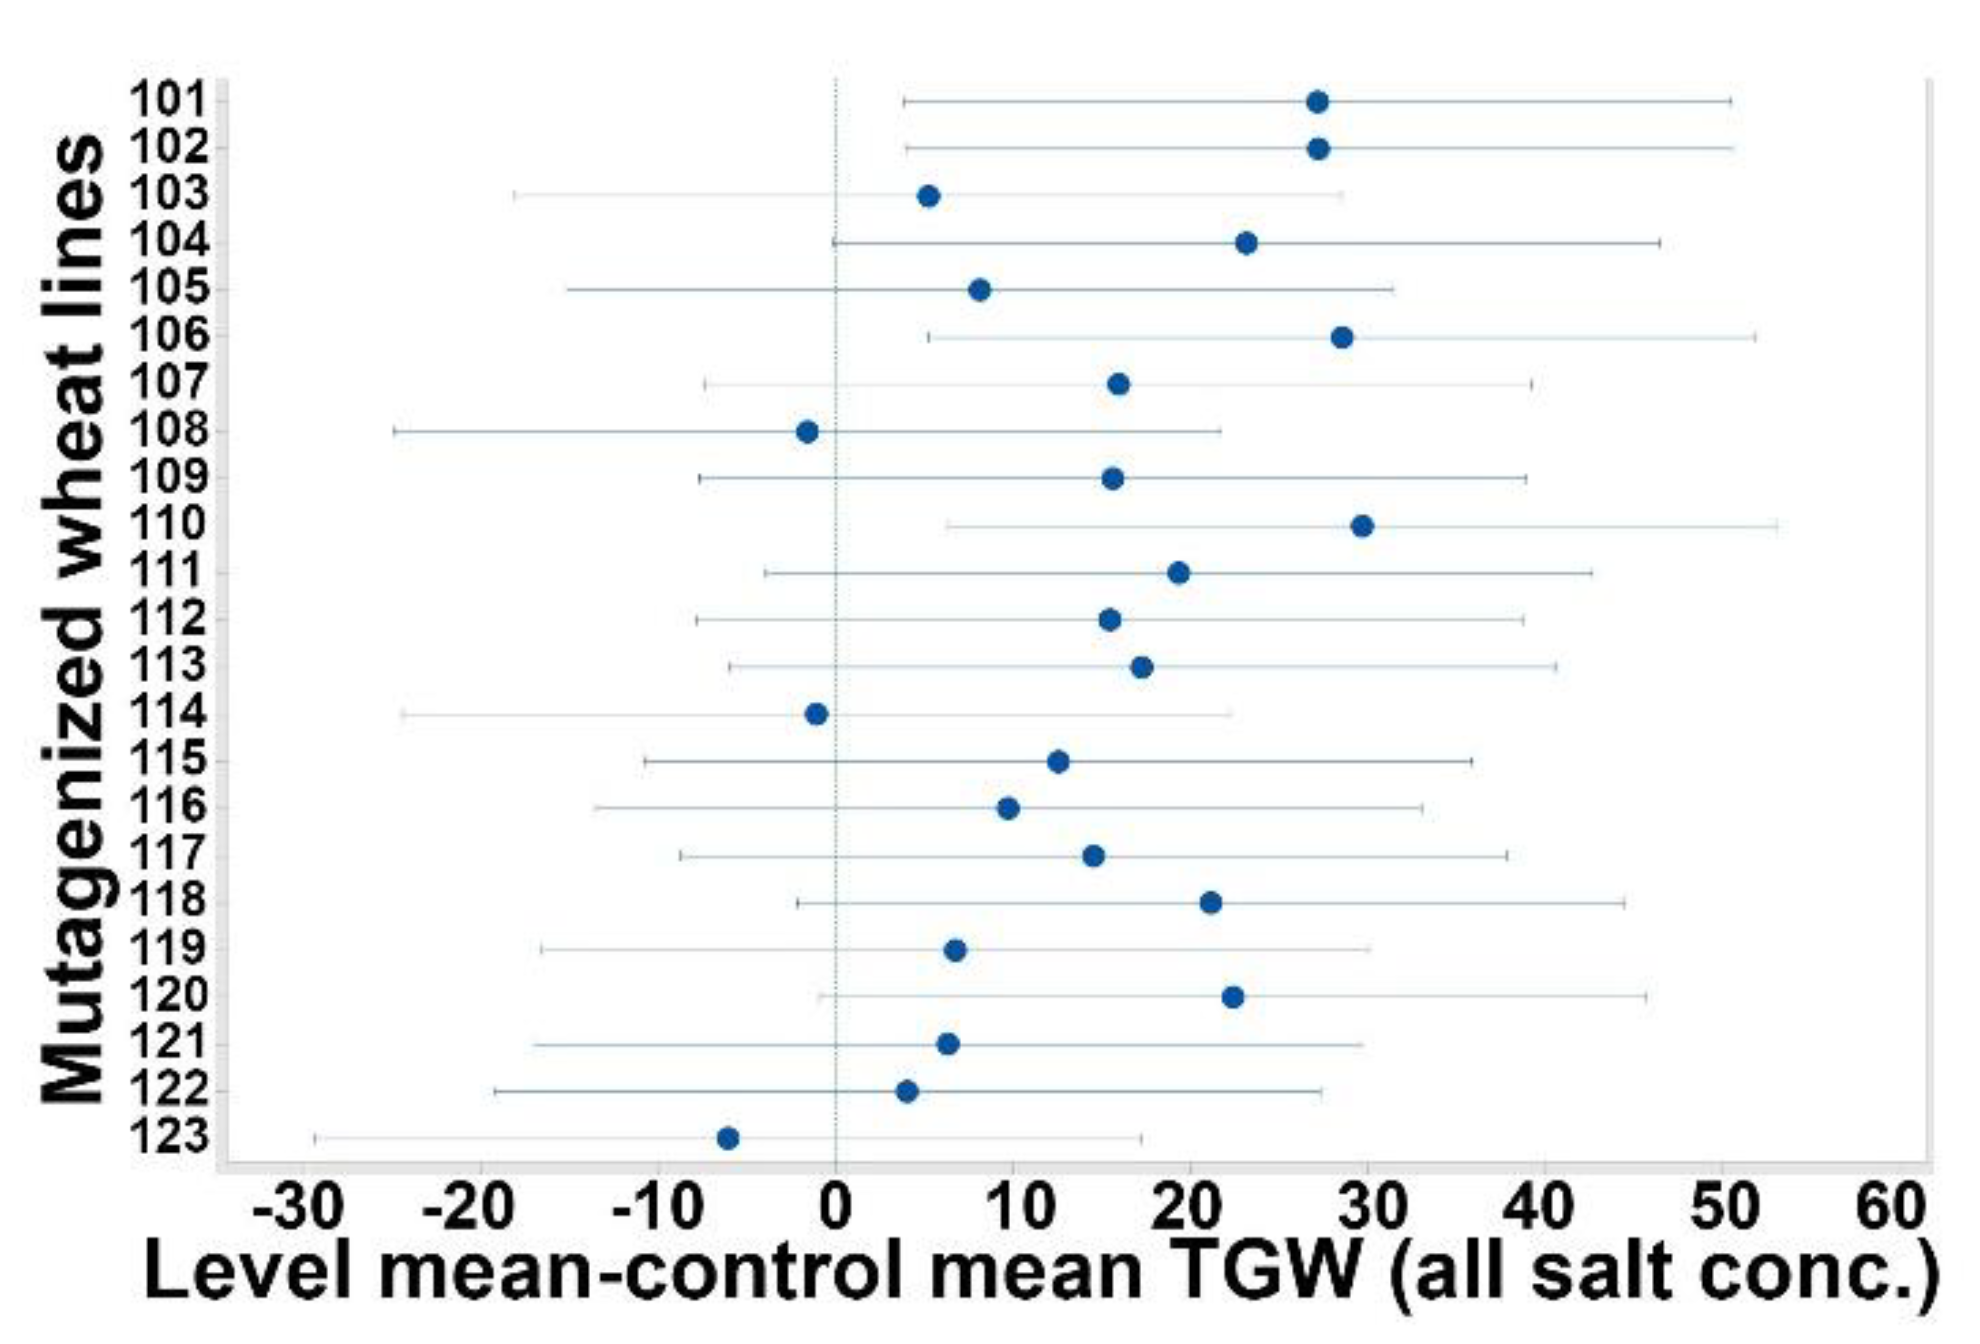
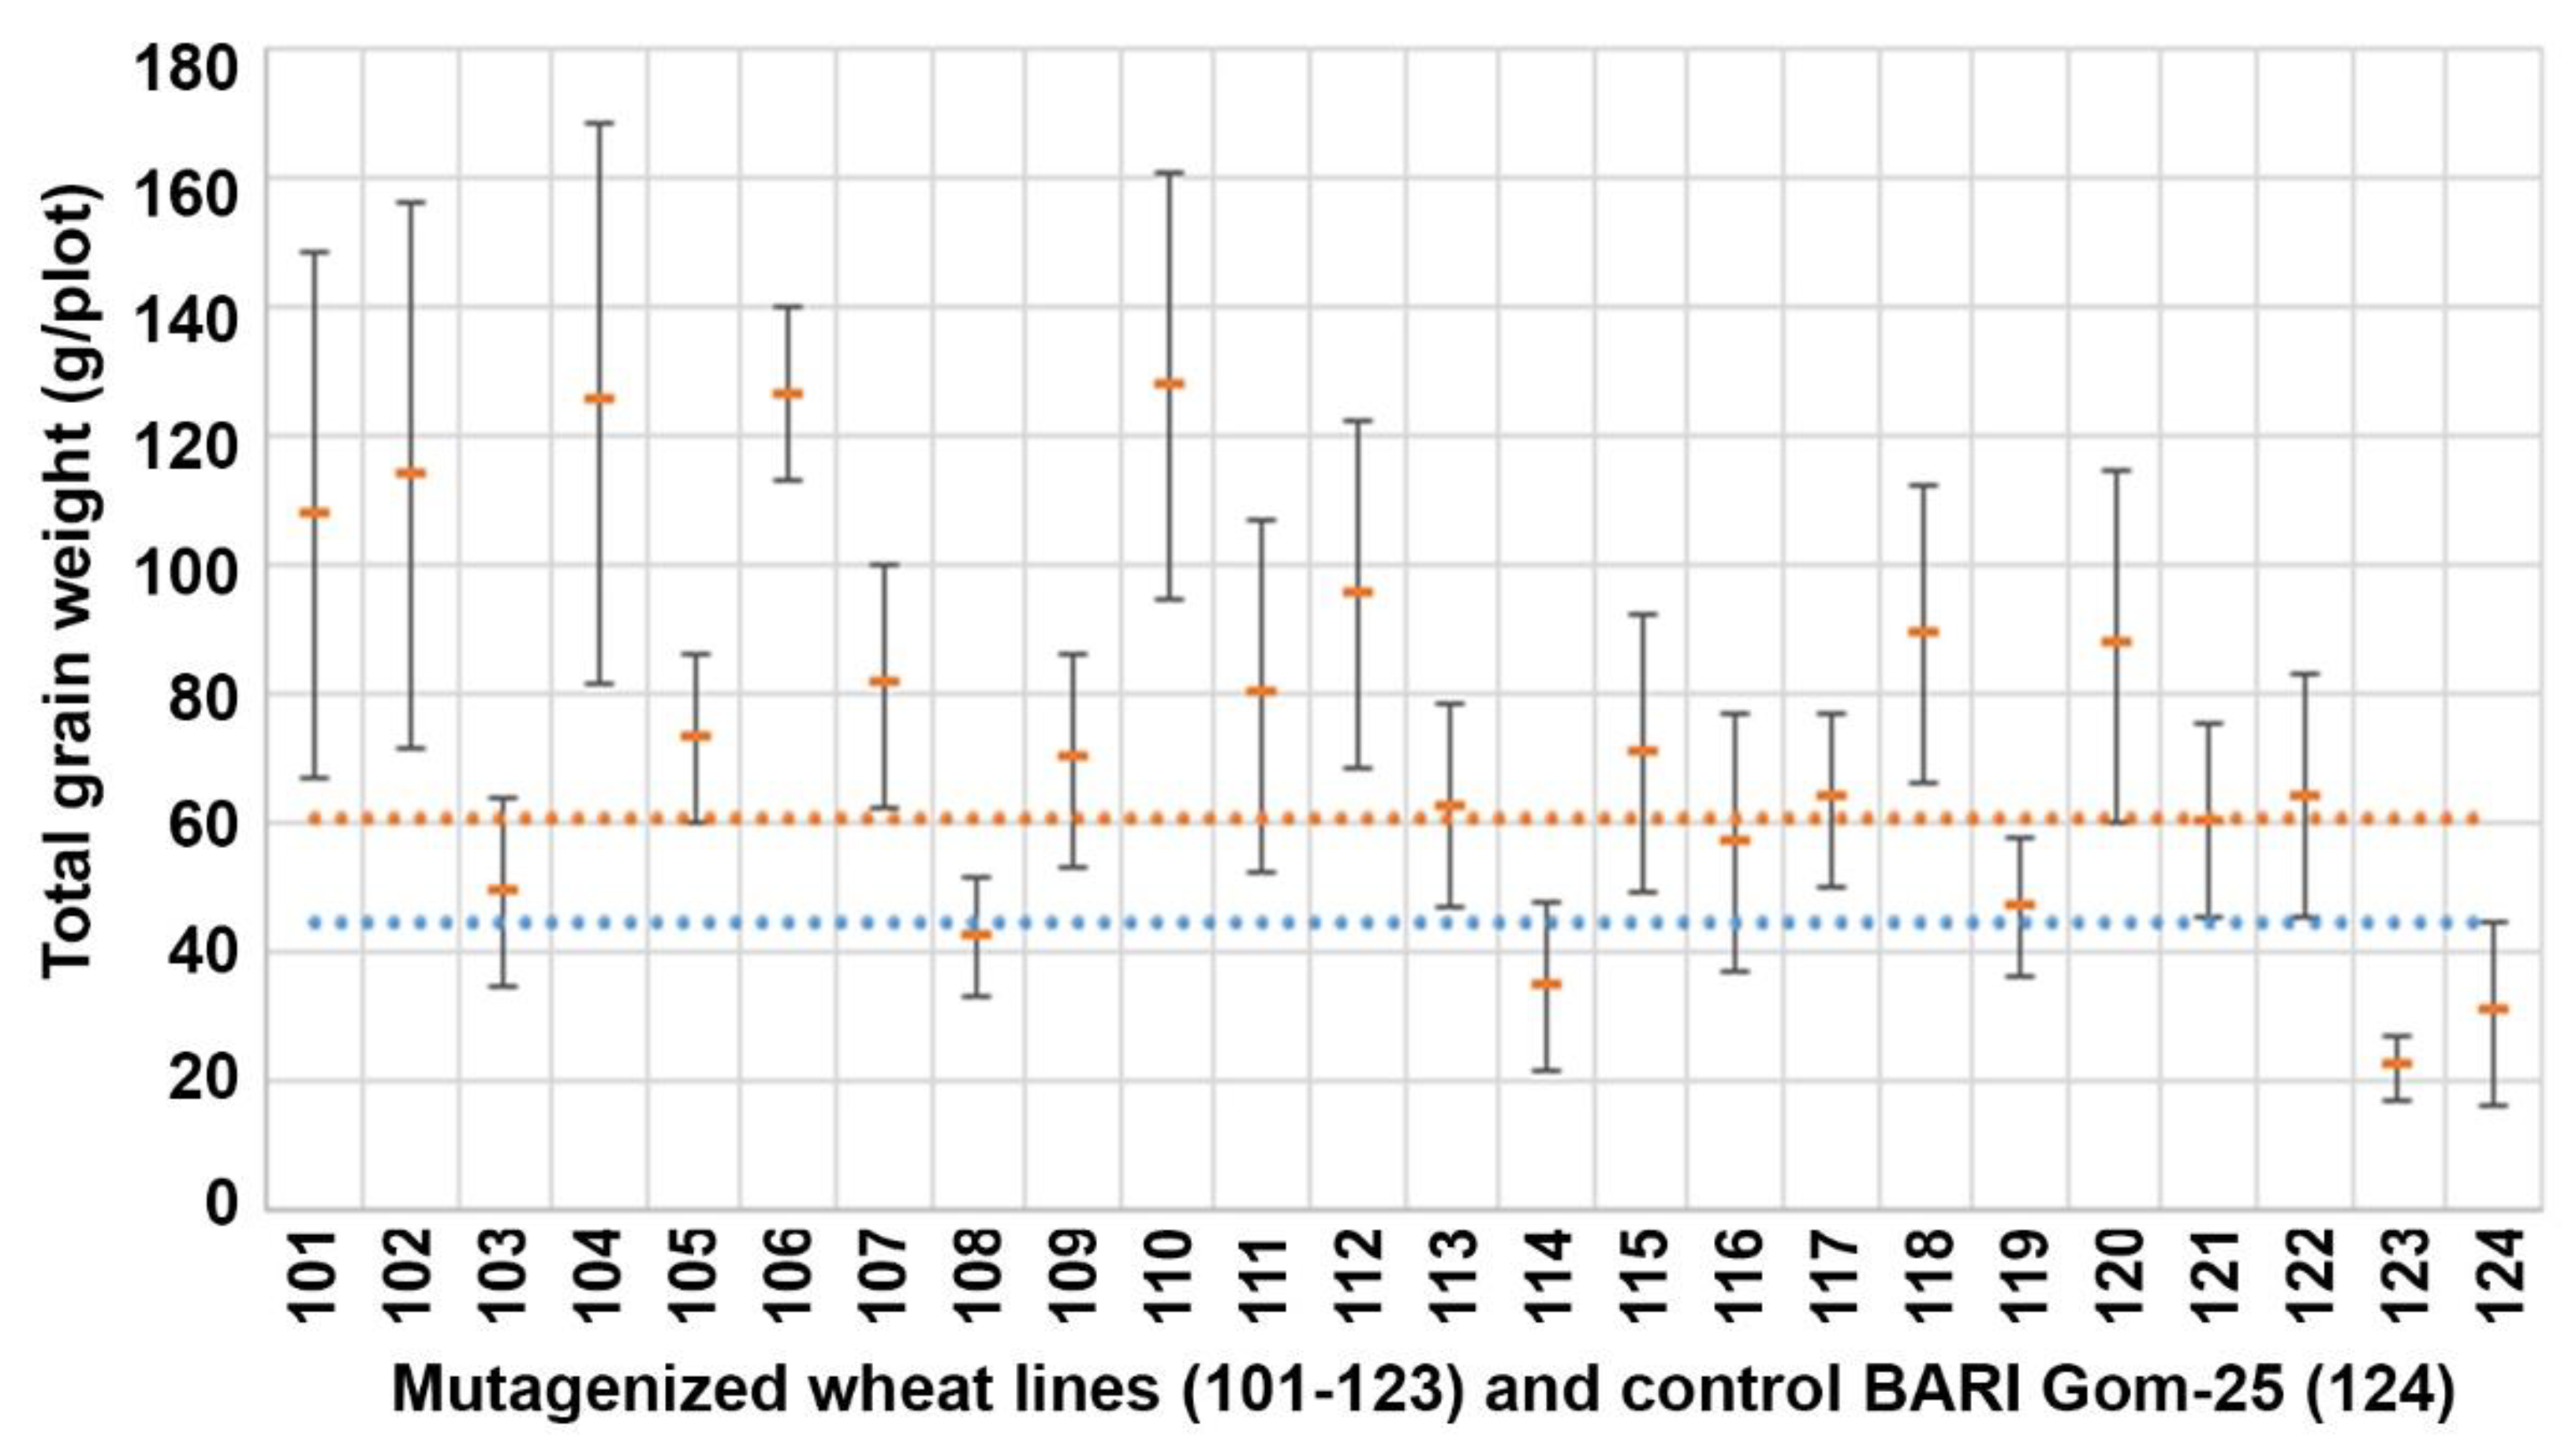
3.2. Total Grain Weight (TGW)

As shown in Figure 2, nine of the 23 mutagenized lines (lines 101, 102, 104, 106, 110, 111, 113, 118, and 120, hereafter, ‘promising lines’) had at least twofold higher means TGW than the control at low to severe salinity levels (1–16 dS m−1). The mean TGW of control plants was 18.73 ± 4.19 g/plot, while the TGW of promising lines ranged between 48.46 ± 12.4 g (line 110) and 36.03 ± 7.76 g (line 113). The mean TGW of the other lines ranged between 34.70 ± 7.65 g (line 107) and 12.64 ± 2.42 g (line 123).
Under the 1 dS m−1 salinity treatment, line 110 had much (roughly fivefold) higher TGW (137.54 ± 29.5 g) than the control (29.07 ± 8.49 g), while the TGWs of the other promising lines ranged from 65.71 ± 19.8 g (line 113) to 131.18 ± 13.1 g (line 106) (Figure 3A). Under 4, 8, 12, and 16 dS m−1 salinity treatments, all the nine promising lines also generally grew substantially more strongly than the control (Figure 3B,E). For example, at 4 dS m−1, the TGW of the control was 32.34 ± 14.0 g, while the TGWs of the promising lines ranged from 36.09 ± 12.1 g (line 104) to 75.59 ± 20.4 g (line 120). At 8 dS m−1 the control value was 20.72 ± 8.26 g, while the promising lines’ TGWs ranged between 24.51 ± 2.82 g (line 102) and 43.41 ± 11 g (line 111). At 12 dS m−1, the TGW for the control was 8.31 ± 1.29 g, while the promising lines’ values ranged from 8.41 ± 2.02 g (line 120) to 15.82 ± 3.43 g (line 111). Finally, at 16 dS m−1 the control value was 3.23 ± 1.24 g, while the promising lines’ TGWs ranged from just 1.63 ± 0.56 g (lower than the control, line 118) to 16.84 ± 12.0 g (line 101).
Overall, the promising lines had significantly higher TGW than control plants at all salinity levels (Figure 3), but there were some deviations. For instance, at 12 dS m−1, salinity-tolerant lines 101 and 120 had similar TGWs to the control (Figure 3D), while at 16 dS m−1, line 101 had at least fivefold higher TGW than the control (Figure 3E). The TGWs of the promising lines were not lower than the control value in any case except one: line 118 at the 16 dS m−1 salinity level (Figure 3E).
There were at least 10 cm spacings between the plants to avoid strong inter-plant competition. Thus, the loss of live plants from salinity stress should have had a limited effect on the growth of neighboring plants and, hence, the TGW. However, it should be noted that the percentage of live plants was lowest for the BARI Gom-25 control (35.60 ± 2.58%; Figure 4), which had a correspondingly low TGW (Figure 2 and Figure 3).

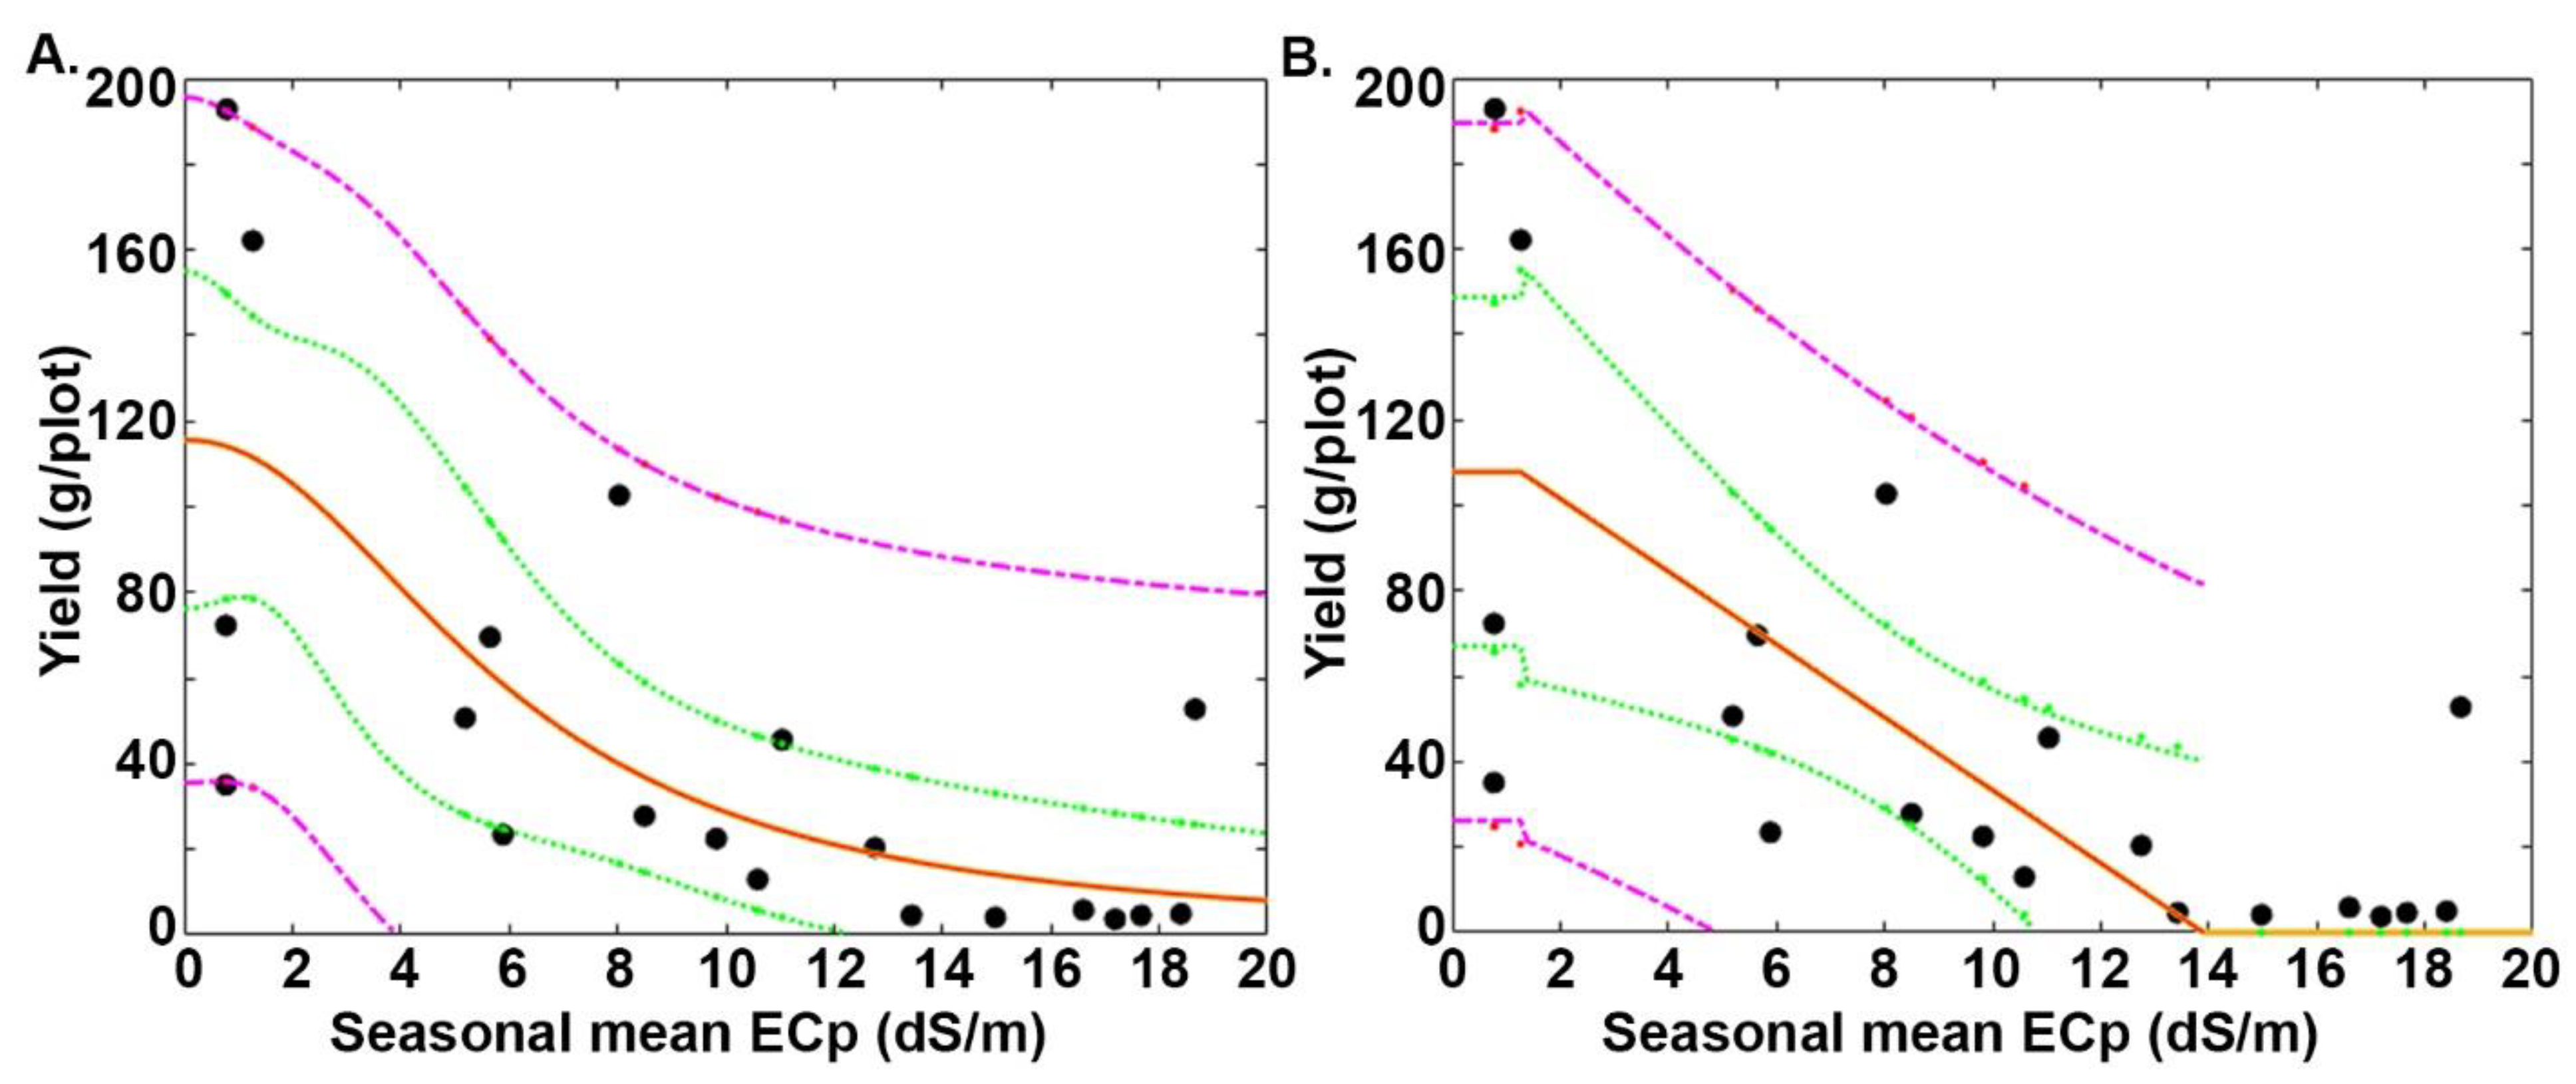
3.3. Relative Performance on the Mutagenized Lines under Saline Conditions According to Two Models

Two models were applied to assess the lines’ salt tolerance levels. To illustrate the type of graph that this kind of analysis produces, Figure 5 presents a graph generated by a previously described method [32]. This shows the performance of line 101, the first line identified as having better responses than the control to increases in yield potential in terms of TGW (Figure 2).
The parameter estimates for the Maas–Hoffman and van Genuchten–Hoffman models of salt responses of the other lines are presented in Table 3. These include the estimated zero-observed-effect yield and two important salt tolerance parameters for each line, as well as EC90 and EC50 estimates generated by both models to facilitate comparisons. In addition to the presented values, confidence intervals (CI) were calculated (data not shown).
The 95% CI of the estimated zero-observed-effect yields for both models are shown in Figure 6. Although there were some minor differences in findings from those shown in Figure 1, generally, the results confirmed that several lines had significantly higher yields than the control. The 95% CI values of all salt tolerance parameter estimates of all the lines overlapped with those of the control line (data not shown), indicating that all lines’ responses to elevated salinity levels were similar in terms of relative yield losses.

4. Discussion

Salt-tolerant plants will play important roles in the future because the area of saline soil is sharply increasing, and it strongly reduces or impairs agricultural productivity. BARI Gom-25 is one of several salt-tolerant varieties that has been introduced in the last decade in Bangladesh [38] to fight this, especially in the southern coastal area, which has a large proportion of salt-affected soils exceeding 2 dS/m [39,40]. This threatens farmers’ food production and livelihoods in these areas [41]. Thus, it was promising that a number of mutagenized wheat lines were previously shown to germinate well under a 7 dS m−1 salinity treatment. Moreover, they outcompeted the control variety BARI Gom-25 in terms of several variables in Bangladeshi conditions [33]. As reported here, in a further assessment of their potential utility, we tested their performance across a wide range of salinities in more moderate European climatic conditions. Thus, we wanted to test another climate, test not adding salt from the start, etc., to compare with previous data in Bangladesh.
A potential complication is that the drip irrigation setup did not allow salt application before the germination stage. Thus, although these mutagenized wheat lines reportedly have high germination rates even in highly saline soil [33], they might not have had similar salinity tolerance at later stages when other mechanisms may be involved [42,43]. Nevertheless, nine of the mutagenized lines had at least twofold higher TGW than the BARI Gom-25 control at 1–16 dm/S salinity levels (Figure 2), and salt tolerance (Y0) estimates confirmed that these promising lines (and some others) significantly differed from control plants in this respect (Figure 6). Zero-effect-yield estimates obtained using the Maas–Hofmann model also showed that most mutagenized lines performed better than the control. Exceptions were lines 103, 108, 114, 116, 119, and 123 (Figure 6). Moreover, the performances of lines 101, 102, 104, 106, 110, 112, and 118 were at least twofold better than the control, and those of lines 105, 117, and 120 were nearly twofold better (Figure 6). These sets strongly overlapped with the nine promising lines (101, 102, 104, 106, 110, 111, 113, 118, and 120; Figure 2), all of which performed at least twice as well as the control, except lines 111 (which performed almost twice as well) and 113 (Figure 6).
The yield is dependent on the management, the genotype, and the environment [44,45,46]. In our study, the management was the same, but the genotype was different for each individual line, and the environment changed with increased soil salinity. A compensation capacity can be triggered if resources are limited, e.g., when soil salinity increases [47,48]. Different wheat genotypes can have different compensatory actions [47,49]. Plant density affects the compensatory actions as less density can induce an increased number of tillers to compensate for the lack of plants in the field [45]. Greater plant density can lead to greater head and grain numbers per area but a decrease in grain weight per head [44,45,47]. However, as we used the same plant density throughout the experimental setup, the observed declines in tillers and spike length were not linked to the density but to elevated soil salinity, which was also true for the TGW (Figure 1). Thus, the observed increased yield potential for the promising lines is important at high salinity.
Several of the EMS mutagenized lines derived from BARI Gom-25 also withstood soils experiencing rapid increases in saline levels during growth, despite the moderate European climate conditions. This is an important observation as, for example, Australia has had large areas with accumulations of salt-affected soil over the growth period [50,51]. Recently, the native vegetation has been cleared for agricultural land, resulting in short-rooting plants. This allows the rainwater to reach the salty groundwater, which raises and brings the saline water close to the surface, resulting in increased salt-affected soils [51,52,53,54]. Thus, increased salinity tolerance within plants at a germination stage can be translated to salinity tolerance when the salt level conditions are initially low and increase rapidly.
Furthermore, the study shows the strength of applying a controlled drip irrigation method where one can control the saline levels in outdoor conditions. However, due to wide variation among replicates, there are considerable uncertainties in the salt tolerance parameters, and the acquisition of data in a single year data is a clear limitation in salt tolerance studies [32]. Thus, further analysis is needed to determine whether some promising lines have greater salt tolerance than others. Studies have revealed increased salinity tolerance of, for example, maize (Zea mays) and canola (Brasscia napus L.) when grown in conditions with optimized manure [55,56]. Whether the salinity tolerance of any of the promising lines in this study can be further increased in saline soil by elaborating the balance of added manure remains to be elucidated. Nevertheless, the finding that some of the mutagenized lines developed for Bangladeshi conditions provided higher yields under drip irrigation in a moderate climatic zone is reassuring and indicates good prospects for enhancing wheat production on salinized land.

5. Conclusions

Salinity is an ever-increasing challenge for agriculture worldwide. In addition, the human population is increasing considerably. Therefore, sustainable approaches to improving and securing food and feed production in salt-affected soil is vital. Our efforts toward developing salt-tolerant wheat lines have shown to be effective. So far, we have tested the developed salt-tolerant wheat lines in salt-affected soil in Bangladesh, and the results showed that 70 lines had enhanced germination performance compared to the local Bangladeshi wheat variety BARI Gom-25. Moreover, this study compared 23 of these wheat lines using soil salinity induced by controlled drip irrigation in moderate European climatic conditions. Nine lines proved to perform better than the Bangladeshi salt-tolerant variety based on TGW. Thus, the developed mutagenized wheat population can be a valuable resource for enhancing the salinity tolerance of wheat worldwide.

Author Contributions

Conceived and designed the experiments, O.O. and H.A.; performed the experiments, H.M., B.B., G.V.S., Å.R.A., J.L., N.N., S.H. and H.A.; analyzed the data, H.M., B.B., G.V.S., Å.R.A. and H.A.; wrote the paper, H.M., B.B., G.V.S. and H.A.; funding acquisition, O.O. and H.A. All authors have read and agreed to the published version of the manuscript.

Funding

This research was funded by the Carl Tryggers Foundation (CTS 15:34, CTS 17:32) and EU Interreg NSR SalFar project (J-No: 38-2-16-17).

Institutional Review Board Statement

Not applicable.

Informed Consent Statement

Not applicable.

Data Availability Statement

The data that support the findings of this study are available from the corresponding author upon reasonable request.

Acknowledgments

We thank Göran Aronsson, Lovisa Aronsson, Elliot Aronsson, Elias Aronsson, and Robin Andersen for assistance with sowing, field data collection, and harvesting. Finally, we thank OlsAro Crop Biotech AB for providing mutagenized OA wheat lines.

Conflicts of Interest

The authors declare no conflict of interest. The funders had no role in the design of the study; in the collection, analyses, or interpretation of data; in the writing of the manuscript; or in the decision to publish the results.

References

  1. Tilman, D.; Balzer, C.; Hill, J.; Befort, B.L. Global food demand and the sustainable intensification of agriculture. Proc. Natl. Acad. Sci. USA 2011, 108, 20260–20264. [Google Scholar] [CrossRef] [PubMed] [Green Version]
  2. Shiferaw, B.; Smale, M.; Braun, H.-J.; Duveiller, E.; Reynolds, M.; Muricho, G. Crops that feed the world 10. Past successes and future challenges to the role played by wheat in global food security. Food Secur. 2013, 5, 291–317. [Google Scholar] [CrossRef] [Green Version]
  3. Shewry, P.R.; Hey, S.J. The contribution of wheat to human diet and health. Food Energy Secur. 2015, 4, 178–202. [Google Scholar] [CrossRef] [PubMed]
  4. El-Hendawy, S.E.; Hassan, W.; Al-Suhaibani, N.A.; Refay, Y.; Abdella, K.A. Comparative performance of multivariable agro-physiological parameters for detecting salt tolerance of wheat cultivars under simulated saline field growing conditions. Front. Plant Sci. 2017, 8, 435. [Google Scholar] [CrossRef] [PubMed] [Green Version]
  5. Chabot, P.; Tondel, F. A Regional View of Wheat Markets and Food Security in Central Asia: With a Focus on Afghanistan and Tajikistan; Famine Early Warning Systems Network FEWS NET; United States Agency for International Development: Washington, DC, USA, 2011. Available online: https://documents.wfp.org/stellent/groups/public/documents/ena/wfp238576.pdf (accessed on 15 March 2022).
  6. Corwin, D.L. Climate change impacts on soil salinity in agricultural areas. Eur. J. Soil Sci. 2021, 72, 842–862. [Google Scholar] [CrossRef]
  7. Al-Taey, D.; Al-Naely, I.; Kshash, B. A study on the effects of water quality, cultivars, organic and chemical fertilizers on potato (Solanum tuberosum L.) growth and yield to calculate the economic feasibility. Bulg. J. Agric. Sci. 2019, 25, 1239–1245. [Google Scholar]
  8. Shahid, S.A.; Zaman, M.; Heng, L. Soil Salinity: Historical Perspectives and a World Overview of the Problem. In Guideline for Salinity Assessment, Mitigation and Adaptation Using Nuclear and Related Techniques; Springer: Cham, Switzerland, 2018; pp. 43–53. [Google Scholar]
  9. Thomas, D.S.G.; Middleton, N.J. Salinization: New perspectives on a major desertification issue. J. Arid Environ. 1993, 24, 95–105. [Google Scholar] [CrossRef]
  10. Hasegawa, P.M.; Bressan, R.A.; Zhu, J.-K.; Bohnert, H.J. Plant cellular and molecular responses to high salinity. Annu. Rev. Plant Physiol. Plant Mol. Biol. 2000, 51, 463–499. [Google Scholar] [CrossRef] [Green Version]
  11. Flowers, T.; Yeo, A. Breeding for salinity resistance in crop plants: Where next? Funct. Plant Biol. 1995, 22, 875–884. [Google Scholar] [CrossRef]
  12. Yeo, A. Molecular biology of salt tolerance in the context of whole-plant physiology. J. Exp. Bot. 1998, 49, 915–929. [Google Scholar] [CrossRef]
  13. Munns, R. Comparative physiology of salt and water stress. Plant Cell Environ. 2002, 25, 239–250. [Google Scholar] [CrossRef] [PubMed]
  14. Munns, R.; Tester, M. Mechanisms of salinity tolerance. Annu. Rev. Plant Biol. 2008, 59, 651–681. [Google Scholar] [CrossRef] [PubMed] [Green Version]
  15. Shahzad, H.; Ullah, S.; Iqbal, M.; Bilal, H.M.; Shah, G.M.; Ahmad, S.; Zakir, A.; Ditta, A.; Farooqi, M.A.; Ahmad, I. Salinity types and level-based effects on the growth, physiology and nutrient contents of maize (Zea mays). Ital. J. Agron. 2019, 14, 199–207. [Google Scholar] [CrossRef] [Green Version]
  16. Fortmeier, R.; Schubert, S. Salt tolerance of maize (Zea mays L.): The role of sodium exclusion. Plant Cell Environ. 1995, 18, 1041–1047. [Google Scholar] [CrossRef]
  17. Abbas, G.; Saqib, M.; Rafique, Q.; Rahman, M.; Javaid, A.; Anwar-ul-Haq, M.; Nasim, M. Effect of salinity on grain yield and grain quality of wheat (Triticum aestivum L.). Pak. J. Agric. Res. 2013, 50, 185–189. [Google Scholar]
  18. Kamran, M.; Parveen, A.; Ahmar, S.; Malik, Z.; Hussain, S.; Chattha, M.S.; Saleem, M.H.; Adil, M.; Heidari, P.; Chen, J.-T. An overview of hazardous impacts of soil salinity in crops, tolerance mechanisms, and amelioration through selenium supplementation. Int. J. Mol. Sci. 2019, 21, 148. [Google Scholar] [CrossRef] [Green Version]
  19. Maas, E.V.; Grieve, C.M. Spike and leaf development of salt stressed wheat. Crop Sci. 1990, 30, 1309–1313. [Google Scholar] [CrossRef]
  20. Khatun, S.; Flowers, T.J. Effects of salinity on seed set in rice. Plant Cell Environ. 1995, 18, 61–67. [Google Scholar] [CrossRef]
  21. Maas, E.V.; Grattan, S.R. Crop yields as affected by salinity. In Agricultural Drainage; American Society of Agronomy Inc.: Madison, WI, USA, 1999; Volume 38, pp. 55–108. [Google Scholar] [CrossRef]
  22. FAO. Crop Salt Tolerance Data; FAO: Rome, Italy, 1985; Available online: https://www.fao.org/3/y4263e/y4263e0e.htm (accessed on 15 March 2022).
  23. Shahzad, M.; Saqib, Z.A.; Hafeez, F.; Bilal, M.; Khan, S.A.; Asad, S.A.; Akhtar, J. Growth-related changes in wheat (Triticum aestivum L.) genotypes grown under salinity stress. J. Plant Nutr. 2015, 39, 1257–1265. [Google Scholar] [CrossRef]
  24. Munns, R.; James, R.A.; Läuchli, A. Approaches to increasing the salt tolerance of wheat and other cereals. J. Exp. Bot. 2006, 57, 1025–1043. [Google Scholar] [CrossRef] [Green Version]
  25. Genc, Y.; Mcdonald, G.K.; Tester, M. Reassessment of tissue Na+concentration as a criterion for salinity tolerance in bread wheat. Plant Cell Environ. 2007, 30, 1486–1498. [Google Scholar] [CrossRef] [PubMed]
  26. Colmer, T.D.; Flowers, T.; Munns, R. Use of wild relatives to improve salt tolerance in wheat. J. Exp. Bot. 2006, 57, 1059–1078. [Google Scholar] [CrossRef] [PubMed] [Green Version]
  27. Ashraf, M.; Akram, N.A. Improving salinity tolerance of plants through conventional breeding and genetic engineering: An analytical comparison. Biotechnol. Adv. 2009, 27, 744–752. [Google Scholar] [CrossRef] [PubMed]
  28. Dadshani, S.; Sharma, R.C.; Baum, M.; Ogbonnaya, F.C.; Léon, J.; Ballvora, A. Multi-dimensional evaluation of response to salt stress in wheat. PLoS ONE 2019, 14, e0222659. [Google Scholar] [CrossRef] [PubMed]
  29. Munns, R.; James, R.A.; Xu, B.; Athman, A.; Conn, S.J.; Jordans, C.; Byrt, C.S.; Hare, R.A.; Tyerman, S.D.; Tester, M.; et al. Wheat grain yield on saline soils is improved by an ancestral Na+ transporter gene. Nat. Biotechnol. 2012, 30, 360–364. [Google Scholar] [CrossRef] [PubMed]
  30. Maas, E.V.; Hoffman, G.J. Crop salt tolerance–current assessment. J. Irrig. Drain. Div. 1977, 103, 115–134. [Google Scholar] [CrossRef]
  31. Van Genuchten, M.T.; Hoffman, G. Analysis of crop production. In Soil Salinity Under Irrigation—Process and Management; Shainberg, I., Shalhevet, J., Eds.; Springer: Berlin, Germany, 1984; pp. 258–271. [Google Scholar]
  32. van Straten, G.; de Vos, A.C.; Rozema, J.; Bruning, B.; van Bodegom, P.M. An improved methodology to evaluate crop salt tolerance from field trials. Agric. Water Manag. 2019, 213, 375–387. [Google Scholar] [CrossRef]
  33. Lethin, J.; Shakil, S.S.M.; Hassan, S.; Sirijovski, N.; Töpel, M.; Olsson, O.; Aronsson, H. Development and characterization of an EMS-mutagenized wheat population and identification of salt-tolerant wheat lines. BMC Plant Biol. 2020, 20, 18. [Google Scholar] [CrossRef] [Green Version]
  34. Bruning, B.; van Logtestijn, R.; Broekman, R.; De Vos, A.; González, A.P.; Rozema, J. Growth and nitrogen fixation of legumes at increased salinity under field conditions: Implications for the use of green manures in saline environments. AoB Plants 2015, 7, plv010. [Google Scholar] [CrossRef]
  35. de Vos, A.; Bruning, B.; van Straten, G.; Oosterbaan, R.; Rozema, J.; van Bodegom, P. Crop Salt Tolerance under Controlled Field Conditions in The Netherlands, Based on Trials Conducted at Salt Farm Texel; Salt Farm Texel: Den Burg, The Netherlands, 2016; Available online: https://edepot.wur.nl/409817 (accessed on 15 March 2022).
  36. Zadoks, J.C.; Chang, T.T.; Konzak, C.F. A decimal code for the growth stages of cereals. Weed Res. 1974, 14, 415–421. [Google Scholar] [CrossRef]
  37. Minitab 19 Statistical Software, version 19. Computer Software. Minitab, Inc: State College, PA, USA, 2019.
  38. Muhammad, H.; Shemana, M.; Nihar, S.; Shamsun, B. Evaluation of wheat cultivars for salinity tolerance at seedling stage based on morphological and molecular markers. J. Bangladesh Agric. Univ. 2020, 18, 234–244. [Google Scholar] [CrossRef]
  39. Haque, S.A. Salinity problems and crop production in coastal regions of Bangladesh. Pak. J.Bot. 2006, 38, 1359–1365. [Google Scholar]
  40. Rasel, H.M.; Hasan, M.R.; Ahmed, B.; Miah, M.S.U. Investigation of soil and water salinity, its effect on crop production and adaptation strategy. Int. J. Water Resour. Environ. Eng. 2013, 5, 475–481. [Google Scholar]
  41. Clarke, D.; Williams, S.; Jahiruddin, M.; Parks, K.; Salehin, M. Projections of on-farm salinity in coastal Bangladesh. Environ. Sci. Process. Impacts 2015, 17, 1127–1136. [Google Scholar] [CrossRef] [Green Version]
  42. Janda, T.; Darko, É.; Shehata, S.; Kovács, V.; Pál, M.; Szalai, G. Salt acclimation processes in wheat. Plant Physiol. Biochem. 2016, 101, 68–75. [Google Scholar] [CrossRef] [Green Version]
  43. Liang, W.; Ma, X.; Wan, P.; Liu, L. Plant salt-tolerance mechanism: A review. Biochem. Biophys. Res. Commun. 2018, 495, 286–291. [Google Scholar] [CrossRef]
  44. Geleta, B.; Atak, M.; Baenziger, P.S.; Nelson, L.A.; Baltenesperger, D.D.; Eskridge, K.M.; Shipman, M.J.; Shelton, D.R. Seeding rate and genotype effect on agronomic performance and end-use quality of winter wheat. Crop Sci. 2002, 42, 827–832. [Google Scholar]
  45. Valério, I.P.; de Carvalho, F.I.F.; de Oliveira, A.C.; Benin, G.; de Souza, V.Q.; Machado, A.D.A.; Bertan, I.; Busato, C.C.; da Silveira, G.; Fonseca, D.A.R. Seeding density in wheat genotypes as a function of tillering potential. Sci. Agric. 2009, 66, 28–39. [Google Scholar] [CrossRef] [Green Version]
  46. Bastos, L.M.; Carciochi, W.; Lollato, R.P.; Jaenisch, B.R.; Rezende, C.R.; Schwalbert, R.; Prasad, P.V.; Zhang, G.; Fritz, A.K.; Foster, C.; et al. Winter wheat yield response to plant density as a function of yield environment and tillering potential: A review and field studies. Front. Plant Sci. 2020, 11, 54. [Google Scholar] [CrossRef] [Green Version]
  47. Lloveras, J.; Manent, J.; Viudas, J.; López, A.; Santiveri, P. Seeding rate influence on yield and yield components of irrigated winter wheat in a mediterranean climate. Agron. J. 2004, 96, 1258–1265. [Google Scholar] [CrossRef]
  48. Whaley, J.M.; Sparkes, D.L.; Foulkes, M.J.; Spink, J.H.; Semere, T.; Scott, R.K. The physiological response of winter wheat to reductions in plant density. Ann. Appl. Biol. 2000, 137, 165–177. [Google Scholar] [CrossRef]
  49. Dahlke, B.J.; Oplinger, E.S.; Gaska, J.M.; Martinka, M.J. Influence of planting date and seeding rate on winter wheat grain yield and yield components. J. Prod. Agric. 1993, 6, 408–414. [Google Scholar] [CrossRef]
  50. Rengasamy, P. World salinization with emphasis on Australia. J. Exp. Bot. 2006, 57, 1017–1023. [Google Scholar] [CrossRef] [PubMed] [Green Version]
  51. Rengasamy, P. Salt-Affected Soils in Australia; Grains Research and Development Corporation: Canberra, Australia, 2016; pp. 1–64. [Google Scholar]
  52. Hoffmann, G.R. Genetic effects of dimethyl sulfate, diethyl sulfate, and related compounds. Mutat. Res. Genet. Toxicol. 1980, 75, 63–129. [Google Scholar] [CrossRef]
  53. Walker, G.R. Effectiveness of Current Farming Systems in the Control of Dryland Salinity; Walker, G.R., Gilfedder, M., Williams, J., Eds.; CSIRO Land and Water CSIRO Land and Water: Canberra, Australia, 1999. [Google Scholar]
  54. COAG Standing Council on Environment and Water. In Australia’s Native Vegetation Framework; Australian Government, Department of Sustainability, Environment, Water, Population and Communities: Canberra, Australia, 2012; ISBN 978-1-921733-57-4.
  55. Naveed, M.; Ditta, A.; Ahmad, M.; Mustafa, A.; Ahmad, Z.; Conde-Cid, M.; Tahir, S.; Shah, S.A.A.; Abrar, M.M.; Fahad, S. Processed animal manure improves morpho-physiological and biochemical characteristics of Brassica napus L. under nickel and salinity stress. Environ. Sci. Pollut. Res. 2021, 28, 45629–45645. [Google Scholar] [CrossRef]
  56. Niamat, B.; Naveed, M.; Ahmad, Z.; Yaseen, M.; Ditta, A.; Mustafa, A.; Rafique, M.; Bibi, R.; Sun, N.; Xu, M. Calcium-enriched animal manure alleviates the adverse effects of salt stress on growth, physiology and nutrients homeostasis of Zea mays L. Plants 2019, 8, 480. [Google Scholar] [CrossRef] [Green Version]
Figure 1. Comparison of means of indicated agronomic and phenotypic traits of the plants cultivated at indicated irrigation salinity levels.
Sustainability 14 05061 g001
Figure 2. The difference in grams between each mutagenized line (101–123) and the BARI Gom−25 control in TGW summed for all plots subjected to 1–16 dS m−1 salinity treatments. The control mean was set to 0, as shown by the vertical line.
Sustainability 14 05061 g002
Figure 3. The difference in gram between each mutagenized line (101−123) and the BARI Gom−25 control in TGW under the 1 dS m−1 (A), 4 dS m−1 (B), 8 dS m−1 (C), 12 dS m−1 (D), and 16 dS m−1 (E) salinity treatments. The control mean is set to 0, as shown by the vertical lines in the graphs.
Sustainability 14 05061 g003
Figure 4. Numbers of live plants of each mutagenized line (101–123) and the BARI Gom−25 control (line 124). Percentages shown for each line and control are averages based on observations of plants in all plots subjected to 1–16 dS m−1 salinity treatments.
Sustainability 14 05061 g004
Figure 5. Total grain weight (TGW) of the mutagenized line 101 as a function of salinity obtained using the van Genuchten–Hoffman (A) and Maas–Hoffman (B) models. Dots represent measurement points and the orange lines show the least square best fits. The dotted green lines represent upper and lower simultaneous prediction error bounds, i.e., the (approximately 95% CI) uncertainty bounds for a new experiment with the same number of data points. The magenta dash-dot lines represent upper and lower non-simultaneous prediction error bounds, i.e., the approximately 95% CI range when a single measurement is done.
Sustainability 14 05061 g005
Figure 6. Zero-observed-effect yield (Y0) estimates obtained from the Maas–Hoffman model for the mutagenized wheat lines (101–123) and BARI Gom−25 control (line 124). Total grain weight (TGW) per plot at estimated Y0 is shown for all mutagenized lines and the control. The blue and red dotted lines, respectively, indicate the upper limit for the BARI Gom-25 control (line 124) and double this TGW.
Sustainability 14 05061 g006
Table 1. The chemical composition and the available fraction of the added nutrients (kg ha−1) through compost, manure, and organic fertilizers. The fertilizer amounts are in tons ha−1. The values presented for compost refer to 10–15% available N for plant uptake in year 1, 50–60% of P2O5, and 75–100% of K2O.
SourceAmountNP2O5K2OCaOSMgOOrganic Matter
Compost20142148 163840
Manure12441772 2261824
Monterra190104020303750
Orgevit1403225901010650
Total 1888018511042557064
Table 2. Pearson correlation coefficients: positive and negative values, respectively, indicating positive and negative correlations between the indicated variables assessed in the field trial.
VariablesSalt ConcSpike LengthTGWEight-Spike Grain WeightLive NumberPlant Height
Spike length−0.392 **
TGW−0.662 **0.360 **
Eight-spike grain weight−0.786 **0.522 **0.716 **
Live number−0.220 **0.0740.327 **0.209 **
Plant height−0.727 **0.476 **0.644 **0.692 **0.256 **
Tiller number−0.457 **0.200 **0.519 **0.392 **0.0850.468 **
** highly significant, p-value < 0.001.
Table 3. Estimated parameters for Maas–Hoffman and van Genuchten–Hoffman models for all tested mutagenized lines and the BARI Gom-25 control. EC, electrical conductivity; ECpthr, EC pore water threshold; ECp50, 50% of Y0; ECp90, 90% of Y0; p, slope parameter describing curvature; S, absolute slope, S%, (percentage decline relative to Y0 per unit EC); Y0, zero-observed-effect yield.
Maas–Hoffman ModelVan Genuchten–Hoffman Model
Line No.ECpthr (dS m−1)S (g/plot)/(dS m−1)Y0 (g/plot)S% (dS m−1)ECp50 (dS m−1)ECp90 (dS m−1)ECp50 (dS m−1)p (−)Y0 (g/plot)ECp90 (dS m−1)
1011.3−8.5107.87.97.62.56.02.1115.62.1
1020.8−9.2114.08.17.02.04.71.7127.91.3
1031.3−3.449.16.98.62.76.21.754.91.7
1040.8−15.6125.212.44.81.61.81.3182.40.3
1051.3−6.973.09.46.62.36.13.675.03.3
1060.7−10.9126.48.66.51.95.22.2133.22.0
1071.3−6.681.38.17.42.55.92.387.72.2
1081.3−3.642.18.47.22.55.92.344.82.3
1090.7−3.869.75.59.82.54.41.592.41.0
1100.8−11.1128.18.76.61.94.41.9144.31.4
1111.3−5.179.66.49.12.87.52.383.22.9
1120.8−10.995.311.45.21.73.41.6111.90.9
1137.6−16.862.626.89.48.09.36.665.16.7
1145.5−5.134.514.78.96.29.06.834.56.5
1155.0−12.270.717.37.95.67.46.573.15.2
1164.0−5.756.710.19.05.08.74.156.75.1
1175.5−9.363.514.78.96.28.85.366.15.8
1182.6−8.289.19.28.03.77.73.988.54.4
1195.6−5.747.012.19.76.49.86.346.66.9
1203.5−8.887.410.18.54.57.94.088.34.6
1210.6−4.660.17.67.22.02.81.286.20.4
1220.4−5.764.18.86.11.62.01.296.50.3
1235.5−2.422.011.010.06.49.55.622.76.4
Control5.5−2.730.48.811.26.611.04.830.76.9
Publisher’s Note: MDPI stays neutral with regard to jurisdictional claims in published maps and institutional affiliations.

