Article

Barriers and Driving Factors for Sustainable Development of CO2 Valorisation

Institute of Energy Systems and Environment, Riga Technical University, Azenes Street 12/1, 1048 Riga, Latvia
*
Author to whom correspondence should be addressed.
Sustainability 2022, 14(9), 5054; https://doi.org/10.3390/su14095054
Submission received: 25 March 2022 / Revised: 19 April 2022 / Accepted: 21 April 2022 / Published: 22 April 2022

Abstract

:
Mitigating CO2 emissions has become a top question in international and national arenas, likewise on the city level. To initiate and maintain transformative policies related to climate neutrality, an evident-based multi-sectoral forecasting model needs to be timely and effectively deployed. Decarbonisation solutions should be considered from the economic, environmental, and social perspectives. The resulting complexity constitutes an essential barrier to implementing CO2 valorisation projects. This study aims to analyse barriers and driving factors for the sustainable development of CO2 valorisation options. In order to reach the research goal, a methodological approach based on the combination of strengths, weaknesses, opportunities, and threats analysis, Geographical Information System and Fuzzy Logic Cognitive Analysis method was used. The method has been applied to a case study in Latvia

1. Introduction

Mitigating CO2 emissions have become a top question in international and national arenas, likewise on the city level. Existing CO2 mitigation measures are primarily oriented towards wider deployment of low-carbon technologies of renewable energy sources and energy efficiency measures, focusing on energy production, distribution and energy use sectors, and transport. In 2019, the manufacturing sector emitted more than a fifth of all global emissions in terms of CO2 and occupied a solid third place after the transport (29%) and energy (25%) sectors [1]. For 2019, the global annual amount of created carbon dioxide emissions exceeded 35 billion tons, pervasive 36% more than in 1990 (22.70 billion tons) and 5.5% more than in 2010 (33.13 billion tons). Such negative dynamics raise concerns for a stable future of the climate. Carbon dioxide is one of the main factors in changing climatic conditions—and an increase in its concentration causes an increase in the harmful temperature on the planet and, as a result, unstable weather and natural disasters [2].
Seeing the potential threats of such development of events and what they may lead to in the future, it was decided to act, and so the Green Deal strategy is being actively developed and applied. The main goal of this initiative is to reduce carbon dioxide emissions and become carbon neutral by 2050. One of the stages towards achieving this goal is an intermediate point—the year 2030, by which each country needs to achieve a reduction of CO2 emissions by at least 55% in comparison with 1990. It is difficult to say whether the goals will be achieved on time. Thus, the 20-20-20 package created in 2008 set the goal of achieving a 20% reduction in CO2 emissions compared to 1990 by 2020, increasing the use of renewable energy sources (abandoning non-renewable ones), and increasing the amount of generated energy and its efficiency by 20%. These goals were not achieved, and it is likely that if it were not for the economic crisis of 2009, it is quite possible that the target for the amount of carbon dioxide emissions could not have been achieved either [3,4].
The year 2020 has also proved to be a challenge for many entrepreneurs. The fall in economic activity affected the amount of carbon dioxide emissions in the atmosphere—its concentration decreased by 10% compared to a year earlier [5]. However, as the economy recovers, CO2 will start to rise again.
Carbon dioxide is generated in many sectors. The switch to renewable energy sources is helping to reduce the amount of this greenhouse gas in the atmosphere, but it is not enough to change the energy sector alone. The manufacturing sector also needs to be modernised and become more environmentally friendly.
Over the past ten years, Latvia’s carbon dioxide emissions have remained at the same level. The only sector showing negative dynamics is the power generation sector (Figure 1). Compared to 2018, this sector produced 8% less carbon dioxide in 2019, but this is too little to fulfil the plans set by the Green Deal initiative [6].
According to [7], the country continues to use coal and oil as fuel, but the number of renewable energy sources in the sector is increasing every year. According to the Investment and Development Agency of Latvia, the share of renewables energy generation is more than 40%, which gives hope for a decrease in the amount of carbon dioxide in the electricity generation sector [8] (Figure 2).
Unfortunately, it is not enough to improve just the energy sector—changes are needed everywhere. There are many reasons why manufacturers are reluctant to install new technologies that reduce the amount of carbon dioxide they produce or capture and/or use carbon dioxide.
The main reasons for the slow transition to renewable energy sources and the replacement of outdated technologies with new ones could be:
  • The cost of technology and the payback period [9];
  • Complexity of technology and/or difficulty in maintenance [9];
  • Stubbornness and resistance of people—the human factor: people are afraid of losing their jobs. If new technologies are introduced into their lives too quickly, sooner or later, people might begin to grumble and then sabotage the work [10,11];
  • Bureaucracy [10];
  • Competition with existing technologies—due to conservatism, the transition to new technologies is slow. Old technologies have already shown and proven themselves, and the transition to new ones is often associated with the need for additional resources (personnel training, financial investments) [10,11];
  • Competence of decision-makers (lack of information about new technologies, which interferes with making objective decisions) [10,11].
The location of the enterprise could also be mentioned as a factor if the enterprise is aimed at capturing and selling CO2 too far from a potential buyer. A logical question arises about the practicality of such a decision. Gas capturing and transfer technologies can be too expensive for an acceptable payback period [9,10].
Another reason change is happening so slowly may be the human factor—people are accustomed to a particular lifestyle and habits and therefore do not want to change. In the case of production, there may be two options—either the production itself offers an opportunity that pre-empts its time, or the market is not flexible enough for changes. Even if the manufacturer proposes a new product, the market will not accept it, and the enterprise will suffer significant losses. Technological innovation may be too large-scale (severe or sudden) for the local community. The risks may be so great that society is initially too sceptical about paying attention and/or investing in this technology or development. The third problem in the group of human factors may be the fear caused by little knowledge regarding the technology. Fears that new technologies, built on the basis of old ones, can take away a person’s job are often crucial when it comes to adoption and acceptance [10,11].
When deciding whether or not to implement a technology, it is essential to analyse the barriers and driving factors carefully. One of the simplest methods is performing the SWOT analysis (strengths, weaknesses, opportunities, and threats). SWOT analysis allows assessing all the risks and possibilities of using a particular technology or methodology at different levels—starting with the impact of the innovation on the national level and a more local one (for example, the enterprise level). Evaluation provides an opportunity to assess the feasibility of innovation, take corrective actions to minimise potential risks and create a chain of stakeholders in the project [12]. The comprehensive analysis allows for identifying and providing information about external and internal factors that affect the project (or decision) both positively and negatively. With these data, the entrepreneur can determine the best scenario for performing [13].
In order to conduct a SWOT analysis, it is necessary to know what carbon capture technologies exist. These technologies can be divided into two large groups:
  • Capturing CO2 and transporting it to places of further disposal (storage sites) or use for the production of new products.
  • The capture of CO2 and its use in production right away
Carbon dioxide capture technologies are pervasive in the manufacturing and energy sectors. Technologies that have already proven themselves are, for instance, adsorption and membrane systems [14]. For example, the efficiency of pilot membrane plants can reach 80% CO2 [14,15], and installations using adsorption allow achieving purity of the main CO2 stream up to 95% and recovery of the flow up to 80% [14,16]. Carbon dioxide capture plants separate CO2 from the overall production gas stream. Such technologies are usually installed in industries with a high content of carbon dioxide in the exhaust, for example, at heating stations and large industries [2].
As carbon dioxide is captured and removed, it must be transported (if it is impossible to use it in the same production). For long distances, it is preferable to use a pipeline, but it is possible to transport CO2 by transport. In this case, it is necessary to ensure specific conditions (temperature −20–30 °C, pressure 1.5–2.5 MPa), which, due to their technical complexity, are not suitable for sizeable CO2 storage sites [2].
For the analysis of CO2 emissions, geographic modelling programs are actively used—the so-called Geographic Information System programs (GIS). The Group of GIS programs appeared relatively recently but has already established itself as a helpful program package in planning and resource management. It is possible to store, analyse, and process large data packages even from different and unrelated sources with such a program. The ability to plan problem-solving processes and make predictions in this program makes it possible to put forward quality solutions to problems [17]. Due to the program’s versatility, analyses can be combined with analyses made using other methods, such as Multi-Criteria Analysis, AHP (Analytic Hierarchy Process) or SWOT [18]. Such a combination has the best effect on the quality of the analysis performed and justifies the results obtained. There are many disciplines in which a combination of GIS and an analytical program (Multiple-Criteria Decision Analysis (MCDA), AHP, etc.) could be productively used, such as development planning and modelling of urban and natural systems, the organisation of traffic flow, etc. [18]. For example, a combination of GIS and MCE (Multi-Criteria Evaluation) was used by Elmadi and Kheireldin [19]. This combination made it possible to determine the best scenario for the use of water resources at three levels—the level of direct use of the water resource, the water channel—the level of resource accumulation (and its subsequent withdrawal) and the mixed level. In his work, the author claims that the combined use of both analysis methods (GIS and MCE) is a serious, high-quality and reliable way to assess various scenarios for solving complex problems. Using both techniques simplifies the process of considering multiple options and, as a result, makes decision-making easier [19]. Boroushaki also used the possibility of parallel use of various analysis methods to obtain more accurate results [20]. The author of this study shared a method for integrating MCDA analysis into the ArcGis environment. Nasehi et al. used a combination of SWOT analysis and GIS software in their work to determine the optimal scenario for the development of urbanisation (industrial zones) with the minimum possible impact on the environment [21]. The use of SWOT analysis and cartographic programs allows decision-makers to evaluate the proposed solutions to the problem and prioritise them. When the choice is made at high levels, this combination will help to ensure the transparency of the solution and its comprehensiveness [22].
The combination of various analysis methods makes it possible to neutralise the disadvantages of each method separately. For example, SWOT analysis alone helps in identifying the main influencing factors. By combining SWOT with GIS, these factors already acquire the basis and validity.

2. Methodology

Within the framework of this work, a SWOT analysis was carried out to conduct a comprehensive analysis of the possibility of capturing and/or using carbon dioxide in the territory of Latvia. In parallel, using the data from [23], all places of CO2 production and potential use places were marked on Latvia’s map using the Geographical Information System program via ArcGis software. The use of SWOT analysis, together with cartographic programs, allows decision-makers to evaluate the proposed solutions to the problem to prioritise them correctly. When the choice is made at high levels, this combination will help to ensure the transparency of the solution and its comprehensiveness [22].
For a more comprehensive analysis of the problem of technology implementation, an additional analysis was chosen—Fuzzy Logic Cognitive Analysis (FLCA). This analysis can be characterised as a way that displays fuzzy logical connections between various factors. FLCA models are beneficial when modelling complex systems and systems with a large number of factors influencing decision making [24]. The algorithm of the performed work can be seen on Figure 3.

2.1. SWOT Analysis

The purpose of a SWOT (strengths, weaknesses, opportunities, and threats) analysis is to identify key factors, both external and internal, that may influence the process or task under consideration. The analysis groups these factors into four groups and two categories [25,26,27]:
  • Internal factors—strengths and weaknesses of the problem under consideration
  • External factors—opportunities and threats that can be caused from outside
In this paper, SWOT analysis is used to identify opportunities and threats nationwide and strengths and weaknesses within the enterprise. In order to ensure a qualitative analysis, this study used the opinion of all stakeholders who received a permit for polluting activities of category A (48 enterprises) and B (610 enterprises). Subsequently, all these enterprises were marked on ArcGis maps. Additionally, those enterprises that could potentially use CO2 were marked on the map(Figure 4).
Considering the use of CO2 following options have been observed: (a) CO2 capture and utilisation in Europe; (b) CO2 capture and utilisation in the case of Latvia; (c) CO2 capture directly at the place of production, processing and transportation/reusing.

2.1.1. CO2 Capture and Utilisation in Europe

Technologies for carbon capture and storage are called CCS and for storage and/or utilisation—CCSU, respectively. The so-called “major” factors affecting CO2 capture and utilisation/storage are factors within the European Union—political divisions, bureaucracy, etc. However, at the same time, at this level, a vital factor can be called the influence of other countries on each other and the opportunity to exchange experience and knowledge (Table 1).

2.1.2. CO2 Capture and Utilisation in Latvia

The next level of carbon dioxide utilisation/storage is the national level. At this level, the main factors are bureaucracy, low awareness and/or inertia of people responsible for innovations, financial problems (for example, high cost of technology) and lack of technology representatives in the country. The problem is also a lack of practical experience in using this type of technology. However, the introduction of new technologies may provide new jobs, contribute to the development of the production sector in Latvia, and attract additional investments in production (Table 2).

2.1.3. CO2 Capture and Utilisation in Companies

This group considers all aspects of CO2 capture at the place of its direct production, processing (purification and compression) and transportation to places of further use or resale, and the scenario of its use immediately at the same company (Table 3).
At this level, the main positive factors can be called the development of the sector the chance to attract funds for the company’s development. By installing CO2 capture units, it is possible to sell the dioxide, thus obtaining additional financial benefits. If CO2 is used at the company, the captured dioxide can be returned to production (if the quality of CO2 meets production requirements). However, financial problems are serious obstacles—high prices for the acquisition, installation and maintenance of technology can jeopardise the entire production as such, and the payback time of the purchase can be too long. If the company itself does not use CO2 and there is no one nearby who could buy it, then the purchase of the unit also does not seem to be a profitable solution.
According to Table 3, it becomes evident that in both cases—both for the producer-supplier of CO2 (produced and sold) and for the producer-consumer (at the same company), the main problems are financial difficulties—new equipment requires significant financial investments and the company is not always ready to take risks for the sake of possible profit. Another problem, which is unlikely to be solved shortly, is the technological issue. There are no representatives of enterprises producing such complex equipment in Latvia, and if this equipment fails, the company risks downtime and financial costs. Fears of this particular plan, the lack of confidence that they will be supported at the state level (funds and subsidies)—this is what do not allow modernising the often-outdated production sector at a sufficiently fast pace.
However, despite such serious barriers, for both parties, there are also excellent reasons for taking risks and acquiring new technologies for using CO2 in production—confidence in the quality of the supplied resource (carbon dioxide) and that these supplies will be continuous, the ability to save on resource (which, most likely, will only become more expensive every year). In order to modernise an existing production, it is possible to attract funds and/or participate in international projects, such as H2020 [38].

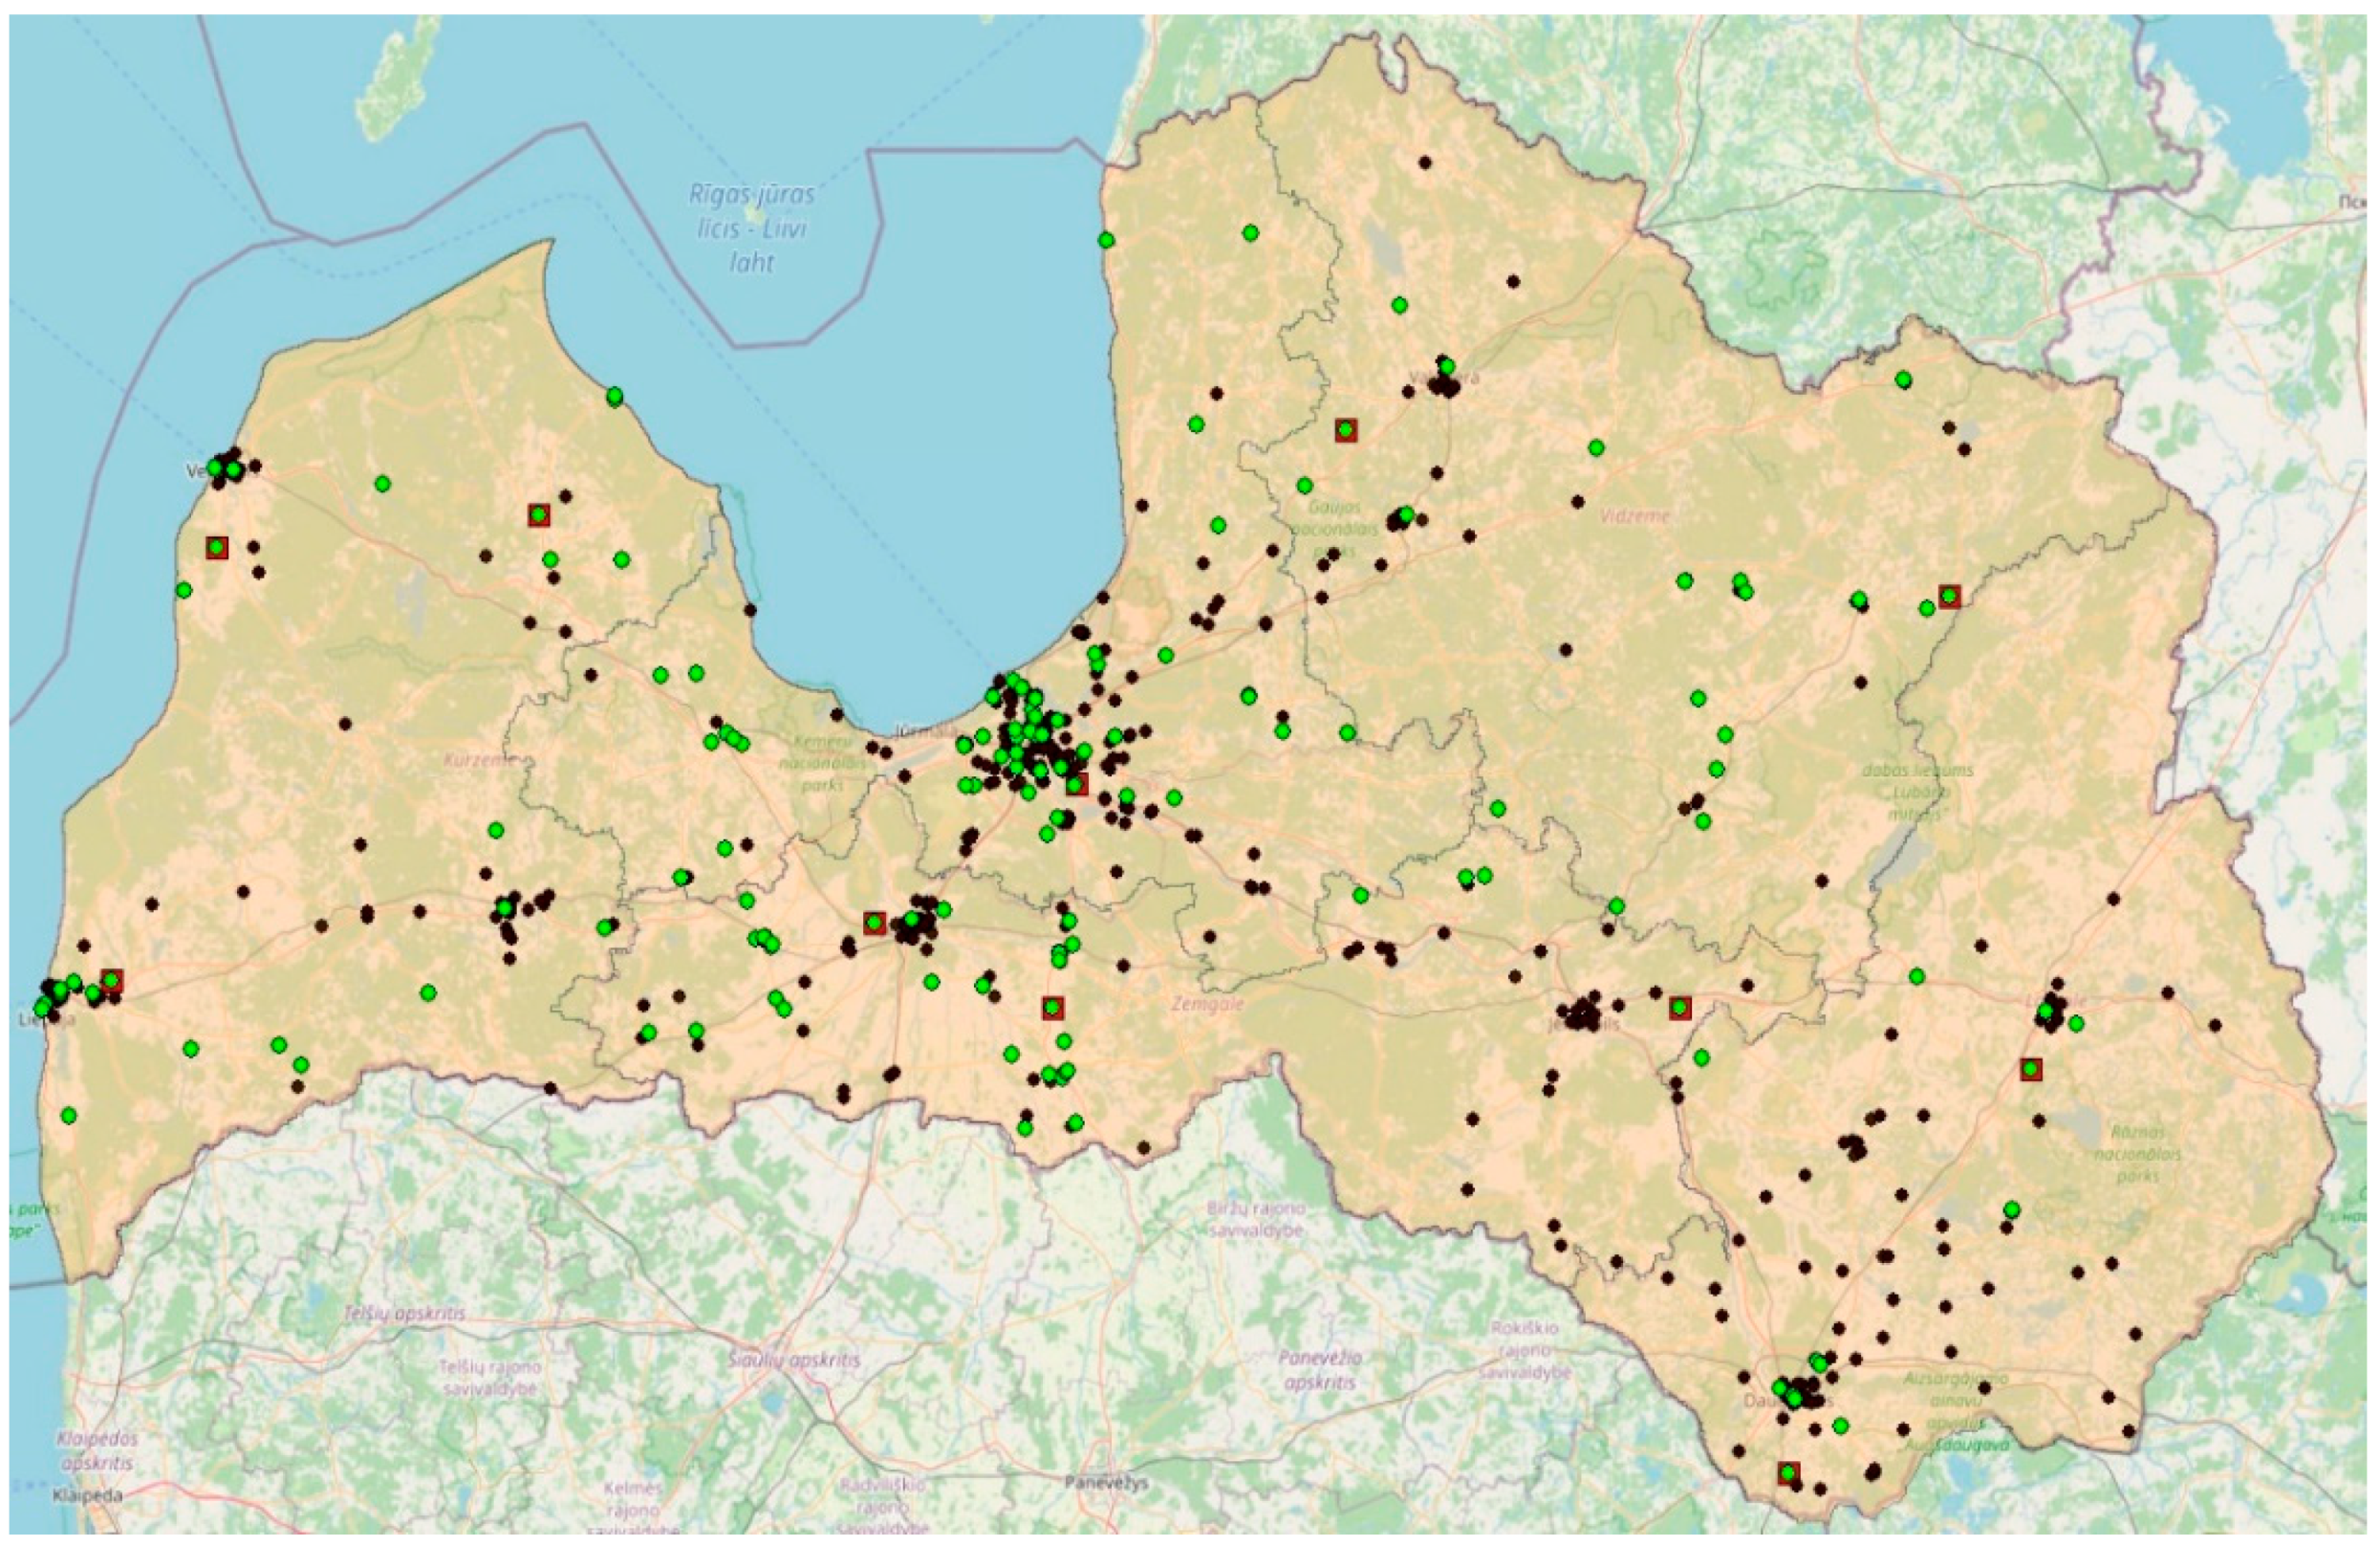
2.2. ArcGis Analysis

In order to mark all points of carbon dioxide production and places of its potential use on the map of Latvia, it is necessary to collect relevant information. Production data were collected from government databases such as State Environmental Service, Latvian Center for Environment, Geology and Meteorology [39,40]. The results of such mapping have already been thoroughly discussed and analysed in [23]. The places of carbon dioxide production in 2019 were marked on the map of Latvia, indicating both the category of the enterprise (A or B permit) and the type of activity itself. Enterprises with the C-type permission were not included in this work. Companies with the A-type permission are landfills, energy sector, and the industrial sector’s largest producers. The B-type group consists of companies in different working areas—food production, energy, chemical, industrial, refining, etc. The energy sector was not divided into central and autonomous heating systems. To analyse the producer-consumer relationship on the map, we marked the places of carbon dioxide production and its potential use (Figure 3). All CO2 production and potential utilisation point coordinates were taken from the Latvian Center for Environment, Geology and Meteorology database [40].
According to Figure 4. it becomes apparent that the production locations and potential use of carbon dioxide very often coincide. The main clusters of points can be observed in large cities of the country—Riga, Daugavpils, Liepaja, Jelgava and Ventspils, as well as Rezekne and Valmiera. More and more industries will appear closer to cities—places of potential sales of manufactured products. However, even outside the city—in the countryside, there is a possibility of using the created carbon dioxide and converting it into products with high added value.

2.3. Combination of ArcGis and SWOT

One of the factors influencing the decision to implement the use/transportation of carbon dioxide is the distance from the manufacturer to the buyer (the results of the SWOT analysis). Maps created in ArcGis indicate that the distance within one country is not an obstacle to using technologies of this type. Another factor was the quality (in other words, purity) of carbon dioxide. This criterion is decisive in using CO2 in production since, often, the permissible amount of impurities should not exceed 0.5–5%. If carbon dioxide is used in greenhouses or algal ponds as a catalyst for plant metabolism, the number of impurities can be up to 30% [41,42]. Unfortunately, in Latvia, large enough greenhouses are not widespread, and there are no industrial-scale algal ponds. This means that all carbon dioxide produced and liquefied (in the case of transportation) for further utilisation must be processed with a high degree of purification, which undoubtedly entails additional costs.

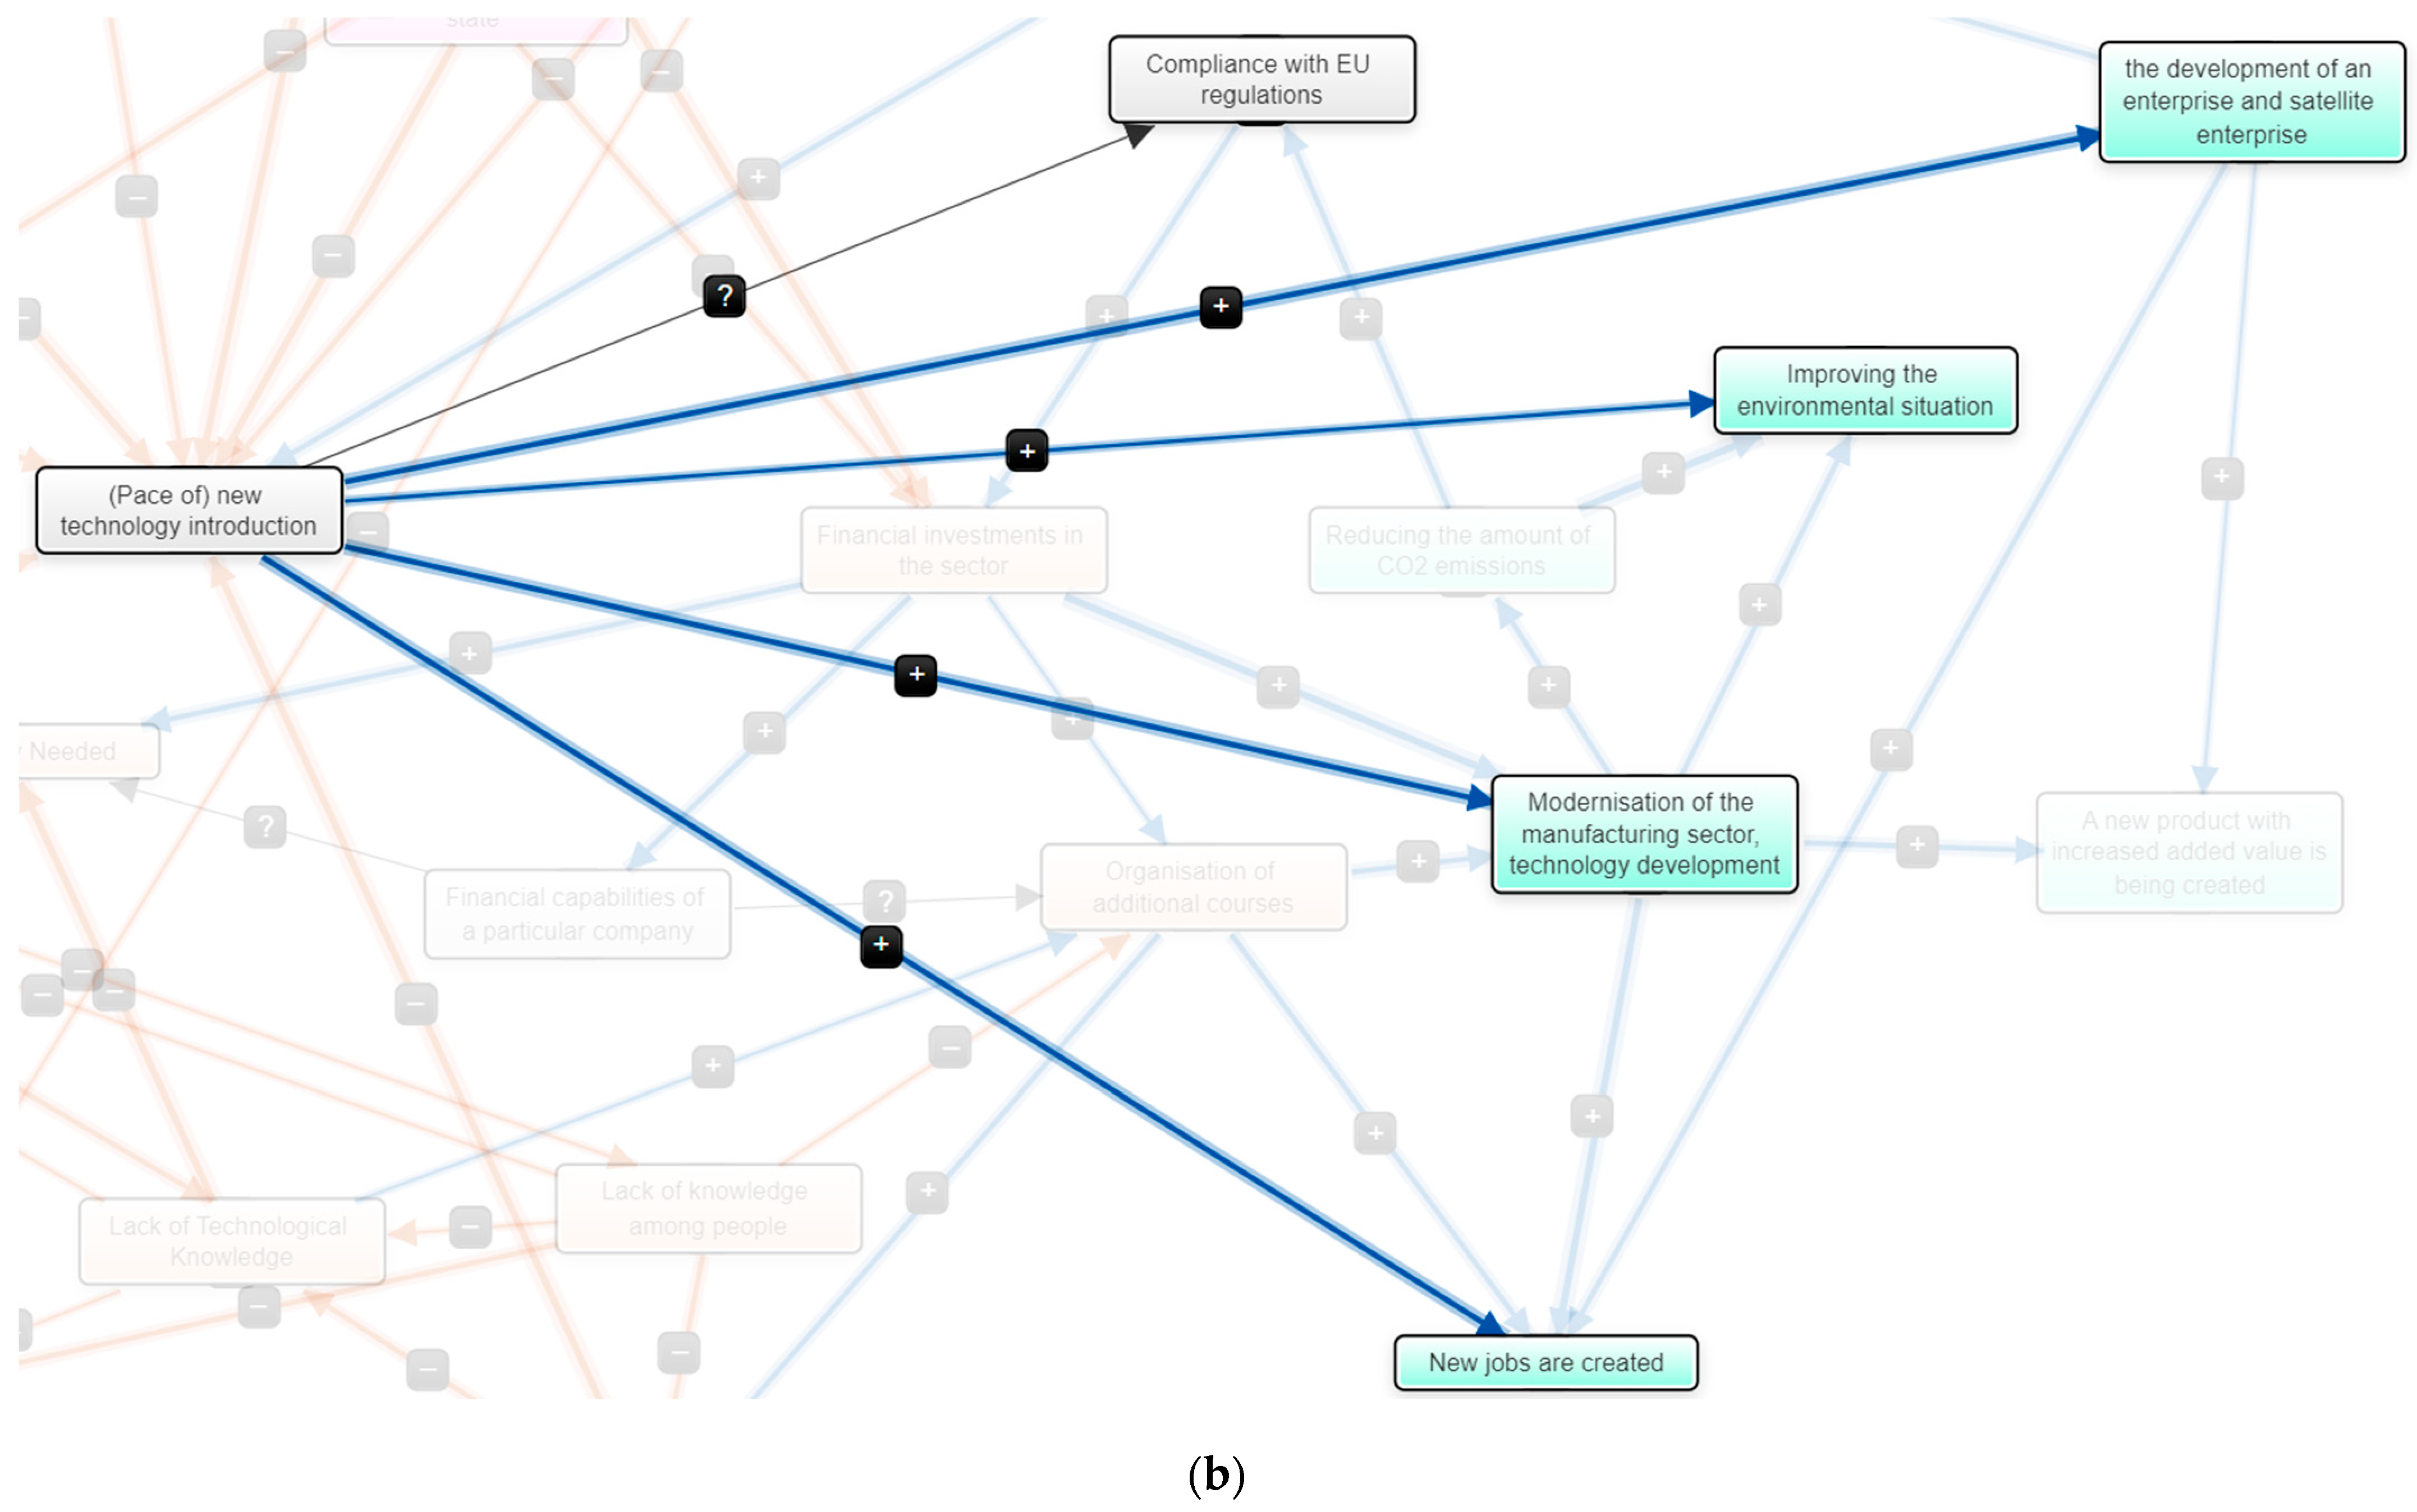
2.4. Fuzzy Logic Cognitive Analysis

Fuzzy Logic Cognitive Analysis can be used as an effective decision-making tool in a complex risk assessment analysis and management. Tools such as the FLCA can save much time, especially when analysing complex systems of interdependent factors is needed. FLCA tools make it possible to analyse and simulate the possible scenarios of the proposed decision and its development and visualise it [43]. By identifying key factors or analysing the likely future of scenarios, it is possible to see its weak points at the beginning of project development and make the necessary decisions and corrections in advance. Identifying key factors and their relationships is the main aspect of this analysis. This allows to explore possible scenarios and helps collect the necessary information already at the decision-making stage [43,44].
The FLCA has proven to be an excellent tool for analysis. Many factors do not have formulated quantitative and/or qualitative data, as well as for discussions, negotiations and finding consensus among many parties [44].
Based on the results of the SWOT analysis and using ArcGis maps, an FLCA analysis was carried out using a free-access program called Mental Modeler. This paper investigated the connections and factors affecting the rate of introduction of new technologies at the entrepreneurial level within the country. Factors of a political nature and public were considered. Using the factors specified in the SWOT analysis, the ArcGis results, and personal opinion of the authors, flows affecting the new technology introduction have been depicted.

3. Results and Discussion

3.1. SWOT Analysis

The results of the SWOT analysis show that at the level of entrepreneurs, fears for financial stability in the case of using technologies for capturing and using/transporting carbon dioxide are a severe factor. Since every year, the requirements for “cleanliness” of the production process will only grow, sooner or later. Still, entrepreneurs will face the need to either completely redesign the production line to reduce the amount of CO2 already at this stage or modify the existing lines so that the produced gas would be used further—either in the same production or in some other. At the moment, if an entrepreneur decides to improve production, he can apply for financial assistance from European projects and funds [36,37]; however, to receive more severe support, it is necessary to provide a truly innovative project [37,45]. If no measures by the state are taken (both at the national level and the level of the European Union), producers are unlikely to seek to invest in the modernisation of enterprises to reduce the amount of carbon dioxide generated. If the government introduces new taxes (or increases existing ones) and increases the cost of CO2, entrepreneurs, sooner or later, will have no choice but to improve production lines [46]. However, in parallel with the introduction of new taxes, the government should subsidise measures aimed at decarbonisation of the industrial and energy sectors, compensate electricity costs and/or give financial help in the acquisition of the necessary installations to reduce the amount of CO2 produced, capture, transport and/or reuse [47].
Facilitate financial aid for demonstration projects of varying readiness levels. However, most of the funds work either with projects already in the final stage of development and at the stage of popularisation, or with an enterprise of a certain size, with a certain annual turnover, or work in a particular sector [47,48]. Even if it is possible to attract sufficient funding already at the stage of project development, in the future, only demonstration projects will not be able to interest potential investors. Another possibility to make CCS and CCS technologies more attractive is to change the taxation system as it was made in the United States. Every company can attain a tax credit for every captured metric ton of CO2 [49,50]. To really contribute to the introduction and active use of CCS and CCSU installations, it is necessary to pay great attention to the research and development of appropriate technologies; the enterprise must be able to invest in projects that are still based mainly on the research of various institutes and organisations, as well as large companies [2].

3.2. ArcGis and SWOT Analysis

Thanks to mapping—the creation of maps with marked points of carbon dioxide production and its potential use, it became possible to analyse the feasibility of using CO2 on a national scale. Since most enterprises are in the area of large cities, the cost of transporting carbon dioxide will not be high. In each „cluster” of production points, there are several potential consumers—if the purity of carbon dioxide meets the necessary requirements. In the presence of demand from the potential consumer, the produced CO2 will not be emitted into the atmosphere but will be used to create new products with a high added value. According to literature sources [51,52], carbon dioxide can have many applications that relatively little financial investment can be realised. This is, for example, the food industry—in large cities, there is a production or processing of various food products, as well as cleaning safe cleaning agents. The food industry, in the course of its activity, produces carbon dioxide of a high degree of purity (especially the alcohol industry—yeast emits almost pure CO2)—it can be used in the chemical industry [51,52].
Large amounts of carbon dioxide are generated in boiler houses located throughout the country. This gas contains many impurities, making it unsuitable for chemical or food industry use. However, if there are greenhouses nearby, this gas, albeit in small quantities, can be used as a catalyst for plant growth [53]. Large greenhouses, for example, are located at SIA Getlini and SIA Ziedi landfills. The heat generated during the decomposition of garbage is sent to greenhouses, allowing the harvesting of vegetables and flowers even at an atypical time for this. If carbon dioxide was supplied to these greenhouses along with heat energy, the yield could be increased [41].
As mentioned above, one of the factors affecting the speed of introduction of new technology also depends on the human factor. ArcGis maps showed that the “producers” and “consumers” enterprises are located near (or in) large cities. This fact can be attributed to the positive, since in urban conditions—a place where due to the dense population, changes occur more often. People react more quickly to what is happening in the neighbouring production and also modernise theirs [54,55,56]. In turn, regional enterprises can supply the produced carbon dioxide to biofuel production plants, which would also positively affect the level of regional development.
Due to the fact that the factories are located within the city area, the people working in these factories are less sensitive to a possible reduction in the workforce. However, new technologies require an increased level of knowledge and, possibly, additional training. In an urban environment, such skills are also easier to acquire than if production is located in rural areas [55,57]. Competition with existing classical technologies plays a vital role in developing innovative technologies. The urban environment is also a more conducive environment for introducing new technologies since people are less conservative than residents of rural areas [54,55,56].

3.3. FLCA and SWOT Analysis

Having received the results of the previous two analyses—SWOT and ArcGis, the FLCA analysis was performed. When considering all the data obtained, a picture of the influence of various factors on each other and the relationship between them was obtained. In this case, the picture of the relationship at the national level was taken observed—the influence of politics and entrepreneurs within the country (Figure 5).
Blue lines show a positive impact on the factor, and orange lines—are a negative one. Grey lines represent neutral or potential impact. Pink blocks are political factors; grey is external; green is positive for both the enterprise and society; and orange is negative.
The main factor most influenced by others is the speed of implementing new technologies (Figure 6).
The speed of technology implementation is influenced by political factors (inertia of political forces, lack of unity in the adoption of critical CO2 requirements, extremely negative attitude of politicians and influential entrepreneurs to the implementation of mandatory requirements for CO2 emissions, etc.), and the so-called—public, such as prejudice about the dangers of CO2 and the need for change. An important role is also played by the lack of educational events where people would receive information about the seriousness of the problem and the need for modernisation. Since the introduction of technologies and the organisation of additional training and educational courses for citizens and workers require financial investments, this factor may be key in fulfilling the obligations undertaken to reduce the amount of carbon dioxide produced in the production sector.
All the threats and weaknesses, advantages and opportunities listed in the SWOT analysis appear in the FLCA analysis. However, the FLCA analysis allows seeing the entire chain visually and assessing what the primary factor (political factor and funding) is and what is secondary (lack of awareness of the population and lack of skill in working with new technologies).

4. Conclusions

In this paper, using the SWOT, ArcGis and FLCA analysis methods, the factors influencing the development of CO2 capture technologies and inhibiting their implementation in the territory of Latvia were analysed.
The SWOT analysis showed that the main factors influencing the implementation of CCU technologies are political and financial. The political aspect plays a vital role at all levels—both at the entrepreneurial level and at the national and European levels. The ambiguity of the adopted laws and financial instability prevent entrepreneurs from taking significant and serious steps in the modernisation of existing production. It is often difficult for entrepreneurs to follow the latest requirements of new laws—they can no longer act in advance due to the lack of financial support from the state.
The following analysis of the FLCA visually showed the dependence of the factors indicated in the SWOT and made it possible to determine which of them directly affect the introduction of new technologies and which ones affect indirectly. Similar to the SWOT analysis, political and economic factors have a direct and maximum impact on the speed of adoption of new technologies. However, the FLCA analysis showed that the human factor plays an equally important role. The rejection of new products by the population can slow down the speed of new technology implementation. However, in contrast to the political aspect, the negative impact of the human factor can be reduced by conducting educational and awareness-raising courses for both workers and the public. People need to know why changes are being made in the usual production process and what advantages are brought by the modernisation of technologies (for example, the creation of new jobs). Even though this modernisation often requires serious financial investments, in the future, the enterprise can start producing a product with high added value, enter a new market and, as a result, recoup the investments made. In this case, the company becomes attractive to investors.

Author Contributions

J.P. analysed the publicly available information regarding the CO2 emission data. V.T. analysed the publicly available data regarding the CO2 emission data, performed data visualisation. All authors have read and agreed to the published version of the manuscript.

Funding

This research is funded by the Latvian Council of Science, project CO2 Deal: Effective Valorisation of CO2 for Decarbonised Regional Development, project No. lzp-2020/1-0302.

Institutional Review Board Statement

In accordance with CODE OF ETHICS FOR SCIENTISTS, approved by Latvian Academy of Sciences and the Latvian Council of Science, prior to the commencement of the research, the field’s research ethics committee or the researcher must evaluate whether the anticipated benefit from the research results will justify the possible risks to the person subject to the research and to society. As in this particular research was not research on “Human Subjects or Animals” and participants were informed about the aim of the research, we as researcher group (Scientific and ethical committee of Institute of Energy Systems and Environment, Protocol No 26/11/2021) evaluated risks and agreed on an approval of the research.

Informed Consent Statement

Not applicable.

Data Availability Statement

Publicly available data from free databases were used.

Conflicts of Interest

The authors declare that they have no known competing financial interest or personal relationships that could have appeared to influence the work reported in this paper.

References

  1. EPA. Sources of Greenhouse Gas Emissions. Available online: https://www.epa.gov/ghgemissions/sources-greenhouse-gas-emissions (accessed on 26 November 2021).
  2. Ming, Z.; Shaojie, O.; Yingjie, Z.; Hui, S. CCS technology development in China: Status, problems and countermeasures—Based on SWOT analysis. Renew. Sustain. Energy Rev. 2014, 39, 604–616. [Google Scholar] [CrossRef]
  3. European Commission. Proposal for a Regulation of the European Parliament and of the Council Establishing the Framework for Achieving Climate Neutrality and Amending Regulation (EU) 2018/1999 (European Climate Law); EC: Brussels, Belgium, 2020. [Google Scholar]
  4. Keating, D. Businesses and Consumers Will Decide whether the EU Green Deal Works. Euractiv.com. Available online: https://www.euractiv.com/section/energy-environment/news/businesses-and-consumers-will-decide-whether-the-eu-green-deal-works/ (accessed on 26 November 2021).
  5. Thys, J. A European Green Deal Under Pressure. Institut Montaigne. Available online: https://www.institutmontaigne.org/en/blog/european-green-deal-under-pressure (accessed on 26 November 2021).
  6. Central Statistical Bureau Republic of Latvia. Gaisa Emisiju Konti (NACE 2. Red.). 2020. Available online: https://www.csb.gov.lv/lv/statistika/statistikas-temas/vide-energetika/vide/tabulas/vig070/gaisa-emisiju-konti-nace-2red (accessed on 9 July 2020).
  7. Ritchie, H.; Roser, M. Our World in Data. Latvia: CO2 Country Profile. 2020. Available online: https://ourworldindata.org/co2/country/latvia (accessed on 26 November 2021).
  8. Investment and Development Agency of Latvia. Environment and Renewable Energy Industry. 2020. Available online: https://www.liaa.gov.lv/en/trade/industries/environment-and-renewable-energy (accessed on 26 November 2021).
  9. International Energy Agency. A Policy Strategy for Carbon Capture and Storage; IEA: Paris, France, 2012. [Google Scholar]
  10. Epifanceva, D. Factors affecting the effectiveness of the introduction of innovative technologies in production. Molod. Uchenij 2018, 22, 402–403. [Google Scholar]
  11. Osipova, I.; Menschikova, V. Identification of risks of technical re-equipment of industrial enterprises and key areas of their management. Soc. Javlenija Process. 2017, 12, 91–97. [Google Scholar]
  12. Aich, A.; Ghosh, S.K. Application of SWOT Analysis for the Selection of Technology for Processing and Disposal of MSW. Procedia Environ. Sci. 2016, 35, 209–228. [Google Scholar] [CrossRef]
  13. Khan, M.I. Evaluating the strategies of compressed natural gas industry using an integrated SWOT and MCDM approach. J. Clean. Prod. 2018, 172, 1035–1052. [Google Scholar] [CrossRef]
  14. Leung, D.Y.C.; Caramanna, G.; Maroto-Valer, M.M. An overview of current status of carbon dioxide capture and storage technologies. Renew. Sustain. Energy Rev. 2014, 39, 426–443. [Google Scholar] [CrossRef] [Green Version]
  15. Brunetti, A.; Scura, F.; Barbieri, G.; Drioli, E. Membrane technologies for CO2 separation. J. Memb. Sci. 2010, 359, 115–125. [Google Scholar] [CrossRef]
  16. Clausse, M.; Merel, J.; Meunier, F. Numerical parametric study on CO2 capture by indirect thermal swing adsorption. Int. J. Greenh. Gas Control 2011, 5, 1206–1213. [Google Scholar] [CrossRef] [Green Version]
  17. Al Fareed, A.; Kamla, A.A.-B. The Role of GIS on the Decision Making Process at Muscat Municipality: A SWOT analysis. In Proceedings of the 10th IBIMA Conference, Kuala Lumpur, Malaysia, 30 June–2 July 2008. [Google Scholar]
  18. Andreas, M.; Allan, A. Incorporating geology and geomorphology in land management decisions in developing countries: A case study in Southern Costa Rica. Geomorphology 2007, 87, 68–89. [Google Scholar] [CrossRef]
  19. Elmahdi, A.; Kheireldin, K. GIS and Multi-Criteria Evaluation for Integrated Water Resources. In Proceedings of the ISCO 2004—13th International Soil Confservation Organisation Conference, Brisbane, Australia, 4–8 July 2004. [Google Scholar]
  20. Boroushaki, S.; Malczewski, J. Using the fuzzy majority approach for GIS-based multicriteria group decision-making. Comput. Geosci. 2010, 36, 302–312. [Google Scholar] [CrossRef]
  21. Nasehi, S.; Hoveidi, H.; Imanpour Namin, A.; Nohegar, A. Strategic planning, based on environmental spatial assessment, using SWOT and GIS to locate sustainable industrial areas (case study: Tehran province). Pollution 2019, 5, 569–583. [Google Scholar]
  22. Comino, E.; Ferretti, V. Indicators-based spatial SWOT analysis: Supporting the strategic planning and management of complex territorial systems. Ecol. Indic. 2016, 60, 1104–1117. [Google Scholar] [CrossRef] [Green Version]
  23. Terjanika, V.; Gusca, J.; Pubule, J.; Blumberga, D. Analysis of CO2 Valorisation Options for Regional Development. Environ. Clim. Technol. 2021, 25, 243–253. [Google Scholar] [CrossRef]
  24. Poczeta, K.; Papageorgiou, E.I.; Gerogiannis, V.C. Fuzzy Cognitive Maps Optimization for Decision Making and Prediction. Math. 2020, 8, 2059. [Google Scholar] [CrossRef]
  25. Shinno, H.; Yoshioka, H.; Marpaung, S.; Hachiga, S. Quantitative SWOT analysis on global competitiveness of machine tool industry. J. Eng. Des. 2006, 17, 251–258. [Google Scholar] [CrossRef]
  26. Gürel, E. Swot Analysis: A Theoretical Review. J. Int. Soc. Res. 2017, 10, 994–1006. [Google Scholar] [CrossRef]
  27. Matteo Mazziotta, A.P. Methods for Constructing Composite Indices: One for All or All for One? Riv. Ital. Econ. Demogr. Stat. 2016, 82, 394–411. [Google Scholar]
  28. UNCTAD. The Impact of Rapid Technological Change on Sustainable Development; UNCTAD: Geneva, Switzerland, 2019. [Google Scholar]
  29. Metz, B.; Davidson, O.; de Coninck, H.; Loos, M.; Meyer, L. Carbon Dioxide Capture and Storage; Cambridge University Press: Cambridge, MA, USA, 2005. [Google Scholar]
  30. Mukeshimana, M.C.; Zhao, Z.Y.; Nshimiyimana, J.P. Evaluating strategies for renewable energy development in Rwanda: An integrated SWOT–ISM analysis. Renew. Energy 2021, 176, 402–414. [Google Scholar] [CrossRef]
  31. Rassool, D. Overview of Organisations and Policies Supporting the Deployment of Large-Scale CCS Facilities; Global CCS Institute: Washington, DC, USA, 2020. [Google Scholar]
  32. Witte, K. Social Acceptance of Carbon Capture and Storage (CCS) from Industrial Applications. Sustainability 2021, 13, 12278. [Google Scholar] [CrossRef]
  33. Lendel, V.; Varmus, M. Identification of the main problems of implementing the innovation strategy in Slovak businesses. Acta Univ. Agric. Silvic. Mendel. Brun. 2012, 60, 221–234. [Google Scholar] [CrossRef] [Green Version]
  34. Kiselev, D.; Popov, Y.; Kanygina, O. Problems of ineffective modernization at industrial enterprises and ways of their solution. MATEC Web Conf. 2017, 129, 01029. [Google Scholar] [CrossRef] [Green Version]
  35. Klein, K.J.; Knight, A.P. Innovation Implementation Overcoming the Challenge. Am. Psychol. Soc. 2005, 14, 243–246. [Google Scholar]
  36. Zapantis, A.; Townsend, A.; Rassool, D. Policy Priorities to Incentivise Large Scale Deployment of CCS; Global CCS Institute: Washington, DC, USA, 2019. [Google Scholar]
  37. European Commission. Innovation Fund. Available online: https://ec.europa.eu/clima/eu-action/funding-climate-action/innovation-fund_en (accessed on 29 November 2021).
  38. European Comission. CORDIS—EU Research Projects under Horizon 2020 (2014–2020). Available online: https://data.europa.eu/data/datasets/cordish2020projects?locale=en (accessed on 29 November 2021).
  39. VVD. AB Atļaujas (AB Permissions). Available online: https://registri.vvd.gov.lv/izsniegtas-atlaujas-un-licences/a-un-b-atlaujas/ (accessed on 13 January 2022).
  40. LVGMC. Pollutant Release and Transfer Register. Available online: https://prtr.lvgmc.lv/ (accessed on 13 January 2022).
  41. Wang, R.; Peng, B.; Huang, K. The research progress of CO2 sequestration by algal bio-fertilizer in China. J. CO2 Util. 2015, 11, 67–70. [Google Scholar] [CrossRef]
  42. Styring, P.; Jansen, D.; de Coninck, H.; Reith, H.; Armstrong, K. Carbon Capture and Utilisation in the Green Economy Using CO2 to Manufacture Fuel, Chemicals and Materials; Centre for Low Carbon Futures: Sheffield, UK, 2011. [Google Scholar]
  43. Bakhtavar, E.; Valipour, M.; Yousefi, S.; Sadiq, R.; Hewage, K. Fuzzy cognitive maps in systems risk analysis: A comprehensive review. Complex Intell. Syst. 2020, 7, 621–637. [Google Scholar] [CrossRef]
  44. Borisov, V.; Stefantsov, A.; Bobryakov, A.; Luferov, V. The System of Fuzzy Cognitive Analysis and Modeling of System Dynamics. In Proceedings of the IS-2019 Conference, Ulyanovsk, Russia, 24–27 September 2019; Volume 2475, pp. 72–81. [Google Scholar]
  45. European Commission. Modernisation Fund. Available online: https://ec.europa.eu/clima/eu-action/funding-climate-action/modernisation-fund_en (accessed on 29 November 2021).
  46. Goulder, L.H.; Parry, I.W.H. Chapter 1. What is the Best Policy Instrument for Reducing CO2 Emission? In Fiscal Policy to Mitigate Climate Change; Oxford University Press: Oxford, UK, 2008; Volume 2, pp. 152–174. [Google Scholar]
  47. Scott, V. What can we expect from Europe’s carbon capture and storage demonstrations? Energy Policy 2013, 54, 66–71. [Google Scholar] [CrossRef] [Green Version]
  48. Wyns, T.; Khandekar, G.; Axelson, M.; Sartor, O.; Neuhoff, K. Industrial Transformation 2050. Towards an Industrial Strategy for a Climate Neutral Europe; IES: Brussels, Belgium, 2019. [Google Scholar]
  49. CATF. California’s CO2 Reduction Program Opens Doors to CCS. Available online: https://www.catf.us/2018/11/californias-co2-reduction-program/ (accessed on 29 November 2021).
  50. International Revenue Service, Treasury. 26 USC 45Q: Credit for Carbon Oxide Sequestration. Intern. Revenue Serv. 2021, 86, 4728–4773. [Google Scholar]
  51. Bellona. Biomass with CO2 Capture and Storage (Bio-CCS), the Way Forward for Europe; Bellona: Oslo, Norway, 2012. [Google Scholar]
  52. Olajire, A.A. Valorization of greenhouse carbon dioxide emissions into value-added products by catalytic processes. J. CO2 Util. 2013, 3–4, 74–92. [Google Scholar] [CrossRef]
  53. Blom, T.J.; Straver, W.A.; Ingratta, F.J. Carbon Dioxide in Greenhouses; OMAFRA: Guelph, ON, Canada, 2012. [Google Scholar]
  54. Gale, H.F. Is There a Rural-Urban Technology Gap? Results of the ERS Rural Manufacturing Survey. Agric. Inf. Bull. 1997, 736, 736. [Google Scholar]
  55. UNCTAD. Technology and Innovation Report 2018: Harnessing Frontier Technologies for Sustainable Development; UNCTAD: New York, NY, USA; Geneva, Switzerland, 2018. [Google Scholar]
  56. Cowie, P.; Townsend, L.; Salemink, K. Smart rural futures: Will rural areas be left behind in the 4th industrial revolution? J. Rural Stud. 2020, 79, 176. [Google Scholar] [CrossRef]
  57. OECD. Rural Well-Being: Geography of Opportunities; OECD: Paris, France, 2020. [Google Scholar]
Figure 1. CO2 emissions in Latvian sectors from 2010 to 2018 [6].
Sustainability 14 05054 g001
Figure 2. Primary energy generation from renewables, PJ [8].
Sustainability 14 05054 g002
Figure 3. The algorithm of the performed work.
Sustainability 14 05054 g003
Figure 4. Sites of CO2 (dark brown) production and (green) potential utilisation [23].
Sustainability 14 05054 g004
Figure 5. Results of FLCA analysis.
Sustainability 14 05054 g005
Figure 6. Factors (a) influencing the rate of introduction of technologies, (b) which are influenced by the rate of introduction of new technologies.
Sustainability 14 05054 g006aSustainability 14 05054 g006b
Table 1. CO2 Capture and Utilisation in Europe.
StrengthWeaknesses
Influence of large countries of the Union on small ones, the ability to apply sanctions in case of non-fulfilment of obligationsProlonged response and action of each participating country separately
Improving the quality of life for residents of the European Union (improving air, environment, health, additional jobs) [28]No unity in making mandatory and unpopular decisions
Cooperation of countries on the issue of CCSU technologies, the ability to finance technology development and innovation in the sectorDifferent financial situations of each country [9,28]
Diversified development of CCS and CCSU technologies (applicable in various production sectors)Different levels of technological development
Support for renewable energy and the phasing out of non-renewable onesNot all countries have developed a clear-enough regulatory system for CCS and CCSU implementation [29]
Knowledge about energy efficiency and required measures [30]CCSU technologies are still in the development stage [28]
In the case of storage—suitable underground storage facilities are required, the imperfection of laws (the ability to find loopholes for default) [31]
Low level of public awareness of the problem and public acceptance of changes [32]
OpportunitiesThreats
The opportunity to change the economic situation in the world for the betterThe ecological situation is deteriorating faster than countries react to it and act
Great world experience in the field of CCSU technologies—there is an opportunity to use and share best practices and mistakes (thus stimulating the further development of the sector)An unstable political situation, epidemics (as well as major disasters and cataclysms) and their consequences (economic decline)
An increase in the CO2 tax and the price of CO2 quotas (stimulation of a faster installation of CCSU technologies)An increase in electricity prices, the development of technologies will increase the technological gap between countries [28]
The gap in experience and knowledge regarding CCS technologies [29]
Table 2. CO2 Capture and Utilisation in Latvia.
StrengthWeaknesses
The need for changesNo or too little help from the state [9,33]
Requirements for reducing CO2 emissions at the legislative levelHigh cost of technology [33,34,35]
The ability to attract foreign investorsLack (or small number) of specialists and or representatives in this field in the country [33,35]
Additional jobsThe slow introduction of technologies due to the inertia and unresponsiveness of entrepreneurs [34]
The development of an enterprise and satellite enterprisesThe extremely negative reaction from entrepreneurs in the case of mandatory introduction of CO2 capture technologies
An extremely positive impact on the environment and human healthLow awareness of investors about CCS and CCSU technologies [9,36]
Knowledge about energy efficiency and required measures
OpportunitiesThreats
The opportunity to receive project financing from European funds [37] Economic instability (caused by instability from the outside—exchange rates, politics, etc.) [34]
The ability to attract specialists from other countriesAn increase in the price of electricity
Decrease in the amount of CO2 emissions in the country
The development of the production sector
Table 3. CO2 Capture and Utilisation in Companies.
StrengthWeaknesses
Knowledge of technologyThe need to acquire new technologies [34,35]
Additional income for production (CO2 is a by-product that can be sold or utilised)The high cost of technology may put at risk the existence of the company [33,34]
Variety of technologiesLack of free space for technology installation
Easy to install CO2 capture systemsThe need to redo an existing production process
Synergy with an existing company (transportation)Additional financial costs associated with the maintenance of new installations [34]
The technological advantage over competitors (utilisation)The need to create a logistics network (transportation)
No dependence on CO2 suppliers (utilisation)
Confidence in the quality and purity of captured CO2 (utilisation)
OpportunitiesThreats
Additional jobsIncreasing requirements for CO2 quality
Possibility to attract funding from the EU and the stateToo long technology payback time
Chance to get foreign investmentAbsence of a representative of the technology manufacturer in the country [33]
Possibility to reduce the number of generated emissions
Sustainable development
The ability to reduce the price of the final product, which will attract additional buyers (utilisation)Distance from a potential buyer (transportation)
Dependence on the CO2 buyer(transportation)
Conservatism and unwillingness to change (utilisation)
Alternative resources to carbon dioxide (utilisation)
Publisher’s Note: MDPI stays neutral with regard to jurisdictional claims in published maps and institutional affiliations.

