Abstract
An adequate phosphorus (P) supply in the rhizosphere is essential for proper P uptake through plant roots. Distributions of P varies depending on the soil structure, formation, and the parent material from which it originates. More research is needed to determine whether soil depth and parent materials have an impact on P distribution. It was hypothesized that the type of soil formed by different parent materials is related to P uptake and soil P fractions. Soil samples were taken from different profiles at various stages of development in loess, alluvium, shale, and sandstone parent materials. The samples were analyzed for P fractions using the Jiang and Gu fractionation scheme. In the present study, the P fractions were controlled according to the quantity and the components, such as organic matter, clay minerals, carbonates, iron, and aluminum oxides. Studying the phosphatase enzyme activity related to P fractions, the soil parent material, and their development was highly beneficial in defining which P pools are more accessible to plants, as well as the effect of phosphatase in limiting P availability. Among all the tested parent materials, the total P in soils derived from the loess parent material was higher (792 mg kg−1) than in soils derived from alluvium, shale, and sandstone, respectively. The amount of apatite P in alluvium parent material was higher, accounting for 51–56% of total P. Other P forms varied significantly in parent materials in the following order loess > alluvium > shale >> sandstone. Phosphatase enzyme was found to be an indicator of P availability by limiting its uptake by plants.
1. Introduction
The amount of bioavailable phosphorus (P) in the soil is low and this limits crop production. An adequate P supply in the soil is essential for proper P uptake through plant roots. In cultivated soils, total P varies from 150 to 1000 mg kg−1 [1]. P deficiency is more closely related to reduced availability (labile forms) than to low total P values in the soils. The primary mineral for phosphorus is apatite, which is highly stable in calcareous soils [2,3]. Only a miniscule amount of P is released from apatite, which is insufficient for satisfying crop necessities. The secondary P minerals such as aluminum, iron, and calcium have low solubility values and are highly stable [4,5].
Phosphorus uptake and its utilization by the plants are related to the distribution of soil P fractions and their availability. The major forms of phosphorus in soil are organic and inorganic phosphorus, which have different natures and behavior [6]. Soil inorganic mineral phosphorus occurs within different calcium, iron, and aluminum compounds with various solubilities, phosphorus soil solution, and phosphorus adsorbed on exchangeable sites.
Bioavailable phosphorus in soil is soluble and exchangeable. Soil phosphorus fractionations help to predict the transformations of phosphorus bioavailability [7]. The chemical fractionation of inorganic phosphorus helps to identify the individual forms that are most prevalent in the soil [8]. Phosphorus adsorption occurs on the surface of clay minerals with HCO3, and plants adsorb phosphorus from soil solutions in the form of inorganic orthophosphates (Pi) HPO4 and H2PO4 [9,10]. The insoluble phosphates are Ca, and Fe compounds, while organic matter and iron oxide P forms are exchangeable. Alkaline conditions form Ca- and Mg-associated P forms, while Al-associated P is formed under acidic conditions [11]. The phosphorus fractions held by iron and aluminum oxides are occluded and cannot be readily available for plant uptake [12].
The phosphorus uptake proportion is low in plants compared to its input in soils as fertilizer due to a problem of higher fixation. Phosphorus deficiency is a major concern for the entire world due to the paradoxical nature of its availability in different soils [13]. Phosphorus availability can be better understood by knowing the interaction of different phosphorus fractions in different soils according to their developmental stages. Knowing the quantities of different phosphorus fractions in the soil helps to better understand the phosphorus availability problem [14].
This study’s objective was to find out how different parent materials, their developmental stages, and their depths affected phosphorus distribution. Additionally, phosphatase enzyme activity and Olsen P were also analyzed to determine the relationships between different P forms. It was hypothesized that (1) soils formed from different parent materials vary in phosphorus fractions, and phosphatase enzyme activity is an indicator of P deficiency; (2) phosphorus fractions are related to soil development and phosphorus uptake.
2. Materials and Methods
2.1. Site and Soil Description
Soils from the Potwar region of Pakistan were collected at three stages of development and were formed from four different parent materials: loess, sandstone, shale, and alluvium. The soils were characterized following the USDA soil classifications [15].
Weathering in loess soils is dependent on the graphic position, where soils on flat plains are weathered more than sloped soils. The early developed series comprises a fine-textured, well-drained, slightly deep, and non-calcareous soil with a structural B horizon. It was formed by loess that was deposited during the Pleistocene period. It occurs in sub-humid, sub-tropical, and continental climates. It is located on a level that closely resembles the slightly sloping plane of the sub-recent erosion surfaces of the loess plains level. Moderately developed is the most miniature stage of development with no cambic B horizon (gullied land). A series of loess soils consisting of silty clay loams, silty clays, and calcareous was developed throughout [16].
Soil developmental stages in the alluvium are related to the time of deposition. In alluvium soils, early developed soil was non-calcareous, fine-textured, and formed in mixed calcareous clayey alluvium that was obtained from the Himalayas and possibly formed during the late Pleistocene epoch. By contrast, the moderately developed soil has a calcareous medium texture that evolved in mixed alluvium and originated during the recent sub-epoch from Himalayas and Potwar uplands. These developed soils have a coarse texture and are formed in recently mixed alluvium obtained from the Himalayas [17].
The sandstone was derived from the Pliocene period’s Siwalik formation or the shale admixture of sandstone derived mountainous terrain (Miocene period formation). Based on the development stages of the sandstone soils, the following soils were chosen: (i) an early developed series consisting of well-drained, medium-textured, quite deep, relatively fine, and non-calcareous soil with an argillic B horizon, formed from tertiary sandstones and occurring in sub-tropical, sub-humid, continental climates; (ii) a moderately developed soil series, which consisted of moderately fine-textured calcareous developed soil and grey and white residual calcareous materials from lower and middle Siwalik sandstone; and (iii) the developed soil series with no B horizon, which was formed in the grey and white sandstone of lower and middle Siwalik [18].
The soils used in the shale formation were (i) the early developed soil series, which was developed in red and purple with a mixture of sandstone and was decalcified owing to significant rainfall; (ii) the moderately developed soils, which were developed in red and purple and consisted of calcareous soil with less development; and (iii) the late developed soil series, which was the least weathered and which had a sandstone admixture and no B horizon [19].
2.2. Soil Sample Collection
Soil sampling was performed with a stainless-steel auger in five cores at depths between 0–10 and 10–25 cm at genetic horizons from replicated profiles of soil development at different locations in Pakistan. The soil was dried by air, pulverized, and then sieved at 2 mm before chemical and physical analysis.
The soils exhibited lower levels of organic matter, host-available phosphorus, and no salinity. Most soils had a pH greater than 7.0, and the calcareousness ranged from highly calcareous to non-calcareous based on soil formations. The phosphorus fractions, including the labile pool, secondary aluminum-iron phosphate, and apatite P varied due to weathering stages and soil parent material. Apatite P significantly was reduced with the improvement in the total absorbed and iron-capped phosphorus fractions.
Soil texture, color, and pH were among the morphological traits detected in the field. Calcium carbonate was found in most dark brown to yellowish-brown soils, except for shale-derived soils, which were reddish to reddish-brown in color. Early formed soils were calcareous with no zone of lime deposit, though the soils were decalcified at moderately advanced growth stages [20].
2.3. Soil Phosphorus Fractionations
Following the quantitative measurement used in Jiang and GU’s fraction system (1989) [21], each sample was quantified for several soil phosphorus forms such as apatite, Ca8-P, Ca2-P, Organic P, iron oxide adsorbed P, iron oxide occluded P, and aluminum oxide bound P. Inductively coupled plasma mass spectrometry was used for all P concentration analyses (ICP-MS, PerkinElmer, Waltham, MA, USA).
Inorganic Phosphorus Fractions
The inorganic phosphorus pools were determined stepwise as follows:
- Ca2-P was determined by taking 1 g soil, shaking it for one hour in a 0.025 M solution of sodium bicarbonate (NaHCO3, pH 7.5), centrifuging the whole at 4000 rpm for 10 min (Daoran Trading Jilin China, Songyuan, China), and removing the supernatant.
- Ca8-P was determined by taking the residue of Ca2-P and washing it twice with 95% alcohol, shaking with 50 mL 0.5 M ammonium acetate solution (NH4Ac, pH 4.2), leaving it without shaking for 4 h, centrifuging, and then removing the supernatant.
- Al-P determination: after determining Ca8-P, the residues were washed twice with saturated (NaCl), then shaken for 1 h with a 50 mL solution of 0.5 M ammonium fluoride (NH4F), centrifuged, and the supernatant removed.
- Fe-P determination: the residues were washed two times with saturated NaCl, shaken for 2 h with 50 mL of 0.1 M NaOH-0.1 M sodium carbonate (Na2CO3, pH 8.2) solution, left unshaken for 16 h, and then shaken again for two hours.
- Occluded P was washed twice with sodium chloride (NaCl), shaken with 40 mL of 0.3 M sodium citrate (C6H5Na3O4.2H2O) solution plus 1 g sodium dithionate, heated at 80 °C for 15 min, centrifuged, and the supernatant was removed before P determination.
- For the Ca10-P determinations, the residues were taken, shaken for one hour in a 50 mL 0.5 M sulphuric acid (H2SO4) solution, centrifuged, and the supernatant removed for determination.
2.4. Total Phosphorus
Olsen and Watanabe’s HClO4 technique (1963) was used to digest total P. In 250 mL calibrated tubes with 2 g air-dried soil and a few pumice-boiling granules, 30 mL of 60% HClO4 was added. The tubes were placed in a block digester and gradually heated to 100 °C before being elevated to 180 °C. The sample was digested until it resembled white sand. This mixture was cooled and increased to a suitable volume, then the supernatant was used to determine P. A supernatant solution was collected for P determination after the mixture was cooled and increased to an appropriate volume. The total phosphorus values were used to determine organic phosphorus by subtracting the forms sum of inorganic phosphorus forms.
2.5. Soil Phosphatase Activity
A total of 0.25 mL toluene was added to 1g soil for the phosphatase activity. Then, 4 mL of a universal modified buffer and 1 mL of p-nitrophenyl phosphate solution were added to the same buffer and incubated at 37 °C for one hour. The universal buffer was prepared by adding 12 g of Tris, 14 g of citric acid, 11.6 g of maleic acid, 500 mL of NaOH, and 6.3 g of boric acid, and then diluted by dH2O to 1000 mL. After incubation, 1 mL of CaCl2 (0.5 M) and 4 mL of NaOH (0.5 M) were added. All the components were combined and filtered using Whatman no. 42 and the absorbance was determined at 400 nm [22].
2.6. Assessment of P Uptake
The crop was harvested after 42 days, kept in the oven, dried, grounded, and prepared for analysis of total P, which was measured by digestion in 60% HClO4 and subsequent spectrophotometric determination [23]. Phosphorus uptake (biomass × P concentration) was determined.
2.7. Statistical Analysis
The variation in the parameters at different development stages was analyzed using analysis of variance (ANOVA) in SPSS version 21. Principle component analysis (PCA) was performed to examine the correlation between soil-plant indexes and P fractions using the R software for windows.
3. Results and Discussion
3.1. Total Phosphorus
The total phosphorus content of loess soils ranged from 400 to 1410 mg kg−1 in, from 200 to 1015 mg kg−1 in the shale, 200–760 mg kg−1 in the sandstone, and 340–1000 mg kg−1 in the alluvial soils. Soils derived from the loess parent material had the highest mean total phosphorus content (Table 1). Total phosphorus was slightly higher at the surface than subsurface regardless of the parent material or soil type, implying that the accumulation of P in the topsoil in the area, possibly due to the long-term cropping of wheat and cotton systems in loess soils, left a considerable legacy [24]. In sandstone and shale, the subsoil had more total phosphorus than the topsoil, while the topsoil had more total phosphorus than did loess and alluvium. However, the alluvium soils had a significantly higher total P in topsoil, which might be due to precipitations and water flow from the agricultural flood soils from the surroundings [25]. The soils derived from alluvium and loess were intensively cultivated, while shale soils were under forests and sandstone was separately cultivated, implying phosphorus accumulation where cultivation is intensive (Figure 1). In shale mean total phosphorus was more significant in the early developed stage profiles than in moderately developed and developed soils, but the differences between the surface and the subsurface were significant in the moderately developed soils (Figure 1).

Table 1.
Phosphorus fractions (mg kg−1) in soils at depths of 0–10 cm and 10–25 cm. The lower value shows the subsoil of the parent materials (loess, shale, alluvium, and sandstone), respectively.
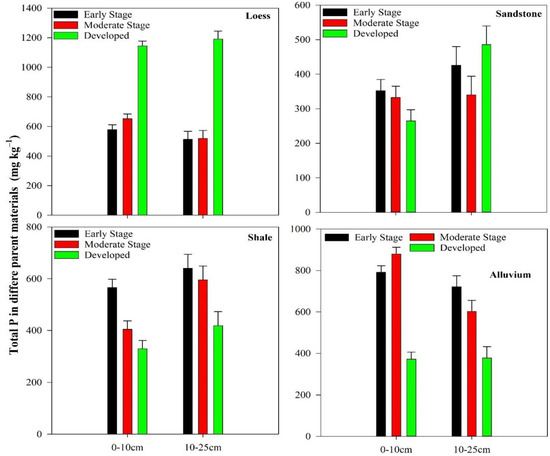
Figure 1.
The distribution of total phosphorus was highest in loess parent material soils at the developed stage at both depths and limited in other parent material soils (alluvium, shale, and sandstone).
Among the sandstone soils, the developed stage significantly differed in the top (0–10) and subsoil (10–25) distribution of total phosphorus. Alluvial soils at the moderately developed stage had a significant difference in top and subsoil total phosphorus. The lowest total P was observed in the subsurface, where soil microorganism activities and plant roots were at their peak due to intensive cropping. On the other hand, the highest overall P at the surface could be linked to renewable mineral substances and irrigation, eolian deposition, and fertilization [26,27].
3.2. Organic Phosphorus
Organic phosphorus was calculated by the difference in the total inorganic phosphorus fractions. The total phosphorus ranged from 168 to 193 mg kg−1 soil at a 0–10 cm depth, while it was 160–175 in soil at a depth of 10–25 cm. The organic phosphorus content ranged from 140 to 340 mg kg−1 in loess soils, from 105 to 280 mg kg−1 in shale, from 40 to 230 mg kg−1 in sandstone, and from 104 to 225 mg kg−1 in alluvium soils. The loess parent material had the highest organic phosphorus content (Figure 2), suggesting that the soils with parent materials had a different organic phosphorus distribution with depth. Loess and alluvium had more organic phosphorus, while shale and sandstone soils had more organic phosphorus in the subsoil.
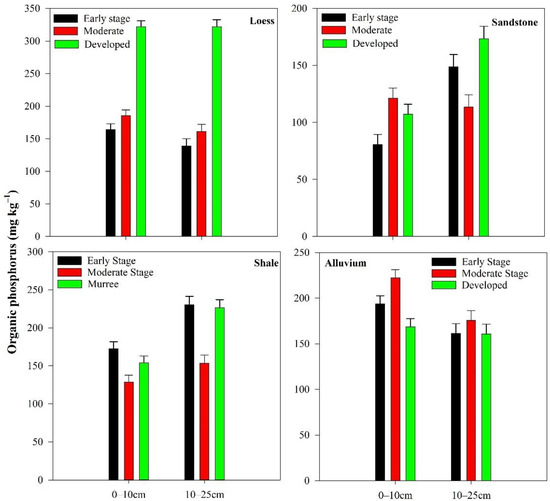
Figure 2.
The distribution of organic P was high in the loess parent material at the moderately developed stage on the surface, while limited in the other parent material soils of alluvium, shale, and sandstone parent material.
Both loess and alluvial soils were under intense cultivation compared to shale- and sandstone-derived soils.
In loess, the moderate and early developed soil profiles had a higher mean of organic phosphorus in the topsoil (0–10 cm), while the developed stage had greater organic phosphorus in the subsoil (10–25 cm) (Figure 2). In shale, the topsoil had less organic phosphorus than the subsoil in all three early, developed, and moderately developed soils. In alluvium, the early and moderately developed stages had a greater mean of organic phosphorus at the topsoil; both soils occurred near watercourses and canals and were thus intensively fertilized and cultivated [28]. The shale had high levels of organic phosphorus since all three developmental stages occurred in forest areas; it also had the highest organic matter content [29]. Our findings are in line with those of Memon et al., 2012, who found higher levels of organic P in granite-derived alluvium and greywacke-derived alluvium [30,31]. Furthermore, greater organic P content was discovered in alluvial soils during vegetable crop yields, and similarly in shale-derived soils for forest production, than in loess soil, as reported by Memon et al. (2011) [1]. A notable difference is that the loess soils contained the highest organic phosphorus content, which was likely due to manure application and crop residue turnover [32].
3.3. Inorganic Phosphorus Fractions
3.3.1. Apatite P
Soil apatite P was the largest inorganic phosphorus fraction in all of the parent materials studied. The range of apatite P conforms to the extent found in other studies comparing apatite P contents at the surface (Table 1). Overall mean apatite P content in the top and subsoil remained unchanged (Figure 3). In loess, the mean apatite P was more significant in the developed soils than in the moderately and early developed soils, and there was no significant difference between the top and the subsoil in each loess soil. In alluvium, the mean apatite P was greater at the early stage of development than in moderately developed and developed soil, and there was significantly more apatite in the topsoil than in the subsoil. In shale, apatite P was greater in the early than in the moderate and developed stages, and there was no significant difference between the top and the subsoil apatite. In sandstone, apatite P was greater in the early stage than in the moderate or developed stages at the subsoil (10–25 cm) (Figure 3). Apatite content was highest in sandstone because of high organic matter, which could explain this mechanism. The alluvial soils had higher apatite P concentrations compared to loess soils. Many studies have found that loess soils have higher apatite P levels than similarly aged alluvium soils [1,3]. Walker and Syer (1976) found the most apatite in the glacial outwash of greywacke and schist, followed by alluvium generated from granite and greywacke, and the least apatite in greywacke coastal sand dunes, at the initial stages of soil development. Ahmed et al. (2019) also reported apatite as the dominant P fraction in freshly deposited loess from riverbeds in northwest China [33]. Our study suggests that a higher accumulation of apatite in parent materials demonstrates P’s high legacy, which can be further utilized for crop production.
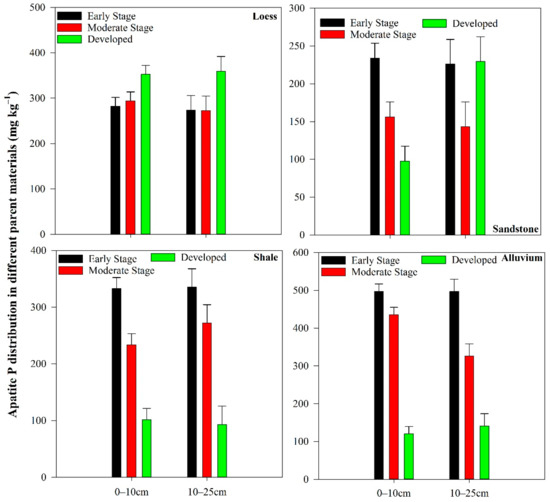
Figure 3.
The distribution of Ca10-P on the surface was high in alluvium parent material in the early developed stage but limited in the other parent material soils (loess, shale, and sandstone).
3.3.2. Phosphorus Adsorbed on Surfaces and Occluded in Iron Oxides
Loess soils had a significantly higher mean of iron adsorbed than other soils, ranging from 79.3 to 83.2 mg kg−1 in loess soils, from 27 to 38 mg kg−1 in shale, 22.1–25.0 mg kg−1 in sandstone, and 12–40 mg kg−1 in alluvium soils (Table 1). Iron adsorbed phosphorus in the soils showed slight differences according to depth (Figure 4). However, there was no significant difference in the distribution of iron oxide adsorbed P from the top to the subsoil in the parent materials. At both depths, loess soils had significantly more iron oxide sorbed phosphorus than other soils. The soils in each category of parent materials had topsoil similar to the subsoil as regards the distribution of iron oxide (p < 0.05). In shale, iron oxide phosphorus was more significant in the moderately developed and developed stages at the subsurface than in the topsoil, but no significant difference was found in other parent material soils (Figure 4). The high levels of iron oxide sorbed phosphorus in loess were due to the large mean in the developed soil series. The developed stage of loess soils was extremely weathered, such that crystallinity was poor, thereby providing a surface for the adsorption of iron [34].
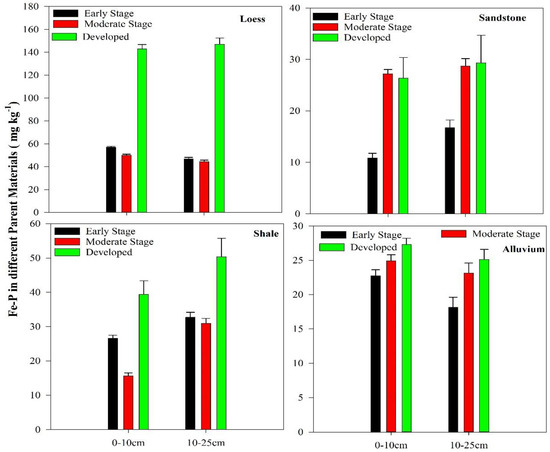
Figure 4.
The distribution of Fe-P was high in loess parent material soils at the developed stage and limited towards the other parent materials (shale, alluvium, and sandstone).
In the data set, occluded phosphorus content ranged from 1 to 32 mg kg−1, and in iron oxides it ranged from 13.4 to 13.1 mg kg−1 in the loess soils, 19.2–15.0 mg kg−1 in the alluvium soils, from 6.5 to 11.4 mg kg−1 in shale, and 9–10.7 mg kg−1 in the sandstone soils in topsoil and subsoils. The alluvium parent material had the most occluded phosphorus (Table 1). Different parent materials had non-significant differences in occluded phosphorus in the topsoil and subsoil.
Phosphorus is released through the dissolution of iron oxides with dithionite in the fractionation scheme known as occluded P. Occluded phosphorus formed only a minor part of the total inorganic phosphorus. Occluded phosphorus is phosphate that has been fixed inside iron oxide matrices as a result of the diffusive penetration and under-coating of iron oxides on soil particles, which promotes soil formation [11].
Within the alluvial soils, occluded P was more significant in the developed profiles at the topsoil than in early-stage or moderately developed soils. In loess, occluded P was more significant at the developed stage at the subsurface of topsoil, while loess soils at the early stage of development had more occluded P at the surface than the subsurface. In shale soils, the developed and early developed profiles had more significant amounts of occluded P at the subsurface than the surface (Figure 5).
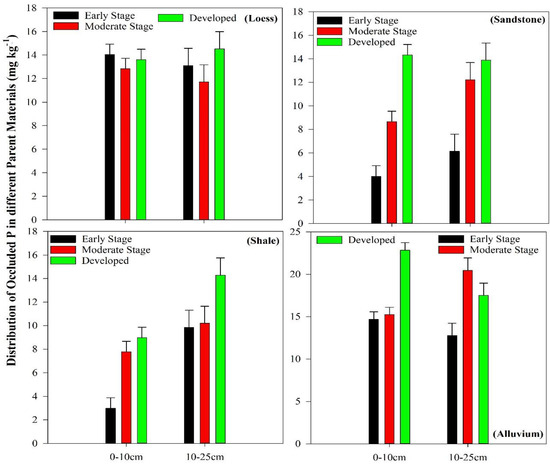
Figure 5.
The distribution of occluded P on the surface of the alluvium parent material at the developed stage was high, but it was limited for the other parent material soils.
Occluded P in alluvium soils is due to the intense cropping of crop residues, especially the root, from which occluded P can be extracted [35]. The results are supported by Mahmood et al. (2018), who studied the alluvial parent materials that accompany river flow and have high P legacy and occluded P forms. Although the occluded P fractions in both aluminum and iron were increased equally with development, using surface-adsorbed and surface-occluded iron oxides is preferred. Since aluminum hydroxide does not exist through the early developmental stages when soil pH is managed by free lime, and P adsorbed on Al was confused with P on Al at the vulnerable edges of organic matter [36]. Moreover, total iron oxide surface-occluded and -adsorbed P has been steadily increasing over a broad spectrum of soil development. Accordingly, a complex description of the precise physical, chemical, and biological processes in the soil would make the idea acceptable as a result of applying all main rules of energy and matter conservation.
3.3.3. Phosphorus Adsorbed on Aluminum Oxides
The Al-P fraction at both depths ranged from 38.6 to 45.8 mg kg−1 in loess, 15–19.2 mg kg−1 in the alluvium soils, 33–8.12 mg kg−1 in shale, and 10.5–19.4 mg kg−1 in sandstone soils (Table 1). Aluminum oxides do not exist in the soils at pH > 7, which is the prevailing pH in most soils [37]. This phosphorus fraction is desorbed from the aluminum of organic molecules exposed from the aluminum of organic matter. Therefore, the aluminum adsorbed P is linked to the presence of organic matter. Phosphorus’s highest aluminum oxides were in the loess parent material, and the aluminum adsorbed phosphorus was statistically unaffected by the depth of various parent materials. However, there were significant differences in aluminum adsorbed phosphorus between soils at different stages of development. In the alluvium, the moderately developed soil had greater aluminum adsorbed phosphorus on the topsoil (0–10 cm) than the subsurface in the other soils; the difference was non-significant. In the loess parent material, moderately developed soil had greater aluminum adsorbed phosphorus at the topsoil than the subsurface. However, it had the highest aluminum adsorbed P; the difference was non-significant as regards depths. The moderately developed soil had greater aluminum adsorbed phosphorus at the subsurface than the topsoil in shale. The sandstone parent material soils showed no significant difference between the top and the subsurface aluminum adsorbed phosphorus (Figure 6). The loess soils contained large amounts of aluminum-P, organic matter, and dithionite extractable aluminum [38]. The lowest Al-P in the sandstone was due to low organic matter [39]. The amount of P linked with iron and/or aluminum rises continuously with soil development, according to Smeck et al. (1994) and others [16,40]. Calcium secondary sediments increased at first, then were reduced. However, the reduction may be faster in udic soil moisture regimes than in ustic soil moisture regimes. Dry soil moisture regimes [41] and organic phosphorus increased initially but were reduced with extensive weathering [42].
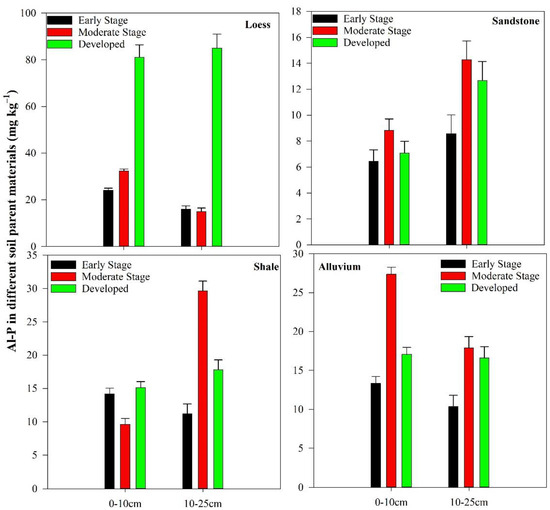
Figure 6.
The distribution of Al-P was high in developed soils of the loess parent material but was limited for the other parent material soils (alluvium, shale, and sandstone).
3.3.4. Calcium Phosphate
Calcium phosphates include soluble dicalcium phosphate extracted with 0.025 M sodium bicarbonate and sparingly soluble octa calcium phosphate extracted with 0.50 M ammonium acetate. The fractions varied according to soil parent materials, as shown in Table 1. This implies that there was a statistical difference between the top and the subsoil octa calcium phosphate distributions. Moreover, soils of each parent material had significant differences in octa calcium distribution in the top and subsoil with respect to their developmental stages. In alluvium, the moderately developed soils had significantly more octa calcium phosphate (10.29 mg kg−1) at the surface (0–10 cm) than the subsoil (10–25 cm). The moderately developed stage of alluvium soil was heavily fertilized for vegetable gardening. Among the loess soils, the developed stage had significantly greater octa calcium phosphate (89.98 mg kg−1, 92.98 mg kg−1) at the topsoil than the subsoil. In shale, the moderately developed soil had greater octa calcium phosphate at the subsurface than the topsoil, while sandstone soils had no significant difference in octa calcium phosphate at the topsoil and subsoil (Figure 7). Octa calcium phosphate is formed by gradually transforming dissolved P from fertilizer or apatite dissolution [43,44,45] (Jiang and Gu, 1989; Syers and Curtin, 1988).
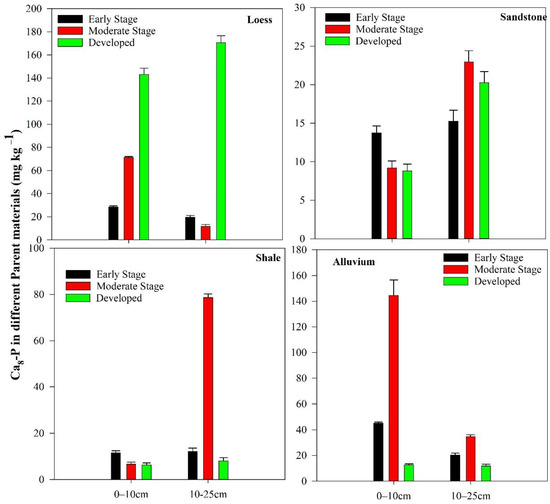
Figure 7.
The distribution of Ca8-P was high in loess parent material soils at the early developed stage and limited for the other parent material soils (alluvium, sandstone, and shale).
The mean value of dicalcium phosphate was observed at 33.6–35.5 mg kg−1 at the top and subsoil surface in the loess soils, 4–6.3 mg kg−1 in the alluvium, 4–12.4 mg kg−1 in shale, and 2.5–5.2 mg kg−1 in the sandstone soils. The highest calcium phosphatase content was found in the loess parent material (Table 1). Dicalcium phosphate content varied with the depth; it was more significant at the top than at the subsurface in the loess and alluvium, while in shale and sandstone, it was higher at the subsurface than at the topsoil (Figure 8).
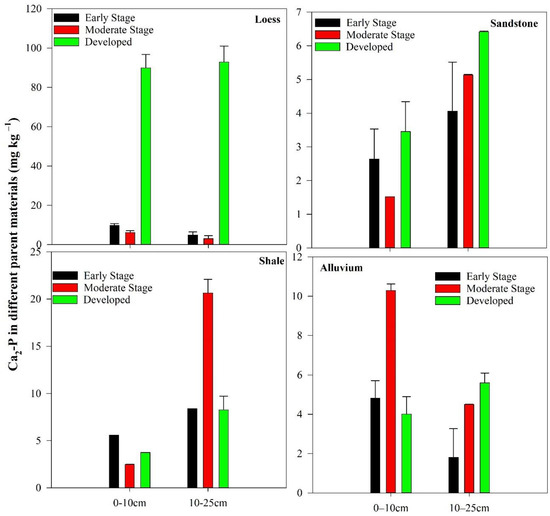
Figure 8.
The distribution of Ca2-P in early developed loess parent material soils was high, while it was limited towards the other parent material soils.
In loess, sandstone, and alluvium soils, there was no difference in dicalcium phosphate content between the top and the subsoil. In shale, the moderately developed stage had more significant octa calcium phosphate content at the subsurface than the topsoil (Figure 8). There might be a different mechanism behind these distributions of octa and dicalcium P forms in calcareous soils, as dicalcium and octa calcium phosphates are metastable phosphorus forms that are common in soils with heavy agriculture and fertilizer input. The major sources of bioavailable phosphates are iron oxides, dicalcium phosphates, and phosphate adsorbed on the organic matter surface. Under P depletion, the octa calcium phosphate fraction might change to dicalcium phosphate [46,47,48,49]. Octa calcium phosphates occur especially when soluble phosphates are added through heavy fertilizer application [38]. Memon et al. (2011) found that the alluvial soils have higher levels of octa calcium phosphate than loess and shale soils. The high Ca2-P in loess and alluvium was due to phosphorus fertilizers applied for crop yield. In turn, the sandstone-derived and shale soils received a small application of P fertilizer, particularly in early and developed shale soils; this was they had a very small amount of Ca2-P. Moreover, Memon et al. (2011) found that loess soils had higher Ca2-P contents than shale-derived soils. The surface sample of each developed and moderately developed soil profile had exceptionally high Ca2-P to be readily taken up by plants [50,51].
3.4. Soil Phosphatase
Soil phosphatase ranged from 5.2–5.8 mg kg−1 in the loess soils, 4.2–5.5 mg kg−1 in the alluvium soils, 3.3 to 5.4 mg kg−1 in shale, and 3.6 to 5.1 mg kg−1 in the sandstone soils. The surface, loess, shale, and sandstone-derived soils had similar but significantly greater phosphatase contents than the alluvial soils (Table 2). The phosphatase content at the subsurface (10–25 cm) in alluvial and loess soils was significantly higher than in shale- and sandstone-derived soils. The higher phosphatase content was associated with low inorganic phosphorus concentrations and a higher concentration of organic phosphorus. Soil phosphatase changed with the depth and its content was greater at the topsoil (0–10 cm) than the subsoil (10–25 cm) in loess, shale, and sandstone, while in alluvium soil, phosphatase content was greater at the subsoil than at the topsoil (Table 2).

Table 2.
Soil phosphatase and phosphorus uptake in the soils averaged over the parent material at different depths (0–10 cm and 10–25 cm). The data are followed by different letters denoting significant differences (p ≤ 0.05).
Nevertheless, in loess, the soil phosphatase was significantly different in the topsoil compared to the subsoil in early developed soil profiles, whereas in moderate and developed soil profiles, there was no significant difference in the topsoil compared to the subsoil (Figure 9). In the sandstone, the early developed stage was significantly different in top and subsoil phosphatase. It had greater soil phosphatase content in the topsoil than in the subsurface, but no significant difference was found in the other parent materials (Figure 9). Maximum phosphatase enzyme activity was observed during the vigorous crop growth period, which decreases with crop maturity [52]. Moreover, these findings are in line with those of Medinski et al. (2018) and Kul et al. (2021), implying that the phosphatase enzyme may be used as a phosphorus indicator but that its uptake by plants is limited [53,54].
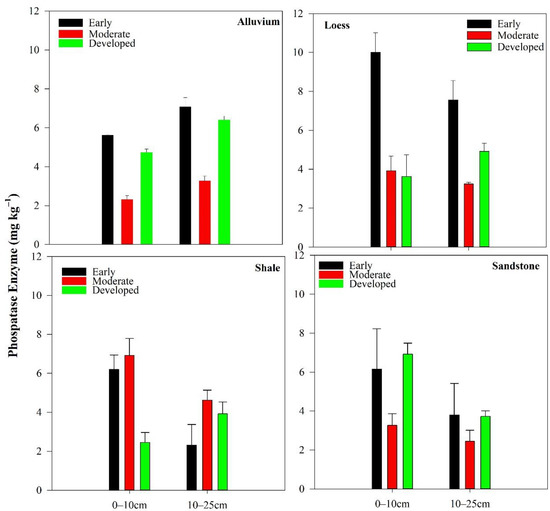
Figure 9.
The activity of soil phosphatase was highest in the early developed soils of the loess parent material at both depths, but was limited for the other parent material soils of shale, sandstone, and alluvium.
3.5. Olsen Phosphorus
Olsen P ranged from 0.36 to 40.1 in different parent materials (Table 2). Soil depth and type of parent material significantly influenced Olsen P (Table 2). In loess and alluvial soils, it was higher at the topsoil than at the subsurface (40.1 mg kg−1 and 7.94 mg kg−1, respectively), while Olsen P was higher at the subsurface than at the topsoil in shale and sandstone (Table 2).
Olsen P is the available P that is taken up by plants at various stages of development. Plant phosphorus uptake is commonly related to the Ca-P [49,55]. The Ca2-P fraction is water-soluble phosphorus and partly adsorbed phosphorus that could rapidly be up-taken by plants [56]. Moreover, an increase in Olsen P might be due to the greatest accumulation of apatite P in loess and other parent material soils, as apatite P is thought to be the primary source of available P that can later be converted into available P [57]. Ahmed et al. (2021) found that the apatite-P-released available P helps with plant uptake [58], which is consistent with our findings.
3.6. Phosphorus Uptake by Maize Plants
Phosphorus uptake was determined from the measured concentration and plant biomass. The phosphorous uptake values ranged from 0.01 to 5 mg kg−1 and 0.10 to 2.0 mg kg−1 in shale and 0.15–3 mg kg−1 in the sandstone soils. Phosphorus uptake varied depending on the depth (Figure 10. In the loess, alluvium and sandstone phosphorus uptake were greater from the subsurface than the topsoil, while in shale soils, phosphorus uptake was greater from the subsoil than the subsurface. In loess soils, phosphorus uptake was significantly greater in the developed profiles at the topsoil (0–10 cm) than in the subsurface profiles (10–25 cm). The shale’s early and moderately developed profiles had greater phosphorus uptake, while other soils had no significant uptake (Figure 10). The availability of soil phosphorus for plants is governed by the renewal of labile phosphorus from other phosphorus fractions [59]. High phosphorus uptake in loess early developed soil may be due to organic matter adsorbed P and high iron oxides. Phosphorus uptake may be high in early developed shale soils due to high organic phosphorus content [60].
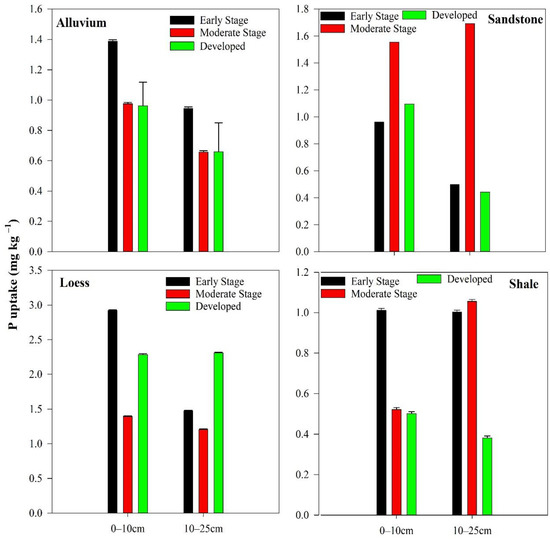
Figure 10.
P uptake by plants was highest in loess parent material soils at the early stage of development at both depths, while it was limited for the other parent material soils of alluvium, sandstone, and shale.
3.7. Correlation between P Uptake and P Fractions
The principal components and SEM were examined to evaluate the connection between P fractions, Olsen P, and P uptake (Figure 11 and Figure 12). Through principal component analysis, the available Pi fraction (Ca2-P, Fe-P) was found to be significantly correlated with P uptake. Moderate available Pi fractions of Ca10-P, as well as Ca8-P, showed a substantial and certain correlation with the total P uptake and yield. Total P uptake, grain yield, and organic and inorganic P fractions were all negatively correlated with recalcitrant occluded Pi fractions.
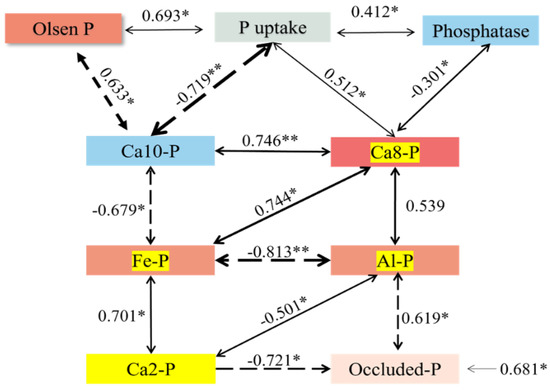
Figure 11.
Correlation coefficients between P uptake, Olsen, phosphatase activity, and P fractions show their direct and indirect relationship. A two-way arrow indicates a correlation between variables, and a one-way arrow indicates causation between variables. The line’s thickness shows the absolute size of the coefficient, and a thicker line means that the coefficient is higher. The solid and dotted lines indicate the positive and negative coefficients, respectively. The background square color depth suggests the availability of the inorganic phosphorus in various forms, and a redder color means that more is available. The * and ** symbols showing the significant (negative and positive) relationship among the variables.
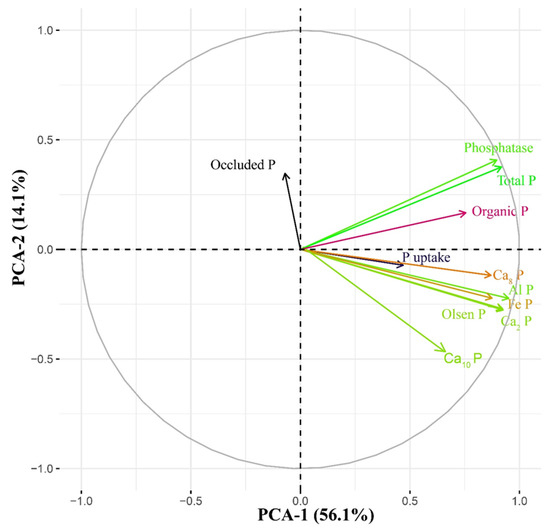
Figure 12.
PCA analysis showing the relationship between phosphatase, total-P, plant-uptake, and diverse phosphorus fractions.
We examined the direct and indirect relationship between Olsen P, phosphatase activity, and different phosphorus fractions (organic and inorganic). P fractions and uptake were directly affected by phosphatase activity, with an indirect impact on the active phosphorus pool and uptake. P intake directly impacted the available P fractions and had an indirect impact on unstable phosphorus and grain phosphorus uptake (Figure 12). Moreover, the phosphatase enzyme activity both directly and indirectly affected the apatite and all other fractions.
The different soils’ parent materials exhibited substantial differences in the P uptake and Pi fractions concentration with respect to the developmental stages. Our results indicated a positive association between Olsen P, P uptake, and various inorganic P fractions (Figure 12). This might be due to intensive cropping residue addition to the soil and the soil formation. Previous research found that parent materials such as loess and alluvium increase the available soil P, the total P, and the fixation of P [61]. In our study, the total and available Pi levels were higher in the loess and alluvium parent materials compared with the other parent materials, and there was a strong positive correlation between calcium-associated fractions with P uptake and Olsen P (Figure 12). The authors of [62] found that a soil Pi concentration of 5–10 mg kg−1 could be proper for crop development, while a concentration of less than 5 mg kg−1 might be lacking in P, though manipulating plant growth and Ca10-P (apatite P) can be changed into available forms under soil conditions. According to the previous literature, the concentration of accessible P should be above a critical threshold of 6 to 7 mg kg−1 for optimal P uptake [63]. In our findings, the loess soils had significantly higher total and accessible P contents when compared to other parent materials, indicating that P application to the different stages of development caused interactive effects on the soil’s available Pi concentrations. This could be due to weathering and biogeochemical processes, which increased the amount of accessible Pi while reducing the number of different P forms fixed in soils [64,65].
Research has shown that soil P fractions are primarily influenced by bio-geochemical characteristics, diverse microbial activity, management approaches, and fertilization [66]. Our study revealed that the P fraction concentrations in the loess parent material were significantly higher, but the positive approach in the alluvial parent material was considered. In terms of the increase in apatite P fractions, soil weathering increased the fixation of inorganic P-fractions while decreasing the fixation of other fractions, which is consistent with a previous study [17].
Our findings confirm prior research that found a linkage between P forms in soils and soil developmental stages [67,68]. In the early stages of development, soil P is mostly found as apatite, which decreases with weathering and increases during soil biotic and abiotic activities. P taken up by soil biota is released from the organic P reservoir after mineralization, and some of the released P is sorted on the secondary minerals' surface, resulting in non-occluded P [42,66].
4. Conclusions
We found that P fractions available in soils, phosphatase enzyme activity, and P uptake were influenced by the parent materials and the developmental stages. Phosphorus shares similarities with dicalcium phosphates, oxides of aluminum and iron, and adsorbed P, and organic P was found to be significantly correlated with P uptake in maize Phosphorus uptake increased in alluvial and loess soils, while P uptake was highest at both depths during the early stages of development. Phosphorus uptake remained unchanged according to soil development in sandstone, while it was lowest in shale-derived soils at an intermediate stage of development. Organic compounds, clay minerals, iron, carbonates, and aluminum oxides are all essential minerals that can affect the size of P fractions. Studying phosphatase enzyme activity in relation to P fractions, soil parent material, and soil development has proved very helpful for determining which P pools are more accessible to plants and the role of phosphatase in limiting phosphorus availability. The placement of soils in landscapes had a significant impact on soil P fractions.
Author Contributions
Conceptualization, M.M. and W.L. (Weidong Li); methodology, W.L. (Wenjie Liu); software, S.M.; validation, W.A., T.X., J.Y. and S.M.; formal analysis, J.W.; investigation, M.M.; resources, J.L.; data curation, M.M., W.A. and T.X.; writing—original draft preparation, M.M.; writing—review and editing, J.W.; visualization, W.L. (Weidong Li); supervision, W.L. (Weidong Li); project administration and funding acquisition, W.L. (Wenjie Liu). All authors have read and agreed to the published version of the manuscript.
Funding
Key R & D projects in Hainan Province (No. ZDYF2021XDNY185).
Institutional Review Board Statement
Not applicable.
Informed Consent Statement
Not applicable.
Data Availability Statement
Not applicable.
Conflicts of Interest
The authors declare no conflict of interest.
References
- Memon, M.; Akhtar, M.S.; Memon, K.S.; Stüben, D. Phosphorus forms in the indus river alluvial and loess, shale and limestone derived residual soils. Asian J. Chem. 2011, 23, 1952–1962. [Google Scholar]
- Cao, Y.; Sun, H.; Zhang, J.; Chen, G.; Zhu, H.; Zhou, S.; Xiao, H. Effects of wheat straw addition on dynamics and fate of nitrogen applied to paddy soils. Soil Tillage Res. 2018, 178, 92–98. [Google Scholar] [CrossRef]
- Hui, X.; Luo, L.; Wang, S.; Cao, H.; Huang, M.; Shi, M.; Malhi, S.S.; Wang, Z. Critical concentration of available soil phosphorus for grain yield and zinc nutrition of winter wheat in a zinc-deficient calcareous soil. Plant Soil 2019, 444, 315–330. [Google Scholar] [CrossRef]
- Mahmood, M.; Tian, Y.; Ma, Q.; Ahmed, W.; Mehmood, S.; Hui, X.; Wang, Z. Changes in Phosphorus Fractions and Its Availability Status in Relation to Long Term P Fertilization in Loess Plateau of China. Agronomy 2020, 10, 1818. [Google Scholar] [CrossRef]
- Nishigaki, T.; Tsujimoto, Y.; Rinasoa, S.; Rakotoson, T.; Andriamananjara, A.; Razafimbelo, T. Phosphorus uptake of rice plants is affected by phosphorus forms and physicochemical properties of tropical weathered soils. Plant Soil 2019, 435, 27–38. [Google Scholar] [CrossRef]
- Elrys, A.S.; Desoky, E.S.M.; Ali, A.; Zhang, J.b.; Cai, Z.c.; Cheng, Y. Sub-Saharan Africa’s food nitrogen and phosphorus footprints: A scenario analysis for 2050. Sci. Total Environ. 2021, 752, 141964. [Google Scholar] [CrossRef]
- Barrow, N.J.; Sen, A.; Roy, N.; Debnath, A. The soil phosphate fractionation fallacy. Plant Soil 2021, 459, 1–11. [Google Scholar] [CrossRef]
- Wan, J.; Yuan, X.; Han, L.; Ye, H.; Yang, X. Characteristics and distribution of organic phosphorus fractions in the surface sediments of the inflow rivers around hongze lake, China. Int. J. Environ. Res. Public Health 2020, 17, 648. [Google Scholar] [CrossRef]
- Braos, L.B.; da Cruz, M.C.P.; Ferreira, M.E.; Kuhnen, F. Frações do fósforo orgânico em solo adubado com esterco bovino. Rev. Bras. Cienc. Solo 2015, 39, 140–150. [Google Scholar] [CrossRef]
- Nishigaki, T.; Sugihara, S.; Kobayashi, K.; Hashimoto, Y.; Kilasara, M.; Tanaka, H.; Watanabe, T.; Funakawa, S. Fractionation of phosphorus in soils with different geological and soil physicochemical properties in southern Tanzania. Soil Sci. Plant Nutr. 2018, 64, 291–299. [Google Scholar] [CrossRef]
- Wang, Y.T.; Zhang, T.Q.; Zhao, Y.C.; Ciborowski, J.H.H.; Zhao, Y.M.; O’Halloran, I.P.; Qi, Z.M.; Tan, C.S. Characterization of sedimentary phosphorus in Lake Erie and on-site quantification of internal phosphorus loading. Water Res. 2021, 188, 116525. [Google Scholar] [CrossRef] [PubMed]
- Chen, S.; Cade-Menun, B.J.; Bainard, L.D.; St. Luce, M.; Hu, Y.; Chen, Q. The influence of long-term N and P fertilization on soil P forms and cycling in a wheat/fallow cropping system. Geoderma 2021, 404, 115274. [Google Scholar] [CrossRef]
- Wang, Z.; Sadras, V.O.; Hoogmoed, M.; Yang, X.; Huang, F.; Han, X.; Zhang, S. Shifts in nitrogen and phosphorus uptake and allocation in response to selection for yield in Chinese winter wheat. Crop Pasture Sci. 2017, 68, 807–816. [Google Scholar] [CrossRef]
- Soils.usda.gov. Exploring Soil Texture. UW-CMN For-Cllimate Fall 2011 Course; United States Department of Agriculture: Washington, DC, USA, 2011; Volume 5, pp. 7–10.
- Smeck, N.E.; Wilding, L.P. Quantitative evaluation of pedon formation in calcareous glacial deposits in Ohio. Geoderma 1980, 24, 1–16. [Google Scholar] [CrossRef]
- de Terra, H.; de Chardin, P.T. Observations on the Upper Siwalik Formation and Later Pleistocene Deposits in India. Proc. Am. Philos. Soc. 1936, 76, 791–822. [Google Scholar]
- Larssen, T.; Vogt, R.D.; Seip, H.M.; Furuberg, G.; Liao, B.; Xiao, J.; Xiong, J. Mechanisms for aluminum release in Chinese acid forest soils. Geoderma 1999, 91, 65–86. [Google Scholar] [CrossRef]
- Bossart, P.; Ottiger, R. Rocks of the Murree formation in northern Pakistan: Indicators of a descending foreland basin of late Paleocene to middle Eocene age. Eclogae Geol. Helv. 1989, 82, 133–165. [Google Scholar]
- Nannipieri, P.; Giagnoni, L.; Landi, L.; Renella, G. Role of Phosphatase Enzymes in Soil; Springer: Berlin/Heidelberg, Germany, 2011; pp. 215–243. [Google Scholar]
- Jiang, B.; Gu, Y. A suggested fractionation scheme of inorganic phosphorus in calcareous soils. Fertil. Res. 1989, 20, 159–165. [Google Scholar] [CrossRef]
- Eivazi, F.; Tabatabai, M.A. Phosphatases in soils. Soil Biol. Biochem. 1977, 9, 167–172. [Google Scholar] [CrossRef]
- Anderson, J.M.; Ingram, J.S.I. Tropical Soil Biology and Fertility: A Handbook of Methods, 2nd ed.; C.A.B. International: Wallingford, UK, 1993. [Google Scholar]
- Mahmood, M.; Tian, Y.; Ma, Q.; Hui, X.; Elrys, A.S.; Ahmed, W.; Mehmood, S.; Wang, Z. Changes in phosphorus fractions in response to long-term nitrogen fertilization in loess plateau of China. Field Crop. Res. 2021, 270, 108207. [Google Scholar] [CrossRef]
- Nunes, R.d.S.; de Sousa, D.M.G.; Goedert, W.J.; de Oliveira, L.E.Z.; Pavinato, P.S.; Pinheiro, T.D. Distribution of Soil Phosphorus Fractions as a Function of Long-Term Soil Tillage and Phosphate Fertilization Management. Front. Earth Sci. 2020, 8, 350. [Google Scholar] [CrossRef]
- Adhami, E.; Owliaie, H.R.; Molavi, R.; Rezaei Rashti, M.; Esfandbod, M. Effects of soil properties on phosphorus fractions in subtropical soils of Iran. J. Soil Sci. Plant Nutr. 2013, 13, 11–21. [Google Scholar] [CrossRef]
- Naeem, I.; Masood, N.; Turan, V.; Iqbal, M. Prospective usage of magnesium potassium phosphate cement combined with Bougainvillea alba derived biochar to reduce Pb bioavailability in soil and its uptake by Spinacia oleracea L. Ecotoxicol. Environ. Saf. 2021, 208, 111723. [Google Scholar] [CrossRef] [PubMed]
- Cai, A.; Zhang, W.; Xu, M.; Wang, B.; Wen, S.; Shah, S.A.A. Soil fertility and crop yield after manure addition to acidic soils in South China. Nutr. Cycl. Agroecosyst. 2018, 111, 61–72. [Google Scholar] [CrossRef]
- Vitousek, P.M.; Porder, S.; Houlton, B.Z.; Chadwick, O.A. Terrestrial phosphorus limitation: Mechanisms, implications, and nitrogen-phosphorus interactions. Ecol. Appl. 2010, 20, 5–15. [Google Scholar] [CrossRef]
- Memon, M.; Jamro, G.M.; Memon, N.U.N.; Memon, K.S.; Akhtar, M.S. Micronutrient availability assessment of tomato grown in Taluka Badin, Sindh. Pak. J. Bot. 2012, 44, 649–654. [Google Scholar]
- Chen, H.; Chen, M.; Li, D.; Mao, Q.; Zhang, W.; Mo, J. Responses of soil phosphorus availability to nitrogen addition in a legume and a non-legume plantation. Geoderma 2018, 322, 12–18. [Google Scholar] [CrossRef]
- Mehmood, A.; Akhtar, M.S.; Imran, M.; Rukh, S. Soil apatite loss rate across different parent materials. Geoderma 2018, 310, 218–229. [Google Scholar] [CrossRef]
- Akhtar, M.S.; Imran, M.; Mehmood, A.; Memon, M.; Rukh, S.; Kiani, G.S. Apatite Loss in Pothwar Loess Plain (Pakistan) Fits a Simple Linear Reservoir Model. Pedosphere 2014, 24, 763–775. [Google Scholar] [CrossRef]
- Conservation, W.; Sciences, F.; Mehr, P.; Shah, A. Relationship of Parent Material and Soil Genesis with Apatite and Phosphorus Availability in Rainfed Region. Ph.D. Thesis, PMAS-Arid Agriculture University Rawalpindi, Rawalpindi, Pakistan, 2014. [Google Scholar]
- Ahmed, W.; Kailou, L.; Qaswar, M.; Jing, H.; Qinghai, H.; Yongmei, X.; Ali, S.; Mehmood, S.; Ammar Asghar, R.M.; Mahmood, M.; et al. Long-term mineral fertilization improved the grain yield and phosphorus use efficiency by changing soil P fractions in ferralic Cambisol. Agronomy 2019, 9, 784. [Google Scholar] [CrossRef]
- Dai, J.; Wang, Z.; Li, F.; He, G.; Wang, S.; Li, Q.; Cao, H.; Luo, L.; Zan, Y.; Meng, X.; et al. Optimizing nitrogen input by balancing winter wheat yield and residual nitrate-N in soil in a long-term dryland field experiment in the Loess Plateau of China. Field Crop. Res. 2015, 181, 32–41. [Google Scholar] [CrossRef]
- Samadi, A.; Gilkes, R.J. Phosphorus Transformations and Their Relationships with Calcareous Soil Properties of Southern Western Australia. Soil Sci. Soc. Am. J. 1999, 63, 809–815. [Google Scholar] [CrossRef]
- Guo, F.; Yost, R.S.; Hue, N.V.; Evensen, C.I.; Silva, J.A. East under Intensive Plant Growth; Beck and Sanchez: Malaga, Spain, 1993; Volume 64. [Google Scholar]
- Zhu, X.; Zhao, X.; Lin, Q.; Alamus; Wang, H.; Liu, H.; Wei, W.; Sun, X.; Li, Y.; Li, G. Distribution Characteristics of Soil Organic Phosphorus Fractions in the Inner Mongolia Steppe. J. Soil Sci. Plant Nutr. 2020, 20, 2394–2405. [Google Scholar] [CrossRef]
- Wang, X.; Zhou, J.; Wu, Y.; Bol, R.; Wu, Y.; Sun, H.; Bing, H. Fine sediment particle microscopic characteristics, bioavailable phosphorus and environmental effects in the world largest reservoir. Environ. Pollut. 2020, 265, 114917. [Google Scholar] [CrossRef]
- Mehmood, A.; Akhtar, M.; Khan, K.; Khalid, A.; Imran, M.; Rukh, S. Relationship of Phosphorus Uptake with Its Fractions in Different Soil Parent Materials. Int. J. Plant Soil Sci. 2015, 4, 45–53. [Google Scholar] [CrossRef]
- Sommers, L.E.; Harris, R.F.; Williams, J.D.H.; Armstrong, D.E.; Syers, J.K. Determination of Total Organic Phosphorus in Lake Sediments. Limnol. Oceanogr. 1970, 15, 301–303. [Google Scholar] [CrossRef]
- Selles, F.; Campbell, C.A.; Zentner, R.P.; Curtin, D.; James, D.C.; Basnyat, P. Phosphorus use efficiency and long-term trends in soil available phosphorus in wheat production systems with and without nitrogen fertilizer. Can. J. Soil Sci. 2011, 91, 39–52. [Google Scholar] [CrossRef]
- Gómez, B.O. Television to the rescue of romantic comedy: “Sex and the City’s” revitalisation of the genre at the turn of the millennium. Int. J. Interdiscip. Soc. Sci. 2011, 5, 127–138. [Google Scholar] [CrossRef]
- Vu, D.T.; Tang, C.; Armstrong, R.D. Transformations and availability of phosphorus in three contrasting soil types from native and farming systems: A study using fractionation and isotopic labeling techniques. J. Soils Sediments 2010, 10, 18–29. [Google Scholar] [CrossRef]
- Audette, Y.; O’Halloran, I.P.; Paul Voroney, R. Kinetics of phosphorus forms applied as inorganic and organic amendments to a calcareous soil. Geoderma 2016, 262, 119–124. [Google Scholar] [CrossRef]
- Audette, Y.; O’Halloran, I.P.; Evans, L.J.; Voroney, R.P. Preliminary validation of a sequential fractionation method to study phosphorus chemistry in a calcareous soil. Chemosphere 2016, 152, 369–375. [Google Scholar] [CrossRef] [PubMed]
- Wang, Y.; Shen, Z.; Zhang, Z. Phosphorus Speciation and Nutrient Stoichiometry in the Soil-Plant System During Primary Ecological Restoration of Copper Mine Tailings. Pedosphere 2018, 28, 530–541. [Google Scholar] [CrossRef]
- Guo, S.L.; Dang, T.H.; Hao, M. De Phosphorus Changes and Sorption Characteristics in a Calcareous Soil Under Long-Term Fertilization1 1 Project supported by the National Basic Research Program of China (No. 2005CB121102), the Knowledge Innovation Program of the Chinese Academy of Sciences. Pedosphere 2008, 18, 248–256. [Google Scholar] [CrossRef]
- Kul, R.; Arjumend, T.; Ekinci, M.; Yildirim, E.; Turan, M.; Argin, S. Biochar as an organic soil conditioner for mitigating salinity stress in tomato. Soil Sci. Plant Nutr. 2021, 67, 693–706. [Google Scholar] [CrossRef]
- Medinski, T.; Freese, D.; Reitz, T. Changes in soil phosphorus balance and phosphorus-use efficiency under long-term fertilization conducted on agriculturally used chernozem in germany. Can. J. Soil Sci. 2018, 98, 650–662. [Google Scholar] [CrossRef]
- Metson, G.S.; Lin, J.; Harrison, J.A.; Compton, J.E. Linking terrestrial phosphorus inputs to riverine export across the United States. Water Res. 2017, 124, 177–191. [Google Scholar] [CrossRef]
- Shi, L.L.; Shen, M.X.; Lu, C.Y.; Wang, H.H.; Zhou, X.W.; Jin, M.J.; Wu, T.D. Soil phosphorus dynamic, balance and critical P values in long-term fertilization experiment in Taihu Lake region, China. J. Integr. Agric. 2015, 14, 2446–2455. [Google Scholar] [CrossRef]
- Khan, K.S.; Joergensen, R.G. Changes in microbial biomass and P fractions in biogenic household waste compost amended with inorganic P fertilizers. Bioresour. Technol. 2009, 100, 303–309. [Google Scholar] [CrossRef]
- Beck, M.A.; Sanchez, P.A. Soil Phosphorus Fraction Dynamics during 18 Years of Cultivation on a Typic Paleudult. Soil Sci. Soc. Am. J. 1994, 58, 1424–1431. [Google Scholar] [CrossRef]
- Klammsteiner, T.; Turan, V.; Juárez, M.F.D.; Oberegger, S.; Insam, H. Suitability of black soldier fly frass as soil amendment and implication for organic waste hygienization. Agronomy 2020, 10, 1578. [Google Scholar] [CrossRef]
- Mao, X.; Xu, X.; Lu, K.; Gielen, G.; Luo, J.; He, L.; Donnison, A.; Xu, Z.; Xu, J.; Yang, W.; et al. Effect of 17 years of organic and inorganic fertilizer applications on soil phosphorus dynamics in a rice–wheat rotation cropping system in eastern China. J. Soils Sediments 2015, 15, 1889–1899. [Google Scholar] [CrossRef]
- Zhang, M.K.; He, Z.L.; Calvert, D.V.; Stoffella, P.J.; Yang, X.E.; Li, Y.C. Phosphorus and Heavy Metal Attachment and Release in Sandy Soil Aggregate Fractions. Soil Sci. Soc. Am. J. 2003, 67, 1158–1167. [Google Scholar] [CrossRef]
- Bravo, C.; Torrent, J.; Giráldez, J.V.; González, P.; Ordóñez, R. Long-term effect of tillage on phosphorus forms and sorption in a Vertisol of southern Spain. Eur. J. Agron. 2006, 25, 264–269. [Google Scholar] [CrossRef]
- Laboski, C.A.M.; Lamb, J.A. Impact of manure application on soil phosphorus sorption characteristics and subsequent water quality implications. Soil Sci. 2004, 169, 440–448. [Google Scholar] [CrossRef]
- Meason, D.F.; Idol, T.W.; Friday, J.B.; Scowcroft, P.G. Effects of fertilisation on phosphorus pools in the volcanic soil of a managed tropical forest. For. Ecol. Manag. 2009, 258, 2199–2206. [Google Scholar] [CrossRef]
- Hinsinger, P. Bioavailability of soil inorganic P in the rhizosphere as affected by root-induced chemical changes: A review. Plant Soil 2001, 237, 173–195. [Google Scholar] [CrossRef]
- Blake, L.; Mercik, S.; Koerschens, M.; Moskal, S.; Poulton, P.R.; Goulding, K.W.T.; Weigel, A.; Powlson, D.S. Phosphorus content in soil, uptake by plants and balance in three European long-term field experiments. Nutr. Cycl. Agroecosyst. 2000, 56, 263–275. [Google Scholar] [CrossRef]
- Redel, Y.; Staunton, S.; Durán, P.; Gianfreda, L.; Rumpel, C.; de la Luz Mora, M. Fertilizer P Uptake Determined by Soil P Fractionation and Phosphatase Activity. J. Soil Sci. Plant Nutr. 2019, 19, 166–174. [Google Scholar] [CrossRef]
- Udvardi, M.; Below, F.E.; Castellano, M.J.; Eagle, A.J.; Giller, K.E.; Ladha, J.K.; Liu, X.; Maaz, T.M.C.; Nova-Franco, B.; Raghuram, N.; et al. A Research Road Map for Responsible Use of Agricultural Nitrogen. Front. Sustain. Food Syst. 2021, 5, 660155. [Google Scholar] [CrossRef]
- Liu, C.A.; Li, F.R.; Liu, C.C.; Zhang, R.H.; Zhou, L.M.; Jia, Y.; Gao, W.J.; Li, J.T.; Ma, Q.f.; Siddique, K.H.M.; et al. Yield-increase effects via improving soil phosphorus availability by applying K2SO4 fertilizer in calcareous-alkaline soils in a semi-arid agroecosystem. Field Crop. Res. 2013, 144, 69–76. [Google Scholar] [CrossRef]
- Fan, Y.; Zhong, X.; Lin, F.; Liu, C.; Yang, L.; Wang, M.; Chen, G.; Chen, Y.; Yang, Y. Responses of soil phosphorus fractions after nitrogen addition in a subtropical forest ecosystem: Insights from decreased Fe and Al oxides and increased plant roots. Geoderma 2019, 337, 246–255. [Google Scholar] [CrossRef]
- Tiecher, T.; dos Santos, D.R.; Calegari, A. Soil organic phosphorus forms under different soil management systems and winter crops, in a long term experiment. Soil Till. Res. 2012, 124, 57–67. [Google Scholar] [CrossRef]
- Turner, B.L.; Paph´azy, M.J.; Haygarth, P.M.; Mckelvie, I.D. Inositol phosphates in the environment. Philos. Trans. R Soc. Lond. B 2002, 357, 449–469. [Google Scholar] [CrossRef] [PubMed]
Publisher’s Note: MDPI stays neutral with regard to jurisdictional claims in published maps and institutional affiliations. |
© 2022 by the authors. Licensee MDPI, Basel, Switzerland. This article is an open access article distributed under the terms and conditions of the Creative Commons Attribution (CC BY) license (https://creativecommons.org/licenses/by/4.0/).