Article

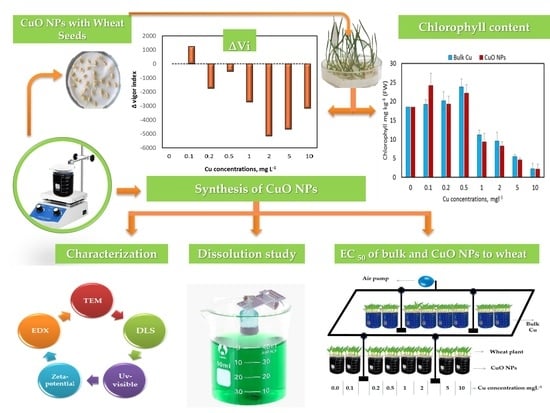
Toxicity and Uptake of CuO Nanoparticles: Evaluation of an Emerging Nanofertilizer on Wheat (Triticum aestivum L.) Plant

1
Department of Environmental Studies, Institute of Graduate Studies and Research, Alexandria University, Alexandria 21526, Egypt
2
Chemistry Department, Faculty of Science, Al-Azhar University, Assiut 71524, Egypt
3
Department of Environmental Science and Technology, University of Maryland, College Park, MD 20742, USA
4
Department of Soils and Water, Faculty of Environmental Agricultural Sciences, Arish University, El-Arish 45516, Egypt
*
Author to whom correspondence should be addressed.
Sustainability 2022, 14(9), 4914; https://doi.org/10.3390/su14094914
Submission received: 1 April 2022 / Revised: 13 April 2022 / Accepted: 15 April 2022 / Published: 19 April 2022

Abstract

:
Wet chemistry was used to produce copper oxide nanoparticles (CuO NPs). The results indicated that most nanoparticles were bacillus-shaped and relatively uniform in size (less than 30 nm). The effect of synthesized CuO NPs on wheat (Triticum aestivum L.) germination and growth parameters was studied and compared to bulk Cu. The results showed that no significant difference was obtained in germination rate among all treatments. Bulk Cu additions significantly affect the mean germination rate and mean germination time. On the contrary, germinability was significantly affected by CuO NPs additions. Seed vigor index was calculated to demonstrate the superior treatment in wheat germination parameters, and the results confirmed that 0.1 mg L−1 of CuO NPs could be successfully used to improve wheat seed germination. Moreover, the general average Cu concentrations in the plant tissue were 139 and 103 mg kg−1 dry weight for bulk and CuO NPs, respectively, indicating the dissolution behavior of CuO NPs. The addition of CuO NPs (0.1 mg L−1) promotes chlorophyll formation equal to 0.5 mg L−1 of the bulk Cu addition. This means using nanoparticles as fertilizer could reduce 80% of traditional fertilizers. Nonetheless, Cu additions in both forms (NPs and bulk) reduce root growth substantially compared to control. The effective toxic dose (EC50) for bulk Cu and CuO NPs was 0.37 mg L−1 and 0.94 mg L−1, respectively. The results indicated that approximately 2.5 times CuO NPs concentration is equal to the toxicity dose of bulk Cu due to lowered CuO NPs dissolution. Our study showed that Cu phytotoxicity is a non-nanosized effect and showed that plant-induced changes under environmentally real conditions should be considered when measuring the dissolution of CuO NPs near wheat plant roots. This study implies that using nano-CuO as a micronutrient amendment has a potential benefit rather than the soluble Cu salt for plant growth.

Graphical Abstract

1. Introduction

Nanotechnology is the science of manipulating materials at the nanoscale, which have potential new benefits [1,2,3,4]. Due to their unique characteristics, nanoparticles (NPs) have recently received great attention [5,6,7]. NPs have a high specific surface area, small size, defined shape, surface functionality, and high porosity [3,8,9,10]. Because of the reliance on plants’ cell wall pores, NPs’ size, shape, surface area, and size distribution play an essential role in determining their uptake by plants [11,12,13]. NPs have the potential to improve food and farming systems, which was supported by extensive research using various methodologies. This results increased agricultural production and new foods and products [14,15,16,17,18,19]. Furthermore, nanotechnology provides environmentally friendly fertilizers, safe plant protection using nanoformulation, and plant disease control using nanosensors. Therefore, food sustainability for the population could be achieved [20,21,22]. Due to the limitations of the traditional or chemical fertilizers, such as low efficiency of nutrient use by plants, high nutrient losses to groundwater, lower bioavailability due to large particle size, and lower solubility resulting in several negative impacts on the agroecosystem, nanofertilizers became preferable [23,24]. In addition, the high release of nutrients can lead to toxicity and ecological problems in the soil and environment [25].
NPs size plays a crucial role in slowly released fertilizers. Due to the slow release of supplements during crop production, these slow-release nanofertilizers can be a great alternative to soluble inorganic fertilizers [26]. Thus, plants could absorb most of their nutrient requirements without loss. In addition, nanofertilizers being can hold out the abiotic stress tolerance. Nanosilicon was proven to be more effective and efficient in alleviating salinity stress [27]. Moreover, NPs are more effective at controlling nutrient release as the NPs’ surface tension on the surface of fertilizer particles is higher than that of conventional fertilizer particles [28].
Metallic NPs offer a wide range of applications and have much potential in nanotechnology. Consequently, it is essential to understand these NPs’ environmental fate and long-term impacts. Plants can absorb metal NPs in different ways. There are two ways to enter the plant’s system: nanoparticles (NPs) or oxidized metal ions in soil solution, which are then reduced in the plant system [29,30,31]. The hydrophobicity or hydrophilicity of NPs affects their interaction with plant cell membranes. Hydrophilic NPs tend to adsorb on bilayer membrane surfaces, allowing them to bind to intracellular vesicles, whereas hydrophobic nanomaterials can implant into the membrane’s hydrophobic core without causing harm or leakage [32,33,34].
Different reducing agents such as glacial acetic acid and aniline were used to reduce copper ions in an aqueous solution [35,36]. The reducing agents lead to the formation of metallic copper, followed by agglomeration into oligomeric clusters. Finally, these clusters lead to the formation of metallic copper nanoparticles.
In plants, copper (Cu) is a micronutrient necessary for the protein components of enzymes. Photosynthetic electron transport, mitochondrial respiration (OMR), oxidative stress response (OSR), cell wall metabolism (CM), and hormone signaling all rely on Cu as a structural metal [37,38]. In addition, Cu is an essential transition element involved in many physiological activities.
A wide variety of enzymes, including Cu/Zn superoxide dismutase, cytochrome-c oxidase, amino oxidase, laccase, plastocyanin, and polyphenol oxidase, require copper ions as cofactors for their proper function. Additionally, Cu is involved in the signaling of transcription and protein transport machinery and oxidative phosphorylation and iron mobilization at the cellular level [39]. Cu is thus a necessary micronutrient for optimal plant growth and development. Plants produce various deficiency symptoms in deficient situations, most of which harm young leaves and reproductive organs. Cu’s inherent toxicity is due to its redox characteristics, making it a vital element [37,38].
High concentrations of Cu ions are redox-active, which can lead to many undesirable effects, including the generation of OSRs via the Fenton or Haber–Weiss reactions, chlorosis, necrosis, stunting, and root death, as well as enzyme inhibition and protein dysfunction due to interactions with the sulfhydryl groups of proteins [40,41].
Cu can disrupt plant growth and development by interfering with key physiological processes in either deficiency or excess. Photosynthetic electron transport is disrupted under both Cu deficiency and excess Cu conditions. In order to maintain healthy plant growth and development, Cu must be extracted from the soil, transported throughout the plant, distributed, and compartmentalized in various tissues, and its levels in various cells and organelles must be meticulously controlled [42].
Previous studies showed that plant-mediated CuO NPs are relatively safe on normal human cell lines with different particle sizes; 32 nm [43], 10–30 nm [44], and 20–50 nm [45]. It was reported that the human body could already digest Cu NPs [46]. Rhode et al. [47] investigated the toxicity levels between Cu NPs, CuO NPs, and soluble Cu salts in the leukemia cell line HL60. The study showed that Cu NPs induced higher toxicity compared to the other two. Cu NPs released more ionic copper than CuO NPs and concluded that the higher toxicity was attributed to nanoparticles and Cu ions. For example, the root rhizosphere of wheat plants reduces the dissolution rate of CuO NPs added to the soil, reducing the nano-toxic effects of CuO on the plant [48]. Ultimately, however, understanding the fate, transport, reactivity, and risks associated with manufactured NPs released into the environment should be considered. Therefore, there is an urgent need to investigate the ecotoxicological effects of nanoparticles and the intrinsic and extrinsic factors (size, chemical composition, shape, angle of curvature, crystal structure, surface roughness, hydrophobicity, etc.) that are responsible for the toxicity of nanoparticles [49]. It was found that the smaller the size of nanoparticles, the more toxic they are in nature [50]. Therefore, it could be speculated that nanoparticles have multiple adverse effects on the environment [51].
For this purpose, there is a need for developing novel applications such as nanosize Cu to correct its addition to plants after evaluating its effect on plant growth. Therefore, the objectives of this study were to: (i) synthesize and characterize CuO NPs using different analytical techniques; (ii) determine the dissolution behavior of manufactured CuO NPs; (iii) assess wheat seed germination and early root growth rate as affected by different concentrations of CuO NPs; and (iv) determine the toxicity of CuO NPs on the wheat root elongation rate. The effect of CuO NPs on the wheat plant was compared with bulk Cu derived from CuSO4 salt.

2. Materials and Methods

2.1. Synthesize and Characterize Copper Oxide Nanoparticles

Copper chloride (CuCl2.2H2O) was used as a precursor to synthesize CuO NPs using wet chemistry based on the method described by Misra et al. [35]. After dissolving 0.02 M CuCl2.2H2O in 150 mL of water, 500 mL of glacial acetic acid (99.7%) was added. After the solution was heated to 100 °C for 10 min, 0.6 g NaOH was added quickly. In order to obtain a pure phase of CuO NPs, a black precipitate was formed, which was centrifuged and repeatedly washed with water. The synthesized CuO NPs were washed several times with distilled water before further characterization. Transmission electron microscopy (TEM) (JEOL JEM-1000 cx, Japan) imaging was performed using a diluted suspension of NPs after sonication on a carbon-coated copper grid. The hydrodynamic size and zeta potential of the NPs were measured using DLS Malvern Nano Zs Instruments, UK. The reduction of copper chloride to copper oxide was examined using the UV-Visible spectrum of the reaction mixture using Hitachi U-3900 [52]. Energy dispersive x-ray spectroscopy (EDX) was used to validate the presence of elemental content. The EDX observations were undertaken by an instrument coupled with a scanning electron microscope (SEM) operated at an accelerated voltage of 130 kV (Hitachi-S 3400N). The stock concentration of the CuO NPs was measured by the acidification process using ICP-AES (Agilent Instruments). Briefly, 1 mL of CuO NPs suspended solution was mixed with 3 mL of HNO3, and the mixture was digested according to a procedure reported elsewhere [53].

2.2. Stability and Copper Release Studies

This study aimed to show the dissolution characterization of synthesized CuO NPs. A dissolution study was performed as described by Misra et al. [35]. Ten mL of CuO NPs suspension (in water) was placed in dialysis bags (MWCO = 13.5kDa), and 200 mL of Ca(NO3)2 (pH = 7) was added to each of the 250 mL plastic bottles (Nalgene) used for the dissolving investigation. At 1000 mg L−1, it was put in the dialysis bag for the dissolution experiment to begin. It was necessary to incorporate appropriate blanks as part of the experimental design to prevent any contamination from chemicals or containers. Temperature and rotation were maintained at 25 °C and 200 rpm throughout the duration of the experiment. Aliquots were obtained from outside the dialysis bag and acidified with 5% HNO3 before ICP-MS determined the Cu concentration at regular intervals (0.5 to 98 h). Briefly, Cu concentrations were measured by using QQQ-ICP-MS (Agilent 880, Tokyo, Japan) in a collision/reaction (ORS) cell, which allows for the targeted removal of polyatomic interferences [54]. Samples were introduced in one batch from an autosampler through a glass nebulizer (1 mL min−1) and cooled spray chamber (3 °C). Internal standards introduced to the sample stream via a T-piece included Sc (50 µg L−1), Rh (10 µg L−1), and Ir (5 µg L−1) in 2% TAG HNO3. External Cu calibration standards (Claritas-PPT grade CLMS-2, Certiprep) in the concentration range 0.00–100 µg L−1. Three procedural blanks and house-made reference samples were included for accuracy check and quality assurance.

2.3. Wheat Seed Germination and Root Growth Experiment

2.3.1. Wheat Seed Germination

Triticum aestivum L. (local cultivar of Egyptian Wheat) was obtained from Agricultural Research Center, Egypt (Pedigree—origin: Ald“S”/Huac“S”//CMH74A.630/5 × CGM4583-5GM—1GM-0GM—Egypt) and used to study the role of CuO NPs on germination and growth parameters. In order to study the influence of CuO NPs on seed germination, thirty sterile (15 min in 0.2% chlorex) wheat seeds were sown in Petri dishes (8.5 cm diameter) on sheets of filter paper moistened with distilled water according to the design described by Morrison and Morris [55] and soaked with different concentrations of Cu forms for bulk (derived from CuSO4) and NPs (0.1, 0.2, 0.5, 1.0, 2.0, 5.0 and 10 mg L−1) for 72 h and 7 days for germination and plant characteristics, respectively. In order to test the impact of NPs treatments on seed germination, distilled water was utilized as a control. Based on the water holding capacity of the filter paper, 10 mL of water was added to the paper. Petri dishes were utilized as a model. All Petri dishes were incubated at room temperature for germination and growth characterization for the appropriate period with lids on. Microsoft Excel 2016 was used to determine germinability (G), the time it takes to germinate (t), the coefficient of variation in that period (CVt), and the average rate at which the seed germinates (v). Procedures for calculating the germination measurements were explained in detail with a spreadsheet template to be used and reproduced by other researchers elsewhere [56].

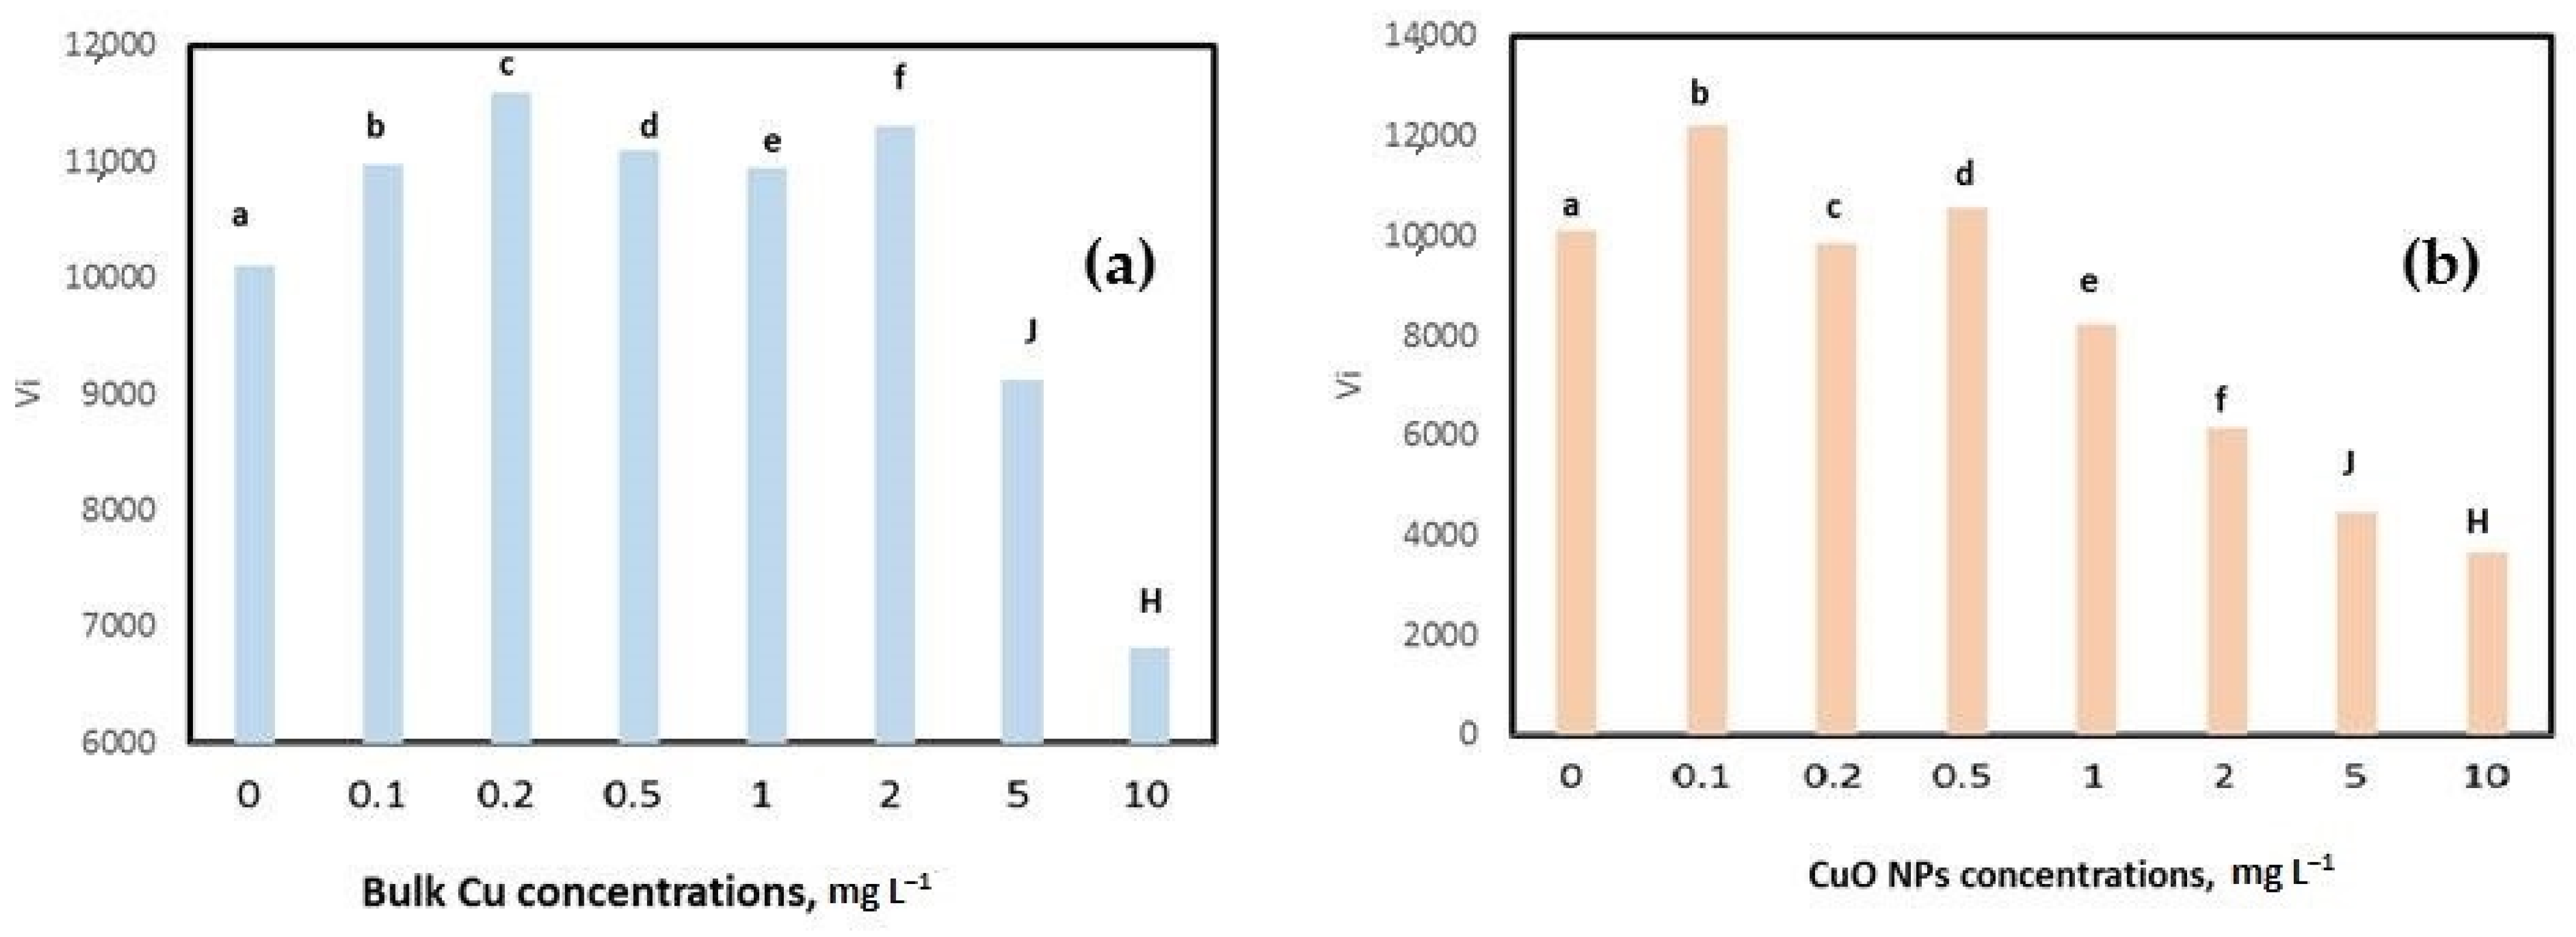
2.3.2. Root Elongation Rate of Wheat and Toxicity Dose of Copper Forms

Wheat seeds were germinated in paper towel rolls placed vertically in tap water for 3 days. Four seedlings were placed in 2 mm diameter holes in 10 mm wide Perspex strips placed on the top of a plastic beaker (Polyethylene terephthalate PET) filled with 400 mL solution of 1.0 mM CaCl2 and 5.0 mM H3BO3. The beakers were brought to room temperature, and the seedlings were grown in this basal solution for 24 h. The strips were then transferred to nano-containing solutions for an exposure period (typically 24 h). The experimental work was carried out as described by Kopittke et al. [57]. Different CuO NPs and bulk Cu concentrations were used (0.0, 0.1, 0.2, 0.5, 1.0, 2.0, 5.0 and 10 mg L−1). These concentrations were chosen to cover a wide range of Cu levels. Immediately after transferring the strips and at set times up until 24 h after that, each Perspex strip was placed horizontally 300 mm beneath a digital camera (Sony DLSAR A2, Japan) mounted on a tripod. A digital image was captured, and the strips were replaced on the beaker. This took ca. 30 s, ensuring minimal disruption to root growth. The length of each root was determined using the imageJ processing and analysis software available free of charge at https://imagej.net/Welcome (accessed on 31 March 2022) [58]. After recording the plant root length at 0 and 24 hr, root elongation rate (RER, mm h−1) was calculated as follows:
RER = (Rt − R0)/T
where R0 and Rt are the length (mm) of each root at zero and growth time (typically 24 h), and T is the growth time (24 h).
The toxicity model was computed as a log-logistic model using the MS Excel 2016 solver for root elongation rate (RER) affected by NPs and bulk Cu concentrations. The residual standard deviation (RSD) and correlation coefficient evaluated model performance [59]. The toxicity dose was determined as the EC50 value expressed by Ritz et al. [60]. The log-logistic models are considered to be the most commonly used dose–response models [61] that can calculate EC50 as follows:
Y o 1 + exp ( e   ( log ( x ) log (   m ) ) )
where Yo, e, and m are the equation coefficient values, m is denoted as EC50, and x is Cu concentrations added to the wheat plant (mg L−1) from bulk Cu and CuO NPs.

2.4. Plant Characteristics

The fresh weight was determined immediately using a digital scale, but the dry weight was determined following an overnight oven drying at 60 °C (after 7 days from sowing). Oven-dried plant samples were milled (Retsch ZM 200 Centrifugal Mill, UK), and approximately 100 mg subsamples were digested with 6.0 mL TAG HNO3 (Trace Analysis Grade) in pressurized PFA containers with microwave heating (Anton Paar “Multivalve”, UK equipped with 48-place carousel) for 15 min at 1400 W according to the method described by Nabulo et al. [62]. The acidified digestates were then syringe filtered (0.22 µm) and analyzed for Cu content using ICP-MS (x-Series ll, Thermo Fisher Scientific, Germany) [63]. Total chlorophyll content was measured in fresh leaf tissues hatched in 5 mL of DMSO (Dimethyl Sulfoxide) for 2.3 h at 50 °C as described by Liu et al. [64] and expressed in mg per gram fresh weight as follows:
Total chlorophyll = [20.2 (A645) + 8.02 (A663)] × 1000 × W × V
where A is the absorbance at the corresponding wavelength (645 and 663 nm, UV-vis spectrophotometer (ELICO, 159)), V is the volume of extract used (mL), W is the weight of the plant sample used (g).

2.5. Statistical Analysis

The mean of triplicates ± standard deviation (SD) was presented. Parried t-test and Pearson correlation were tested if necessary. Moreover, compare 95% confidence intervals using Tukey’s test with ANOVA analysis using Minitab ® statistical software V. 17.1.0.

3. Results and Discussion

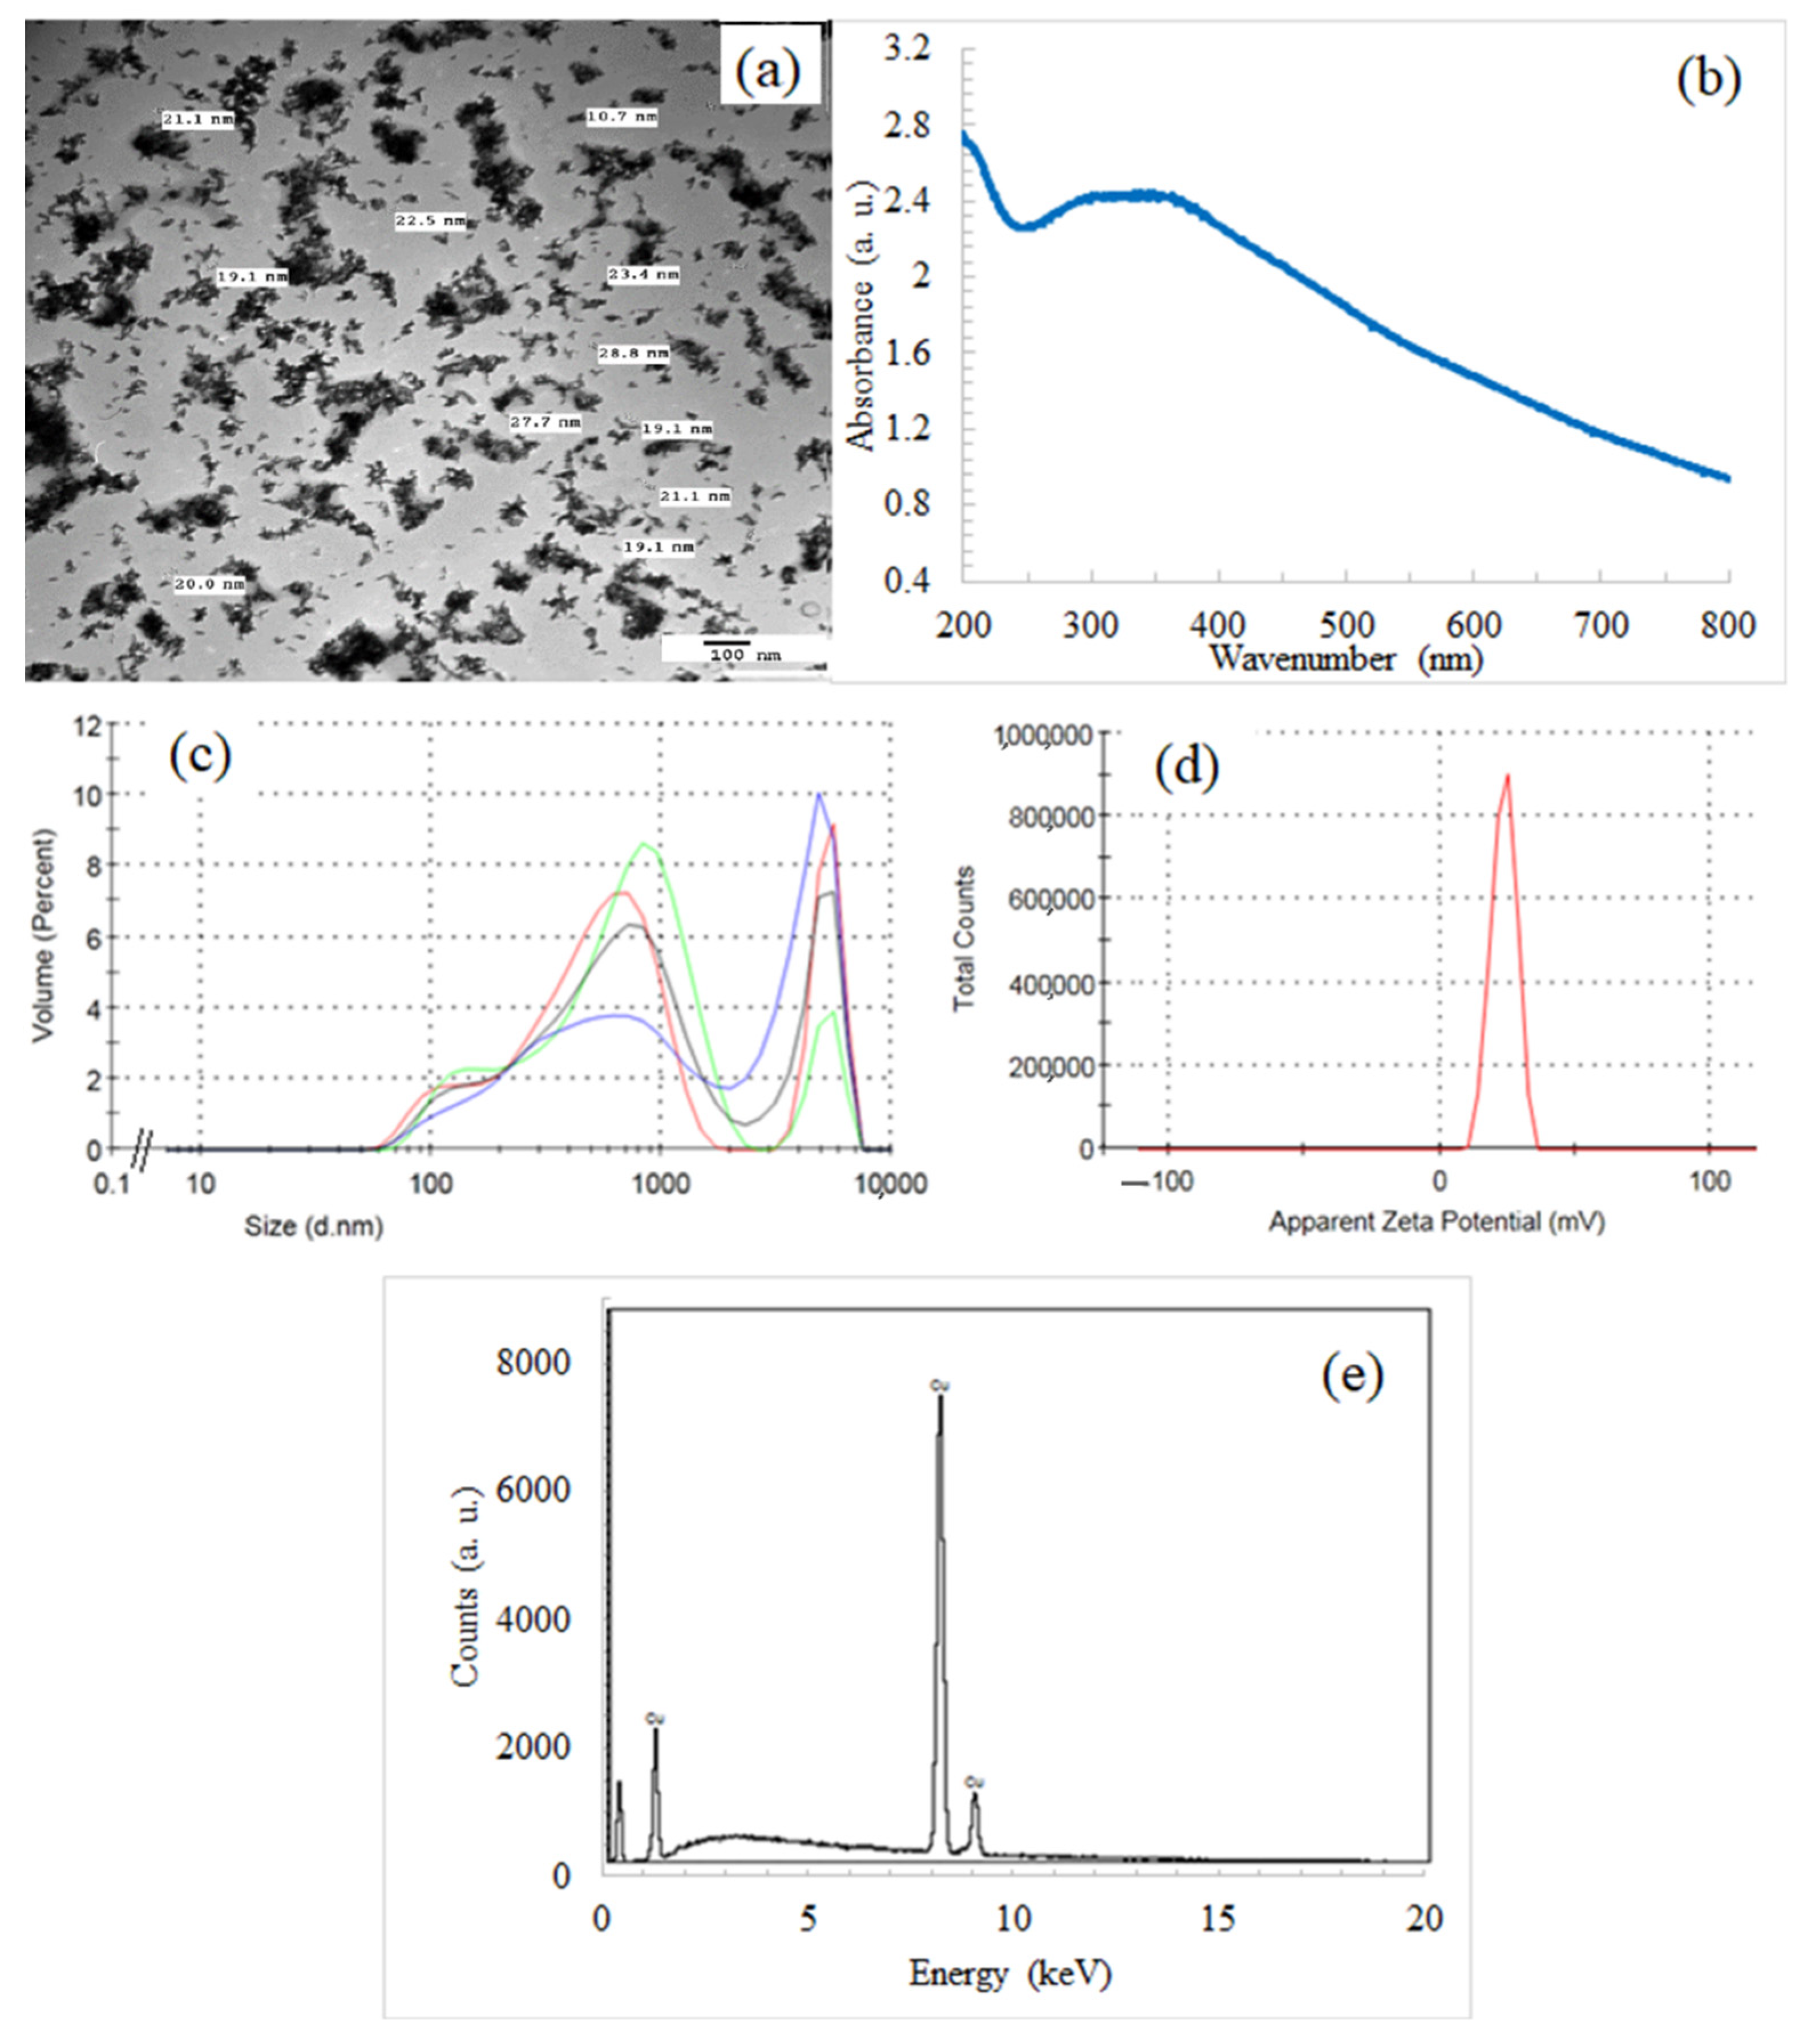
3.1. Characterization of CuO NPs

The CuO NPs were synthesized using copper chloride as a precursor. It is a suitable chemical species for synthesizing CuO NPs and allows the synthesis procedure to control the shape of the NPs produced. The TEM image (Figure 1a) shows that the bacillus formed nano-shape was less than 30 nm in size. This result indicates relatively uniform CuO NPs in size. In addition, CuO NPs for oxide form were confirmed using the UV-vis technique. Figure 1b shows the UV–V is absorption spectrum of CuO NPs. The absorption spectrum was recorded for the sample at 200–800 nm. The spectrum showed the absorbance peak at around 330 nm, corresponding to the characteristic band of copper oxide nanoparticles. The hydrodynamic size of CuO NPs measured by dynamic light scattering (DLS) was 294.3 ± 23.4 nm, and the polydispersity index was 0.385. These results showed an aggregation of Cu particles because the samples were measured for DLS after one week of manufacturing (Figure 1c). Other studies reported that the larger CuO NPs examined by DLS compared to the primary particle sizes obtained by TEM are more likely due to the development of nano CuO aggregates [65,66]. Regarding nano-sized Cu particles and their health risk to humans, Cu NPs were documented as one of the most toxic nanomaterials in mammals, as demonstrated by inflammation in subacutely exposed mice [67]. However, the LD50 values of Cu NPs (23.5 nm) are 413 mg/kg body weight and are moderately toxic substances [68]. Our results showed that the average size value of CuO NPs was less than 30 nm. In addition, CuO NPs are more stable than other forms of Cu NPs and have a relatively slow dissolution rate. It behaves differently from dissolved Cu2+ in soil and may affect Cu bioavailability, the release of Cu ions over time, and possible associated risks [69,70]. Therefore CuO NPs could be gained some favors in terms of agrochemicals use.
Furthermore, particles with zeta potentials greater than or equal to +30 mV or less than 30 mV are deemed stable [71,72]. The zeta potential of the CuO NPs was found to be 23.7 mV. This result shows relatively stable CuO NPs suspended in water (Figure 1d). The crystal phase identified by EDX (Figure 1e) showed that CuO NPs have the weight percentage of elemental copper as 99.8%. The concentration of Cu in the suspension as NPs were (mean ± SD) 5257 ± 77.8 mg L−1.

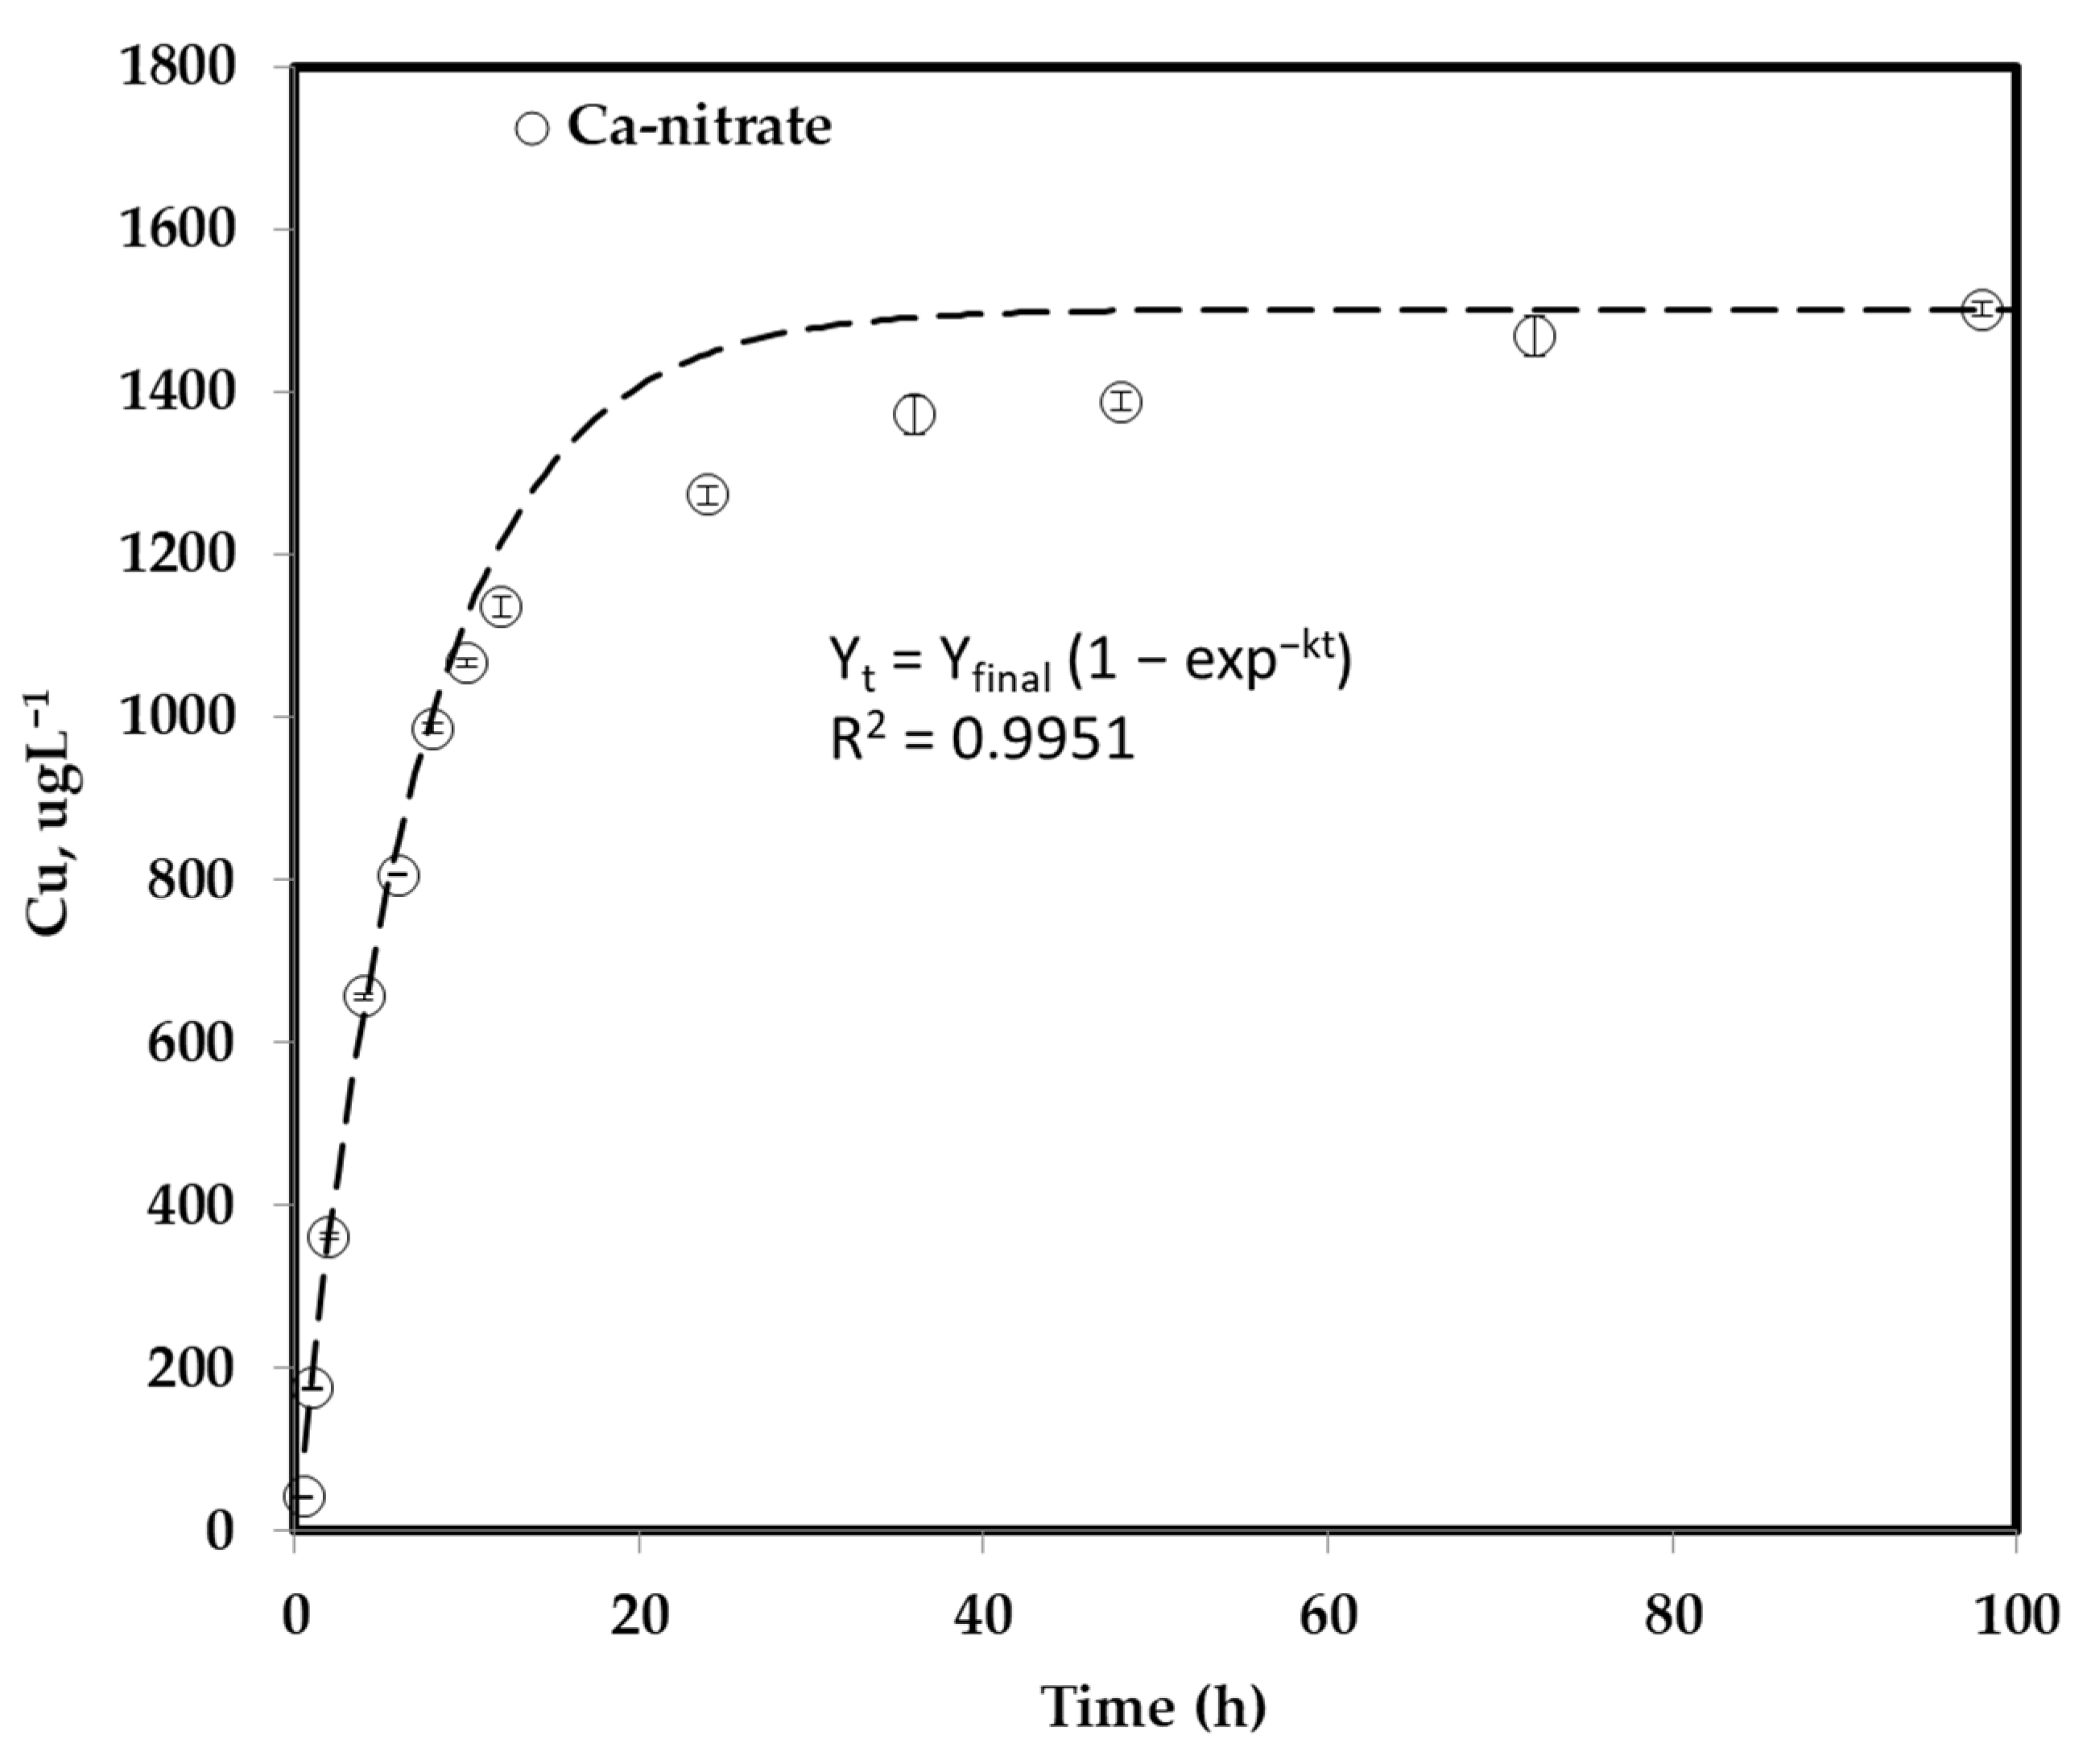
3.2. Copper Oxide Nanoparticle Dissolution Study

The reason behind undertaking such an experiment is to study the chemical stability of synthesized CuO NPs in an aqueous solution. The advantage of nanomaterial is its suspension stability. Once it dissociates or dissolves, it will behave exactly as its bulk forms [73]. As a result, a dissolution study was carried out to ensure the stability of CuO NPs in 0.01 M Ca(NO3)2 as a proxy for soil solution [59]. The release of Cu ions from CuO NPs is affected by water chemical composition [74,75]. Therefore, Ca(NO3)2 was selected to simulate CuO NPs dissolution. Table 1 shows the Cu concentrations dissolved from CuO NPs as a function of time. The results show that Cu dissociated from NPs increased with increasing incubation course, although the dissolution was small. In this regard, the percentage of Cu ions dissociated from NPs was increased from 0.0043% at 0.5 h to 0.15 % at 98 h (% of the total Cu NPs addition). In a similar study by Misra et al. [35], the authors measured the dissolution behaviors of two CuO NPs in 1 mM NaNO3 (pH = 6.7) solution using dialysis membranes (MWCO =12.4 kDa). They found that dissolved Cu of up to 1.30 mg L−1 and 0.40 mg L−1 was dissociated from CuO (sphere shape) and CuO (rod shape) NPs within 72 h, respectively, representing 3.5% and 1.0% in terms of mass % dissolution. The current study provided superior results compared with Misra et al. [35] even after 98 h.
The dissolution of CuO NPs is a complex process that a simple model cannot sufficiently describe. According to the literature [35,76] and the current experimental results, these data were provisionally replaced by the modified first-order kinetics equation (Equation (4)) as below:
Y t = Y final ( 1 exp kt )
where Yt is the dissolved Cu NPs (µg Cu L−1) at the time t (h), Yfinal is the final solubility, and k is the dissolution rate coefficient (h−1). This equation was selected as it describes the growth rate of Cu outside the dialysis tube. It was primarily used to describe organism growth or mortality as a function of time. However, it describes the kinetic reaction of the current study as demonstrated by Misra et al. [35].
The estimated k and Yfinal values were 1.138 µg Cu L−1 h−1 and 1502.2 µg Cu L−1, respectively, indicating low dissolution effects on the kinetics and steady-state solubility of CuO NPs under the Ca-nitrate condition. According to Misra et al. [35], the k value was 50 µg Cu L−1 for CuO NPs (rod shape). A good correlation between modeled and measured values with a high R2 value (0.9951) was found. However, the model slightly overestimates the solubility throughout equilibration times, and the general average predicted the value of Cu obtained from the proposed model (995 µg Cu L−1) was relatively higher than the solubility determined after 98 h (941 µg Cu L−1) (Figure 2) but in a reasonable range. Furthermore, it should be noted that these kinetic data are provided to simplify data interpretation and do not have any specific mechanistic significance. Exact data on the distribution of particle size and shape and chemical models of the interactions between copper ions and the physicochemical properties of organics must be addressed in a mechanistic interpretation [77].
Generally, the stability of synthesized CuO NPs and dissolution studies showed a 0.15 dissolution ratio of the total CuO NPs concentration in the highest dissolution rate after 98 h (4 days). These observations are considered during the toxicity of nanoparticulate systems and bioaccumulation tests, as different Cu dissolution rates need to be considered while interpreting the results or, more importantly, while designing experiments.

3.3. Effect of Copper Oxide Nanoparticles on Wheat Plant

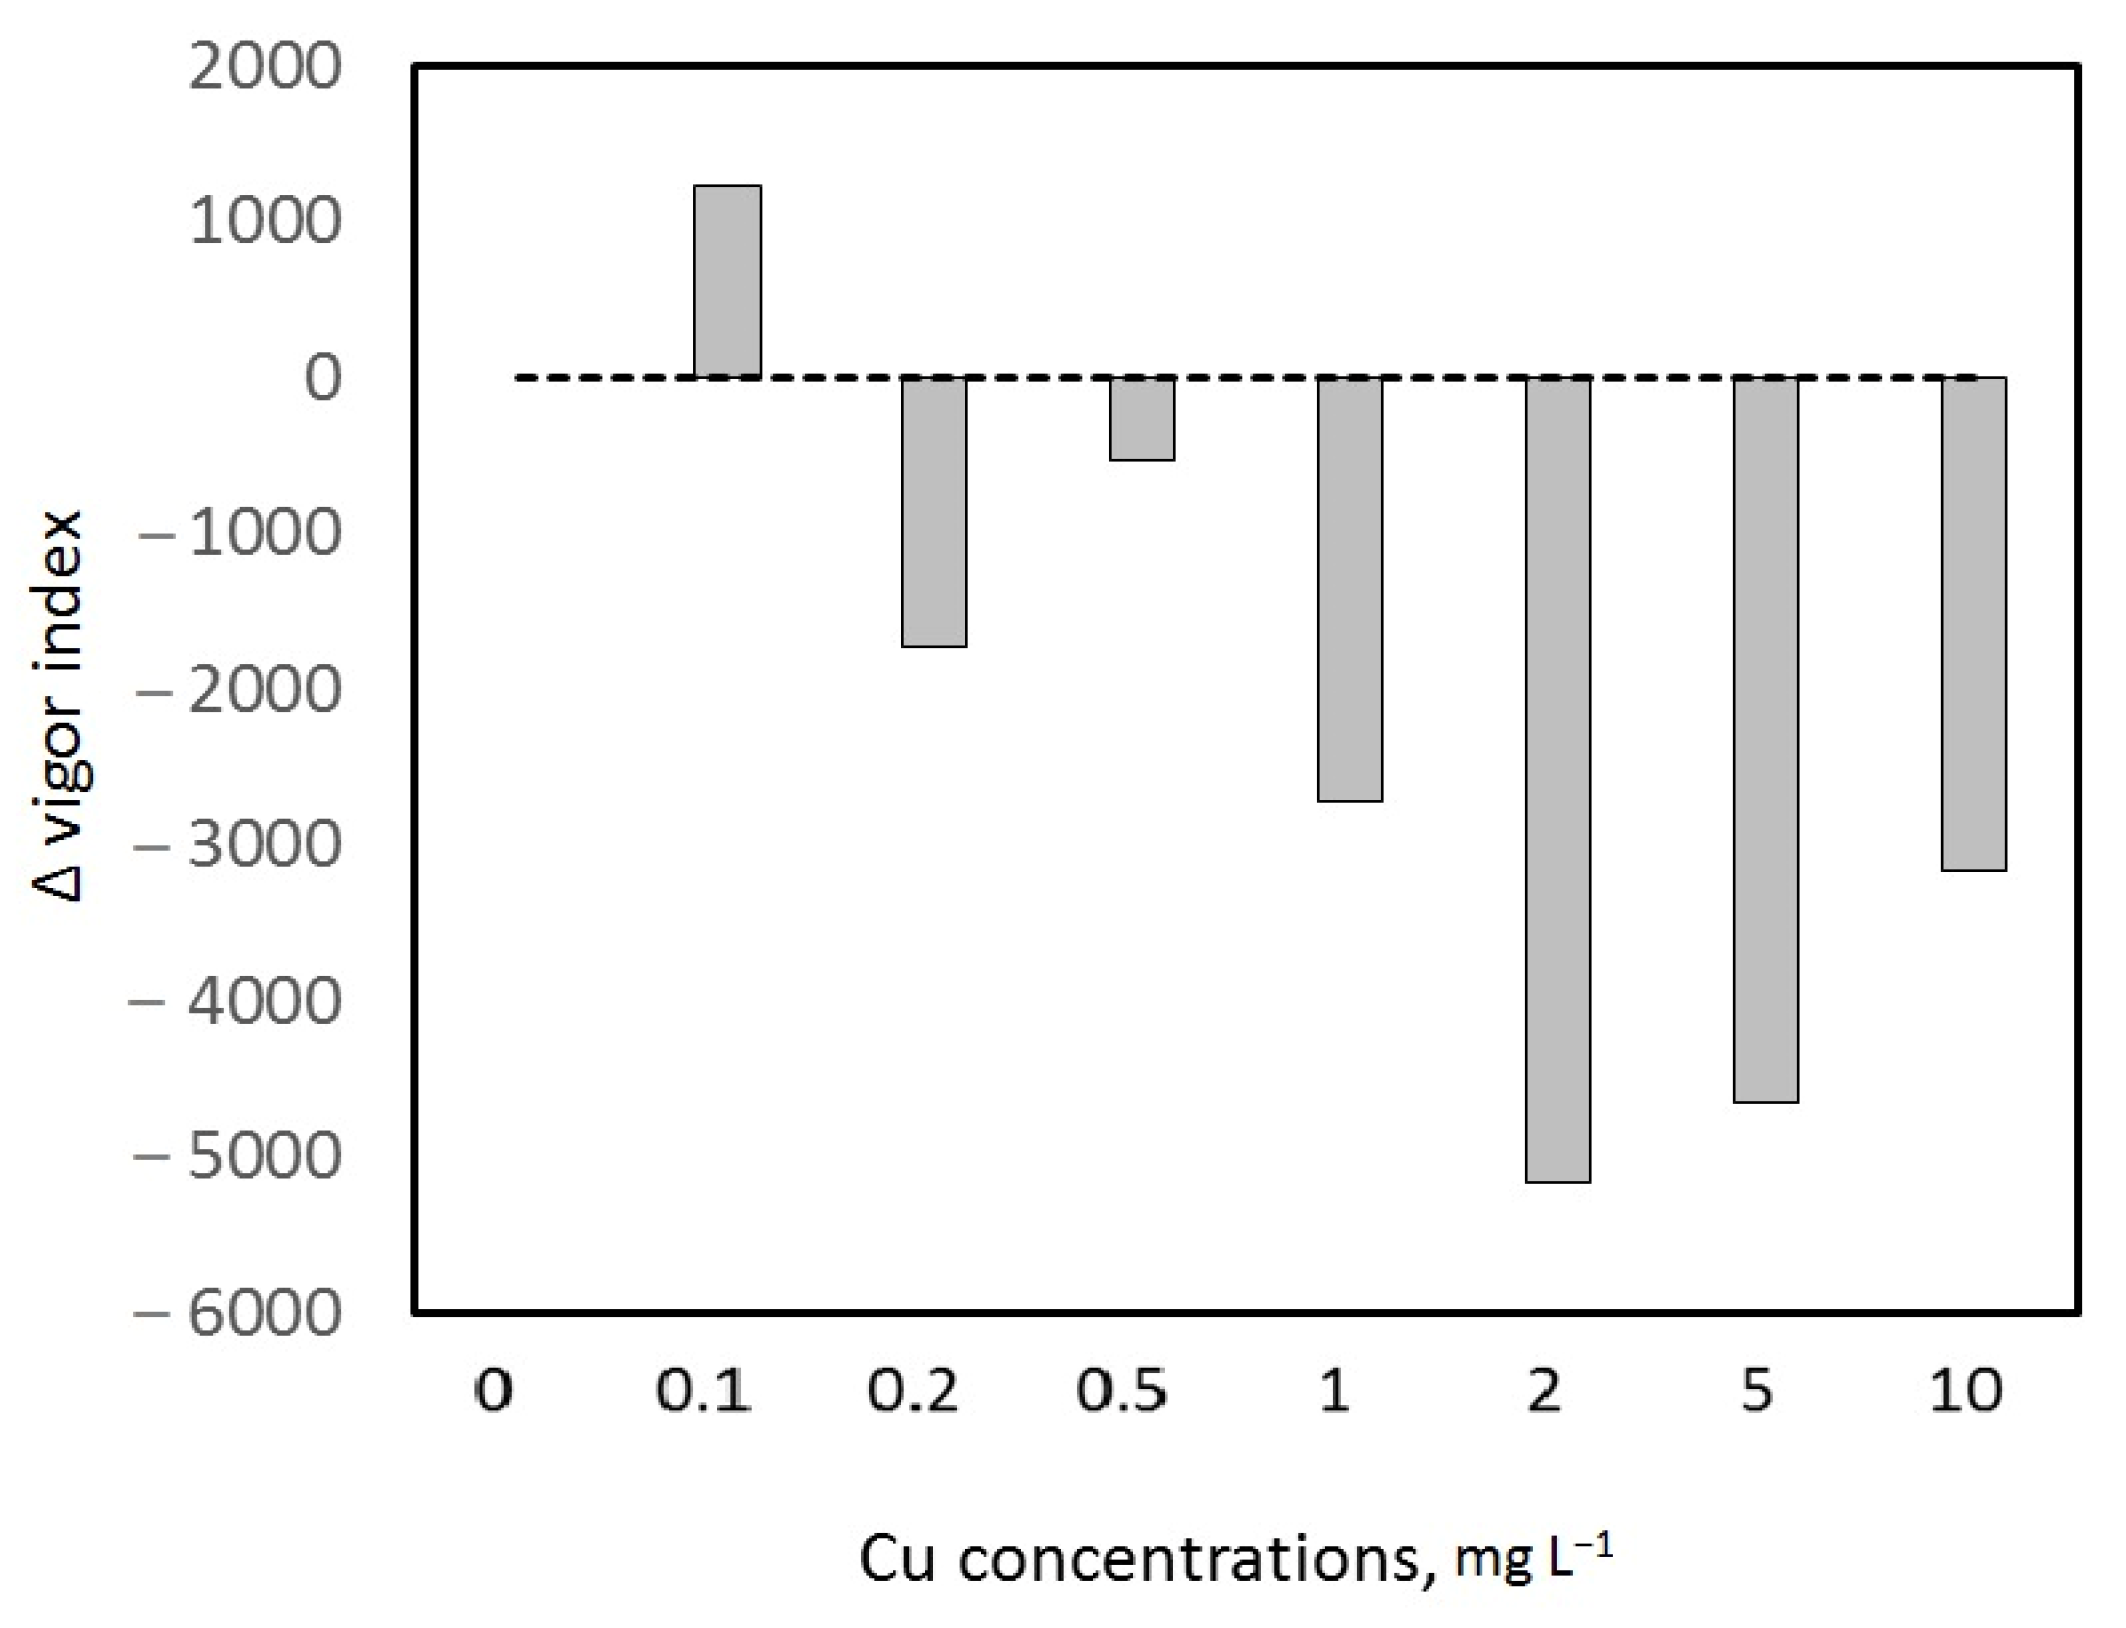
3.3.1. Wheat Germination Characteristics

The introduction of NPs into plants has the potential to have a significant effect and can be employed for agricultural purposes to improve growth and production [78]. However, a comprehensive understanding of the molecular role of engineered nanoscale materials in plant physiology is still absent, as is information on the method of action of NPs on plant growth and development. Plants were reported to naturally produce mineralized nanomaterials required for growth under several situations [79]. It is well established that an optimal seed germination environment improves plant growth, development, and yield [80].
The results related to CuO NPs on germination response of wheat cultivar Gimiza-9 are presented in Table 2. The general results show that no significant difference was obtained in germination rate among all treatments. ANOVA (analysis of variance) test showed that bulk Cu additions have a significant effect on mean germination rate (p = 0.001) and mean germination time (p = 0.001). On the contrary, germinability was significantly affected by CuO NPs additions (p = 0.03).
In the case of bulk Cu addition, the treatment above 0.5 mg L−1 showed a significant difference compared with 0.1 mg L−1 for mean germination time (among means). The same trend was observed as well for the mean germination rate. The comparison between means in the case of Cu NPs applications showed insignificant differences, although different values were obtained. In more detail, each parameter was discussed in depth to show the effect of both treatments on the wheat plant.
Germination of embryos from fresh seeds was very fast; almost all the embryos germinated within 3 days. Germination became progressively higher with CuO NPs and bulk Cu applications, where the general germination rate (% germinability) showed 100%. The germinability reached 100% in all treatments after 3 days with one seed exemption with the highest CuO NPs concentration. The first start of germination was observed after the first day of all treatments.
The lowest germinability rate was observed at 10 mg L−1 of CuO NPs. However, the general mean germination time (MGT) was 1.73 and 1.91 per day for CuO NPs and bulk Cu. The highest MGT was obtained at 5 mg L−1 of CuO NPs and 10 mg L−1 of Cu bulk. In this concern, it seems that bulk Cu showed a better treatment compared with CuO NPs. Moreover, a coefficient of variance (CV) of germination among different treatments showed high variability in CuO NPs; the general value was 37.5% in the case of CuO NPs, while it was 34.9% in the case of bulk Cu. This means to some extent, uniform results with bulk Cu.
The visual result shows the superiority of lower concentrations of Cu addition for both treatments (Figure 3). The average mean germination rate per day (MGR) values were 0.58 and 0.53 day−1 for CuO NPs and bulk Cu, respectively. That means wheat germinated approximately after 12 h for both treatments. The mean finding of this part is that Cu at the lower concentrations showed promising results for both treatments. It sounds as if higher concentrations may pose a significant effect on plant toxicity.
However, germination parameters do not provide sufficient insight for the best treatments because the length of both shoot and root systems is not included in all germination parameter equations. Therefore, the seed vigor index (Vi) of wheat was calculated using Equation (5) as described by Vashisth and Nagarajan [81]:
V i = G × ( R + S )
where G is germinability (%), and R and S are root and shoot lengths. According to the current results, shoot and root growth responded differently to bulk and nanoparticles of Cu with inhibition of root and shoot growth at higher concentrations. Seed vigor index in all bulk Cu and CuO NPs concentrations treatments were significantly different, and the highest values were found for 0.2 mg bulk Cu L−1 and 0.1 mg CuO NPs L−1 (Figure 4). Moreover, the vigor index showed higher values in CuO NPs application, although lower concentration was used compared with dissolved Cu. Due to the lack of information in the literature on Cu nanoparticles and their effect on wheat seed, different nanoparticle works were cited to support the current work. In this concern, Abbasi Khalaki et al. [82] reported that Ag NPs (silver nanoparticles) had enhanced root and shoot in Thymus kotschyanus. In addition, the concentration of 20% Ag NPs was promised to improve seed germination. Moreover, Siddiqui and Al-Whaibi [80] studied the role of SiO2 nanoparticles in the germination of tomatoes (Lycopersicum esculentum). They reported that applying 8 mg L−1 of SiO2 NPs produced the best outcomes, with the highest seedling vigor index and seed germination values.
The results also showed that a negative significant correlation (Pearson correlation test) between bulk Cu concentrations (r = −0.93; p < 0.01) and Vi and between CuO NPs concentrations (r = −0.86; p < 0.01) and Vi. Therefore, by increasing Cu concentration, Vi decreased. This was more promoted for CuO NPs, as shown in Figure 5.
Silver nanoparticles were reported to adversely affect the germination of lettuce and cucumber seeds [83] and enhance the germination of wetland plants [84]. Relatively fewer studies were reported on the application of CuO NPs. Shah and Belozerova [85] observed a favorable effect of CuO NPs on the germination of lettuce seeds in contradiction with our results. However, Adhikari et al. [86] reported that germination of soybean and chickpea was not checked up to 2000 mg L−1 concentration of CuO nanoparticles. Indeed, further experimentation is needed to explore the impact of CuO NPs on wheat seed germination for conclusive results precisely.
According to germination vague results, an attempt to demonstrate the superior treatment in wheat germination parameters was developed in the current study; delta vigor index was calculated by difference (ΔVi = Vi CuO NPs − Vi Bulk Cu), where a positive value represents the superior of CuO NPs compared with negative values for bulk Cu. The result presented in Figure 6 shows that a lower concentration of CuO NPs corresponds with a higher ΔVi value. This finding was attributed to the superior effect of nanoparticles at lower concentrations compared with traditional forms of the same element. These results confirmed that 0.1 mg L−1 of CuO NPs could be successfully used to improve wheat seed germination. Higher concentrations of CuO NPs inhibited root and shoot growth, and therefore, toxicity concentration should be pragmatically calculated.

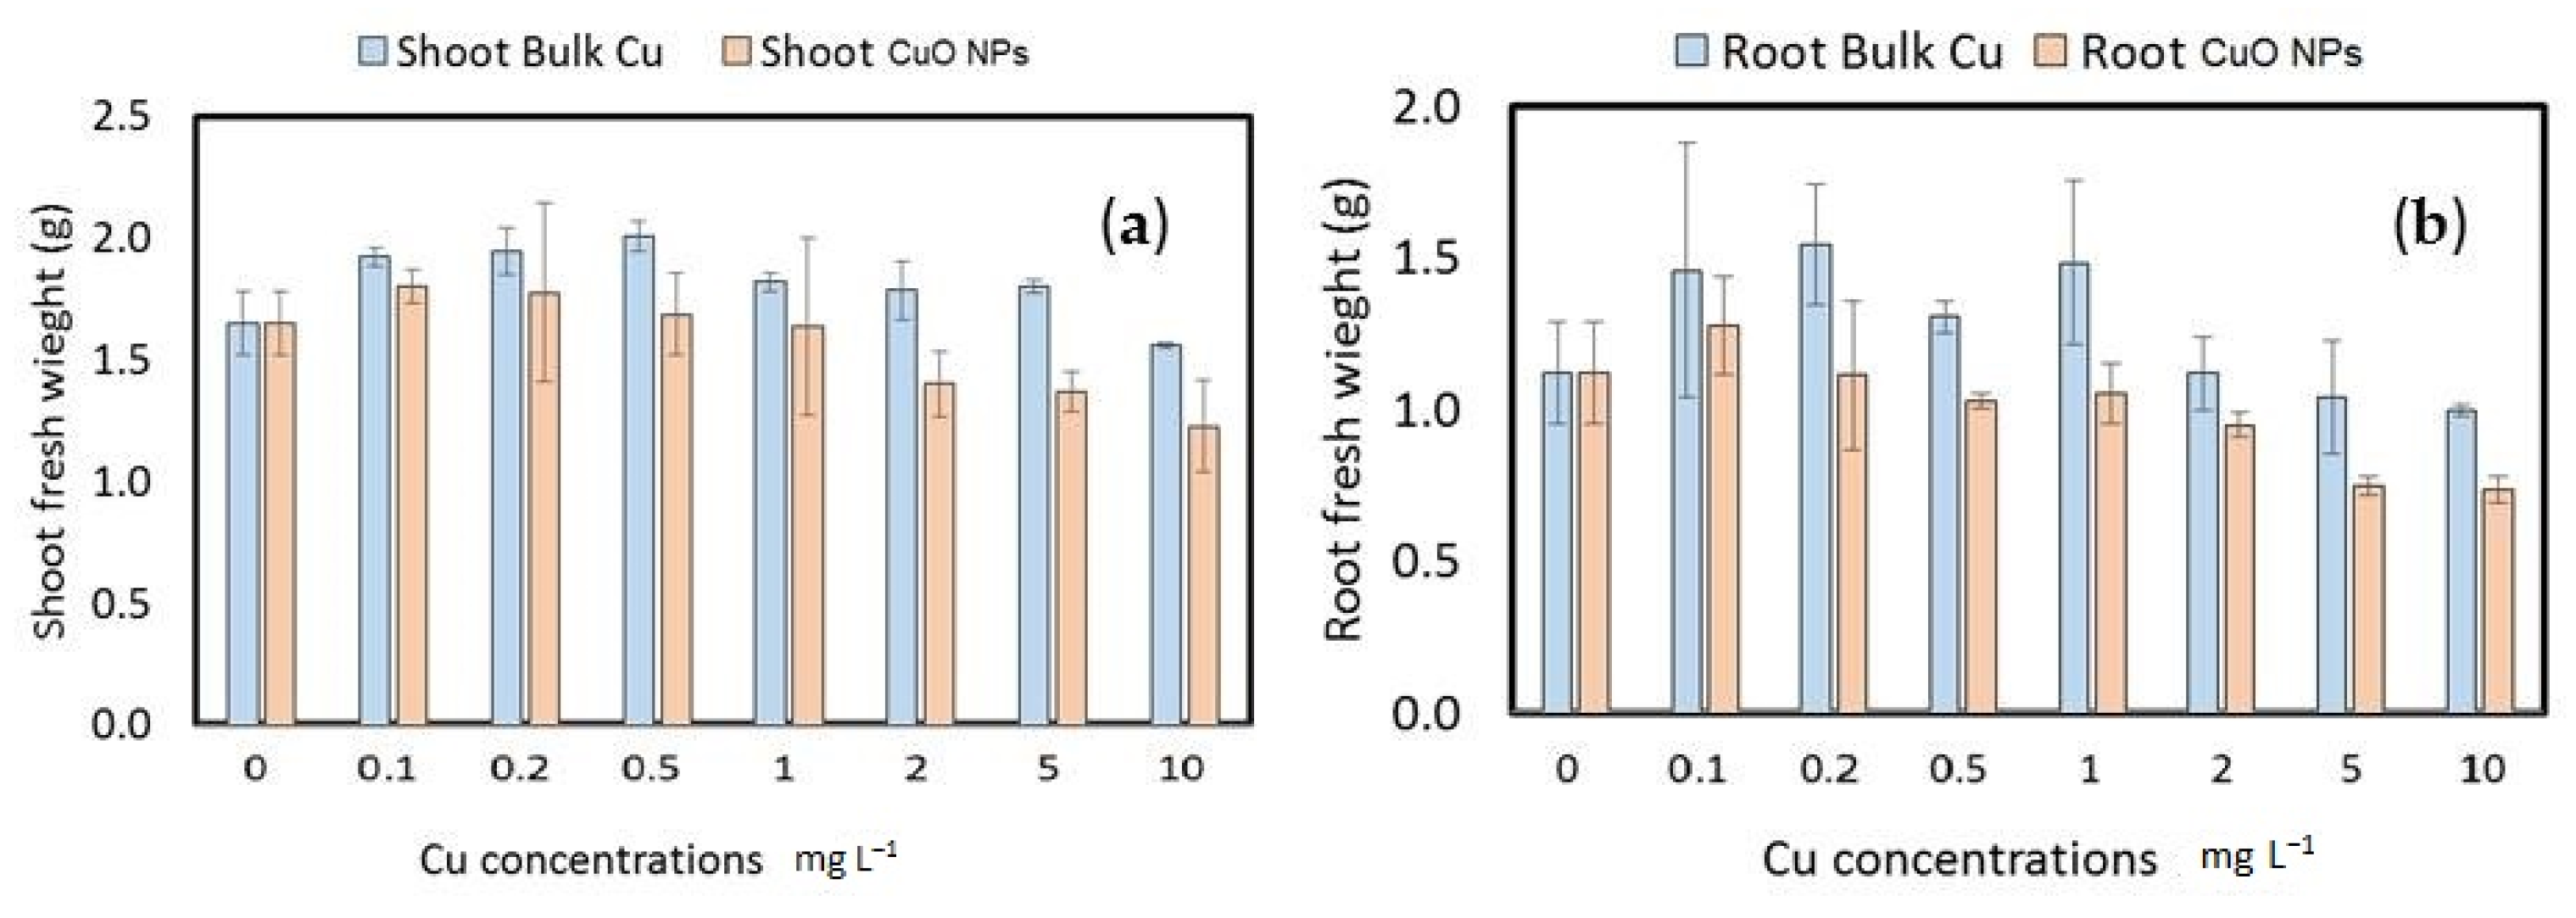
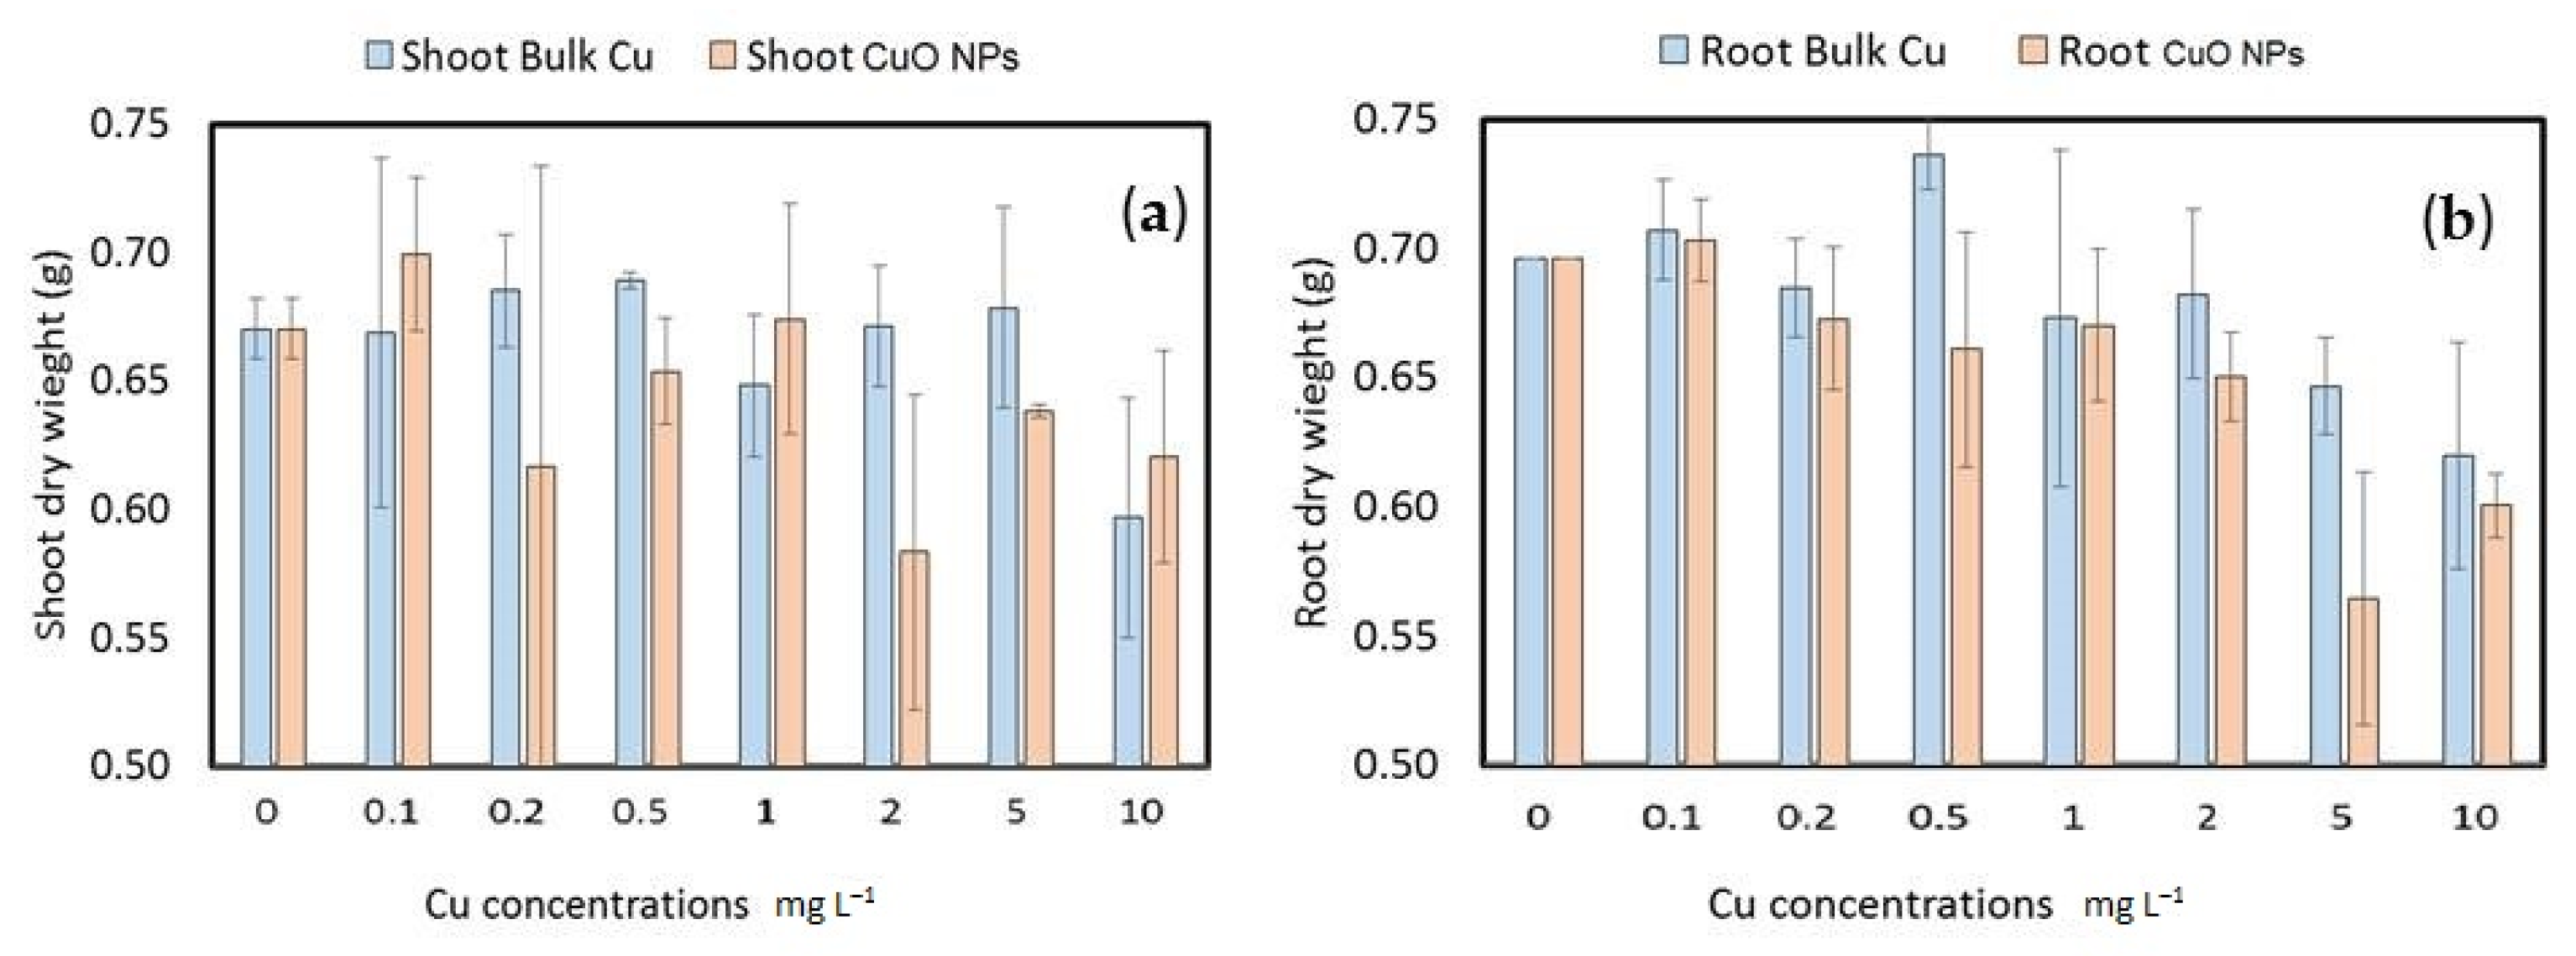
3.3.2. Wheat Seedling Fresh and Dry Weight

The current results indicated that the maximum shoot system fresh weight values were observed at 0.5 and 0.1 mg L−1 for bulk Cu and CuO NPs, respectively. However, the maximum fresh weight values of the root system were observed at 0.2 and 0.1 mg L−1 for bulk Cu and CuO NPs, respectively (Figure 7). Figure 7 shows that the fresh weight of the shoot and root system increased to maximum values (up to 0.5 mg L−1) and then decreased by increasing Cu concentrations for both Cu forms. It seems larger biomass corresponds well with lower concentrations of both forms of Cu (as seen in Figure 3).
To some extent, negative significant (p < 0.05) correlations were found between Cu concentrations and shoot (r = −0.67) and root (r = −0.69) fresh weight for bulk Cu and shoot (r = −0.88) and root (r = −0.86) fresh weight for CuO NPs. General speaking, t-paired test showed significant differences between bulk Cu and CuO NPs treatments for shoot fresh weight (t value = 4.64; p = 0.002) and root fresh weight (t value = 5.05; p = 0.01). The general average value ± SD of fresh weight for bulk Cu and CuO NPs were 1.81 ± 0.15 g and 1.57 ± 0.21 g for the shoot system, respectively, and 1.26 ± 0.22 g and 1.10 ± 0.19 g for the root system, respectively. This finding confirms the highest fresh weight values of wheat seedlings treated by bulk Cu. This may be due to the higher solubility of dissolved Cu (bulk Cu) than CuO NPs, which only interact with wheat seed in the early growth stage.
On the other hand, the dry seedling weight of wheat for both shoot and root systems results were presented in Figure 8 as affected by both Cu forms. The maximum dry weight values of the shoot system were observed at 0.5 and 0.1 mg L−1 for bulk Cu and CuO NPs, respectively (Figure 8a). However, the maximum dry weight values of the root system were observed at 0.5 and 0.1 mg L−1 for bulk Cu and CuO NPs, respectively (Figure 8b). In corresponding with fresh weight results (Figure 7), larger dry mass corresponds well with lower concentrations of both forms of Cu. Figure 8 shows that the dry weight of the shoot and root system increased until maximum values (up to 0.5 mg L−1) and then decreased by increasing Cu concentrations for both Cu forms. Negative significant (p < 0.05) correlations were found between Cu concentrations and shoot (r = −0.79) and root (r = −0.86) dry weight for bulk Cu and shoot (r = −0.39) and root (r = −0.80) dry weight for CuO NPs.
General speaking, t-paired test showed insignificant differences between bulk Cu and CuO NPs treatments for shoot dry weight (t value = 1.18; p = 0.28) while significant difference was obtained with root dry weight (t value = 2.46; p = 0.04). The general average value ± SD of dry weight for bulk Cu and CuO NPs were 0.66 ± 0.03 g and 0.64 ± 0.04 g for the shoot system, respectively, and 0.69 ± 0.04 g and 0.65 ± 0.05 g for the root system, respectively. This finding confirms that wheat seedlings’ highest dry weight values were treated by bulk Cu, which corresponds with fresh weight. In comparison with the study undertaken by Hafeez et al. [87], the authors determine the potential of CuO NPs for enhancing the growth and yield of wheat cultivar Millat, 2011. They used a wide range of CuO NPs (0, 0.2, 0.4, 0.6, 0.8, 1.0, 2.0, 4.0, 6.0, 8.0, and 10 mg L−1). They found that fresh plant weight and dry weight were increased over control up to 0.4 mg CuO NPs L−1. Their results relatively corresponded with the current results. However, the authors reported that further increase in CuO NPs concentrations caused a significant drop in values of the growth parameters except for fresh plant weight that started decreasing at 0.8 mg L−1 of CuO NPs. They concluded that the wheat plants treated with 0.4 mg L−1 CuO NPs were visibly compact, vigorous, and greener in color with a stronger root system than other treatments.

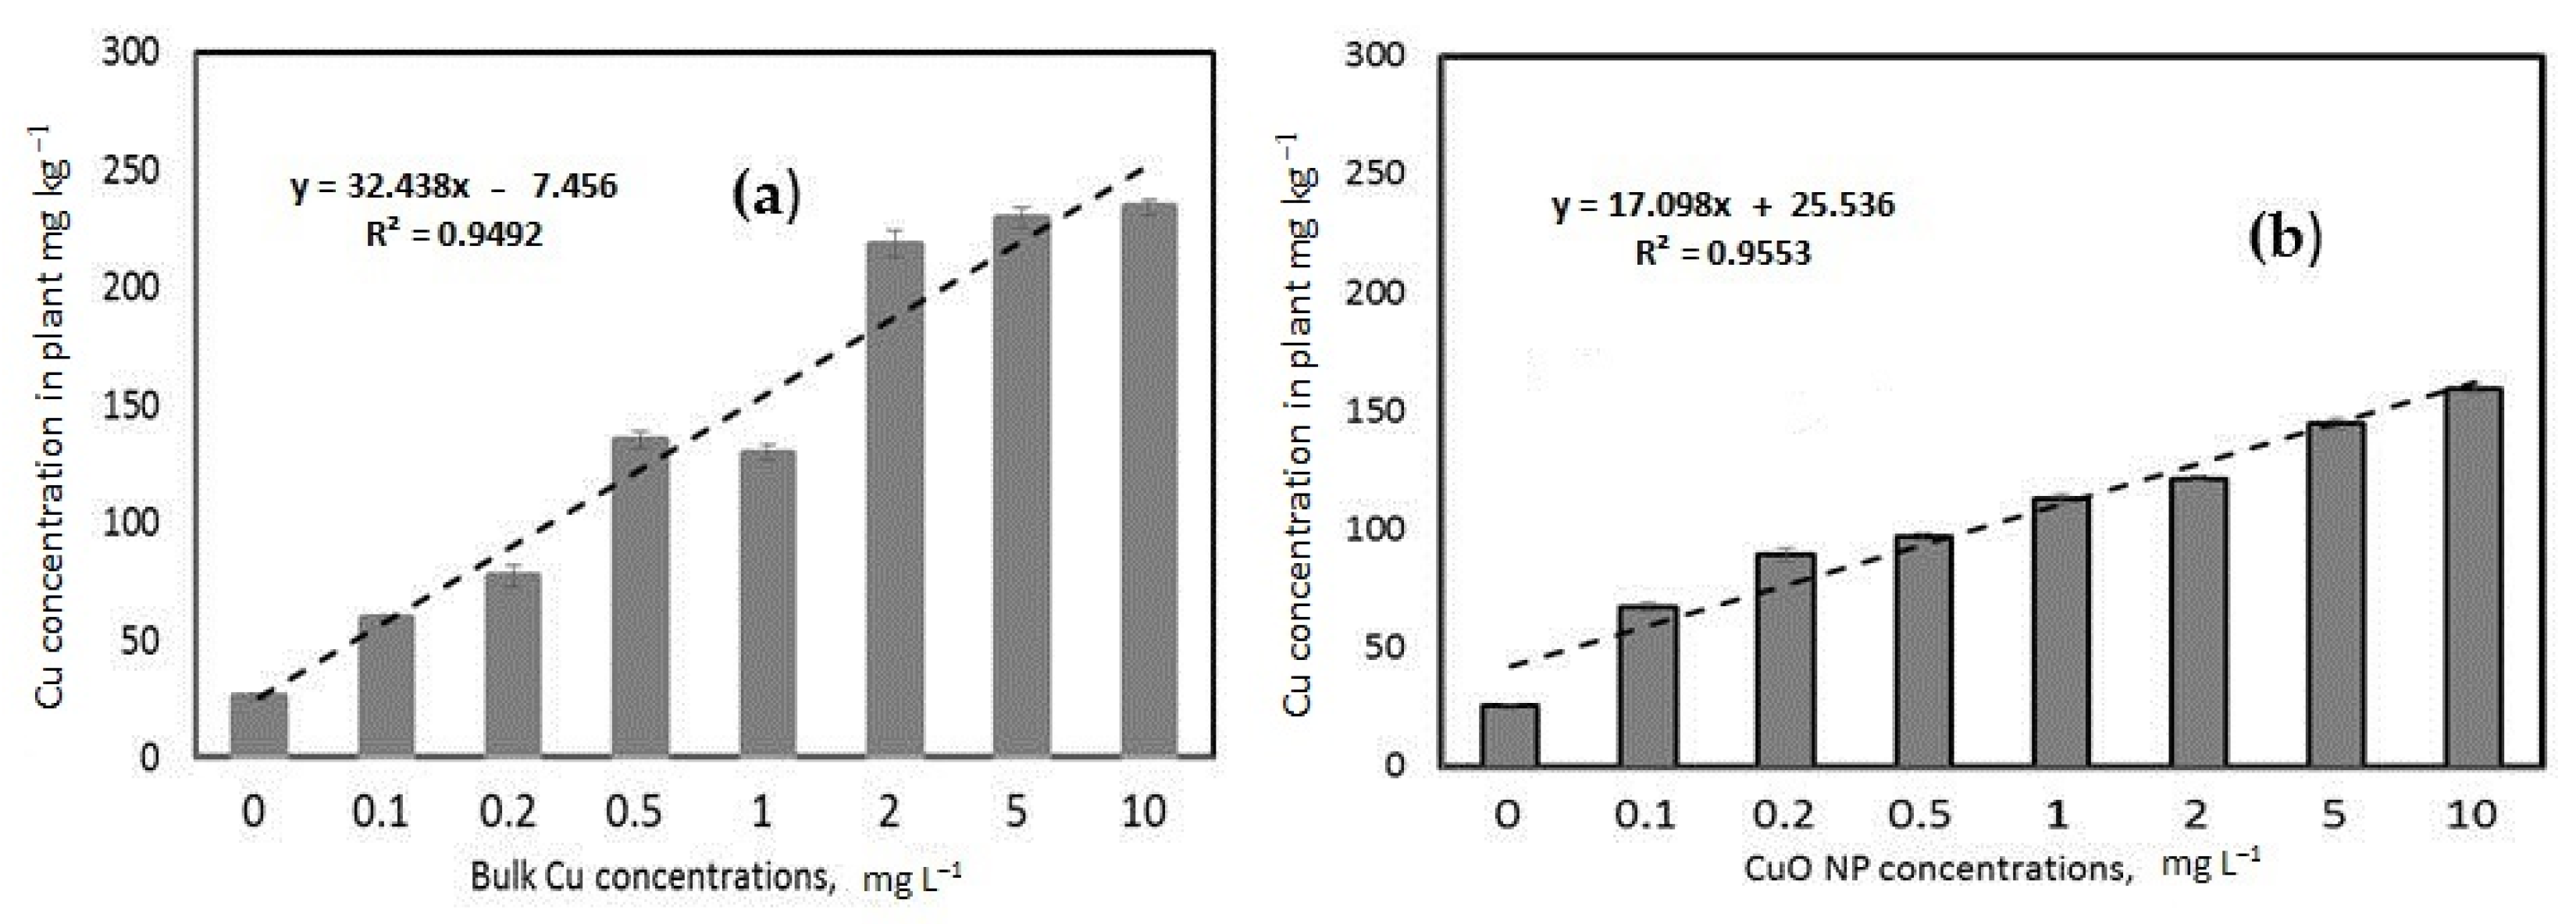
3.3.3. Copper Concentrations in Wheat Plant Tissue

Copper concentration in wheat plant tissue was measured in the whole plant (root and shoot). The general average Cu concentrations in the plant were 139 and 103 mg kg−1 DW (dry weight) for bulk and CuO NPs, respectively. The results reveal that Cu concentration in plants increased with increasing Cu additions for both Cu forms (Figure 9). Copper concentrations in the plant as treated by bulk Cu were higher than those treated by CuO NPs. This finding could be supported by the dissolution behavior of CuO NPs, where a very low concentration of Cu was released from nanoparticle forms. However, the fresh and dry matters in bulk Cu treatment were higher than CuO NPs (Figure 7 and Figure 8). It is expected that increasing Cu content in the plant will reduce plant biomass as a higher concentration of Cu might promote the phytotoxicity effect [88].
In order to correlate the content of Cu in plants with the dry and fresh matters, it was found that Pearson correlations were only significant with CuO NPs for fresh (r = −0.82; p = 0.02) and dry (r = −0.83; p = 0.012) matters. Although the correlation values were relatively high in case of bulk Cu for fresh (r = −0.53; p = 0.18) and dry (r = −0.57; p = 0.14) matter, it was insignificant. This correlation may suggest a direct influence of CuO NPs in plants, particularly in the early germination stage and reflected in plant biomass. In addition, the inhibition of growth may be related to their attachment to the root cell wall for CuO NPs. Therefore, one potential explanation that answers the question “why lower CuO NPs decrease plant biomass?” is that CuO NPs were reported to damage the plasmalemma in the root system of the wheat plant [89] and hence could reduce plant uptake and thereby, plant biomass.

3.3.4. Wheat Chlorophyll Content

Wheat cells require copper as a critical micronutrient and have developed techniques to increase uptake. Cu is a critical component of chloroplasts and is necessary for electron transfer during photosynthetic respiration. Chlorophyll concentration was recently recommended as a tool for monitoring plant-NPs interaction and analyzing NPs impacts on plants [90]. Chlorophyll content results are depicted in Figure 10a. The results showed a relatively increased chlorophyll with increasing Cu addition up to 0.5 mg L−1 for both Cu forms. Then, a continuous decrease (lower than the control) with increasing Cu addition for both treatments. The maximum chlorophyll value was observed with 0.1 mg L−1 addition of CuO NPs, which confirms the superiority of this treatment compared to the others. These results correspond with the abovementioned findings (Section 3.3.3), where lower CuO NPs could be used as an alternative material for traditional Cu addition to the plant. Approximately 0.1 mg L−1 addition of CuO NPs promotes chlorophyll formation equal to 0.5 mg L−1 of bulk Cu. This means that using NPs as fertilizer could reduce the need for 80% of traditional fertilizers.
An exponential relationship was plotted between chlorophyll content and Cu additions for bulk Cu and CuO NPs, as seen in Figure 10b. This relationship was selected according to the highest R2 value (R2 = 0.94 and 0.89 for bulk Cu and CuO NPs, respectively; Figure 10b). It is interesting to present this high relationship, implying that increasing Cu addition will reduce chlorophyll content and plant productivity. The current results agreed with Hafeez et al. [87] and Moustakas et al. [91].

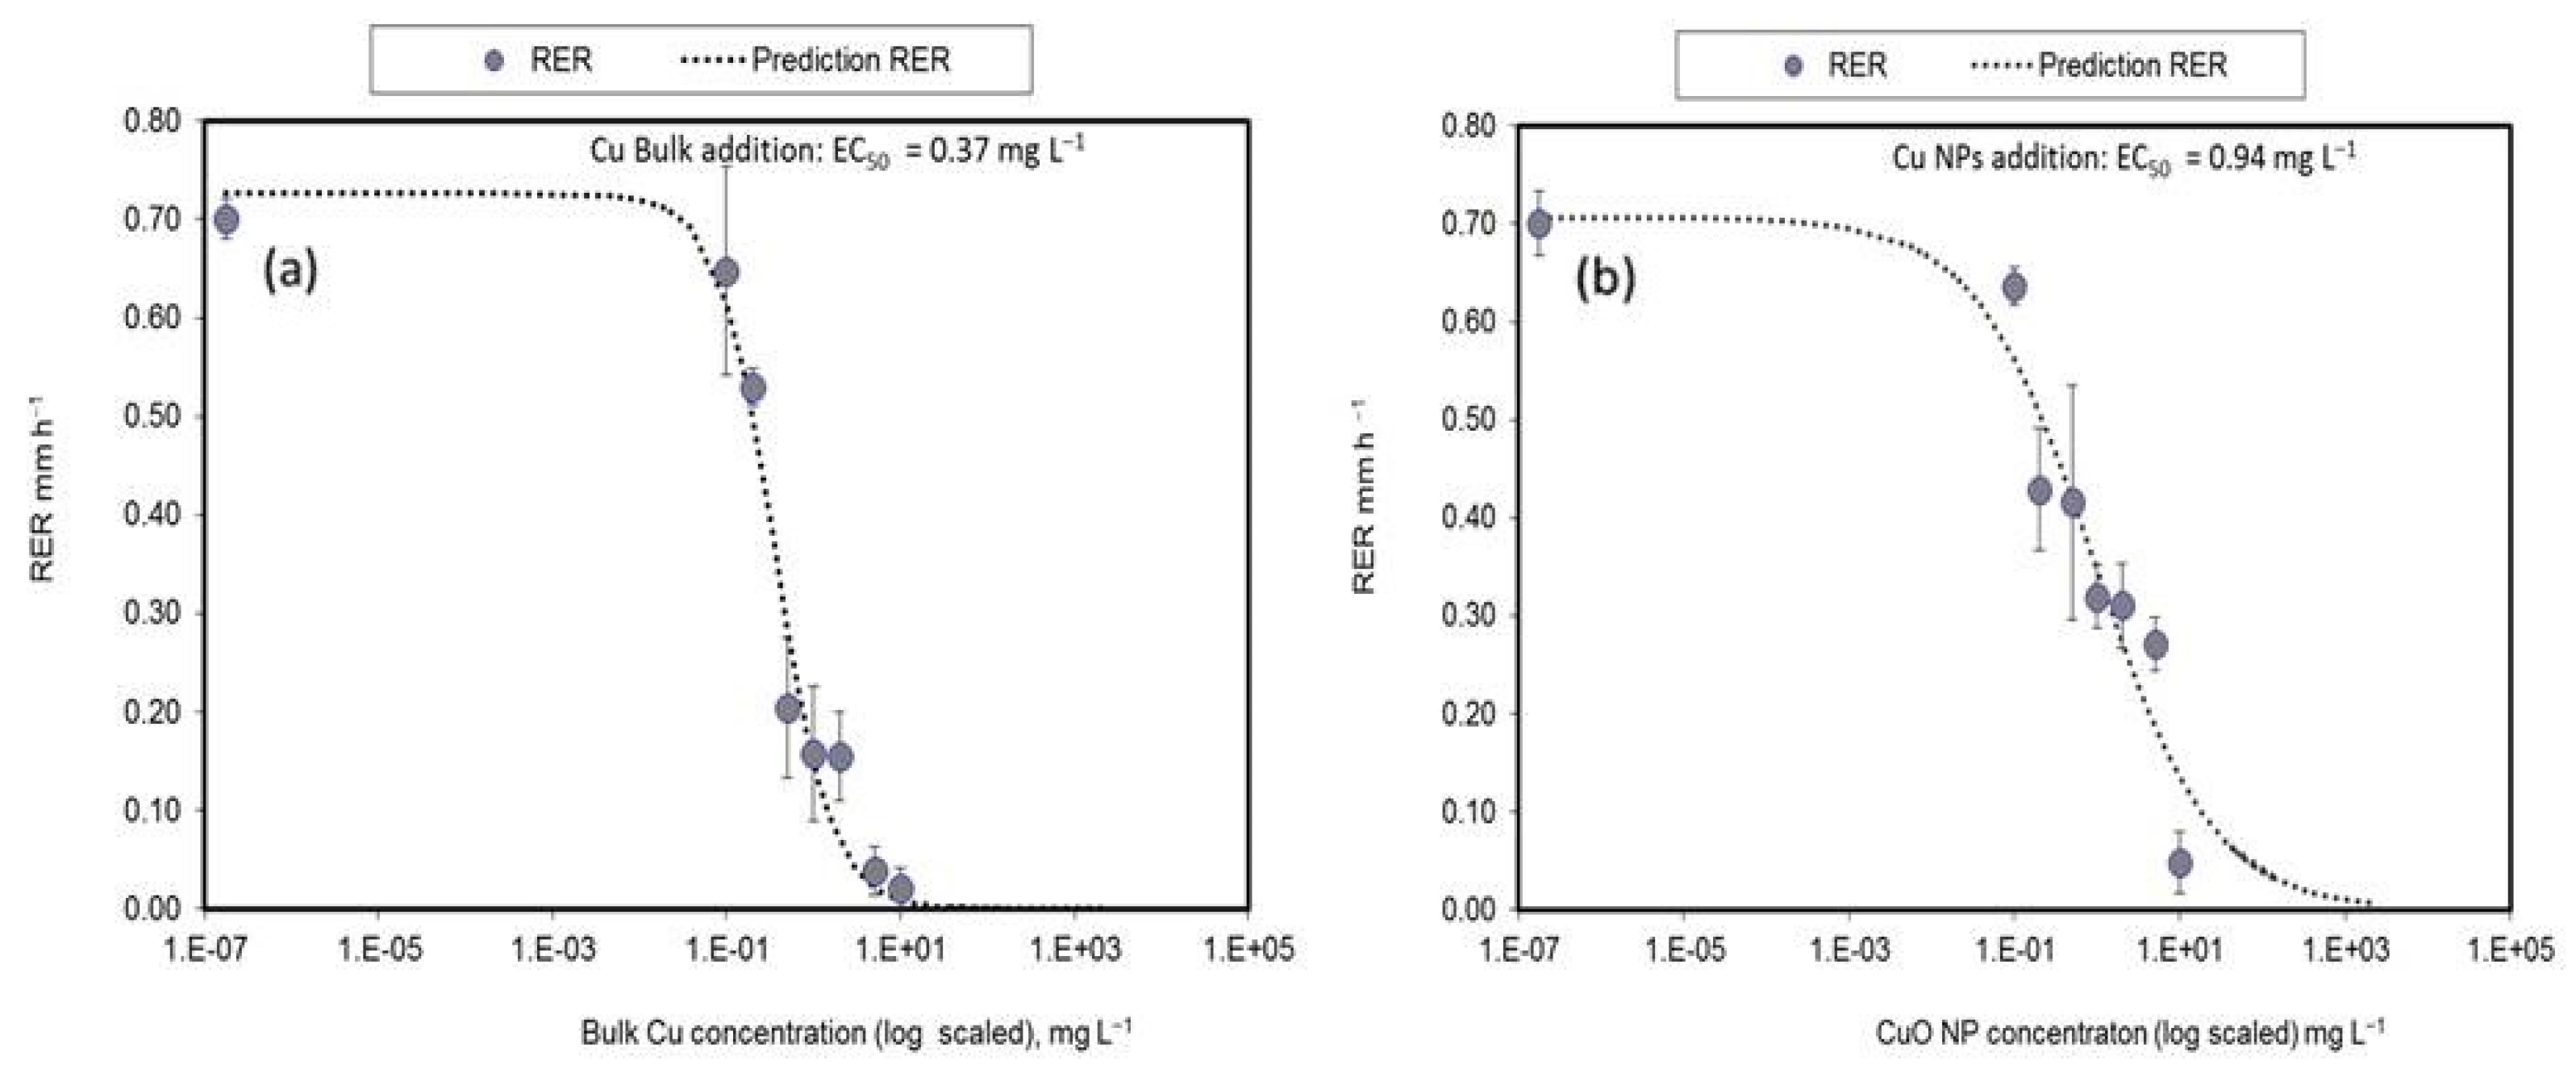
3.4. Copper Oxide Nanoparticles Toxicity to Wheat, EC50

Cu additions in both forms (NPs and bulk) reduce root growth substantially compared to control. However, the effective toxic dose (so-called EC50) for Cu nano and Bulk particles differed. Although CuO NPs have the highest inhibition effect on wheat growth, the EC50 was lower than bulk Cu. Figure 11a showed RER as a function of bulk Cu concentrations. The results obtained from the log-logistic model showed EC50 of 0.37 mg Cu L−1.
On the other hand, the same value obtained in the case of CuO NPs (Figure 11b) was 0.94 mg CuO NPs L−1. These findings were in agreement with Marzouk et al. [92]. The authors studied that bulk Cu was more toxic than CuO NPs where EC50 (predicting using the log-logistic model) of CuO NPs was four times higher than that of bulk Cu. For soybean, they also reported the EC50 value for bulk Cu and CuO NPs as 0.22 mg L−1 and 0.90 mg L−1, respectively.
Moreover, in a similar study undertaken by Zhang et al. [93], the authors propose that the toxicity of Cu NPs (size = 50 nm) in wheat was less than the toxicity of bulk Cu (derived from CuSO4) at the same initial molar concentration. Furthermore, NPs contributed the most to Cu NPs toxicity to wheat due to the low amount of Cu2+ released from Cu NPs suspensions. The current results indicated that approximately 2.5 times CuO NPs concentration is equal to the toxicity dose of bulk Cu. Soluble Cu spiked as the bulk form is much more available than NPs. However, more experimental work should be carried out to explain the toxicity of CuO NPs, such as the effect of pH and competition with other ions in the solution phase with Cu ions [92].
CuO NPs showed a very low dissolution rate. Therefore, the dissolution rate of a CuO-nano-activated fertilizer could likely be tuned to provide sustained release of the Cu ions at a rate where the concentration of Cu ions would not exceed the phytotoxic concentration [94]. This tuning showed that CuO NPs were less toxic than CuSO4, despite being supplied to the plant at a much higher dose. It is conceivable that slow-release nano-activated fertilizers could be designed and applied in high concentrations but with low toxicity and last for years without re-applying. That technique would save energy and labor and create incentives for producers to adopt these new technologies. However, research is still needed to determine the nanofertilizer delivery rate that can effectively perform its function without inducing toxicity.
Figure 12 shows the correlation between measured and modeled RER using the log-logistic model. The results showed that the model performance was better using bulk Cu than CuO NPs. This comparison was based on both R2 and RSD values; R2 = 0.97 (Figure 12a) and RSD = 0.059 for bulk Cu and R2 = 0.91 (Figure 12b) and RSD = 0.076 for CuO NPs. The current model performance finding was contrary to Marzouk et al. [92], as they found the best model performance was undergoing with CuO NPs. The results indicated that the toxicity of Cu and its root growth response is well predicted by the log-logistic model for both bulk Cu and CuO NPs.

4. Conclusions

In this work, CuO NPs were successfully synthesized to enhance the absorption of Cu estimation by wheat for plant nutrition and bio-fortification purposes compared to bulk Cu. Overall, both forms of Cu were effective for germination characteristics at lower concentrations (0.5 mg L−1). However, using CuO NPs exhibits uniqueness compared with its bulk form, where a 20% addition of CuO NPs (from the total amount of bulk Cu) promoted the formation of the same amount of chlorophyll generated under bulk Cu conditions. Significantly higher toxicity in bulk Cu treatments compared to treatment with CuO NPs is explained by the higher exposure of wheat plant roots to labile Cu species, where treatment with CuO NPs showed a lower Cu concentration in plant tissue. In addition, the low dissolution rate of CuO NPs decreased the bioavailability of Cu over time, resulting in lower toxicity to wheat plants. The opposite was observed for bulk Cu, where its bioavailability results in higher toxicity to the plants. Research is needed to account for different conditions, such as pH, ion competition, and different soil components in real environmental conditions.

Author Contributions

Conceptualization: A.S.I., A.M.A., G.A.M.A., A.H. and E.R.M.; Methodology, Formal analysis, and Validation: A.S.I. and E.R.M.; Investigation: A.S.I.; Resources: E.R.M.; Data curation: A.S.I.; Writing—original draft preparation: A.S.I. and E.R.M.; Writing—review and editing, A.S.I., G.A.M.A., A.H. and E.R.M.; Visualization: A.M.A., A.S.I., G.A.M.A., A.H. and E.R.M.; Supervision: A.M.A. and E.R.M.; Project Administration: E.R.M. All authors have read and agreed to the published version of the manuscript.

Funding

This research received no external funding.

Institutional Review Board Statement

Not applicable.

Informed Consent Statement

Not applicable.

Data Availability Statement

Not applicable.

Conflicts of Interest

The authors declare no conflict of interest.

References

  1. Neme, K.; Nafady, A.; Uddin, S.; Tola, Y.B. Application of nanotechnology in agriculture, postharvest loss reduction and food processing: Food security implication and challenges. Heliyon 2021, 7, e08539. [Google Scholar] [CrossRef] [PubMed]
  2. Mittal, D.; Kaur, G.; Singh, P.; Yadav, K.; Ali, S.A. Nanoparticle-based sustainable agriculture and food science: Recent advances and future outlook. Front. Nanotechnol. 2020, 2, 579954. [Google Scholar] [CrossRef]
  3. Khan, I.; Saeed, K.; Khan, I. Nanoparticles: Properties, applications and toxicities. Arab. J. Chem. 2019, 12, 908–931. [Google Scholar] [CrossRef]
  4. Asghar, M.; Habib, S.; Zaman, W.; Hussain, S.; Ali, H.; Saqib, S. Synthesis and characterization of microbial mediated cadmium oxide nanoparticles. Microsc. Res. Tech. 2020, 83, 1574–1584. [Google Scholar] [CrossRef] [PubMed]
  5. Marina, P.E.; Ali, G.A.M.; See, L.M.; Teo, E.Y.L.; Ng, E.-P.; Chong, K.F. In situ growth of redox-active iron-centered nanoparticles on graphene sheets for specific capacitance enhancement. Arab. J. Chem. 2016, 12, 3883–3889. [Google Scholar] [CrossRef] [Green Version]
  6. Bouafia, A.; Laouini, S.E.; Ahmed, A.S.A.; Soldatov, A.V.; Algarni, H.; Feng Chong, K.; Ali, G.A.M. The recent progress on silver nanoparticles: Synthesis and electronic applications. Nanomaterials 2021, 11, 2318. [Google Scholar] [CrossRef]
  7. Alhasan, H.S.; Alahmadi, N.; Yasin, S.A.; Khalaf, M.Y.; Ali, G.A.M. Low-cost and eco-friendly hydroxyapatite nanoparticles derived from eggshell waste for cephalexin removal. Separations 2022, 9, 10. [Google Scholar] [CrossRef]
  8. Panagiotou, S.; Saha, S. Therapeutic benefits of nanoparticles in stroke. Front. Neurosci. 2015, 9, 182. [Google Scholar] [CrossRef]
  9. Ali, M.; Wang, X.; Haroon, U.; Chaudhary, H.J.; Kamal, A.; Ali, Q.; Saleem, M.H.; Usman, K.; Alatawi, A.; Ali, S.; et al. Antifungal activity of Zinc nitrate derived nano ZnO fungicide synthesized from Trachyspermum ammi to control fruit rot disease of grapefruit. Ecotoxicol. Environ. Saf. 2022, 233, 113311. [Google Scholar] [CrossRef]
  10. Ali, G.A.M.; Habeeb, O.A.; Algarni, H.; Chong, K.F. CaO impregnated highly porous honeycomb activated carbon from agriculture waste: Symmetrical supercapacitor study. J. Mater. Sci. 2018, 54, 683–692. [Google Scholar] [CrossRef]
  11. Schreck, E.; Foucault, Y.; Sarret, G.; Sobanska, S.; Cécillon, L.; Castrec-Rouelle, M.; Uzu, G.; Dumat, C. Metal and metalloid foliar uptake by various plant species exposed to atmospheric industrial fallout: Mechanisms involved for lead. Sci. Total Environ. 2012, 427, 253–262. [Google Scholar] [CrossRef] [PubMed] [Green Version]
  12. Rastogi, A.; Zivcak, M.; Sytar, O.; Kalaji, H.M.; He, X.; Mbarki, S.; Brestic, M. Impact of metal and metal oxide nanoparticles on plant: A critical review. Front. Chem. 2017, 5, 78. [Google Scholar] [CrossRef] [PubMed] [Green Version]
  13. Chen, H. Metal based nanoparticles in agricultural system: Behavior, transport, and interaction with plants. Chem. Speciat. Bioavailab. 2018, 30, 123–134. [Google Scholar] [CrossRef] [Green Version]
  14. Rizwan, M.; Ali, S.; Qayyum, M.F.; Ok, Y.S.; Adrees, M.; Ibrahim, M.; Zia-ur-Rehman, M.; Farid, M.; Abbas, F. Effect of metal and metal oxide nanoparticles on growth and physiology of globally important food crops: A critical review. J. Hazard. Mater. 2017, 322, 2–16. [Google Scholar] [CrossRef] [PubMed]
  15. Zhao, L.; Lu, L.; Wang, A.; Zhang, H.; Huang, M.; Wu, H.; Xing, B.; Wang, Z.; Ji, R. Nano-Biotechnology in agriculture: Use of nanomaterials to promote plant growth and stress tolerance. J. Agric. Food Chem. 2020, 68, 1935–1947. [Google Scholar] [CrossRef]
  16. Mukhopadhyay, S.S. Nanotechnology in agriculture: Prospects and constraints. Nanotechnol. Sci. Appl. 2014, 7, 63–71. [Google Scholar] [CrossRef] [Green Version]
  17. Subramanian, K.S.; Gunasekaran, K.; Chinnamuthu, N.; Lakshmanan, A.; Rajkishore, S.K. (Eds.) Nanotechnology in Agriculture; New India Publishing Agency: New Delhi, India, 2015. [Google Scholar]
  18. Saqib, S.; Zaman, W.; Ayaz, A.; Habib, S.; Bahadur, S.; Hussain, S.; Muhammad, S.; Ullah, F. Postharvest disease inhibition in fruit by synthesis and characterization of chitosan iron oxide nanoparticles. Biocatal. Agric. Biotechnol. 2020, 28, 101729. [Google Scholar] [CrossRef]
  19. Azam, Z.; Ayaz, A.; Younas, M.; Qureshi, Z.; Arshad, B.; Zaman, W.; Ullah, F.; Nasar, M.Q.; Bahadur, S.; Irfan, M.M.; et al. Microbial synthesized cadmium oxide nanoparticles induce oxidative stress and protein leakage in bacterial cells. Microb. Pathog. 2020, 144, 104188. [Google Scholar] [CrossRef]
  20. Ditta, A.; Arshad, M. Applications and perspectives of using nanomaterials for sustainable plant nutrition. Nanotechnol. Rev. 2016, 5, 209–229. [Google Scholar] [CrossRef] [Green Version]
  21. Khodakovskaya, M.V. Future Roadmap for Plant Nanotechnology. In Plant Nanotechnology; Kole, C., Kumar, D., Khodakovskaya, M., Eds.; Springer: Berlin/Heidelberg, Germany, 2016; pp. 367–371. [Google Scholar]
  22. Ditta, A.; Arshad, M.; Ibrahim, M. Nanoparticles in sustainable agricultural crop production: Applications and perspectives. In Nanotechnology and Plant Sciences: Nanoparticles and Their Impact on Plants; Siddiqui, M.H., Al-Whaibi, M.H., Mohammad, F., Eds.; Springer: Cham, Switzerland, 2015; pp. 55–75. [Google Scholar] [CrossRef]
  23. Zulfiqar, F.; Navarro, M.; Ashraf, M.; Akram, N.A.; Munné-Bosch, S. Nanofertilizer use for sustainable agriculture: Advantages and limitations. Plant Sci. 2019, 289, 110270. [Google Scholar] [CrossRef]
  24. Al-Mamun, M.R.; Hasan, M.R.; Ahommed, M.S.; Bacchu, M.S.; Ali, M.R.; Khan, M.Z.H. Nanofertilizers towards sustainable agriculture and environment. Environ. Technol. Innov. 2021, 23, 101658. [Google Scholar] [CrossRef]
  25. Shalaby, T.A.; Bayoumi, Y.; Eid, Y.; Elbasiouny, H.; Elbehiry, F.; Prokisch, J.; El-Ramady, H.; Ling, W. Can nanofertilizers mitigate multiple environmental stresses for higher crop productivity? Sustainability 2022, 14, 3480. [Google Scholar] [CrossRef]
  26. Tarafdar, J.; Raliya, R.; Rathore, I. Microbial synthesis of phosphorous nanoparticle from tri-calcium phosphate using Aspergillus tubingensis TFR-5. J. Bionanosci. 2012, 6, 84–89. [Google Scholar] [CrossRef]
  27. Tarafdar, J.; Sharma, S.; Raliya, R. Nanotechnology: Interdisciplinary science of applications. Afr. J. Biotechnol. 2013, 12, 219–226. [Google Scholar]
  28. Brady, N.C.; Weil, R.R.; Weil, R.R. The Nature and Properties of Soils; Prentice Hall: Upper Saddle River, NJ, USA, 2008; Volume 13. [Google Scholar]
  29. Ameen, F.; Alsamhary, K.; Alabdullatif, J.A.; Alnadhari, S. A review on metal-based nanoparticles and their toxicity to beneficial soil bacteria and fungi. Ecotoxicol. Environ. Saf. 2021, 213, 112027. [Google Scholar] [CrossRef]
  30. Perea Vélez, Y.S.; Carrillo-González, R.; González-Chávez, M.d.C.A. Interaction of metal nanoparticles–plants–microorganisms in agriculture and soil remediation. J. Nanopart. Res. 2021, 23, 206. [Google Scholar] [CrossRef]
  31. Asadishad, B.; Chahal, S.; Akbari, A.; Cianciarelli, V.; Azodi, M.; Ghoshal, S.; Tufenkji, N. Amendment of agricultural soil with metal nanoparticles: Effects on soil enzyme activity and microbial community composition. Environ. Sci. Technol. 2018, 52, 1908–1918. [Google Scholar] [CrossRef] [Green Version]
  32. Kurczynska, E.; Sala, K.; Godel-Jedrychowska, K.; Milewska-Hendel, A. Nanoparticles-Plant interaction: What we know, where we are? Appl. Sci. 2021, 11, 5473. [Google Scholar] [CrossRef]
  33. Khan, M.R.; Adam, V.; Rizvi, T.F.; Zhang, B.; Ahamad, F.; Jośko, I.; Zhu, Y.; Yang, M.; Mao, C. Nanoparticle–Plant interactions: Two-way traffic. Small 2019, 15, 1901794. [Google Scholar] [CrossRef]
  34. Dai, Y.; Wang, Z.; Zhao, J.; Xu, L.; Xu, L.; Yu, X.; Wei, Y.; Xing, B. Interaction of CuO nanoparticles with plant cells: Internalization, oxidative stress, electron transport chain disruption, and toxicogenomic responses. Environ. Sci. Nano 2018, 5, 2269–2281. [Google Scholar] [CrossRef]
  35. Misra, S.K.; Dybowska, A.; Berhanu, D.; Croteau, M.N.; Luoma, S.N.; Boccaccini, A.R.; Valsami-Jones, E. Isotopically modified nanoparticles for enhanced detection in bioaccumulation studies. Environ. Sci. Technol. 2012, 46, 1216–1222. [Google Scholar] [CrossRef] [PubMed]
  36. Rostami-Tapeh-Esmaeil, E.; Golshan, M.; Salami-Kalajahi, M.; Roghani-Mamaqani, H. Synthesis of copper and copper oxide nanoparticles with different morphologies using aniline as reducing agent. Solid State Commun. 2021, 334–335, 114364. [Google Scholar] [CrossRef]
  37. Fukai, T.; Ushio-Fukai, M.; Kaplan, J.H. Copper transporters and copper chaperones: Roles in cardiovascular physiology and disease. Am. J. Physiol. Cell Physiol. 2018, 315, C186–C201. [Google Scholar] [CrossRef] [PubMed]
  38. Printz, B.; Lutts, S.; Hausman, J.F.; Sergeant, K. Copper trafficking in plants and its implication on cell wall dynamics. Front. Plant Sci. 2016, 7, 601. [Google Scholar] [CrossRef] [Green Version]
  39. Yruela, I. Copper in plants. Braz. J. Plant Physiol. 2005, 17, 145–156. [Google Scholar] [CrossRef] [Green Version]
  40. Mustafa, S.K.; Al Sharif, M.A. Copper (Cu) an essential redox-active transition metal in living system—A review article. Am. J. Anal. Chem. 2018, 9, 15–26. [Google Scholar] [CrossRef] [Green Version]
  41. Shen, J.; Griffiths, P.T.; Campbell, S.J.; Utinger, B.; Kalberer, M.; Paulson, S.E. Ascorbate oxidation by iron, copper and reactive oxygen species: Review, model development, and derivation of key rate constants. Sci. Rep. 2021, 11, 7417. [Google Scholar] [CrossRef]
  42. Yruela, I. Copper in plants: Acquisition, transport and interactions. Funct. Plant Biol. 2009, 36, 409–430. [Google Scholar] [CrossRef] [Green Version]
  43. Kumari, P.; Panda, P.K.; Jha, E.; Pramanik, N.; Nisha, K.; Kumari, K.; Soni, N.; Mallick, M.A.; Verma, S.K. Molecular insight to in vitro biocompatibility of phytofabricated copper oxide nanoparticles with human embryonic kidney cells. Nanomedicine 2018, 13, 2415–2433. [Google Scholar] [CrossRef]
  44. Hemmati, S.; Ahmeda, A.; Salehabadi, Y.; Zangeneh, A.; Zangeneh, M.M. Synthesis, characterization, and evaluation of cytotoxicity, antioxidant, antifungal, antibacterial, and cutaneous wound healing effects of copper nanoparticles using the aqueous extract of Strawberry fruit and L-Ascorbic acid. Polyhedron 2020, 180, 114425. [Google Scholar] [CrossRef]
  45. Sulaiman, G.M.; Tawfeeq, A.T.; Jaaffer, M.D. Biogenic synthesis of copper oxide nanoparticles using Olea europaea leaf extract and evaluation of their toxicity activities: An in vivo and in vitro study. Biotechnol. Prog. 2018, 34, 218–230. [Google Scholar] [CrossRef]
  46. Crisan, M.C.; Teodora, M.; Lucian, M. Copper nanoparticles: Synthesis and characterization, physiology, toxicity and antimicrobial applications. Appl. Sci. 2021, 12, 141. [Google Scholar] [CrossRef]
  47. Rodhe, Y.; Skoglund, S.; Wallinder, I.O.; Potácová, Z.; Möller, L. Copper-based nanoparticles induce high toxicity in leukemic HL60 cells. Toxicol. In Vitro 2015, 29, 1711–1719. [Google Scholar] [CrossRef] [PubMed]
  48. Gao, X.; Avellan, A.; Laughton, S.; Vaidya, R.; Rodrigues, S.M.; Casman, E.A.; Lowry, G.V. CuO nanoparticle dissolution and toxicity to wheat (Triticum aestivum) in rhizosphere soil. Environ. Sci. Technol. 2018, 52, 2888–2897. [Google Scholar] [CrossRef] [PubMed]
  49. Bakshi, M.; Singh, H.; Abhilash, P. The unseen impact of nanoparticles: More or less? Curr. Sci. 2014, 106, 350–352. [Google Scholar]
  50. Nel, A.; Xia, T.; Mädler, L.; Li, N. Toxic potential of materials at the nanolevel. Science 2006, 311, 622–627. [Google Scholar] [CrossRef] [Green Version]
  51. Wang, X.; Cai, Q.; Jiang, W.; Qu, X. Assessing impacts of a dam construction on benthic macroinvertebrate communities in a mountain stream. Fresenius Environ. Bull. 2013, 22, 103–110. [Google Scholar]
  52. Baqer, A.A.; Matori, K.A.; Al-Hada, N.M.; Kamari, H.M.; Shaari, A.H.; Saion, E.; Chyi, J.L.Y. Copper oxide nanoparticles synthesized by a heat treatment approach with structural, morphological and optical characteristics. J. Mater. Sci. Mater. Electron. 2018, 29, 1025–1033. [Google Scholar] [CrossRef]
  53. Zhou, X.-X.; Liu, J.-F.; Geng, F.-L. Determination of metal oxide nanoparticles and their ionic counterparts in environmental waters by size exclusion chromatography coupled to ICP-MS. NanoImpact 2016, 1, 13–20. [Google Scholar] [CrossRef]
  54. Pereira, P.S.; van de Flierdt, T.; Hemming, S.R.; Hammond, S.J.; Kuhn, G.; Brachfeld, S.; Doherty, C.; Hillenbrand, C.-D. Geochemical fingerprints of glacially eroded bedrock from West Antarctica: Detrital thermochronology, radiogenic isotope systematics and trace element geochemistry in Late Holocene glacial-marine sediments. Earth-Sci. Rev. 2018, 182, 204–232. [Google Scholar] [CrossRef] [Green Version]
  55. Morrison, D.A.; Morris, E.C. Pseudoreplication in experimental designs for the manipulation of seed germination treatments. Austral Ecol. 2000, 25, 292–296. [Google Scholar] [CrossRef]
  56. Ranal, M.A.; Santana, D.G.d.; Ferreira, W.R.; Mendes-Rodrigues, C. Calculating germination measurements and organizing spreadsheets. Braz. J. Bot. 2009, 32, 849–855. [Google Scholar] [CrossRef] [Green Version]
  57. Kopittke, P.M.; Kinraide, T.B.; Wang, P.; Blamey, F.P.C.; Reichman, S.M.; Menzies, N.W. Alleviation of Cu and Pb rhizotoxicities in cowpea (Vigna unguiculata) as related to ion activities at root-cell plasma membrane surface. Environ. Sci. Technol. 2011, 45, 4966–4973. [Google Scholar] [CrossRef] [PubMed]
  58. Ferreira, T.; Rasband, W. ImageJ User Guide IJ 1.46r; Technical Report; National Institutes of Health: Bethesda, MA, USA, 2012.
  59. Marzouk, E.R.; Chenery, S.R.; Young, S.D. Predicting the solubility and lability of Zn, Cd, and Pb in soils from a minespoil-contaminated catchment by stable isotopic exchange. Geochim. Cosmochim. Acta 2013, 123, 1–16. [Google Scholar] [CrossRef]
  60. Ritz, C.; Baty, F.; Streibig, J.C.; Gerhard, D. Dose-response analysis using R. PLoS ONE 2015, 10, e0146021. [Google Scholar] [CrossRef] [Green Version]
  61. Van der Vliet, L.; Ritz, C. Statistics for analyzing ecotoxicity test data. In Encyclopedia of Aquatic Ecotoxicology; Springer: New York, NY, USA, 2013; pp. 1081–1096. [Google Scholar]
  62. Nabulo, G.; Black, C.; Young, S. Trace metal uptake by tropical vegetables grown on soil amended with urban sewage sludge. Environ. Pollut. 2011, 159, 368–376. [Google Scholar] [CrossRef]
  63. Shetaya, W.H.; Bailey, E.H.; Young, S.D.; Mohamed, E.F.; Antoniadis, V.; Rinklebe, J.; Shaheen, S.M.; Marzouk, E.R. Soil and plant contamination by potentially toxic and emerging elements and the associated human health risk in some Egyptian environments. Environ. Geochem. Health 2021. [Google Scholar] [CrossRef]
  64. Liu, Q.; Chen, B.; Wang, Q.; Shi, X.; Xiao, Z.; Lin, J.; Fang, X. Carbon nanotubes as molecular transporters for walled plant cells. Nano Lett. 2009, 9, 1007–1010. [Google Scholar] [CrossRef]
  65. Zhang, H.; Smith, J.A.; Oyanedel-Craver, V. The effect of natural water conditions on the anti-bacterial performance and stability of silver nanoparticles capped with different polymers. Water Res. 2012, 46, 691–699. [Google Scholar] [CrossRef]
  66. Majedi, S.M.; Kelly, B.C.; Lee, H.K. Role of combinatorial environmental factors in the behavior and fate of ZnO nanoparticles in aqueous systems: A multiparametric analysis. J. Hazard. Mater. 2014, 264, 370–379. [Google Scholar] [CrossRef]
  67. Pettibone, J.M.; Adamcakova-Dodd, A.; Thorne, P.S.; O’Shaughnessy, P.T.; Weydert, J.A.; Grassian, V.H. Inflammatory response of mice following inhalation exposure to iron and copper nanoparticles. Nanotoxicology 2008, 2, 189–204. [Google Scholar] [CrossRef]
  68. Hejazy, M.; Koohi, M.K.; Bassiri Mohamad Pour, A.; Najafi, D. Toxicity of manufactured copper nanoparticles—A review. Nanomed. Res. J. 2018, 3, 1–9. [Google Scholar]
  69. Sekine, R.; Marzouk, E.; Khaksar, M.; Scheckel, K.G.; Stegemeier, J.P.; Lowry, G.V.; Donner, E.; Lombi, E. Ageing of dissolved copper and copper-based nanoparticles in five different soils: Short term kinetics vs long term fate. J. Environ. Qual. 2017, 46, 1198–1205. [Google Scholar] [CrossRef] [PubMed] [Green Version]
  70. McShane, H.V.; Sunahara, G.I.; Whalen, J.K.; Hendershot, W.H. Differences in soil solution chemistry between soils amended with nanosized CuO or Cu reference materials: Implications for nanotoxicity tests. Environ. Sci. Technol. 2014, 48, 8135–8142. [Google Scholar] [CrossRef] [Green Version]
  71. Clogston, J.D.; Patri, A.K. Zeta potential measurement. Methods Mol. Biol. 2011, 697, 63–70. [Google Scholar]
  72. Kadu, P.J.; Kushare, S.S.; Thacker, D.D.; Gattani, S.G. Enhancement of oral bioavailability of atorvastatin calcium by self-emulsifying drug delivery systems (SEDDS). Pharm. Dev. Technol. 2011, 16, 65–74. [Google Scholar] [CrossRef]
  73. Servin, A.D.; Pagano, L.; Castillo-Michel, H.; De la Torre-Roche, R.; Hawthorne, J.; Hernandez-Viezcas, J.A.; Loredo-Portales, R.; Majumdar, S.; Gardea-Torresday, J.; Dhankher, O.P. Weathering in soil increases nanoparticle CuO bioaccumulation within a terrestrial food chain. Nanotoxicology 2017, 11, 98–111. [Google Scholar] [CrossRef]
  74. Grillo, R.; Rosa, A.H.; Fraceto, L.F. Engineered nanoparticles and organic matter: A review of the state-of-the-art. Chemosphere 2015, 119, 608–619. [Google Scholar] [CrossRef]
  75. Wang, Z.; Von Dem Bussche, A.; Kabadi, P.K.; Kane, A.B.; Hurt, R.H. Biological and environmental transformations of copper-based nanomaterials. ACS Nano 2013, 7, 8715–8727. [Google Scholar] [CrossRef] [Green Version]
  76. Adam, N.; Schmitt, C.; Galceran, J.; Companys, E.; Vakurov, A.; Wallace, R.; Knapen, D.; Blust, R. The chronic toxicity of ZnO nanoparticles and ZnCl2 to Daphnia magna and the use of different methods to assess nanoparticle aggregation and dissolution. Nanotoxicology 2014, 8, 709–717. [Google Scholar]
  77. Miao, L.; Wang, C.; Hou, J.; Wang, P.; Ao, Y.; Li, Y.; Lv, B.; Yang, Y.; You, G.; Xu, Y. Enhanced stability and dissolution of CuO nanoparticles by extracellular polymeric substances in aqueous environment. J. Nanopart. Res. 2015, 17, 404. [Google Scholar] [CrossRef]
  78. Jośko, I.; Oleszczuk, P. Influence of soil type and environmental conditions on ZnO, TiO2 and Ni nanoparticles phytotoxicity. Chemosphere 2013, 92, 91–99. [Google Scholar] [CrossRef]
  79. Wang, X.; Wei, Z.; Liu, D.; Zhao, G. Effects of NaCl and silicon on activities of antioxidative enzymes in roots, shoots and leaves of alfalfa. Afr. J. Biotechnol. 2011, 10, 545–549. [Google Scholar]
  80. Siddiqui, M.H.; Al-Whaibi, M.H. Role of nano-SiO2 in germination of tomato (Lycopersicum esculentum seeds Mill.). Saudi J. Biol. Sci. 2014, 21, 13–17. [Google Scholar] [CrossRef] [PubMed] [Green Version]
  81. Vashisth, A.; Nagarajan, S. Effect on germination and early growth characteristics in sunflower (Helianthus annuus) seeds exposed to static magnetic field. J. Plant Physiol. 2010, 167, 149–156. [Google Scholar] [CrossRef] [PubMed]
  82. Abbasi Khalaki, M.; Ghorbani, A.; Moameri, M. Effects of silica and silver nanoparticles on seed germination traits of Thymus kotschyanus in laboratory conditions. J. Rangel. Sci. 2016, 6, 221–231. [Google Scholar]
  83. Barrena, R.; Casals, E.; Colón, J.; Font, X.; Sánchez, A.; Puntes, V. Evaluation of the ecotoxicity of model nanoparticles. Chemosphere 2009, 75, 850–857. [Google Scholar] [CrossRef] [Green Version]
  84. Yin, L.; Colman, B.P.; McGill, B.M.; Wright, J.P.; Bernhardt, E.S. Effects of silver nanoparticle exposure on germination and early growth of eleven wetland plants. PLoS ONE 2012, 7, e47674. [Google Scholar] [CrossRef] [Green Version]
  85. Shah, V.; Belozerova, I. Influence of metal nanoparticles on the soil microbial community and germination of lettuce seeds. Water Air Soil Pollut. 2009, 197, 143–148. [Google Scholar] [CrossRef]
  86. Adhikari, T.; Kundu, S.; Biswas, A.K.; Tarafdar, J.C.; Rao, A.S. Effect of copper oxide nano particle on seed germination of selected crops. J. Agric. Sci. Technol. A 2012, 2, 815. [Google Scholar]
  87. Hafeez, A.; Razzaq, A.; Mahmood, T.; Jhanzab, H.M. Potential of copper nanoparticles to increase growth and yield of wheat. J. Nanosci. Adv. Technol. 2015, 1, 6–11. [Google Scholar]
  88. Bour, A.; Mouchet, F.; Silvestre, J.; Gauthier, L.; Pinelli, E. Environmentally relevant approaches to assess nanoparticles ecotoxicity: A review. J. Hazard. Mater. 2015, 283, 764–777. [Google Scholar] [CrossRef] [PubMed]
  89. Lee, W.M.; An, Y.J.; Yoon, H.; Kweon, H.S. Toxicity and bioavailability of copper nanoparticles to the terrestrial plants mung bean (Phaseolus radiatus) and wheat (Triticum aestivum): Plant agar test for water–insoluble nanoparticles. Environ. Toxicol. Chem. Internat. J. 2008, 27, 1915–1921. [Google Scholar] [CrossRef] [PubMed]
  90. Falco, W.F.; Queiroz, A.M.; Fernandes, J.; Botero, E.R.; Falcão, E.A.; Guimarães, F.E.G.; M’Peko, J.C.; Oliveira, S.L.; Colbeck, I.; Caires, A.R.L. Interaction between chlorophyll and silver nanoparticles: A close analysis of chlorophyll fluorescence quenching. J. Photochem. Photobiol. A Chem. 2015, 299, 203–209. [Google Scholar] [CrossRef]
  91. Moustakas, M.; Malea, P.; Haritonidou, K.; Sperdouli, I. Copper bioaccumulation, photosystem II functioning, and oxidative stress in the seagrass Cymodocea nodosa exposed to copper oxide nanoparticles. Environ. Sci. Pollut. Res. 2017, 24, 16007–16018. [Google Scholar] [CrossRef]
  92. Marzouk, E.R.; Ismai, S.A.; Hamza, A.F. Toxicity of Synthesized Copper Nanoparticles to Soybean: Deferential Effects of Nano and Bulk-Size Particles on Root Elongation Rate. In Proceedings of the 3rd International Conference on Sustainable Agriculture and Environment (3rd ICSAE), Warsaw, Poland, 26–28 September 2016. [Google Scholar]
  93. Zhang, Z.; Ke, M.; Qu, Q.; Peijnenburg, W.; Lu, T.; Zhang, Q.; Ye, Y.; Xu, P.; Du, B.; Sun, L. Impact of copper nanoparticles and ionic copper exposure on wheat (Triticum aestivum L.) root morphology and antioxidant response. Environ. Pollut. 2018, 239, 689–697. [Google Scholar] [CrossRef] [PubMed]
  94. Watson, J.-L.; Fang, T.; Dimkpa, C.O.; Britt, D.W.; McLean, J.E.; Jacobson, A.; Anderson, A.J. The phytotoxicity of ZnO nanoparticles on wheat varies with soil properties. Biometals 2015, 28, 101–112. [Google Scholar] [CrossRef]
Figure 1. TEM image (a), UV–vis absorption (b), DLS (c), zeta potential (d), and EDX spectra (e) of CuO NPs confirm nanosize and the elemental composition.
Sustainability 14 04914 g001
Figure 2. Dissolution kinetics of CuO NPs in 0.01 M Ca(NO3)2. The data were fitted to a modified first-order reaction equation. Error bars (very small) represent standard deviations (n = 2).
Sustainability 14 04914 g002
Figure 3. Seedling growth of wheat affected by different concentrations of dissolved Cu (bulk Cu) and CuO NPs in a soil-less experiment.
Sustainability 14 04914 g003
Figure 4. Seed vigor index of wheat affected by different concentrations of bulk Cu (a) and CuO NPs (b). Different letters showed significant differences among means (at 0.05% probability, Tukey test).
Sustainability 14 04914 g004
Figure 5. Relationship between vigor index and bulk Cu (a), CuO NPs (b) concentrations. Broken line represents a linear relationship.
Sustainability 14 04914 g005
Figure 6. Delta vigor index of wheat seed (ΔVi = Vi CuO NPs − Vi Bulk Cu) as a function of Cu concentrations. Broken line represents the border between negative and positive values.
Sustainability 14 04914 g006
Figure 7. Fresh weight (g) of the wheat shoot (a) and root (b) system is affected by different concentrations of both bulk Cu and CuO NPs. Error bars represent the standard deviation of triplicates.
Sustainability 14 04914 g007
Figure 8. Dry weight (g) of the wheat shoot (a) and root (b) system affected by different concentrations of both bulk Cu and CuO NPs. Error bars represent the standard deviation of triplicates.
Sustainability 14 04914 g008
Figure 9. Copper concentrations in wheat plant tissue as a function of different additions of bulk Cu (a) and CuO NPs (b). Error bars represent the standard deviation of duplicates, while broken line represents linear relationship.
Sustainability 14 04914 g009
Figure 10. Chlorophyll content (mg kg−1, FW) as a function of different Cu concentrations. Error bars represent the standard deviation of triplicates (a). Correlation between Chlorophyll content (mg kg−1, FW) and different bulk Cu and CuO NPs. The broken line represents exponential relationship (b).
Sustainability 14 04914 g010
Figure 11. Effect of increasing bulk Cu (a) and CuO NPs (b) concentrations (log scaled) mg L−1 on root elongation rate (RER, mm h−1) of wheat after 24 h of growth. The solid line represents the log-logistic model to calculate EC50 concentration. Error bars represent standard error for four replicates.
Sustainability 14 04914 g011
Figure 12. Correlation between measured and modeled values of root elongation rate of wheat as affected by bulk Cu (a) and CuO NPs (b) at different concentrations. The dashed line represents a 1:1 relationship.
Sustainability 14 04914 g012
Table 1. Copper concentration (µg L−1) was measured in the Ca(NO3)2 electrolyte due to CuO NPs dissolution outside the dialysis tube as a function of time (h).
Time (h)Cu Concentration (µg L−1)Standard Deviation
0.542.70.259
11761.130
23624.580
46562.680
68070.682
89865.300
1010664.740
12113612.500
24127311.300
36137224.000
48138811.400
72146924.000
9815029.140
Table 2. Germination measurements (mean ± SD) of wheat seeds treated by either bulk Cu or CuO NPs at different concentrations (mg L−1). Means followed by the same letters in each column are not significant different based on the Tukey test at 0.05 probability (G: germinability; t: mean germination time; CVt: coefficient of variation of the germination time; v: mean germination rate).
Cu, mg L−1G (%)t (Day)CVt (%)v (Day −1)
Bulk Cu
0.00100 ± 0.0 a1.77 ± 0.028 bc31.5 ± 0.611 a0.57 ± 0.009 b
0.10100 ± 0.0 a1.50 ± 0.00 c36.7 ± 0.456 a0.67 ± 0.00 a
0.20100 ± 0.0 a1.81 ± 0.022 b31.9 ± 0.815 a0.55 ± 0.007 b
0.50100 ± 0.0 a1.93 ± 0.022 ab37.3 ± 985 a0.52 ± 0.005 bc
1.00100 ± 0.0 a2.00 ± 0.019 ab31.8 ± 1.06 a0.50 ± 0.007 bc
2.00100 ± 0.0 a2.04 ± 0.027 ab36.1 ± 0.56 a0.49 ± 0.004 bc
5.00100 ± 0.0 a2.02 ± 0.016 ab37.6 ± 0.824 a0.49 ± 0.003 bc
10.0100 ± 0.0 a2.19 ± 0.013 a36.3 ± 0.831 a0.46 ± 0.003 c
CuO NPs
0.00100 ± 0.0 a1.77 ± 0.028 a31.5 ± 0.611 a0.57 ± 0.009 a
0.10100 ± 0.0 a1.54 ± 0.037 a34.1 ± 0.651 a0.66 ± 0.016 a
0.20100 ± 0.0 a1.71 ± 0.009 a33.3 ± 0.494 a0.58 ± 0.003 a
0.50100 ± 0.0 a1.67 ± 0.016 a34.9 ± 0.799 a0.60 ± 0.06 a
1.00100 ± 0.0 a1.73 ± 0.028 a30.5 ± 0.535 a0.58 ± 0.010 a
2.00100 ± 0.0 a1.71 ± 0.014 a34.2 ± 0.441 a0.59 ± 0.005 a
5.00100 ± 0.0 a1.92 ± 0.054 a50.6 ± 1.46 b0.53 ± 0.016 a
10.096.7 ± 0.62 a1.81 ± 0.037 a51.1 ± 0.342 b0.56 ± 0.011 a
Publisher’s Note: MDPI stays neutral with regard to jurisdictional claims in published maps and institutional affiliations.

