Abstract
Urban renewal projects worldwide focus mainly on resolving motorized, personal, and low occupancy problems instead of sustainable mobility. As part of the process, traditional field audits have a high cost in time and resources. This paper reviews a spatial model of accessibility and habitability of the streets, oriented to the location of the volume of people moving sustainably out of an extensive street network. The exercise site is in the Monterrey Metropolitan Area, the second largest in Mexico. Here, the population that moves sustainably as the collective (public and enterprise transportation) and the active (cycling, walking, and others) represents a considerable portion (49%) of travelers, thus, confirming the need for intervention. The spatial model is elaborated in a Geographical Information System (GIS), and the main results are compared with the actual public transport demand using a neural networks process. The results of the tool as a predictor have a 91% efficiency, making it possible to determine the location of urban renewal projects related to the volume of people moving sustainably.
1. Introduction
The actual tendencies in the construction of the cities and their streets are heavily influenced by epistemic postures that consider the road network purely for motorized, private, and low occupancy vehicles. The call for a change is not new, and it is evidenced by a diversity of authors from many parts of the world in a continuous critical analysis of the construction of cities, particularly the street networks. This paper reviews how this paradigm will shift the focus of Mexican cities and then adds a literature review about the spatial models and results that will influence the future of the built environment.
1.1. The Continuous Critical Analysis of the Construction of Cities and the Street Networks
Cities often reflect the oppression that plagues lower socioeconomic groups, particularly the poorest and most vulnerable. [1]. Unfortunately, this is an ongoing struggle since the status quo is strongly supported by the economic profit of the automobile industry. Next, we provide a short review about this critical analysis.
The acknowledgment the car–city paradigm was an issue of concern in the construction of cities and specifically their road networks started around the 1960s with publications in the United States. According to these studies, the car–city paradigm was provoked by rationalism and modernism, which enabled the orthodox urbanism [2]. The author of one such study proposed instead an environment of vibrant and healthy neighbors, where sidewalks are the central mechanism of the organization of the cities [2]. Later in the decade, a similar French study used the term le Droit à la ville as a counter to such policies as the privatization of public spaces [3]. Here, the streets were an important part of the framework, as evidenced by how the movement proposed that the lower classes have the potential and capability to create and produce the city. Critical analysis was continued in Denmark at the beginning of the 1970s. This analysis was mainly about the morphology of sprawling suburbs and multistory buildings, along with the disappearance of streets and squares dedicated for public spaces [4].
In the 1980s across North America, pedestrian streets were acknowledged as successful. At the same time, it was criticized that engineers, architects, or even entrepreneurs, rather than everyday potential users, were designing the spaces [5]. The formation of new urban infrastructure that has had a lasting impact marked this decade [6].
By the 1990s, the concept of the global city gained favor, expressing the effects of neo-liberalism in capital cities of the world, where the inequalities between socioeconomic sectors were expanded [7]. A few years later, the concept of the global street explored the differences between the routine activity of European streets and the rawer, new forms of some developing nations [8]. In the 2000s, it was described in Spain that the vehicular transit phenomenon was equal to a gas inside a tubular network because it always works to expand to all the available space [9]. This need for space will justify and eventually permit road sections with 26 lanes, 100 m wide for vehicles. That represents the width of a regular urban block.
Lastly, in Italy, one approach to the urban transit phenomenon has been what is called resurgent tactical urbanism. Those who are working for change rally to the cause vowing to change from street for traffic, to street for people [10]. The former is evidenced by the persistence of urban projects that continue to prioritize the mobility of private motorized vehicles [11,12]. In addition, the continuing emphasis on private vehicles justifies the requirement for field audits of every urban project to ensure that personal mobility purpose are being considered. Such projects are costly in terms of both human and time resources, and much of the time, this information is not public, among other issues [13,14,15].
1.2. Mexican Cities, Urban Process, and Their Street Networks
Mexican cities have a similar tendency in addition to other complicated urban issues: low densities, null connectivity, and urban dispersion. Other social, economic, and urban effects, such as infrastructure deterioration, speculation, land-use changes, or decline are also problematic [16].
As for the mobility system, [17] exposes the Guadalajara Metropolitan Area, the third largest in the country, where urban development around the principal avenues has been criticized for promoting the adverse effects already described [17].
Ciudad de México (CDMX) is the capital city of Mexico and its most extensive metropolitan area. Here, there is a difference of opinion regarding what constitutes a public space or a street. Nevertheless, the attitude is that it is better to allude to a technical problem rather than a social problem. Therefore, there is always suspicion about how decisions for the urban interventions and construction are made [18].
To resume the Mexican context, the posture of [19] is relevant and similar to what Bourdieu did for the Anglo and European contexts. It recognizes all the abovementioned issues as they apply to the construction of Mexican cities [19]. In addition, citing Marxism as a critical attitude that helps understand the urban issues of Mexico, the author noted enquanto houver capitalismo - e atitude anticapitalista -, haverá marxismo, adding an evolution of Marxism as a framework with the same pace as the evolution of capitalism [19]. This attitude is the basis for recognizing the effects as well as the causes of this type of construction of cities and streets. For a better understanding, it is proposed to formulate questions that help in the research and gathering of data. Questions such as:
- What socio-spatial inequities are introduced with infrastructure improvements that facilitate mobility?
- Which socioeconomic groups are favored and how?
In that regard, an analysis of the federal budget for infrastructure, provided by [20], shows that the budget is not proportionally distributed. Rather, it has an imbalance that favors the investments for private motorized and low occupancy vehicles, with 70.6% of the budget. Then, 14.3% is set aside for energy and communications infrastructure. Furthermore, the budget dedicated to sustainable mobility represents 15.6%, with the most representative being the pedestrian infrastructure with 10.38%. Public transport has 3.53%, green infrastructure 1.16%, and cycling 0.5% [20]. With this information, a better question is:
- Which socioeconomic groups need upgrades provided by urban interventions, and how do you locate such groups in an entire street network of a metropolitan area?
1.3. Literature Review about Spatial Models for Accessibility and Habitability
The Public Space Accessibility Tool (PSAT) is an urban model that examines all street segments in a city, using certain variables of international and established accessibility (AC) and habitability (HA) indicators as primary references. These variables are related to Mexican cities, with official data provided by Instituto Nacional de Estadística y Geografía (INEGI).
The measured data of this type of spatial model support the intervention of public and private urban renewal projects, helping orientate them to sustainable mobility, as [14,21,22] confirm. Therefore, an indicator that better predicts and helps locate streets with potentially the most activity, like [23] uses for predicting demand for e-scooters, is needed.
Some benefits of the PSAT are the characterization of the urban environment with these AC and HA variables, which helps inform other urban phenomena related to sustainable mobility, such as road incidence [24,25], sustainable travel behavior [26,27], new electric modes [28], or street vending [29]. Finally, this tool elaborates the term accessibility of the public space to provide a paradigm in which the street network of a city is a type of public space, therefore a habitat, so it needs measurable AC and HA characteristics. Thus, the selection of the variables is oriented to sustainable mobility, representing a fundamental part of the PSAT. Another benefit is reducing the field audit cost and times in mobility and urban studies [13].
Table 1 displays a direct relation of the variables selected by five known AC and HA models, with the variables selected by the PSAT given the official data available. This describes each model and better explains the relationship between the variables.

Table 1.
Relation of variables and spatial models selected.
The first column displays the PSAT variables, given the official data. All of the variables from official references were provided by INEGI, different programs, and all public and accessible information. A first reference, by the Inventario Nacional de Vivienda (INV), gives variables of infrastructure characteristics, such as the existence of trees, urban lights, and others, in the street network. A second reference, by Directorio Estadístico Nacional de Unidades Económicas (DENUE), provides variables of activities such as jobs, schools, commerce, and others. Other references such as housing densities were provided by the Censo General de Población y Vivienda (CENSO). After carefully reviewing this information, the variables better correlate with the following known models, row by row.
The second column shows the variables from Salvador Rueda (2010), who elaborated a list of 50 indicators for urban planning in the city of Vitoria-Gasteiz [30]. Precisely, it displays the variables from the habitability and services of the public space, a qualification made for all segments of a street network. It is a primary reference for the PSAT framework and a principal component for HA variables to measure the street such as proximity to activities, services, and housing.
The third column displays the variables that Holly Krambeck (2006) compiled for a walkability index oriented to developing countries in research funded by the World Bank [31]. It provided most of the AC variables such as infrastructure conditions and incidence.
Another base of research was given in the fourth column by the popular walkability application, the WalkScore (2011), which provides a series of variables that qualify a site to be compared with other places [32]. It combines HA and AC variables, similar to Krambeck or Rueda, with specific differences such as proximity to commerce and retail or transit-oriented development qualifications.
The following columns represent a branch of authors oriented toward forecasting volume population activity on the streets. The fifth column is the Ewing and Cervero (2010) research, a weighted average of all the built environments related to travel from the literature found up to 2009. They found differentiation between the modes of traveling and the built environment [33].
Finally, the sixth column is based on Boer et al. (2007) who analyzed 10 metropolitan areas of the United States with similar variables such as the number of businesses, housing density, and others, finding a correlation with the number of trips declared in the national surveys [34].
1.4. Models Measured by Field Audits
It is essential to also review the results of models that were compared with field counting, either made by the government or by the author. This will establish a measure to compare with the results of the present exercise.
Similar variables are cited by Liu & Griswold (2009)in a San Francisco metropolitan area study. The variables job and population density, local transit access, and land use mix explain the pedestrian volume, with a percent between 70 and 80 [35].
A similar study was made by Dhanani et al. (2017), in which they compared the area comprised of the whole of Greater London. The exercise found a 92% explanation of the total variation in the pedestrian density data, with certain variables such as population density, diversity of uses, closeness to the central district polygonal, and combined public transport choices [36].
Chen et al. (2020) completed an exercise in which they found a correlation between a pedestrian-counting in-field audit and the street view imagery in a selected zone in the city of Tianjin, China [15]. This methodology did not qualify a place but just recognized the existence of people in the street view imagery, with a confirmation of about 80% in levels of agreement with the pedestrian counting in the field audit.
In aother study, [37] compared the relationships between land uses around metro stations and the passenger flow, using the data from smart cards. They used mathematical and NN models for the prediction, having the NN as the most reliable tool, with mean absolute percentage errors (MAPEs) of 3.24%.
Another related study by [38] displayed an interaction between certain land uses and the relation with dockless bike-sharing systems. Here, they used official data in the Shanghai metropolitan area to compare the effects of the built environment with bike-sharing systems. The results display how significantly some uses are related to more considerable distance decay, while others are related to shorter distance decay.
Finally, a study by [39] detailed a prediction system for real-time traffic states in three metropolitan areas, Berlin, Istanbul, and Moscow. The data provided was on a large scale for each example, and the results were compared using a deep-learning architecture.
1.5. Summary Work
This work is divided into the following sections: Section 2 introduces technical information for the development of methodology and the process to produce data with the PSAT indicator applied in Monterrey, the second most extensive metropolitan area of Mexico. The results are compared with the total ascents and descents of all the public transport networks using neural networks. Section 3 presents the results of the correlation and visualization of certain sectors of the territory. Section 4 display discussions about the results and debates for the prioritization of urban renewal projects. Finally, Section 5 shows the conclusions as a summary of the paper, the contributions, and future work.
2. Materials and Methods
This section reviews specific official data from the selected zone as the primary material to understand the context of this city and metropolitan area. Then, it describes the methodology of both the PSAT and NN process to facilitate the data comparison.
2.1. Monterrey Metropolitan Data Context
The Monterrey Metropolitan Area (MMA) is one of the most dynamic societies nationally, with an economic and competitiveness culture that reciprocates over the street network configuration [40]. The type of mobility chosen by its population is evident in the last official poll made by the Nuevo Leon administration [41]. For one side, the sustainable mobility, grouped by the collective: 20.1% of people move by public transport, 4.2% by enterprise transport and scholar transport 1.9%; and the active: 18.3% of people move by walking, 4% by scooter, skate, and others, and 0.7% by cycling. All of that adds to 49.2% of the population moving in a sustainable model.
In other words, there are almost half of the trips in the MMA represented by people moving sustainably. On the other side, the not so sustainable mobility is composed of 50.8% of people that move by motorized, private, and low-occupancy vehicles [41].
There is also a concern about the construction capability of governments and the actual scope representing the extension of a road network in a metropolitan area. On the one hand, the construction capability of the road network, either for new streets or for urban renewal projects in a public administration of three years is limited. Considering all the 18 municipal governments that comprise the MMA, the capabilities equal an estimated 1,800 km of intervention according to a review of all the government official journals [42]. On the other hand, the total MMA street network comprises approximately 17,336 km. Therefore, it will need a significant deal of time, approximately 10 administrations of 3 years each, totaling 30 years, for interventions that reach every neighbor and zone of the MMA street network.
All of the latter represent the difficulty for a process to locate and establish strategies and priorities of intervention in the MMA street network. This problem is potentially replicated in most cities and metropolitan areas of the country.
2.2. Public Space Accessibility Tool Data and Method
The contextualization of this tool for Mexican cities is part of an exercise that requires this indicator for continuous testing with other urban phenomena and innovative processes. It is a certainty that, as Alan Wilson (2018) declared, indicators are regularly contested to achieve their usefulness [43]. Yang et al. (2021) confirm that indicators are fundamental for social computing and social management. For that matter, indicators need to utilize both spatial and temporal aspects and variables to correctly achieve a prediction [44].
The variables selected by the PSAT indicator have a value based on 100 points. It was made with a series of focus groups totaling 50 students from architecture and geography universities made by [29]. The students determined the categories that will be used as the qualifications for every street segment of the network. The tool used official data of the street network of the MMA, provided by INEGI [45], for use in a GIS (geographic information systems) software. For this exercise, the Qgis was selected because of the open source availability.
The data results of the PSAT consist of 222,196 street segments, all with a qualification. Every segment is assigned an alphanumeric label for identification purposes. It is essential to consider that specific street segments were taken out of the exercise. For instance, street segments inside private clusters, such as housing or industry blocks, were eliminated. Another type is the street segments with a bad slope for walking and cycling.
Then we located the public transport demand. It was obtained by field audits conducted in a mobility project by the Secretaria de Desarrollo Sustentable (SEDESU) [41] and consisted of all the ascents and descents of the public transport network of the MMA. A joint process in the Qgis software will assign the value of every ascent and descent to the nearest street segments.
The next step consisted of adding both data to the same sheet to compare with the neural network method. Table 2 shows an extract from the entire database formed.
Table 2.
Database extract of the 222,196 street segments that comprise the Monterrey Metropolitan Area.
2.3. Neural Network Method and Results
This section describes the data processing and the selection of the proposed artificial neural network architecture. The back propagation (BP) ANN is the most widely used algorithm for ANN training in machine learning [46,47]. The strengths and weaknesses of the BP-ANN are well known.
Among the BP-ANN disadvantages is that the results depend on the training stage, for which a large amount of data is required. The training must be done offline due to the processing time involved. However, overcoming these limitations, this network balances performance and computational cost since the heaviest workload occurs in training. Recently, artificial intelligence also utilizes stochastic logic to both simplify the topology and maintain robust performance [48].
Various factors measure the performance of a network. However, the mean square error (MSE) and the root mean square error (RMSE) are the most frequent statistical indicator used [49,50]. The measured performance depends mainly on the chosen network architecture. In this work, the architecture was chosen based on the methodology followed in [51], where different combinations of the number of hidden layers and the neurons in these layers experiment. Additionally, different types of activation functions are tested.
The reduction of the MSE was analyzed starting from a reduced number of neurons, and the architecture was made more complex until determining the optimal value of the architecture for this work. The results can be seen in Table 3.
Table 3.
Tests performed to determine network architecture.
The data was divided into subsets for the training, validation, and testing stages in 70%, 15%, and 15%, which implies 2929 data for training, 628 data for validation, and 628 data for testing.
The results indicate that there is a RMSE of 8.24% for indicator A. An error of 8.51% was obtained for indicator B. It shows that the indicators work as estimators of public transport demand. Indicator B presents a more significant error. However, it does not contain variables dependent on the demand for public transport.
A comparison of the errors in the test data for each indicator is observed in Figure 1a,b for indicators A and B, respectively.
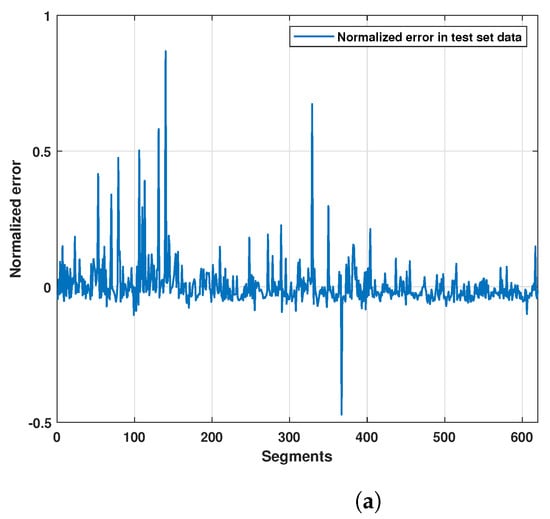
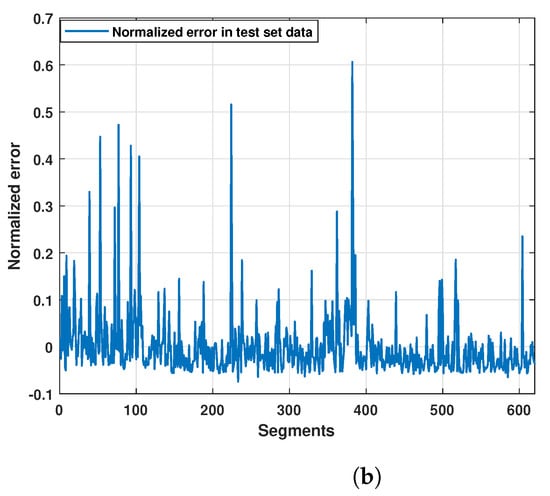
Figure 1.
Normalized in artificial neural network for both indicators: (a) normalized error for indicator A; (b) normalized error for indicator B.
Finally, the distribution and frequency of errors for each indicator are shown in Figure 2a,b.
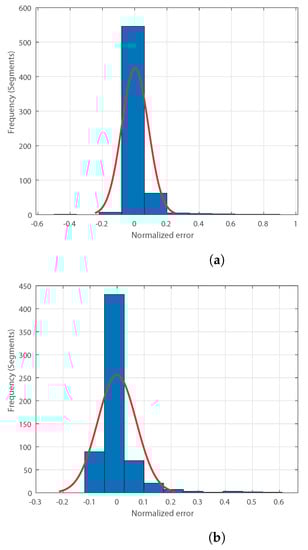
Figure 2.
Errors distributions in artificial neural network for both indicators: (a) error distribution in indicator A; (b) error distribution in indicator B.
3. Results: Presentation and Analysis
For better comprehension of the results, Figure 3 displays a general view of the MMA central area. It shows the street network with the qualification of the PSAT spatial model in a blue color degradation. It is essential to describe that the regular street segments with no value are gray. With more saturation, the value of the qualification means the street segment has more opportunities such as trees, urban lights, jobs, commerce, and others.
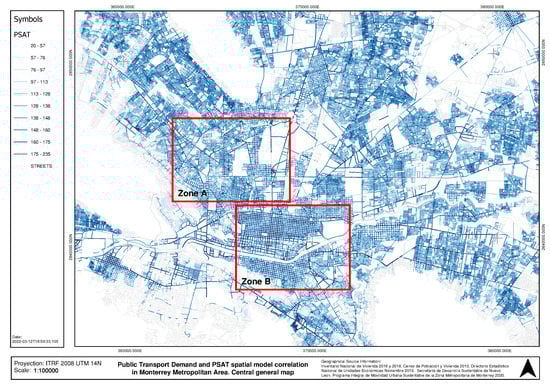
Figure 3.
General view of Monterrey Metropolitan Central Area and the zones in detail.
In addition, two rectangular zones have been marked on the map with red. These zones, named A and B, contain the north and central part of Monterrey city, respectively. It will be displayed in the following figures to better show the results on a magnified scale.
Figure 4 shows Zone A. The image has the regular street network segments in gray and blue, the segments with the two best ranges of qualification of the PSAT model. Moreover, the public transport demand is shown in scalar circles according to the size of the demand, ascents in red and descents in blue. It can be seen that the correlation between the PSAT and the public transport demand is evident. The error percentile is remarkably low, and it can be seen in this territory.
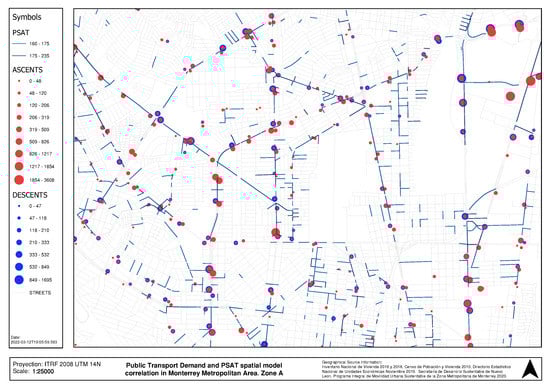
Figure 4.
Zone A of the Monterrey Metropolitan Area.
It also shows that the demand is concentrated in main corridors. It is evident as public transport relies on principal urban avenues for most routes. It implies that not all the extensions of the corridors need to have interventions, but specific segments signaled by the PSAT and the ascents and descents do.
It is essential to mention that the spatial model signals a specific number of street segments near but outside the corridors. It signifies that interventions have to be in principal corridors and around some areas where people walk toward or from a public transport stop. It is important because the needs for intervention are not only in the stop but in a last mile type of urban renewal project.
Figure 5 displays Zone B, which contains the city center of the MMA, the one with the most activity and public transport demand. It can be seen that this demand is confirmed in certain urban avenues that run mostly from south to north. The PSAT indicator has a similar effect in Zone A, in which there are segments around the main avenues that are candidates for urban renewal projects. This zone has even more segments defined because of the city center characteristics, which display more opportunities and activities and more infrastructure and public transport options.
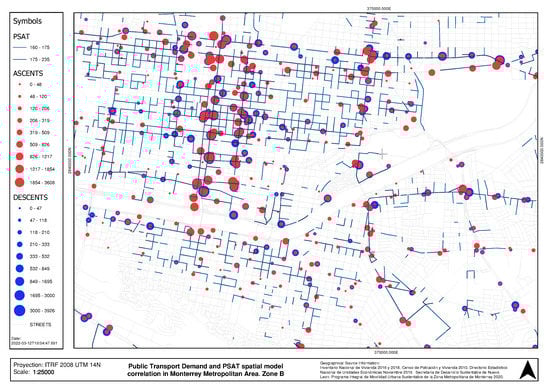
Figure 5.
Zone B of the Monterrey Metropolitan Area.
There are other zones where the logic of blue segments associated with ascents and descents is not so evident. It will need a field evaluation and participatory design exercises with local and government representatives to find the exact lines and zones of intervention.
4. Discussions
Using official and available data, spatial models, and neural networks, to locate the people moving sustainably is relatively cheaper than using extensive and expensive fieldwork, as mentioned in the introduction.
Concerning one of the questions posed earlier in this paper:
- Which socioeconomic groups need upgrades provided by urban interventions, and how do you locate such groups in an entire street network of a metropolitan area?
The official data shows that the socioeconomic groups that need upgrades are the median lower to significantly lower ranges, as are the ones that move sustainably, as described earlier.
For locating the groups that need upgrades, the results of this paper provide an answer. The PSAT model provides a rapid localization of needed urban renewal projects with a low error in an extensive metropolitan area. It gives a great and rapid orientation for public administration strategic projects. This orientation focuses on a significant volume of people already using the public transport and walking the area.
The results shown in Figure 1 indicate that the error in estimating public transport demand using Indicator A and Indicator B is close to zero for most of the estimated segments. However, both indicators show some estimation points with significant errors. The errors in magnitude of the atypical points in the estimation are similar for both indicators.
5. Conclusions
This paper estimates part of the sustainable transport demand in an extensive metropolitan area, using a spatial model to qualify all the street segments of the Monterrey Metropolitan Area and using artificial neural network processing.
The primary results are:
- The correlation displays a deficient error of 8.24%, meaning the PSAT is a capable tool.
- These results create a validity field for the process, the variables selected, and the INEGI official database information.
Given the availability of the information, it provides a basis for running the application in other cities and metropolitan areas of the country, with relatively low cost, compared to traditional field audits. It is replicable in other countries if the database information is similar.
We acknowledge that this work is pervasive and needs mobility and urban planning projects. This significant reduction in the number of field audits is a benefit. These results help to reduce time, work, and finance necessities and open the door for another kind of urban design analysis.
Finally, the significance of locating the people using the street in a sustainable way confirms a correlation between this population and lower social and economic levels. The prioritization of urban renewal projects in these places will impact many of these beneficiaries.
Future works include the potential to implement the PSAT tool in other Mexican cities, given the availability of the data and the low cost of the process. It will help perform a comparative analysis of cities, given the size, localization, and other factors.
Author Contributions
Conceptualization: A.A.B.-L., J.R.-R. and O.R.-A.; methodology: A.F.R., A.A.B.-L. and O.R.-A.; validation: J.R.-R.; formal analysis: A.A.B.-L., J.R.-R. and O.R.-A.; investigation: A.A.B.-L.; resources: J.R.-R.; visualization: A.A.B.-L. and O.R.-A.; writing: A.A.B.-L. and O.R.-A.; original draft, writing: A.A.B.-L. and O.R.-A.; supervision: J.R.-R. and A.F.R. All authors have read and agreed to the published version of the manuscript.
Funding
This work was funded by the National Council of Science and Technology (CONACYT), the Polytechnic University of Queretaro, PRODEP and the Autonomous University of Queretaro (UAQ).
Institutional Review Board Statement
The study was conducted according to the guidelines of the Declaration of Helsinki and submitted at to participating universities for approval and distribution. The Project was approved in the Ethics Committee session. Date 2 Match 2020. Respondents consent was waived due to its minimal risk to subjects that will not adversely affect their rights and welfare. It was obtained by voluntarily answering and informing that it was for academic and statistical purposes only.
Informed Consent Statement
Not applicable.
Data Availability Statement
The data that supports the findings of this study is available from the corresponding author (J.R.-R.), upon reasonable request.
Acknowledgments
A. Barreda expresses his gratitude to the Mexican National Council of Science and Technology (CONACYT) for the scholarship to pursue his postgraduate studies.
Conflicts of Interest
The authors declare no conflict of interest.
References
- Bourdieu, P.; Accardo, A.; Balazs, G.; Beaud, S.; Bonvin, F.; Bourdieu, E. The Weight of the World: Social Suffering in Contemporary Society; Ferguson, P.P., Translator; Polity: Cambridge, MA, USA, 1999. [Google Scholar]
- Jacobs, J. The Death and Life of Great American Cities; Random House: New York, NY, USA, 1961. [Google Scholar]
- Lefebvre, H. Le Droit à la Ville; An: París, France, 1968. [Google Scholar]
- Gehl, J. Life Between Buildings: Using Public Space Copenhagen; Danish Architectural Press: Copenhagen, Denmark, 1971. [Google Scholar]
- Francis, M. Changing values for public spaces. Landsc. Archit. 1988, 78, 54–59. [Google Scholar]
- Soja, E.W. Postmodern Geographies: The Reassertion of Space in Critical Social Theory; Verso: London, UK, 1989. [Google Scholar]
- Sassen, S. The Global City; Le Debat; Gallimard: París, France, 1994. [Google Scholar]
- Sassen, S. The global street: Making the political. Globalizations 2011, 8, 573–579. [Google Scholar] [CrossRef]
- Herce, M. Infraestructuras y Medio Ambiente: Urbanismo, Territorio y Redes de Servicios. I; Editorial UOC: New York, NY, USA, 2010; Volume 1. [Google Scholar]
- Bertolini, L. From “streets for traffic” to “streets for people”: Can street experiments transform urban mobility? Transp. Rev. 2020, 40, 734–753. [Google Scholar] [CrossRef]
- Litman, T.A. Economic Value of Walkability; Victoria Transport Policy Institute: Victoria, BC, Canada, 2017. [Google Scholar]
- Eliasson, J. Efficient transport pricing—Why, what, and when? Commun. Transp. Res. 2021, 1, 100006. [Google Scholar] [CrossRef]
- Ben-Joseph, E.; Lee, J.S.; Cromley, E.K.; Laden, F.; Troped, P.J. Virtual and actual: Relative accuracy of on-site and web-based instruments in auditing the environment for physical activity. Health Place 2013, 19, 138–150. [Google Scholar] [CrossRef] [Green Version]
- Yin, L.; Cheng, Q.; Wang, Z.; Shao, Z. ‘Big data’for pedestrian volume: Exploring the use of Google Street View images for pedestrian counts. Appl. Geogr. 2015, 63, 337–345. [Google Scholar] [CrossRef]
- Chen, L.; Lu, Y.; Sheng, Q.; Ye, Y.; Wang, R.; Liu, Y. Estimating pedestrian volume using Street View images: A large-scale validation test. Comput. Environ. Urban Syst. 2020, 81, 101481. [Google Scholar] [CrossRef]
- Bolaños, I.K. Mercado del Suelo en la Zona Conurbada de Querétaro; Poder Ejecutivo del Gobierno del Estado de Querétaro: Querétaro, Mexico, 2011.
- Torre Escoto, M.E.d.l. La Urbanización de Grandes Ejes Metropolitanos: Un Proyecto de Ordenación para la Ciudad de Baja Densidad, Guadalajara, México; Universitat Politècnica de Catalunya: Barcelona, Spain, 2006. [Google Scholar]
- Crossa, V. Reading for difference on the street: De-homogenising street vending in Mexico City. Urban Stud. 2016, 53, 287–301. [Google Scholar] [CrossRef]
- Moreira, R. Marxismo e geografia. Cad. Prudentino Geogr. 1989, 1, 27–42. [Google Scholar]
- Méndez, G. Anatomía de la movildiad en México: Hacia dónde vamos. México. 2018. Available online: https://www.gob.mx/cms/uploads/attachment/file/411314/Anatom_a_de_la_movilidad_en_M_xico.pdf (accessed on 6 November 2021).
- Guzman, L.A.; Arellana, J.; Alvarez, V. Confronting congestion in urban areas: Developing Sustainable Mobility Plans for public and private organizations in Bogotá. Transp. Res. Part A Policy Pract. 2020, 134, 321–335. [Google Scholar] [CrossRef]
- Qin, J.; Liao, F. Space–time prism in multimodal supernetwork-Part 1: Methodology. Commun. Transp. Res. 2021, 1, 100016. [Google Scholar] [CrossRef]
- Kim, S.; Choo, S.; Lee, G.; Kim, S. Predicting Demand for Shared E-Scooter Using Community Structure and Deep Learning Method. Sustainability 2022, 14, 2564. [Google Scholar] [CrossRef]
- Merlin, L.A.; Guerra, E.; Dumbaugh, E. Crash risk, crash exposure, and the built environment: A conceptual review. Accid. Anal. Prev. 2020, 134, 105244. [Google Scholar] [CrossRef]
- Sung, H.; Lee, S.; Cheon, S.; Yoon, J. Pedestrian Safety in Compact and Mixed-Use Urban Environments: Evaluation of 5D Measures on Pedestrian Crashes. Sustainability 2022, 14, 646. [Google Scholar] [CrossRef]
- de Dios Ortúzar, J. Future Transportation: Sustainability, Complexity and Individualization of Choices; Elsevier: Amsterdam, The Netherlands, 2021. [Google Scholar]
- Gallo, M.; Marinelli, M. Sustainable mobility: A review of possible actions and policies. Sustainability 2020, 12, 7499. [Google Scholar] [CrossRef]
- Zhang, L.; Zeng, Z.; Gao, K. A bi-level optimization framework for charging station design problem considering heterogeneous charging modes. J. Intell. Connect. Veh. 2022, 5, 8–16. [Google Scholar] [CrossRef]
- Luna, A.A.B.; Kuri, G.H.; Rodríguez-Reséndiz, J.; Antuñano, M.A.Z.; Corro, J.A.A.; Paredes-Garcia, W.J. Public space accessibility and machine learning tools for street vending spatial categorization. J. Maps 2022, 1–10. [Google Scholar] [CrossRef]
- de Ecología Urbana de Barcelona, A. Plan de Indicadores de Sostenibilidad Urbana de Vitoria-Gasteiz; Departamento de Medio Ambiente del Ayuntamiento de Vitoria-Gasteiz: Vitoria-Gasteiz, Spain, 2010. [Google Scholar]
- Krambeck, H.V. The Global Walkability Index. Ph.D. Thesis, Massachusetts Institute of Technology, Cambridge, MA, USA, 2006. [Google Scholar]
- Front Seat. Walk Score Methodology. 2011. Available online: http://www.walkscore.com/ methodology.shtml (accessed on 7 November 2021).
- Ewing, R.; Cervero, R. Travel and the built environment: A meta-analysis. J. Am. Plan. Assoc. 2010, 76, 265–294. [Google Scholar] [CrossRef]
- Boer, R.; Zheng, Y.; Overton, A.; Ridgeway, G.K.; Cohen, D.A. Neighborhood design and walking trips in ten US metropolitan areas. Am. J. Prev. Med. 2007, 32, 298–304. [Google Scholar] [CrossRef] [Green Version]
- Liu, X.; Griswold, J. Pedestrian volume modeling: A case study of San Francisco. Yearb. Assoc. Pac. Coast Geogr. 2009, 71, 164–181. [Google Scholar] [CrossRef]
- Dhanani, A.; Tarkhanyan, L.; Vaughan, L. Estimating pedestrian demand for active transport evaluation and planning. Transp. Res. Part A Policy Pract. 2017, 103, 54–69. [Google Scholar] [CrossRef] [Green Version]
- Lin, C.; Wang, K.; Wu, D.; Gong, B. Passenger flow prediction based on land use around metro stations: A case study. Sustainability 2020, 12, 6844. [Google Scholar] [CrossRef]
- Gao, K.; Yang, Y.; Li, A.; Qu, X. Spatial heterogeneity in distance decay of using bike sharing: An empirical large-scale analysis in Shanghai. Transp. Res. Part D Transp. Environ. 2021, 94, 102814. [Google Scholar] [CrossRef]
- Liu, Y.; Lyu, C.; Zhang, Y.; Liu, Z.; Yu, W.; Qu, X. DeepTSP: Deep traffic state prediction model based on large-scale empirical data. Commun. Transp. Res. 2021, 1, 100012. [Google Scholar] [CrossRef]
- Leal González, M.; Parada Ávila, J.; Gómez Zermeño, M.; aLeMán de La Garza, L. A model for innovation and global competitiveness: The Monterrey International City of Knowledge Program (MICK). In Innovation Support in Latin America and Europe: Theory, Practice and Policy in Innovation and Innovation Systems; Routledge: London, UK, 2016; pp. 105–128. [Google Scholar]
- SEDESU, Secretaría de Desarrollo Sustentable de Nuevo Leon. Programa Integral de Movilidad Urbana Sustentable de la Zona Metropolitana de Monterrey; Technical Report; SEDESU, Secretaría de Desarrollo Sustentable de Nuevo Leon: Santiago de Querétaro, Mexico, 2021.
- Gobierno del Estado de Nuevo León. Periodico oficial del Estado de Nuevo Leon; Gobierno del Estado de Nuevo León: Monterrey, Mexico, 2022.
- Wilson, A. The Future of Urban Modelling. Appl. Spat. Anal. Policy 2018, 11, 647–655. [Google Scholar] [CrossRef] [Green Version]
- Yang, T.; Tang, X.; Liu, R. Dual temporal gated multi-graph convolution network for taxi demand prediction. Neural Comput. Appl. 2021, 1–16. [Google Scholar] [CrossRef]
- INEGI, Instituto Nacional de Estadística y Geografía. Inventario Nacional de Vivienda; Technical Report; Instituto Nacional de Estadística y Geografía: Aguascalientes, Mexico, 2015.
- Raei, B.; Ahmadi, A.; Neyshaburi, M.R.; Ghorbani, M.A.; Asadzadeh, F. Comparative evaluation of the whale optimization algorithm and backpropagation for training neural networks to model soil wind erodibility. Arab. J. Geosci. 2021, 14, 29. [Google Scholar] [CrossRef]
- Zhu, W.; Wu, J.; Fu, T.; Wang, J.; Zhang, J.; Shangguan, Q. Dynamic prediction of traffic incident duration on urban expressways: A deep learning approach based on LSTM and MLP. J. Intell. Connect. Veh. 2021, 4, 80–91. [Google Scholar] [CrossRef]
- Odry, Á.; Tadic, V.L.; Odry, P. A stochastic logic-based fuzzy logic controller: First experimental results of a novel architecture. IEEE Access 2021, 9, 29895–29920. [Google Scholar] [CrossRef]
- Odry, Á.; Fuller, R.; Rudas, I.J.; Odry, P. Kalman filter for mobile-robot attitude estimation: Novel optimized and adaptive solutions. Mech. Syst. Signal Process. 2018, 110, 569–589. [Google Scholar] [CrossRef]
- Odry, Á. An open-source test environment for effective development of marg-based algorithms. Sensors 2021, 21, 1183. [Google Scholar] [CrossRef]
- Rodríguez-Abreo, O.; Rodríguez-Reséndiz, J.; Fuentes-Silva, C.; Hernández-Alvarado, R.; Falcón, M.D.C.P.T. Self-Tuning Neural Network PID With Dynamic Response Control. IEEE Access 2021, 9, 65206–65215. [Google Scholar] [CrossRef]
Publisher’s Note: MDPI stays neutral with regard to jurisdictional claims in published maps and institutional affiliations. |
© 2022 by the authors. Licensee MDPI, Basel, Switzerland. This article is an open access article distributed under the terms and conditions of the Creative Commons Attribution (CC BY) license (https://creativecommons.org/licenses/by/4.0/).