Article

Impact of COVID-19 Lockdown on Wildlife-Vehicle Collisions in NW of Spain

by
Íñigo García-Martínez-de-Albéniz
1,
Juan Antonio Ruiz-de-Villa
2 and
Jorge Rodriguez-Hernandez
1,*
1
GITECO Construction Technology Applied Research Group, School of Civil Engineering, Universidad de Cantabria, Avda. de los Castros 44, 39005 Santander, Spain
2
Ministry of Transport, Mobility and Urban Agenda, Government of Spain, c/Vargas 53–9°, 39071 Santander, Spain
*
Author to whom correspondence should be addressed.
Sustainability 2022, 14(8), 4849; https://doi.org/10.3390/su14084849
Submission received: 9 March 2022 / Revised: 4 April 2022 / Accepted: 13 April 2022 / Published: 18 April 2022

Abstract

:
Wildlife–vehicle collisions (WVCs) in many places have a significant impact on wildlife management and road safety. The COVID-19 lockdown enabled the study of the specific impact that traffic has on these events. WVC variation in the Asturias and Cantabria regions (NW of Spain) because of the COVID-19 lockdown reached a maximum reduction of −64.77% during strict confinement but it was minimal or nonexistent during “soft” confinement. The global average value was −30.22% compared with the WVCs registered in the same period in 2019, but only −4.69% considering the average throughout the period 2010–2019. There are huge differences between conventional roads, where the traffic reduction was greater, and highways, where the traffic reduction was lesser during the COVID-19 lockdown. The results depend on the season, the day of the week and the time of day, but mainly on the traffic reduction occurring. The results obtained highlight the need to include the traffic factor in WVC reduction strategies.

1. Introduction

At the beginning of the COVID-19 pandemic (March 2020), the NW of Spain suffered, like many other regions around the world, a strong lockdown to control spread. This general lockdown, sometimes denominated “antropausia” [1], led to a significant decrease in mobility, with a subsequent road traffic reduction. It would be expected that, among other effects, this reduction would lead to a decrease in wildlife-vehicle collisions (WVCs) [2,3].
WVCs account for 8.9% of road traffic accidents in Spain and their socioeconomic impact has been estimated at EUR 105,007,649/year [4]. In some regions of the northwest, such as Asturias, this percentage reaches 21.31% [5]. The analysis of the circumstances in which WVCs occur is therefore of great interest. Any WVC happens because there is a spatiotemporal coincidence between at least one animal and one vehicle. The main factors involved are the behavior of the species, the conditions of the habitat, the characteristics of the infrastructure, the traffic and the attitude of drivers. The most complete models that address the study of WVCs are those that integrate, in one way or another, most of these aspects, e.g., [6,7,8,9,10]. Significant changes in any of these variables, such as traffic reduction due to COVID-19 lockdown, allow us to investigate the particular impact in detail.
In Spain there are two main types of interurban road networks: the State Road Network (SRN) and the Autonomous Community Road Networks (ACRNs). The SRN connects the main cities of the country and is managed by the National Government through the regional Offices of the Ministry of Transport, Mobility and Urban Planning (MITMA). The ACRNs are used exclusively for the internal transportation needs of different regions and depending on each regional government. The objective of this research was to study the impact of traffic reduction due to COVID-19 lockdown on WVCs in the SRN and the ACRN of Asturias and Cantabria (both regions in the NW of Spain), investigating specific differences between conventional and high-capacity roads, as well as among the main animal species involved in collisions.

2. Materials and Methods
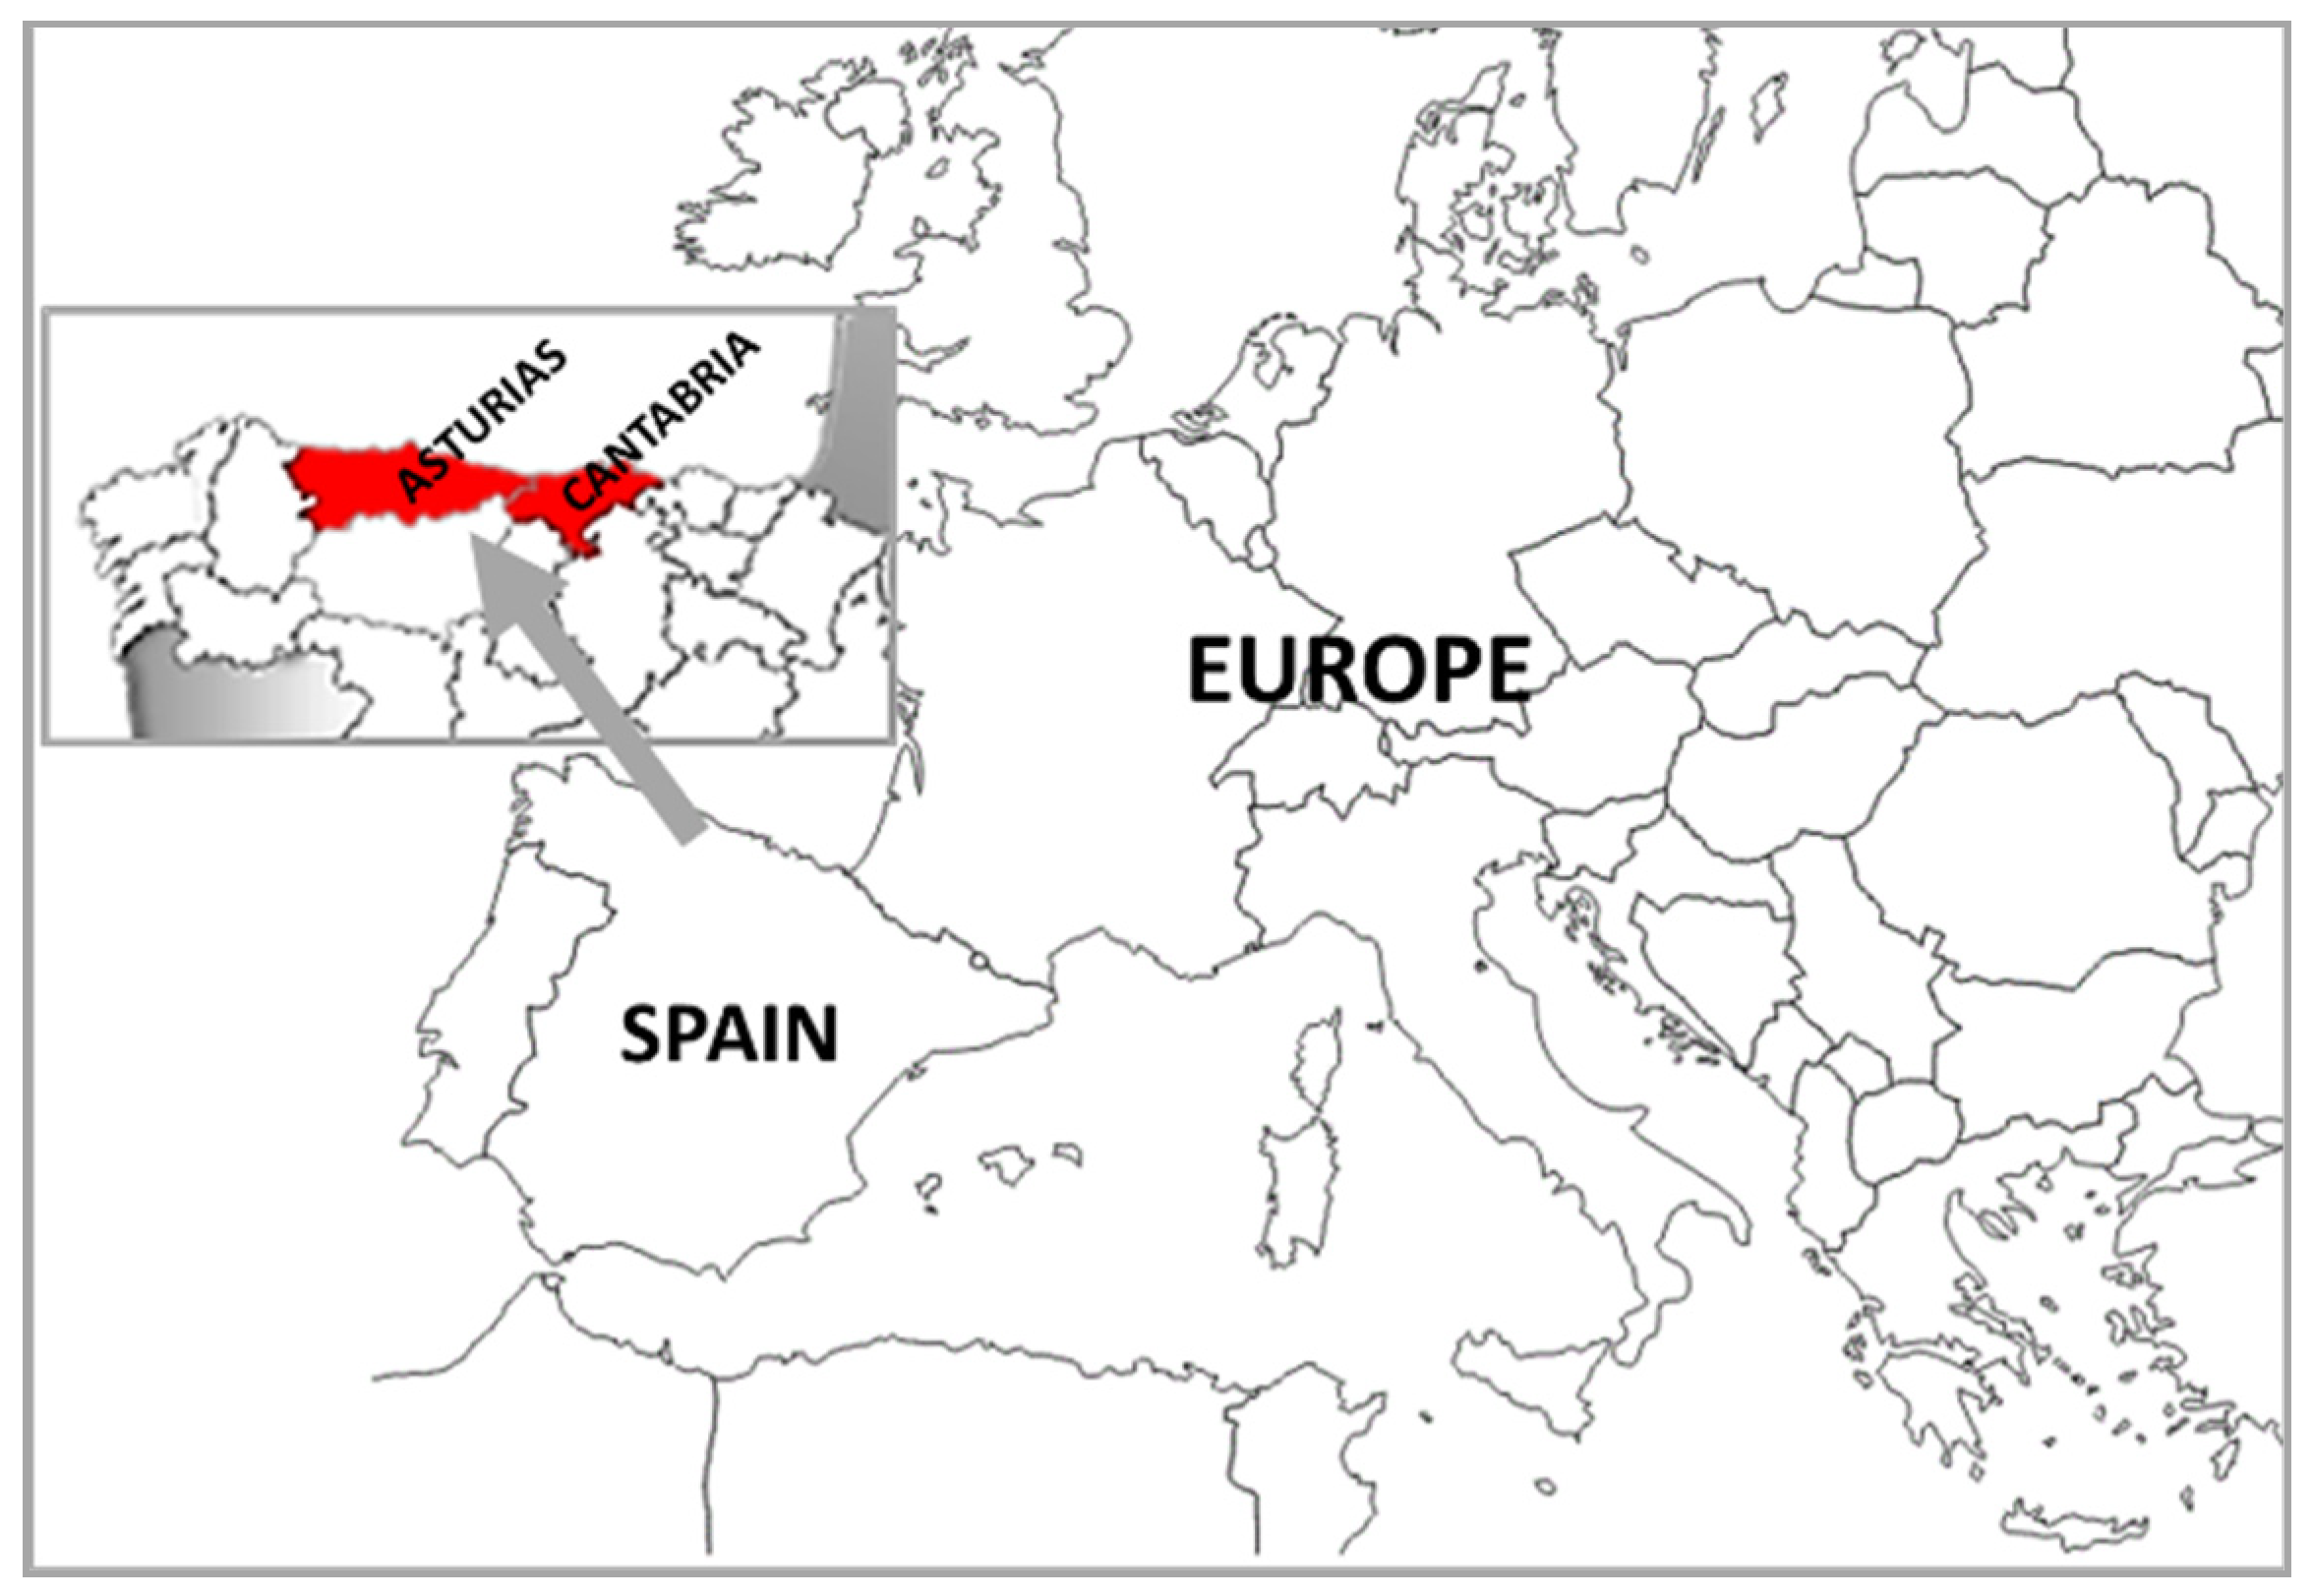
2.1. Study Area

Asturias and Cantabria are two autonomous regions located in the NW of Spain (Figure 1) whose main characteristics are summarized in Table 1. Both regions have central areas where the majority of the population lives around several cities near the coast that make up two metropolitan systems with extensive peri-urban areas that function, particularly in Asturias, as large conurbations.
Biogeographically they are integrated within the European Atlantic Province within the Eurosiberian Region [14]. Its current vegetation is formed almost in equal parts by wooded areas, scrub areas and, finally, by pastures, meadows and crops; basically, forage crops [15,16]. Among the wildlife in these regions, the most dangerous for WVC are wild ungulates, roe deer (Capreolus capreolus L. 1758) and wild boar (Sus scrofa L. 1758), which stand out due to their breadth of distribution and abundance, even increasing in number over recent years due to the global change in human socio-demographics and global warming [17].

2.2. Wildlife-Vehicle Collisions

Traffic authorities have a registration system for any type of accident denominated ARENA (with detailed location—road, kilometer point and UTM coordinates—animal species and time data). This system collates practically all the wildlife-vehicle collisions (WVCs) with medium–large animals involved [5] and it provides the data source used in this work. The summary of the annual information on WVCs occurring from 2010 to 2020 is listed in Table 2.
Previous studies show that both territories are among the Spanish regions with a high incidence of WVC, with wild boar and roe deer as the main species involved [4]. Likewise, detailed studies in Asturias [5] indicate: (a) a growing trend of WVCs since 2006 with inter-annual fluctuations, (b) an increasing ratio of wild boar collisions compared to those with roe deer, (c) a more balanced distribution of collisions wild boar/roe deer in conventional roads than in high-capacity ones, where wild boar collisions are very dominant, and (d) a slightly higher occurrence at weekends. Collisions with roe deer in NW Spain occur mainly in spring, immediately before and after sunrise and sunset. However, wild boar collisions take place mainly during the two hours after sunset from mid-October to late February [5,18,19,20].

2.3. Traffic and Mobility

Given the unavailability of data on intensity (Average Daily Traffic, ADT) or flow (vehicle-kilometer, vkm) of traffic during the study, two traffic proxies were used: (a) Spain long-distance daily trip (>3 h) number data, and its equivalent on the reference day, provided by traffic authorities during the COVID-19 lockdown [21] and (b) Asturias and Cantabria mobility compared to the reference day data, expressed as passenger-kilometer, collected by road authorities [22] from 14 February 2020 to the present. In the first case, when referring to the whole of Spain, the percentage of reduction or increase was preferentially used instead of absolute values. In the second, the expression passenger-kilometer includes any type of person (driver, passenger, pedestrian, etc.) who makes a journey >0.5 km by any means (on foot, by bicycle, by bus, by train, etc.), although most involve a car.

2.4. COVID-19 Lockdown

The COVID-19 pandemic in Spain still continues and there is a general consensus that at least six waves have been registered. This study focuses on the first, from 14 March to 21 June 2020, when the first “state of alarm” was decreed to stop its effects, which entailed very strict restrictions that severely affected the daily lives of citizens. The phases shown in Table 3 describe the stages of COVID-19 lockdown then applied in Spain, considering the specific modifications introduced in the regions studied. Subsequently, it was necessary to determine other restrictions that also affected mobility, in particular those decreed with the second “state of alarm” that began on 25 October 2020 and ended on 9 May 2021, although this time general confinement of the population was not regulated.
Undoubtedly, it will be necessary in the future to study the entire pandemic duration as a unique period, linking mobility and traffic restrictions with WVCs, as this will provide more complete information for managing the problem. However, like other authors who are interested in issues related to traffic and COVID-19, it seems especially appropriate to focus on the initial period due to its critical importance [23] and the severity of the measures that were adopted [24], although data from other periods of 2020 were used for the purpose of comparison.

2.5. Statistical Analysis

As indicated in the results, when necessary, besides absolute frequencies of WVCs, daily relative frequencies were used for data normalization to eliminate distortions existing due to inter-annual variations. Likewise, the moving averages of seven days were used sometimes as daily values in order to minimize the random effects of WVC occurrence, and the problem of inter-annual desynchronization between the date and the day of the week. The WVC data for 2020 were compared with those of 2019 and with those of the average of period 2010–2019. Furthermore, data of 2010–2019 have been used in individualized years for the study of COVID lockdown impact over WVCs on conventional vs. high capacity roads and those where roe deer vs. wild boar were involved. Moreover, following Shilling et al. [25], WVCs/day rates were compared over 28 days at the beginning of the COVID-19 lockdown, or equivalently in 2010 to 2019, with identical periods immediately before. This very short period was chosen to minimize the influence of possible seasonal changes in wildlife movement. Finally, the WVC/mobility rate was used to make comparisons during different periods of 7 days—before, during and after COVID-19 lockdown—of 2020, selected with the criteria of representing both the different phases of lockdown and the annual cycle of WVCs in the studied territory [5].
Pearson’s r correlation coefficient, paired samples Wilcoxon test and two-tailed Student’s t-test were used as the statistical test for the comparisons (significance is showed in the results section). Computations were performed in R software with the package R Commander [26].

3. Results

The year 2020 began with an increase in wildlife-vehicle collisions (WVCs) in Asturias and Cantabria and, even though the figures were lower during the COVID-19 lockdown, the trend continued after the end of it, in comparison with 2019 and 2010–2019 series, observing a strong increase in the month of July. Nevertheless, 254 WVCs happened during COVID-19 lockdown. This constitutes a −30.22% variation in WVCs compared with the same period of the previous year (statistically significant: t = 7.55, d.f. 99, p < 0.001), and −4.69%, compared with the average of the same period of the years 2010–2019 (statistically not significant). This reduction was very unevenly distributed during the different lockdown phases. Strict phases had a higher reduction, reaching up to −64.77% when lockdown started, and −47.34% during the very strict lockdown, compared with 2019 (statistically significant: t = 8.90, d.f. 15, p < 0.001 and t = 10.25, d.f. 10, p < 0.001, respectively). Afterwards, as the restrictions became softer (de-escalation phases), the difference in WVCs was reduced, even reaching a positive net balance compared with 2010–2019 (20.30%, statistically significant: t = −4.56, d.f. 41, p < 0.001) and a slightly negative one compared with 2019 (−4.27%, statistically not significant) (Figure 2).
During the years previous to 2020 there is no statistically significant variation in collisions between the days before and after (periods of 28 days before and after) the start date of COVID-19 lockdown. However, in 2020 this reduction is statistically significant (Table 4).
There is a low to moderate correlation with very high statistical significance between traffic reduction (long-distance daily trip reduction) and WVC reduction (r = 0.328, p < 0.001 for 2019; r = 0.592, p < 0.001 for 2010–2019). Traffic reduction is greater than WVC reduction and it had to be greater than 50%, as in the strictest lockdown, to provoke noticeable effects on the reduction of WVCs (Figure 3).
The reduction detected did not imply low WVC/mobility rates (Table 5). In fact, the rate appears unusually high during strict lockdown, at which time a rate slightly higher than in the previous period was expected, but not as high.
Data analysis shows that the reduction took place especially on holidays (weekends and bank holidays), while WVCs decrease in all phases, compared with 2019 (Figure 4).
Regarding the times of the accidents, no significant differences in WVC time distribution were found during de-escalation. Nonetheless, WVCs were concentrated in the time slot from 9:00 p.m. to 10:00 p.m. (Figure 5) during strict lockdown; the difference is statistically significant compared to 2019 and 2019–2020 (V = 236.5, p < 0.05 for 2010–2019; V = 136, p < 0.01 for 2019).
Conventional roads showed a higher reduction in WVCs than high-capacity ones. Moreover, roe deer collisions underwent a greater reduction than collisions in which wild boars were involved (Figure 6).
Although there are general common patterns in WVC variations, there are differences between ACRN and SRN. The reduction was greater and more consistent in terms of time on ACRN. This is represented, in Figure 7, as the percentage of accidents occurring in one day compared with the total occurring during the whole year. This figure shows that the reduction on ACRN remains remarkably even during de-escalation phase 1.

4. Discussion

Although with variable results, several studies show reductions in the number of traffic accidents during COVID-19 lockdown [27,28,29,30,31,32,33,34]. Equally, three studies have found a wildlife-vehicle collision (WVC) decrease in Europe [35], the USA [25] and Australia [36]. In our case, this reduction in the WVCs was clearly verifiable in the step before/after the start of lockdown (Table 4) and is confirmed in general terms similar to the aforementioned studies, although with some specific nuances of interest for road safety management.
WVCs in the NW of Spain have had a growing trend since 2006 [5] and the beginning of 2020 appears to continue it, registering higher values than any previous year (Figure 2). In this context, it is likely that COVID-19 lockdown has actually led to a greater absolute reduction in WVCs than that indicated by us, particularly in de-escalation, as other studies have found [35], which should be recognized as a limitation of the analysis method used.
The lockdown period as a result of the unfortunate COVID-19 pandemic shows, especially during the strict phase (Figure 3), that traffic reduction acts, as was predictable, as a strategy to reduce WVCs: fewer vehicles traveling, less chance of collision occurring. However, the observed decrease is not directly equivalent to traffic reduction, since the relationship between traffic and WVCs is generally positive, but it is neither necessarily linear nor clearly assignable [37].
The COVID-19 lockdown studied took place in spring (Figure 2) and its effects would probably have been different if it had happened in another time of year, as other authors have also speculated [36]. Roe deer vehicle collisions were the ones that reduced the most in spring lockdown (Figure 6), just when previous studies had shown the seasonal peak of these collisions throughout the year in NW Spain [5,18,19,20]. However, if the strict confinement had occurred in autumn, the main reductions would probably have occurred in collisions with wild boars, which show their peak then. In fact, different anomalies in the number of accidents with different mammal species have been found in Slovenia during the spring and autumn COVID-19 lockdowns [38]. There, although unlike in Spain where collisions with roe deer are always the majority, reductions in wild boar have only been detected in autumn. Other authors had already reported that the locomotory activity of animals is a factor as important or more so than traffic in WVCs, especially on conventional roads [39] which is where the most marked reduction occurred in our study (Figure 6). In any case, traffic is a powerful factor, as shown by the fact that WVC reductions were greater and more consistent on non-working days when traffic was lower (Figure 4).
Other factors also have an impact on WVC reduction, such as the different barrier effects in the territory depending on the type of road (Figure 6). Traffic decrease was greater on ACRN than on SRN (Figure 7). This could be explained by several confluent reasons. First, SRN include the major communication axes which support the flow of materials for essential activity and although we do not have data, it is logical to think that the traffic reduction has been less there. Second, they link large population centers and industrial zones adjoining them. Thus, this road network is not only for long-distance travel, but also work-related mobility, principally in metropolitan areas, and must be taken into account that labor activity, always the essential and the rest to a greater or lesser degree, was maintained throughout COVID-19 lockdown. The highest concentration of collisions in the time slot 9–10 p.m. during strict confinement (Figure 5) supports this speculation. Finally, 45% of SRN are highways with fencing and they absorb around 83% of traffic on this network, whereas only 1.31% of roads are fenced on ACRN. Highway fencing is quite effective for roe deer, but much less so for wild boar [5], so in the high-capacity roads there are fewer possibilities of WVC reduction in spring. The effect of road fencing has been considered by other authors to explain the cases in which the reduction in traffic was not associated with a decrease in WVCs during COVID-19 lockdown [40].
WVC reduction strategies are based on decreasing the probability of an animal-vehicle encounter. Physical separation of road infrastructures and wildlife by using fences is the most effective measure to achieve this [41]. Nevertheless, environmental problems related to habitat fragmentation [42,43] may arise if the effect is not countered with ecoducts or under or overpasses [44,45]. However, road fencing is not always possible. For example, in Asturias about 9% of roads are fenced and these account for almost 60% of the traffic load [13,46] where around 30% of the WVCs take place [47]. Considering other measures (signs, reflectors, chemical repellents, etc.) are much less effective [41], what happened during the COVID-19 lockdown should have application in seeking and implementing land use models, social activity development and transport options that lead to traffic reduction.
It is remarkable that roe deer daily movement peaks match traffic related to going to work and returning home at twilight [5], which increases accident probabilities. Approximately 30% of population movements made in Asturias and Cantabria on working days are from/to work and the majority of these (56%) are carried out in cars [48]. As was concluded in other studies in Spain, most of these passenger cars have a very low occupancy rate—e.g., 1.29 people/vehicle in Madrid [49]. The association of a good part of collisions with work displacements may explain, at least in part, that despite its absolute reduction during strict COVID-19 lockdown, the WVC/mobility rate increased compared to the previous period and was one of the highest in all of 2020 (Table 5). High rates had already been found by other authors [50]. Traffic reduction related to working activity through promoting specific actions for this purpose (teleworking, public or collective transport systems, shared vehicles, penalization for private or low occupancy cars, etc.) would have a positive impact in reduction of WVC.
However, while vaccination against COVID-19 is not generalized and herd immunity achieved, any attempt to promote public or collective transport would be unsuccessful [51]. Moreover, even in this situation, the aim should be to promote and intensify efforts to develop and implement measures to increase public transport safety against disease [52], which may require additional financial investment [53] and special attention and actions [54].
It should also be considered that more than 95% of internal freight transport in Spain is carried out by truck [55]. This situation is worse in the NW of the country, where the transverse railway axes among the regions of this zone are very deficient, whereas perpendicular ones, which connect the NW with the rest of the country, are historically weighed down by the complex orography associated with Cantabrian mountain range, which forms a barrier to the south. The mixed “passenger-freight” use of the new high-speed rail routes—under construction or projected [56]—could mitigate this circumstance by promoting modal transport.
Obviously, it is desirable that the singular situation caused by COVID-19 is only temporary and everything returns to normal after mass and effective vaccination. However, a deep reflection should be made to learn from what happened and its repercussions for the population and our way of life, not only in the context of health but in all fields of study. Considering WVCs, we should focus on the need for traffic reduction and intermodal transport and, at the same time, work on medium and long-term measures, a time horizon where two aspects stand out: teleworking and territorial planning, although they may encourage opposite trends.
Indeed, teleworking can be done from anywhere, but it does not affect all job categories equally. It is especially suitable for more technical and highly qualified workers who are, in general, better paid [57,58]. However, the COVID-19 lockdown revealed that the spectrum where teleworking is applicable is broader than thought, and that its growth margin was larger in countries where its implementation was still limited [59], such as Spain. The current context may lead to the misinterpretation of the “social distancing” recommended by the health authorities, into physical distancing from the most populated areas (e.g., compact urban). Therefore, territorial and urban planners should be especially careful not to promote low-density urban development, which is related with highly car-dependent lifestyles and consequently, traffic increment.
Strategies of this type seem especially convenient in regions such as Asturias, where 75% of the population lives in less than 25% of the territory around four cities located in its central area, which means that most of the regional WVCs take place there [47]. The data reveals that in this region until the 2020 summer holidays the use of public transport had remained almost 40% less than before the COVID-19 lockdown [60]. In this scenario, partly due to the fear of another lockdown in an apartment, there is an increase in demand for residential areas outside the cities, located in already highly fragmented, periurban areas surrounded by nature [61]. There, wild boar, thanks to their enormous plasticity [62,63], find facilities to proliferate [64,65], likely leading to a future increase in WVCs. Preventing what may be a temporary situation from becoming a consolidated trend beyond the pandemic period should be prioritized.
Finally, these strategies would have the advantage of achieving permanent traffic reductions, avoiding the “rebound” effect detected immediately after lockdown (Figure 2); especially when it may have a twofold origin. First, a temporary maintenance of the altered animal behavior [66] and a greater use of (peri-)urban areas during lockdown, which may have been exaggerated [67]. The second, the persistence of dangerous driving attitudes, originated by and detected during lockdown [68], as well as the loss of driving skills after it or the lack of vehicle maintenance during the lockdown, as some Spanish authorities and traffic experts in the media have reported. These have led to a general accident rate increase after confinement [69,70], which has also been detected in other places [29].

5. Conclusions

The COVID-19 lockdown has highlighted the importance of traffic in wildlife-vehicle collisions (WVC) occurrence and it has shown the relevance of considering this factor in strategies to reduce this problem, which affects both the environment and road safety. However, the data, which according to the periods of lockdown range between −64.77% and −4.27% WVCs compared to 2019, indicate that not every traffic reduction is equally productive. WVCs follow very specific spatiotemporal patterns and traffic reductions are effective when they affect them. Furthermore, the characteristics of the roads and the distribution of traffic should also be considered. In Asturias and Cantabria, the main species involved in WVCs are wild boar and roe deer, so the reductions should occur above all in mobility related to commuting to and from work and freight transport. However, these patterns differ depending on the species and places, so the design of traffic reduction measures and strategies, which must be consistent to avoid unwanted rebound effects, should be adapted to local circumstances. Accordingly, local research is absolutely necessary.

Author Contributions

Conceptualization, Í.G.-M.-d.-A., J.A.R.-d.-V. and J.R.-H.; methodology, Í.G.-M.-d.-A.; formal analysis, Í.G.-M.-d.-A.; resources, J.A.R.-d.-V.; writing original draft preparation, Í.G.-M.-d.-A.; writing—review and editing, Í.G.-M.-d.-A., J.A.R.-d.-V. and J.R.-H.; funding acquisition, J.R.-H. All authors have read and agreed to the published version of the manuscript.

Funding

This research was partially funded by the Spanish Ministry of Science, Innovation and Universities (MCIU), the Spanish State Research Agency (AEI) and the European Regional Development Fund of the European Union (ERDF, EU) through the project HOFIDRAIN-MELODRAIN, Re. RTI2018-094217-B-C32, financed by MCIN/AEI/10.13039/501100011033/ERDF “A way to make Europe”.

Institutional Review Board Statement

Not applicable.

Informed Consent Statement

Not applicable.

Data Availability Statement

The data used during the study are public and were provided by Directorate-General for Traffic of the Spanish Government (DGT) and the regional Office of the Ministry of Transport, Mobility and Urban Planning (MITMA) in Cantabria. Requests for these materials should be addressed directly to these public administration agencies.

Acknowledgments

Special thanks to Jacinto Vicente Manzanaro who helped greatly to facilitate the work.

Conflicts of Interest

The authors declare no conflict of interest.

References

  1. Rutz, C.; Loretto, M.C.; Bates, E.; Davidson, S.C.; Duarte, C.M.; Jetz, W.; Johnson, M.; Kato, A.; Kays, R.; Mueller, T.; et al. COVID-19 lockdown allows researchers to quantify the effects of human activity on wildlife. Nat. Ecol. Evol. 2020, 4, 1156–1159. [Google Scholar] [CrossRef] [PubMed]
  2. Bates, A.E.; Primack, R.B.; Moraga, P.; Duarte, C.M. COVID-19 pandemic and associated lockdown as a “Global Human Confinement Experiment” to investigate biodiversity conservation. Biol. Conserv. 2020, 248, 108665. [Google Scholar] [CrossRef] [PubMed]
  3. Helm, D. The environmental impacts of the Coronavirus. Environ. Resour. Econ. 2020, 76, 21–38. [Google Scholar] [CrossRef] [PubMed]
  4. Sáenz-de-Santa-María, A.; Tellería, J.L. Wildlife-vehicle collisions in Spain. Eur. J. Wildl. Res. 2015, 61, 399–406. [Google Scholar] [CrossRef]
  5. García-Martínez-de-Albéniz, I.; Ruiz-de-Villa, J.A.; Rodriguez-Hernandez, J. Fauna silvestre y accidentes de tráfico en Asturias (Wildlife and traffic accidents in Asturias). Bol. Cien. Nat. Tecnología R.I.D.E.A. 2019, 54, 131–156. [Google Scholar]
  6. Clevenger, A.P.; Barrueto, M.; Gunson, K.E.; Caryl, F.M.; Ford, A.T. Context-dependent effects on spatial variation in deer-vehicle collisions. Ecosphere 2015, 6, 1–20. [Google Scholar] [CrossRef] [Green Version]
  7. Visintin, C.; van der Ree, R.; McCarthy, M.A. A simple framework for a complex problem? Predicting wildlife-vehicle collisions. Ecol. Evol. 2016, 6, 6409–6421. [Google Scholar] [CrossRef] [Green Version]
  8. Ha, H.; Shilling, F. Modelling potential wildlife-vehicle collisions (WVC) locations using environmental factors and human population density: A case-study from 3 state highways in Central California. Ecol. Inform. 2018, 43, 212–221. [Google Scholar] [CrossRef]
  9. Bíl, M.; Andrášik, R.; Duľa, M.; Sedoník, J. On reliable identification of factors influencing wildlife-vehicle collisions along roads. J. Environ. Manage. 2019, 237, 297–304. [Google Scholar] [CrossRef]
  10. Laliberté, J.; St-Laurent, M.H. In the wrong place at the wrong time: Moose and deer movement patterns influence wildlife-vehicle collision risk. Accid. Anal. Prev. 2020, 135, 105365. [Google Scholar] [CrossRef]
  11. Instituto Nacional de Estadística. INEbase. Available online: https://www.ine.es/dyngs/INEbase/listaoperaciones.htm (accessed on 15 January 2021).
  12. Ministerio de Transportes, Movilidad y Agenda Urbana. Anuario Estadístico 2018. Ministerio de Transportes, Movilidad y Agenda Urbana. Government of Spain. Spain. 2019. Available online: https://www.mitma.gob.es/informacion-para-el-ciudadano/informacion-estadistica/anuario-estadisticas-de-sintesis-y-boletin/anuario-estadistico (accessed on 15 March 2021).
  13. Observatorio Del Transporte Y La Logística En España. Tráfico De Viajeros Y Mercancías Por Carretera (Vehículos-Kilómetro) En La Red De Carreteras Del Estado (RCE) Por Clase Y Tipo De Vía, Comunidad Autónoma Y Provincia, 2020. Available online: https://apps.fomento.gob.es/BDOTLE/visorBDpop.aspx?i=326 (accessed on 23 March 2021).
  14. Rivas-Martínez, S.; Penas, Á.; Díaz-González, T.E.; del Río, S.; Cantó, P.; Herrero, L.; Pinto Gomes, C.; Costa, J.C. Biogeography of Spain and Portugal. Preliminary typological synopsis. Int. J. Geobot. Res. 2014, 4, 1–64. [Google Scholar] [CrossRef]
  15. Inventario Forestal Nacional. Cuarto Inventario Forestal Nacional: Asturias; Dirección General de Desarrollo Rural y Política Forestal, Ministerio de Agricultura, Alimentación y Medio Ambiente, Government of Spain: Madrid, Spain, 2012; p. 59.
  16. Inventario Forestal Nacional. Cuarto Inventario Forestal Nacional: Cantabria; Dirección General de Desarrollo Rural y Política Forestal, Ministerio de Agricultura, Alimentación y Medio Ambiente, Government of Spain: Madrid, Spain, 2012; p. 56.
  17. Valente, A.M.; Acevedo, P.; Figueiredo, A.M.; Fonseca, C.; Torres, R.T. Overabundant wild ungulate populations in Europe: Management with consideration of socio-ecological consequences. Mamm. Rev. 2020, 50, 353–366. [Google Scholar] [CrossRef]
  18. Díaz-Varela, E.R.; Vázquez, I.; Marey, M.F.; Álvarez, C.J. Assessing methods of mitigating wildlife-vehicle collisions by accident characterization and spatial analysis. Transp. Res. Part D Transp. Environ. 2011, 16, 281–287. [Google Scholar] [CrossRef]
  19. Lagos, L.; Picos, J.; Valero, E. Temporal pattern of wild ungulate-related traffic accidents in northwest Spain. Eur. J. Wildl. Res. 2012, 58, 661–668. [Google Scholar] [CrossRef]
  20. Rodríguez-Morales, B.; Díaz-Varela, E.R.; Marey, M.F. Spatiotemporal analysis of vehicle collisions involving wild boar and roe deer in NW Spain. Accid. Anal. Prev. 2013, 60, 121–133. [Google Scholar] [CrossRef]
  21. Dirección General de Tráfico. Actualidad del COVID-19 en la DGT. Available online: http://www.dgt.es/es/covid-19/.2020 (accessed on 22 January 2021).
  22. Ministerio de Transportes, Movilidad y Agenda Urbana. Análisis de la Movilidad en España con Tecnología Big Data durante el Estado de Alarma para la Gestión de la Crisis del COVID-19. Available online: https://www.mitma.gob.es/ministerio/covid-19/evolucion-movilidad-big-data (accessed on 15 January 2021).
  23. Parr, S.; Wolshon, B.; Murray-Tuite, P.; Lomax, T. Multistate assessment of roadway travel, social separation, and COVID-19 cases. J. Transp. Eng., Part A: Systems 2021, 147, 04021012. [Google Scholar] [CrossRef]
  24. Rilett, L.R.; Tufuor, E.; Murphy, S. Arterial roadway travel time reliability and the COVID-19 pandemic. J. Transp. Eng. Part A Systems 2021, 147, 04021034. [Google Scholar] [CrossRef]
  25. Shilling, F.; Nguyen, T.; Saleh, M.; Kyaw, M.K.; Tapia, K.; Trujillo, G.; Bejarano, M.; Waetjen, D.; Peterson, J.; Kalisz, G.; et al. A Reprieve from US wildlife mortality on roads during the COVID-19 pandemic. Biol. Conserv. 2021, 256, 109013. [Google Scholar] [CrossRef]
  26. Fox, J.; Bouchet-Valat, M. Rcmdr: R Commander. R Package Version 2.7-1. 2020. Available online: https://cran.r-project.org/web/packages/Rcmdr/index.html (accessed on 14 December 2020).
  27. Chang, A.; Miranda-Moreno, L. Rethinking the Way We Move beyond COVID-19; Technical Paper; SAE: Warrendale, PA, USA, 2020; p. 15, WP-0012. [Google Scholar]
  28. Oguzoglu, U. COVID-19 Lockdowns and Decline in Traffic Related Deaths and Injuries; Institute of Labor Economics (IZA) Discussion Paper Series; IZA: Bonn, Germany, 2020; Volume 13278, p. 17. [Google Scholar]
  29. Qureshi, A.I.; Huang, W.; Khan, S.; Lobanova, I.; Siddiq, F.; Gomez, C.R.; Suri, M.F.K. Mandated societal lockdown and road traffic accidents. Accid. Anal. Prev. 2020, 146, 105747. [Google Scholar] [CrossRef]
  30. Saladié, Ò.; Bustamante, E.; Gutiérrez, A. COVID-19 lockdown and reduction of traffic accidents in Tarragona province, Spain. Transp. Res. Interdiscip. Perspect. 2020, 8, 100218. [Google Scholar] [CrossRef]
  31. Shilling, F.; Waetjen, D. Special Report (Update): Impact of COVID19 Mitigation on Numbers and Costs of California Traffic Crashes; Road Ecology Center: Davis, CA, USA, 2020; 10p. [Google Scholar]
  32. Doucette, M.L.; Tucker, A.; Auguste, M.E.; Watkins, A.; Green, C.; Pereira, F.E.; Borrup, K.T.; Shapiro, D.; Lapidus, G. Initial impact of COVID-19’s stay-at-home order on motor vehicle traffic and crash patterns in Connecticut: An interrupted time series analysis. Inj. Prev. 2021, 27, 3–9. [Google Scholar] [CrossRef] [PubMed]
  33. Yasin, Y.J.; Grivna, M.; Abu-Zidan, F.M. Global impact of COVID-19 pandemic on road traffic collisions. World J. Emerg. Surg. 2021, 16, 51. [Google Scholar] [CrossRef] [PubMed]
  34. Chand, S.; Yee, E.; Alsultan, A.; Dixit, V.V. A descriptive analysis on the impact of COVID-19 lockdowns on road traffic incidents in Sydney, Australia. Int. J. Environ. Res. Public Health 2021, 18, 11701. [Google Scholar] [CrossRef] [PubMed]
  35. Bíl, M.; Andrášik, R.; Cícha, V.; Arnon, A.; Kruuse, M.; Langbein, J.; Náhlik, A.; Niemi, M.; Pokorny, B.; Colino-Rabanal, V.J.; et al. COVID-19 related travel restrictions prevented numerous wildlife deaths on roads: A comparative analysis of results from 11 countries. Biol. Conserv. 2021, 256, 109076. [Google Scholar] [CrossRef] [PubMed]
  36. Driessen, M.M. COVID-19 restrictions provide a brief respite from the wildlife roadkill toll. Biol. Conserv. 2021, 256, 109012. [Google Scholar] [CrossRef]
  37. Pagany, R. Wildlife-vehicle collisions—Influencing factors, data collection and research methods. Biol. Conserv. 2020, 251, 108758. [Google Scholar] [CrossRef]
  38. Pokorny, B.; Cerri, J.; Bužan, E. Roadkill in a time of pandemic: The analysis of wildlife-vehicle collisions reveals the differential impact of COVID-19 lockdown over mammal assemblages. EcoEvoRxiv Prepr. 2021, 37. [Google Scholar] [CrossRef]
  39. Kušta, T.; Keken, Z.; Ježek, M.; Holá, M.; Šmíd, P. The effect of traffic intensity and animal activity on probability of ungulate-vehicle collisions in the Czech Republic. Saf. Sci. 2017, 91, 105–113. [Google Scholar] [CrossRef]
  40. Asari, Y. Decreased traffic volume during COVID-19 did not reduce roadkill on fenced highway network in Japan. Landsc. Ecol. Eng. 2022, 18, 121–124. [Google Scholar] [CrossRef]
  41. Rytwinski, T.; Soanes, K.; Jaeger, J.A.G.; Fahrig, L.; Findlay, C.S.; Houlahan, J.; van der Ree, R.; van der Grift, E.A. How effective is road mitigation at reducing road-kill? A meta-analysis. PLoS ONE 2016, 11, e0166941. [Google Scholar] [CrossRef]
  42. Wilson, R.E.; Farley, S.D.; McDonough, T.J.; Talbot, S.L.; Barboza, P.S. A genetic discontinuity in moose (Alces alces) in Alaska corresponds with fenced transportation infrastructure. Conserv. Genet. 2015, 16, 791–800. [Google Scholar] [CrossRef]
  43. Jakes, A.F.; Jones, P.F.; Paige, L.C.; Seidlerd, R.G.; Huijser, M.P. A fence runs through it: A call for greater attention to the influence of fences on wildlife and ecosystems. Biol. Conserv. 2018, 227, 310–318. [Google Scholar] [CrossRef]
  44. Schuster, R.; Römer, H.; Germain, R.R. Using multi-scale distribution and movement effects along a montane highway to identify optimal crossing locations for a large-bodied mammal community. PeerJ 2013, 1, e189. [Google Scholar] [CrossRef] [PubMed] [Green Version]
  45. Seidler, R.G.; Green, D.S.; Beckmann, J.P. Highways, crossing structures and risk: Behaviors of Greater Yellowstone pronghorn elucidate efficacy of road mitigation. Glob. Ecol. Conserv. 2018, 15, e00416. [Google Scholar] [CrossRef]
  46. Ministerio de Transportes, Movilidad y Agenda Urbana. Red de Carreteras: Tráfico, Velocidades, Accidentes y Tramos de Concentración de Accidentes. Available online: https://www.mitma.gob.es/carreteras/trafico-velocidades-y-accidentes-mapa-estimacion-y-evolucion/evolucion-del-trafico-desde-el-an%CC%83o-2000/evolucion-del-trafico-desde-el-an%CC%83o-2000-rce-y-todas-las-redes (accessed on 23 March 2021).
  47. García-Martínez-de-Albéniz, I.; Ruiz-de-Villa, J.A.; Rodriguez-Hernandez, J. Determinación y priorización de tramos de acumulación de accidentes por fauna silvestre en Asturias [Determination and prioritization of sections of accumulation of accidents by wildlife in Asturias]. Carreteras 2017, 215, 26–37. [Google Scholar]
  48. Ministerio de Fomento. Segunda Encuesta de Movilidad de las Personas Residentes—Movilia 2006–2007. Available online: https://www.mitma.gob.es/informacion-para-el-ciudadano/informacion-estadistica/movilidad/movilia-20062007/encuesta-de-movilidad-de-las-personas-residentes-en-espan%CC%83a-movilia-20062007 (accessed on 25 March 2021).
  49. Ayuntamiento de Madrid. Primer Informe del Estado de la Movilidad de la Ciudad de Madrid. 2006–2008. Indicadores. Bases de conocimiento compartido. 2009 Ayuntamiento de Madrid, Madrid, Spain, 2009. Available online: https://www.espormadrid.es/2009/02/primer-informe-del-estado-de-la.html (accessed on 25 March 2021).
  50. Abraham, J.O.; Mumma, M.A. Elevated wildlife-vehicle collision rates during the COVID-19 pandemic. Sci. Rep. 2021, 11, 20391. [Google Scholar] [CrossRef]
  51. Budd, L.; Ison, S. Responsible Transport: A post-COVID agenda for transport policy and practice. Transp. Res. Interdiscip. Perspect. 2020, 6, 100151. [Google Scholar] [CrossRef]
  52. Tirachini, A.; Cats, O. COVID-19 and Public Transportation: Current assessment, prospects, and research needs. J. Public. Trans. 2020, 22, 1–21. [Google Scholar] [CrossRef]
  53. De Vos, J. The effect of COVID-19 and subsequent social distancing on travel behaviour. Transp. Res. Interdiscip. Perspect. 2020, 5, 100121. [Google Scholar] [CrossRef]
  54. Monterde-i-Bort, H.; Sucha, M.; Risser, R.; Kochetova, T. Mobility patterns and mode choice preferences during the COVID-19 situation. Sustainability 2022, 14, 768. [Google Scholar] [CrossRef]
  55. Observatorio del Transporte y la Logística en España. Indicadores de Situación y Diagnóstico2020. Available online: http://apps.fomento.gob.es/BDOTLE/indicadores.aspx?c=1 (accessed on 23 March 2021).
  56. International Union of Railways. High-Speed Database & Maps. Available online: https://uic.org/passenger/highspeed/article/high-speed-database-maps (accessed on 27 March 2021).
  57. He, S.Y.; Hu, L. Telecommuting, income, and out-of-home activities. Travel Behav. Soc. 2015, 2, 131–147. [Google Scholar] [CrossRef]
  58. Aguilera, A.; Lethiais, V.; Rallet, A.; Proulhac, L. Home-based telework in France: Characteristics, barriers and perspectives. Transp. Res. Part A Policy Pract. 2016, 92, 1–11. [Google Scholar] [CrossRef]
  59. Belzunegui, A.; Erro, A. Teleworking in the context of the Covid-19 crisis. Sustainability 2020, 12, 3662. [Google Scholar] [CrossRef]
  60. Google. Google COVID-19 Community Mobility Reports. Available online: https://www.google.com/covid19/mobility/ (accessed on 23 February 2021).
  61. Jaeger, A.G.; Soukup, T.; Madriñán, L.F.; Schwick, C.; Kienast, F. Landscape Fragmentation in Europe. European Environment Agency Report Nº 2/2011; EEA, Publications Office of the European Union: Luxembourg, 2011; p. 87. Available online: https://www.eea.europa.eu/publications/landscape-fragmentation-in-europe (accessed on 23 February 2021).
  62. Keuling, O.; Stier, N.; Roth, M. Commuting, shifting or remaining? Different spatial utilisation patterns of wild boar (Sus scrofa L.) in forest and field crops during summer. Mamm. Biol. 2009, 74, 145–152. [Google Scholar] [CrossRef]
  63. Podgórski, T.; Bas, G.; Jedrzejewska, B.; Sönnichsen, L.; Sniezko, S.; Jedrzejewski, W.; Okarma, H. Spatiotemporal behavioral plasticity of wild boar (Sus scrofa) under contrasting conditions of human pressure: Primeval forest and metropolitan area. J. Mammal. 2013, 94, 109–119. [Google Scholar] [CrossRef] [Green Version]
  64. Licoppe, A.; Prévot, C.; Heymans, M.; Bovy, C.; Casaer, J.; Cahill, S. Wild boar/feral pig in (peri-)urban areas. International survey report. In the workshop “Managing wild boar in human-dominated landscapes”. In Proceedings of the International Union of Game Biologists—Congress, Brussels, Belgium, 28 August 2013. [Google Scholar]
  65. Castillo-Contreras, R.; Carvalho, J.; Serrano, E.; Mentaberre, G.; Fernández-Aguilar, X.; Coloma, A.; González-Crespo, C.; Lavín, S.; López-Olvera, J.R. Urban wild boars prefer fragmented areas with food resources near natural corridors. Sci. Total Environ. 2018, 615, 282–288. [Google Scholar] [CrossRef]
  66. Manenti, R.; Mori, E.; Di Canio, V.; Mercurio, S.; Picone, M.; Caffi, M.; Brambilla, M.; Ficetola, G.F.; Rubolini, D. The good, the bad and the ugly of COVID-19 lockdown effects on wildlife conservation: Insights from the first European locked down country. Biol. Conserv. 2020, 249, 108728. [Google Scholar] [CrossRef]
  67. Vardi, R.; Berger-Tal, O.; Roll, U. iNaturalist insights illuminate COVID-19 effects on large mammals in urban centers. Biol. Conserv. 2021, 254, 108953. [Google Scholar] [CrossRef]
  68. Katrakazas, C.; Michelaraki, E.; Sekadakis, M.; Yannis, G. A descriptive analysis of the effect of the COVID-19 pandemic on driving behavior and road safety. Transp. Res. Interdiscip. Perspect. 2020, 7, 100186. [Google Scholar] [CrossRef]
  69. Espinosa, J.C. La Fiscalía Alerta del Aumento de Accidentes en Carretera tras el Confinamiento. El País, 24 July 2020. Available online: https://elpais.com/espana/2020-07-24/la-fiscalia-alerta-del-aumento-de-accidentes-en-carretera-tras-el-confinamiento.html (accessed on 14 December 2020).
  70. Mezcua, U. Causas y Recetas Frente al Preocupante «Rebrote» de las Muertes en Carretera. ABC, 9 July 2020. Available online: https://www.abc.es/motor/trafico/abci-muerte-carretera-rebrota-tras-confinamiento-202007090140_noticia.html (accessed on 14 December 2020).
Figure 1. Study area.
Sustainability 14 04849 g001
Figure 2. Evolution of the WVCs (7-day moving average) in Asturias and Cantabria. Colored bars indicate, in all figures, the different phases of the COVID-19 lockdown in 2020 (red range: strict lockdown; green range: de-escalation).
Sustainability 14 04849 g002
Figure 3. WVC daily percentage variations during COVID-19 lockdown (compared to 2010–2019) with regard to traffic reduction (long-distance daily trip reduction) registered by DGT (2020). Colors of the points equal to those of the bars in Figure 2.
Sustainability 14 04849 g003
Figure 4. Variation of WVCs and traffic (long-distance daily trip) on holidays and working days during the different phases of COVID-19 lockdown. (a) Strict lockdown; (b) de-escalation.
Sustainability 14 04849 g004
Figure 5. Hourly distribution of WVCs during COVID-19 lockdown in 2020 (red or green line) and the equivalent period in 2010–2019 (gray line). (a) Strict lockdown; (b) de-escalation.
Sustainability 14 04849 g005
Figure 6. Percentage of WVCs occurring during COVID-19 lockdown with respect to the total for the year in 2020 (asterisks) and the equivalent periods from 2010 to 2019 (boxes) on conventional and high-capacity roads, and with roe deer and wild boar intervention.
Sustainability 14 04849 g006
Figure 7. Moving average (7 days) of % WVCs/day during lockdown COVID-19 in 2020 and equivalent period in 2010–2019 on ACRNs and SRNs in Asturias and Cantabria. (a) ACRN; (b) SRN.
Sustainability 14 04849 g007
Table 1. Main characteristics of the Asturias and Cantabria regions (NW of Spain).
RegionArea a
km2
Population a
Persons
Length SRN b
(High Capacity) b
km
Length ACRN b
(High Capacity) b
km
Traffic SRN b
(High Capacity) c
veh-km (km) × 106
Traffic ACRN b
(High Capacity)
veh-km (km) × 106
Asturias10,603.571,018,706851
(385)
4193
(81)
3555.9
(2879.47)
2031.6
(n.a.)
Cantabria5321.30582,796578
(258)
1984
(0)
3348.4
(2839.67)
1035.4
Source: a [11], b [12], c [13].
Table 2. WVC in ACRN and SRN of Asturias and Cantabria between 2010–2020.
Network20102011201220132014201520162017201820192020
ACRN473470498416383370470526622671612
SRN493477560471405401475546621627717
Table 3. Phases of COVID-19 lockdown affecting Asturias and Cantabria.
PhaseDates (Year-Month-Day)Description (Main Restrictions and Exceptions)Mobility aTraffic b
Strict lockdown startFrom 2020-03-14 to 2020-03-29Declaration of the national “state of alarm”.
Home confinement of the entire population (exceptions: buying food or medicines, going to work in essential services or emergencies).
Closure of every non-essential establishment (bars, restaurants, discos, coffee shops, cinemas, museums, libraries, commercial and retail businesses).
14–52%12–63%
Very strict lockdownFrom 2020-03-30
to 2020-04-09
Closure of all activities, with the exception of essential services.14–38%9–30%
Strict lockdown reducedFrom 2020-04-10
to 2020-05-03
Gradual opening of non-essential activities with many restrictions and, in the end, the population were allowed to go out in very short and pre-set time slots. Leaving the city of residence was totally forbidden.13–48%8–46%
End of strict lockdown (phase 0)From 2020-05-04
to 2020-05-10
Getting ready for de-escalation.
Consolidation of the final situation of the previous phase.
17–52%15–50%
De-escalation phase 1From 2020-05-11
to 2020-05-24
De-escalation starts.
Opening of non-essential activities.
Restricted opening of many shops and businesses.
Longer pre-set time slots for remaining outside the home.
31–68%19–61%
De-escalation phase 2From 2020-05-25
to 2020-06-07
Generalized opening of shops and businesses.
General permission to go out at any time but pre-set time slots reserved for people >70 years.
36–75%30–71%
De-escalation phase 3From 2020-06-08
to 2020-06-21
Pre-set time slots were cancelled.
Opening of all activities with limited capacity inside restaurants. Travel restrictions lifted.
End of the first national “state of alarm”.
43–82%49–84%
a Range values of “% of passenger-kilometer daily compared to the reference day” [22] for each phase. b Range values of “% long-distance daily trip number compared to the reference day” [21].
Table 4. Change in daily rates of wildlife-vehicle collisions (standard deviation) for 28 days immediately before and at the beginning of COVID-19 lockdown or equivalent.
YearBefore Lockdown or Equivalent (s.d.)Strict Lockdown or Equivalent (s.d.)Significance
20102.71 (1.54)3.04 (1.62)not significant
20112.36 (1.97)2.04 (1.10)not significant
20123.29 (1.76)2.79 (1.52)not significant
20132.11 (1.34)2.61 (1.34)not significant
20142.96 (1.88)2.79 (1.73)not significant
20151.79 (1.32)2.39 (1.23)not significant
20162.11 (1.55)2.29 (1.36)not significant
20172.71 (1.80)3.14 (1.38)not significant
20183.21 (1.75)3.11 (1.95)not significant
20194.25 (1.88)4.64 (2.78)not significant
20203.57 (2.17)1.89 (1.66)p < 0.01
Table 5. WVCs/mobility rates during different periods of 7 days.
Period (Year, Month, Day)WVC/MobilityObservations
From 2020-02-14 to 2020-02-207.36 × 10⁻⁸Reference period in [22]. Normality previous to the declaration of the COVID-19 lockdown.
From 2020-03-27 to 2020-04-212.91 × 10⁻⁸Strict COVID-19 lockdown.
From 2020-05-29 to 2020-06-46.90 × 10⁻⁸De-escalation COVID-19 lockdown.
From 2020-07-31 to 2020-08-63.58 × 10⁻⁸Normality in the summer vacation period.
From 2020-11-20 to 2020-11-2620.65 × 10−8Usually, peak WVC period of the year [5]. Very reduced mobility (28–77%) [22] due to the decree of new anti-COVID-19 measures.
Publisher’s Note: MDPI stays neutral with regard to jurisdictional claims in published maps and institutional affiliations.

