Article

E-Device Purchase and Disposal Behaviours in the UAE: An Exploratory Study

1
College of Natural and Health Sciences, Zayed University, Abu Dhabi P.O. Box 144534, United Arab Emirates
2
Institute of Management Technology, Dubai P.O. Box 345006, United Arab Emirates
*
Author to whom correspondence should be addressed.
Sustainability 2022, 14(8), 4805; https://doi.org/10.3390/su14084805
Submission received: 26 February 2022 / Revised: 1 April 2022 / Accepted: 2 April 2022 / Published: 17 April 2022

Abstract

:
The United Arab Emirates (UAE) is one of the high-income countries in the Middle Eastern region and is vying for sustainable development in every sector. One of the UAE sustainable development goals is to ensure sustainable consumption and production patterns; hence, the emphasis is on circular economy. UAE is one of largest consumers of e-devices, and their proper disposal is of paramount importance. E-waste disposal awareness leads to better disposal behaviors. Therefore, the purpose of the study was to understand the e-device purchase and disposal behaviour among university communities in the UAE. A survey was conducted among the students and staff members of a federally funded university in the UAE, namely Zayed University, and quantitative methodology was adopted to analyze the collected data. The study found that 47.95% of respondents purchased mobile phones, and 65% of the respondents purchased 1–3 electronic devices every year. Through chi-square test, gender of the respondents was found to be related with e-device ownership. Through the analysis of variance (ANOVA), age and field of specialization were found to affect the knowledge about e-waste. Older and the respondents with science specialization were more aware about e-waste. Most of the respondents disposed e-devices, such as batteries, earphones/headphones, and electronic toys, along with the household trash. A very small percentage of respondents disposed e-devices such as laptops, phones, and tablets with the household trash. Mostly, these were either repaired, donated, or sold to second-hand users. Many respondents were neither aware of the government initiatives on e-waste collection nor participated in government-sponsored e-waste recycling. The study further identified that 67% of the respondents were aware of the toxicity of e-waste, and 61% of the respondents were keen to join e-waste recycling drives at university. The findings of the study imply that the policy makers need to incentivize e-waste-disposal systems and develop targeted awareness approaches to enhance e-waste disposal in the UAE.

1. Introduction

E-waste is categorized as electronic and equipment waste, which includes all components, consumables, and sub-assemblies [1,2]. According to Global E-waste Monitor 2020, the generation of e-waste is increasing every year. In 2019, 53.6 million metric tons (Mt) of e-waste was generated, and the amount is projected to grow to 74.7 Mt by 2030. Many of the world’s economies are dependent on the huge consumption of electronics, and this waste generation is difficult to control with fewer options of repair and recycle [3]. Asia is the largest generator of e-waste with 24.9 Mt; the next is America at 13.1 Mt, Europe at 12 Mt, and Africa, which produces 2.9 Mt.
Globally, e-waste represents 5% of the waste generated, but 70% of the toxic waste around the globe is from e-waste [4]. E-waste contains many hazardous materials, and prominent among them are heavy metals (lead, mercury, etc.), brominated flame retardants, polybrominated biphenyls (PBBs), polychlorinated biphenyls (PCBs), and polybrominated diphenyl ethers (PBDEs) [5,6]. These e-waste chemicals can seep through multiple routes into the human system through the soil, water, and air and are harmful to life surrounding the e-waste disposal locations [7,8,9,10]. The mismanagement of e-waste-disposal practices is increasing around the world as e-waste quantity increases. Exposure to e-waste has been shown to have many health risks [11]. The persistence of heavy metals and organic pollutants has shown to cause neurotoxic effects on pregnant women, neonates, and children [12,13]. Polychlorinated biphenyls and halogen flame retardants have shown changes in thyroid hormone-related proteins and gene expression [14]. Exposure to heavy metals results in cognitive deficiencies and is a risk factor for affecting clotting and cardiovascular diseases [15,16].
Studies around the globe have shown that recycling of e-waste is poorly done and most of the e-waste is recycled through the informal sector [17]. Globally, World Economic Forum [18] reports that only 20% of the e-waste is formally recycled, and the remaining 80% goes into landfills or enters into the informal economy, and 4% remains as household trash. To mitigate the problems associated with e-waste, it must be recycled. Furthermore, e-waste contains several precious and critical metals, which, when recycled, could be used as secondary materials. Raw materials worth USD 10 million can be recovered in a sustainable method from e-waste. Major contributors to the increase in value of e-waste are metals such as iron, gold, and copper. Recycling iron, copper, and aluminium metals would result in reducing 15 Mt of CO2 emissions [3].
United Arab Emirates (UAE), along with Saudi Arabia and Kuwait, is one of the higher-income countries in the Middle East. UAE generates 162 kT (kilo tons) of e-waste and 15.0 kg per capita, which is almost similar to other high-income countries in Europe. UAE does not have a policy on the management of hazardous waste. It is a member state of the Basel Convention on the Control of Transboundary Movement of Hazardous Wastes and Their Disposal [2,3]. E-waste-recycling behaviour has been studied by very few groups in UAE and MENA (the Middle East and North Africa) region [19,20,21]. In their study, Meenakshisundaram and Sinha [19] studied e-waste-disposal behaviour in the UAE, and the findings were that there was an awareness gap concerning e-waste disposal. In addition, Hamouda and Adjroudi [21] studied the planned behavioural changes to enhance e-waste recycling. There are a limited number of studies that identify consumer behaviour towards e-waste in the UAE. For example, Attia et al. [22] explored consumers’ awareness towards e-waste and its disposal in Dubai. The study of Ben Yahya et al. [23] examined the determinants of smartphone recycling in Dubai and found that habit, knowledge, and skills have positive influence on recycling behaviour. However, considering the extent of e-waste generated in the UAE, there is a need to explore e-device purchase and disposal behaviour further in the UAE. To fill this gap in the literature this research study has been carried out.
To enhance e-waste recycling, e-waste-recycling behaviour has been widely studied. The understanding of purchase and disposal behaviour of consumers of electronic goods would suggest the policy makers to devise effective strategies for recycling electronic goods [24,25]. Studies have shown that demographic and socioeconomic factors play an important role in the recycling behaviour of the consumers [26,27]. The determinants of recycling of e-waste were studied by [28], and they found that the attitude and awareness towards recycling and inconvenience of recycling behaviour affects the recycling of e-waste [28]. The study performed by Wang et al. [29] found several key factors that influence e-waste recycling, especially in the informal sector. They were environmental awareness, attitude towards recycling, perceptions of informal recycling, and income and costs of recycling.
UAE’s electronic industry is very huge. In 2018, its electronics industry was around AED 14 billion [30]. Considering this, UAE has made important strides in the area of e-waste recycling. It has one of the world’s largest e-waste-recycling plants [31]. Abu-Dhabi, the capital of UAE, has major plans for the future in the area of e-waste management. The plans include building more storage facilities for e-waste, e-waste-treatment plants, and further modernization of already existing waste-treatment plants [32].
Our study is very important for e-waste management in UAE, as it tries to achieve its sustainable development goal (SDG), which relates to responsible consumption and production. There is a push for a circular economy (CE) involving better design, recycle, and reuse that needs to be adopted to reduce environmental pollution due to e-waste. In addition, a CE offers both economic and employment opportunities, as the total value of raw materials present in the e-waste is approximately USD 57 billion, which is still considered to be an underestimation [3]. While studying the circular economies related to e-waste in Brazil and Canada, Xavier et al. [33] said that it is very important for governments to bring about important legal measures and strategize to enhance the value recovery of materials of e-waste, which could lead to new business models and sustainability.
The findings of the study could be utilized to gain insights on e-waste disposal and recycling behaviour among the community members of the university and to provide inputs to policymakers to increase e-waste recycling. For example, the findings on the various methods of disposal for different types of e-waste would provide ideas to the policy makers towards a product family approach in e-waste management that would help in building CE [34].
The remainder of the paper provides a detailed literature review section that includes a review of studies emphasizing the importance and strategies for CE, sustainable competitiveness, and industrial symbiosis. This section also highlights studies in consumer behaviour towards e-device purchase and disposal. Thereafter, the paper includes materials and methods and results. Later, the paper discusses the findings covering the theoretical, managerial, and social implications. In the last section, limitations and the directions for future research are discussed.

2. Literature Review

2.1. Circular Economy

A CE is defined as an economy that emphasizes protection of environment and in turn leads to socio-economic benefits [35]. It pushes for reduction in utilization of primary resources and emphasizes waste minimization by closing the loop of products, product parts, and materials [35]. In CE, companies see cost-saving opportunities in strategies such as resource efficiency, resource loop closing, enhanced reuse, remanufacturing, and recycling [36]. With worldwide increase in e-waste, it is imperative that e-waste management is encompassed in global CE. As most of the e-waste management is done through the informal sector, a push for global CE will lead to a push for technical innovation and also lead to financial incentives for poorer regions of the world, as e-waste dumping and dismantling mainly occur there [37]. In their paper, Marinello and Gamberini [38] conducted a comprehensive literature review of studies on decision-making approaches towards e-waste management and found that the decision-making approaches covered dimensions such as environmental, economic, social, technical, and legal. Further, Tong et al. [39], who studied the flow of e-waste in China, found that even though a subsidy was provided to the formal recycling plants to take e-waste from the informal sector, a significant amount still remained in the informal sector due to complex marketing transactions. In their study, Hartley et al. [40] identified that policies must be conducive to enhance CE. Through interviews conducted with experts in CE, it was found that a push towards CE required more vigorous norms in production, tax relief for circular products, liberalization of waste trading and facilitation through virtual platforms, push for eco-industrial parks, and awareness campaigns [40].

2.2. Sustainability Competitiveness

For sustainable business, Rahman [41] proposed that companies adopt reverse supply chain process for reuse, recycle, or disposal of computers. This can also give a strategic advantage to companies who take up sustainability issues. Moreover, Maranesi and De Giovanni [42] suggested that CE should be considered as a part of corporate strategy. It would enhance business and allow the firm to achieve high targets, which not only would help social and environmental causes but also enhance circular supply chain, eco-innovations, and industrial symbiosis. Another key approach to enhance sustainability and green growth in CE was to promote industrial symbiosis and data utilization, as there was huge practical problem of information on material availability. In their qualitative study in Finland, Järvenpää et al. [43] sought Finland to understand how to enhance the efficiency of material by-products flows and concluded that development needs to be achieved on a larger scale and involve all the stakeholders.

2.3. Industrial Symbiosis

Industrial symbiosis (IS) is a collective approach in which separate industries have a cooperative network to exchange materials, energy, water, and by-products. It necessitates bringing together industrial ecology (IE) and CE by bringing together companies in such a way that the waste material of one company can be utilized by another company as its raw material. This can lead to reduction in virgin raw material usage and waste, resulting in better pollution management. As the CE involves closing the loop, industrial symbiosis can lead to reduction in energy use and emissions. CE explains how a cluster functions from the business standpoint, while IE explains the development and its impact on the environment and society [44]. Currently, Europe has some industrial symbiosis systems in place, for example, European Innovation Partnerships, National Industrial Symbiosis Program (UK), and Cleantech Östergötland (Linköping, Sweden). In their study, Wen and Meng [45] utilized the resource productivity (RP) indicator to evaluate the contribution of IS to the development of CE. It was observed that in the eco-industrial parks, which followed industrial symbiosis mechanisms, the resource productivity was enhanced in a waste-utilization scenario when compared to exclusion of waste utilization in the production of printed circuit board (PCB) in the utilization of copper. Likewise, Lopes [46] studied the waste-management regulations in small- and medium-scale enterprises (SMEs) in Portugal and suggested that regulatory compliances will result in a positive impact on innovation in different industries related to waste from WEEE.

2.4. Consumer Behaviour on E-Waste Recycling

The authors of Cao et al. [47] studied the e-waste awareness after the Chinese government put policies and environment management systems in place that were based on extended producer responsibility (EPR). The surveyed population was aware of the e-waste and its harmful effects but had very poor knowledge about the formal e-waste-recycling mechanisms and were not aware of the collection points. They observed that lower awareness about recycling of e-waste was a hindrance to CE. A tax subsidy should be provided for EEE that has DfE (Eco-design) for better recycling purposes. Chibunna et al. [48] studied the challenges faced in the management of e-waste in institutions through a case study in a single institution. They identified various drawbacks, such as poor data management, low awareness on e-waste, collection and disposal problems, lack of specific regulations, and policy on end-of-life WEEE equipment. In their study, Jayaraman et al. [49] studied household e-waste-management practices and observed that there was no formal e-waste recycling happening except that done informally by buyers and non-governmental organizations. Mahat et al. [50] studied e-waste awareness in a Malaysian community, and the findings were that there was an awareness regarding e-waste. The variables used for studying e-waste disposal were e-waste-disposal knowledge, e-waste-disposal attitudes, and e-waste-disposal practices. Each variable was divided into sub-variables, such as environmental, social, and economic. The study found that awareness level was very high, but disposal levels did not match it.
A study by Arain et al. [27] indicated that free access to disposal, lack of consumer knowledge about products and disposal sites, and access to a recycling facility within a reasonable distance are all important factors in consumer decisions. They suggested that the policy makers and waste-management professionals should focus on promotion of e-waste-recycling behaviors through increased access to free or low-cost recycling as well as through the creation of recycling incentives. Islam et al. [51] studied the university students’ awareness, perception, and disposal patterns of e-waste. The results showed that awareness existed, but the population severely lacked knowledge about the e-waste-collection points and the recycling programs available. Respondents in this study showed an inclination for e-waste recycling, which positively influences laptop recycling. In their study, Sari et al. [52] conducted a survey in Indonesia among consumers of smartphones and found the positive effect of government drivers, facility accessibility, and personal attitudes on consumer intentions to participate in e-waste collection. In their study, Attia et al. [22] studied the disposal behavior of cell phone e-waste in Dubai, UAE, and found that the household awareness of e-waste was poor, and households also had poor recycling of e-waste.

2.5. Investigation Model and Hypotheses Development

This study proposes an investigation model for the possession of e-devices and knowledge on e-waste with the support of extant literature. The investigation model is presented in Figure 1. The investigation model is further detailed as specific hypotheses in the following sub-sections.

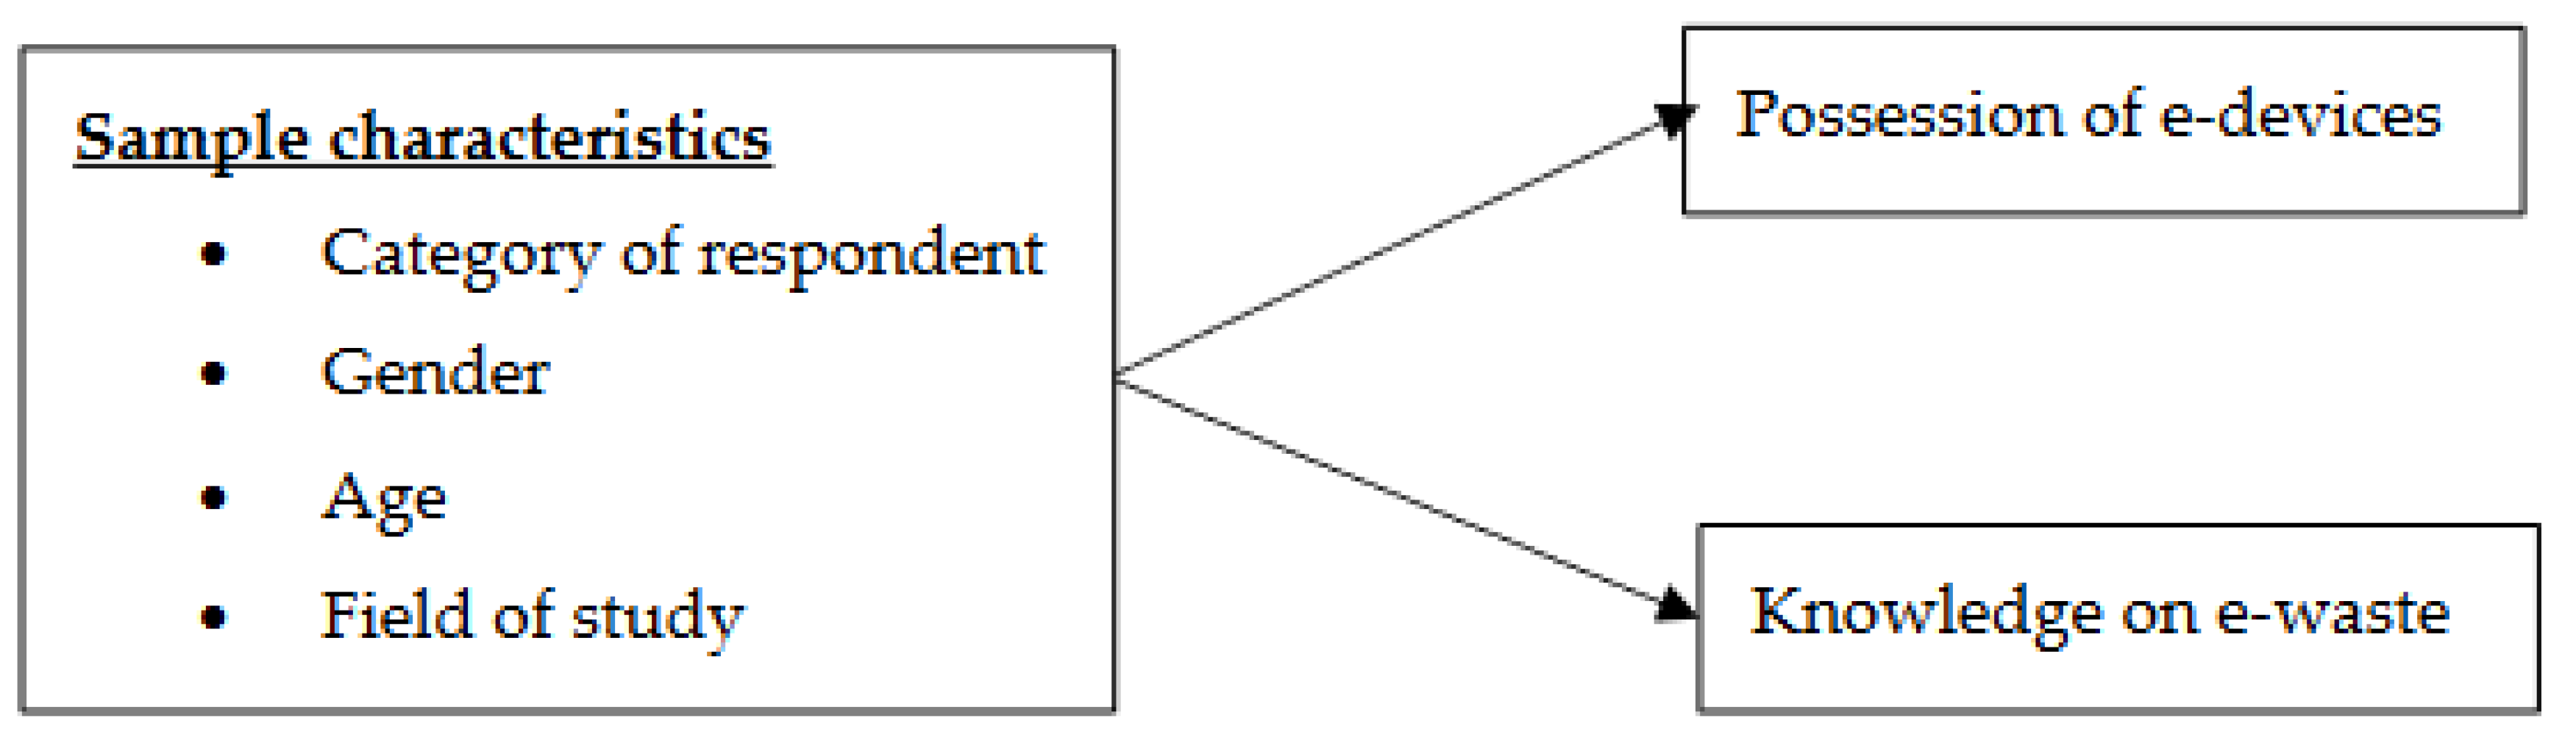
2.5.1. Effect of Sample Characteristics on Possession of E-Devices

The hypothesis on the effect of category of respondents on possession of e-devices is proposed with the assumption that the students are up-to-date about the new technology and have the tendency to buy all the possible electronic gadgets introduced in the market. Previous research suggests that there is no relationship between occupation and loyalty towards electronic product [53]. The study of Arain et al. [27] found that ownership of e-devices differs across affiliation category of respondents.
H1a. 
Possession of e-devices is dependent on category of the respondents.
In their study, Islam et al. [51] found that gender and number of e-devices in use are related. Findings of one research study conducted in India suggests that there is no relationship between gender and brand loyalty when the consumers engage in the purchase of electronic products [53]. However, we propose the following hypothesis with the assumption that male respondents would possess more e-devices than females. This assumption is due to the reason that male respondents, especially students, are more prone to the habit of buying and using newly launched electronic gadgets.
H1b. 
Possession of e-devices is dependent on gender.
The assumption for this hypothesis is that younger respondents have the tendency to possess more e-devices than the older respondents, as we expect that the younger respondents are more aware of the electronic products, and they use these products more often. Previous research suggests no relationship between age and loyalty towards electronic products [53]. Research from Islam et al. [51] found that the age and number of e-devices in use are related.
H1c. 
Possession of e-devices is dependent on age of the respondents.
Kumar and Kumar [53] found that there is no relationship between education and loyalty towards electronic products. In their study, Islam et al. [51] found that the level of education and number of e-devices in use are not related. However, we propose the H1d hypothesis under the assumption that the respondents who are associated with science and engineering fields would possibly have more inclination to use electronic products than those in the arts and commerce fields.
H1d. 
Possession of e-devices is dependent upon field of study.

2.5.2. Effect of Sample Characteristics on Knowledge on E-Waste

The study from Arain et al. [27] found that the knowledge on e-waste differs across the affiliation category of respondents. The following hypothesis is proposed with the assumption that staff would have more knowledge than the students due to their experience.
H2a. 
The knowledge on e-waste is dependent on category of the respondents.
Previous research on the effect of gender on pro-environmental behaviour found contrasting results. In their study, Islam et al. [51] found that gender and knowledge on e-waste are not related. Some studies found that the males were more conscious towards environment than females [54,55]. Contrastingly, some studies found that the females were more conscious towards environment that males [56,57]. In line with [56,57], we expect that the female respondents would have more concern towards the environment and well-being of the society.
H2b. 
The knowledge on e-waste is dependent on gender of the respondents.
The hypothesis is proposed with the assumption that older respondents would have more knowledge of e-waste than the younger respondents. The study of Islam et al. [51] found that the age and knowledge on e-waste are related. In previous research, a positive relationship between age and pro-environmental behaviour found [56,58]. Moreover, Getzner and Grabner-Kraüter [59] found that the consumers who are younger tend to be more environmentally friendly than older consumers. However, Abeliotis et al. [60] found that the awareness towards environment tend to increase with age.
H2c. 
The knowledge of e-waste is dependent on age of the respondents.
The study of Islam et al. [51] found that the level of education and knowledge on e-waste are not related. Several studies confirmed that education and pro-environmental behaviour are related [55,61,62]. This hypothesis is proposed with the expectation that the respondents from the natural and health sciences and engineering fields of study would tend to have more knowledge on e-waste than the respondents from the arts and humanities fields of study.
H2d. 
The knowledge on e-waste is dependent on field of study.

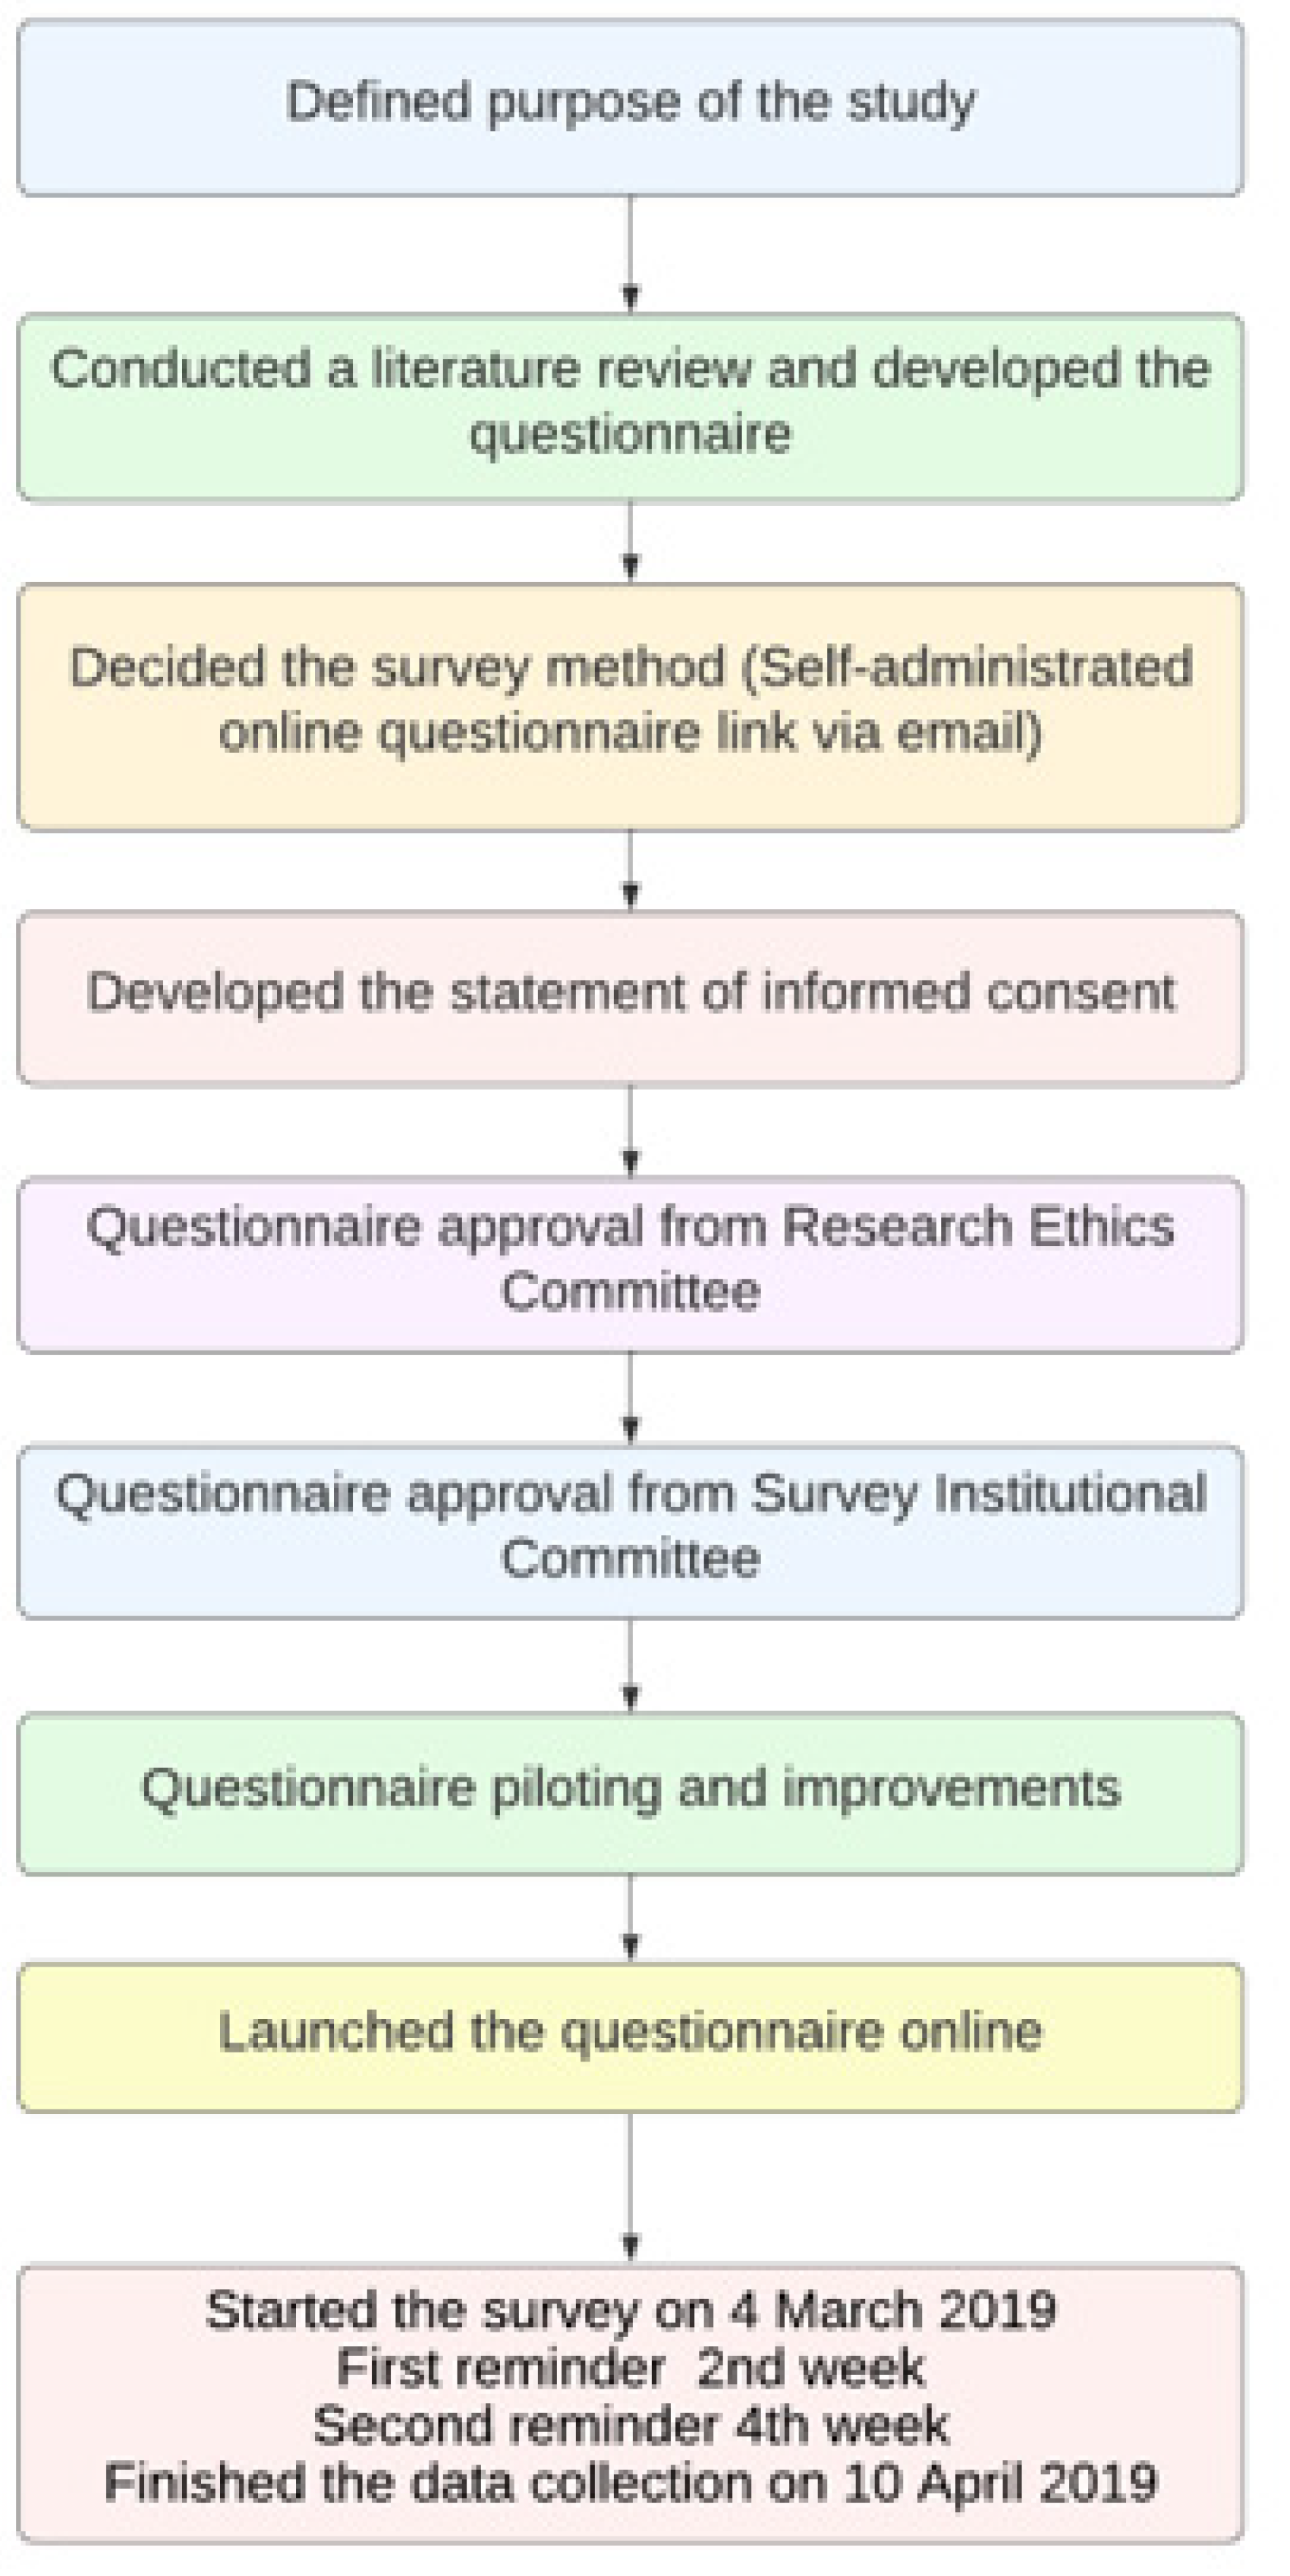
3. Materials and Methods

A questionnaire was prepared to understand electronic device-purchase behaviour and awareness on e-waste management and e-waste-disposal behaviour. Please refer to Appendix A for the questionnaire used in the study. The questionnaire included three important sections. The first one intended to capture sample characteristics, such as member category (whether it is a student or staff), gender, age, and major field of study. The second section included questions on e-device-purchase behaviour. Specifically, questions on most common e-device purchased, number of e-devices in possession, and expenditure on e-device purchase every year were incorporated.
The third section of the questionnaire was intended to understand members’ awareness of e-waste management and e-waste-disposal behaviour. Members’ knowledge of e-waste was measured on a 6-point interval scale, wherein 0 signifies “I know nothing”, and 6 signifies “I am an expert”. The response was gathered by providing the following description, “Electronic waste, also known as e-waste, is the discarded electronic device. E-waste includes but is not limited to: batteries, earphones/headphones, keyboards, electronic toys, TVs, printers, cables, circuit boards, phones, clocks, calculators, radios, DVD players, iPods, MP3 players and CD players, lamps, and computer mouse. On a scale of 0–5, how much do you know about ‘E-Waste’ before reading the above description?”. The questionnaire included questions on how the members disposed of a number of e-waste items, such as batteries, earphones, MP3/MP4 player or iPod, laptop, tablet, mobile phone, electronic toys, PC, monitor, and printer/scanner. The respondents were asked to provide their response for any of the following categories: put it with other household trash, repair it, sell it to a second-hand user, donate it to a second-hand user, sell it to a scrap dealer, and others. They were asked to choose all the applicable categories. Later, the question on members’ awareness of the detrimental effects of e-waste was asked. Finally, the questionnaire included questions related to e-waste management, such as e-waste collection familiarity, participation in e-waste collection, interest in joining the e-waste-collection scheme, and interest in donating e-waste for free. The questionnaire was pre-tested by conducting face-to-face interviews with 20 respondents. The questionnaire was improved in terms of rephrasing the language of the questions and the sequence of the questions.
The study was conducted in Zayed University (ZU), which is a government university in the UAE, established in 1998 to provide higher education for UAE citizens. ZU comprises seven colleges in the following disciplines: business, communication and media sciences, education, humanities and social sciences, natural and health sciences, technological innovation, and interdisciplinary studies. More than 95% of the student population at ZU is enrolled in various undergraduate programs [63]. The university has two campuses: one in Abu Dhabi and another in Dubai. This study was granted ethics approval from ZU research ethics committee and the ZU institutional survey committee. Applicants whose research ethics application are approved receive a letter confirming the approval and are provided with an ethical clearance number together with other relevant information. The questionnaire was prepared in English. Data collection took place during 4 March–10 April, 2019, in ZU, Abu Dhabi, UAE. There was an invitation letter before the questionnaire page explaining to the participants the scope and purpose of the study. Only those who accepted and were satisfied to be part of the study proceeded further to fill the questionnaire. The completion time for the survey is approximately 10 min. The proposed methodology’s summary is indicated in the flow chart of Figure 2.
For the main study, the questionnaire was converted into a google form, and the link of the Google form was sent to 455 respondents. In the first two weeks of the study, 187 responses were received. Later, a reminder e-mail was sent to all respondents with a note to “Please ignore this reminder, if you have already responded to the survey”. In the second two weeks, 75 responses were received. A second reminder e-mail was sent after four weeks, which resulted in 35 additional responses. In total, the study received responses from 297 respondents, resulting in a response rate of 65.27%. The responses from 5 respondents were not in usable form, as more than 50% of the questionnaire was not filled out. Responses from these 5 respondents were removed from further analysis, which resulted in a total sample size of 292.

4. Results

The collected data were subjected to both analyses of descriptive and inferential statistics. The inferential statistical analysis was performed through percentage analysis, analysis of variance (ANOVA), and cross-tab analysis by using IBM-SPSS.

4.1. Descriptive Statistics of the Sample of Respondents

The descriptive statistics of the sample of respondents are presented in Table 1. The sample of respondents included mostly undergraduate students (92.81%) (as majority of student population are undergraduate students) except for 7.19% of academic staff (advisors and administrative assistants). The ratio of females to males was almost 2 to 1 (68.49%:31.51%). Concerning the sample’s age group, the majority (71.23%) of respondents were in the age category of 20–29 years old, one-quarter (25.68%) of respondents were in the age category of 17–19 years old, and a minority (3%) of respondents were in the age category above 30 years old. Concerning the major field of study of the respondents, 38.70% of respondents were from engineering and IT, 19.18% were from business, 17.12% were from natural and health sciences, and the remaining respondents were from other fields of study.

4.2. E-Device Purchase Behaviour

4.2.1. E-Device Purchase

Table 2 shows responses of the second section of the questionnaire, where purchase behaviour was captured in terms of the most common e-device purchased every year, the number of e-devices possessed yearly, and expenditure on e-device purchase every year. A little less than half (47.95%) of respondents purchased a mobile phone every year. Next-ranked were the electronic toys (22.95%), speakers (18.52%), laptops (15.75%), printer/scanners (11.64%), and tablets (1.33%). Less than 10% of respondents purchased an MP3/MP4 player/iPod, a monitor, or a PC. The majority of respondents (85.41%) purchased one to three e-devices, approximately one-fifth of respondents (19.86%) purchased four to six e-devices, and 8.56% of respondents purchased more than six e-devices. Interestingly, 6.16% did not purchase any e-device annually. Just less than half (45.89%) of respondents spent AED 1001–5000, almost one-quarter (26.03%) of respondents spent AED 501–1000, 15.97% spent less than AED 500, and 10.62% of respondents spent AED 5001–10,000.

4.2.2. Relationship between Sample Characteristics and Possession of E-Devices

To explore the relationship between the sample characteristics (category, gender, age, and field of study) and possession of e-devices, a cross-tab analysis was performed with chi-square as the test statistic. The results of this analysis are presented in Table 3. It was observed that category (chi-square value = 1.602; p-value = 0.659), age (chi-square value = 11.766; p-value = 0.465), and major field of study of respondents (chi-square value = 23.994; p-value = 0.462) did not have any effect on the number of e-devices possessed by the respondents. Thus, H1a, H1c, and H1d of our study were not supported. Interestingly, gender was found to have a significant effect on the number of e-devices possessed by the respondents, with a chi-square value of 10.544 and a p-value less than 0.05. Thus, H1b of our study was supported. However, female respondents were found to own more electronic products than male respondents.

4.3. E-Waste Disposal Behaviour

4.3.1. Relationship between Sample Characteristics and Knowledge of E-Waste

The knowledge of e-waste was measured on a six-point interval scale. To understand the relationship between sample characteristics and knowledge of e-waste, an analysis of variance (ANOVA) was performed. The results of ANOVA are shown in Table 4. The results show that age (F-value = 4.50; p-value < 0.01 level) and major field of study (F-value = 2.238; p-value < 0.05 level) were found to have a significant effect on knowledge of e-waste. Thus, H2c and H2d of study were supported. The independent variable, gender, was found to significantly affect knowledge of e-waste at p-value < 0.10 (F-value = 2.762), supporting H2b of our study. The results showed that the category of respondents had no effect on knowledge about e-waste (F-value = 0.075; p-value = 0.785). H2a of our study was not supported.

4.3.2. Ways of E-Waste Disposal

Table 5 shows how the respondents dispose different types of e-wastes. E-wastes such as batteries (54.45%), earphones/headphones (50.68%), electronic toys (35.27%), and speakers (29.45%) were mostly put with the other household trash. E-wastes such as laptop (45.89%), tablet (40.07%), PC (35.27%), monitor (29.45%), and printer/scanner (34.59%) were mostly repaired. E-waste in the form of an MP3/MP4 player or iPod was mostly (28.08%) donated to a second-hand user. Less than 20% of the respondents chose selling e-waste to second-hand users or scrap dealers or used other means of disposal.

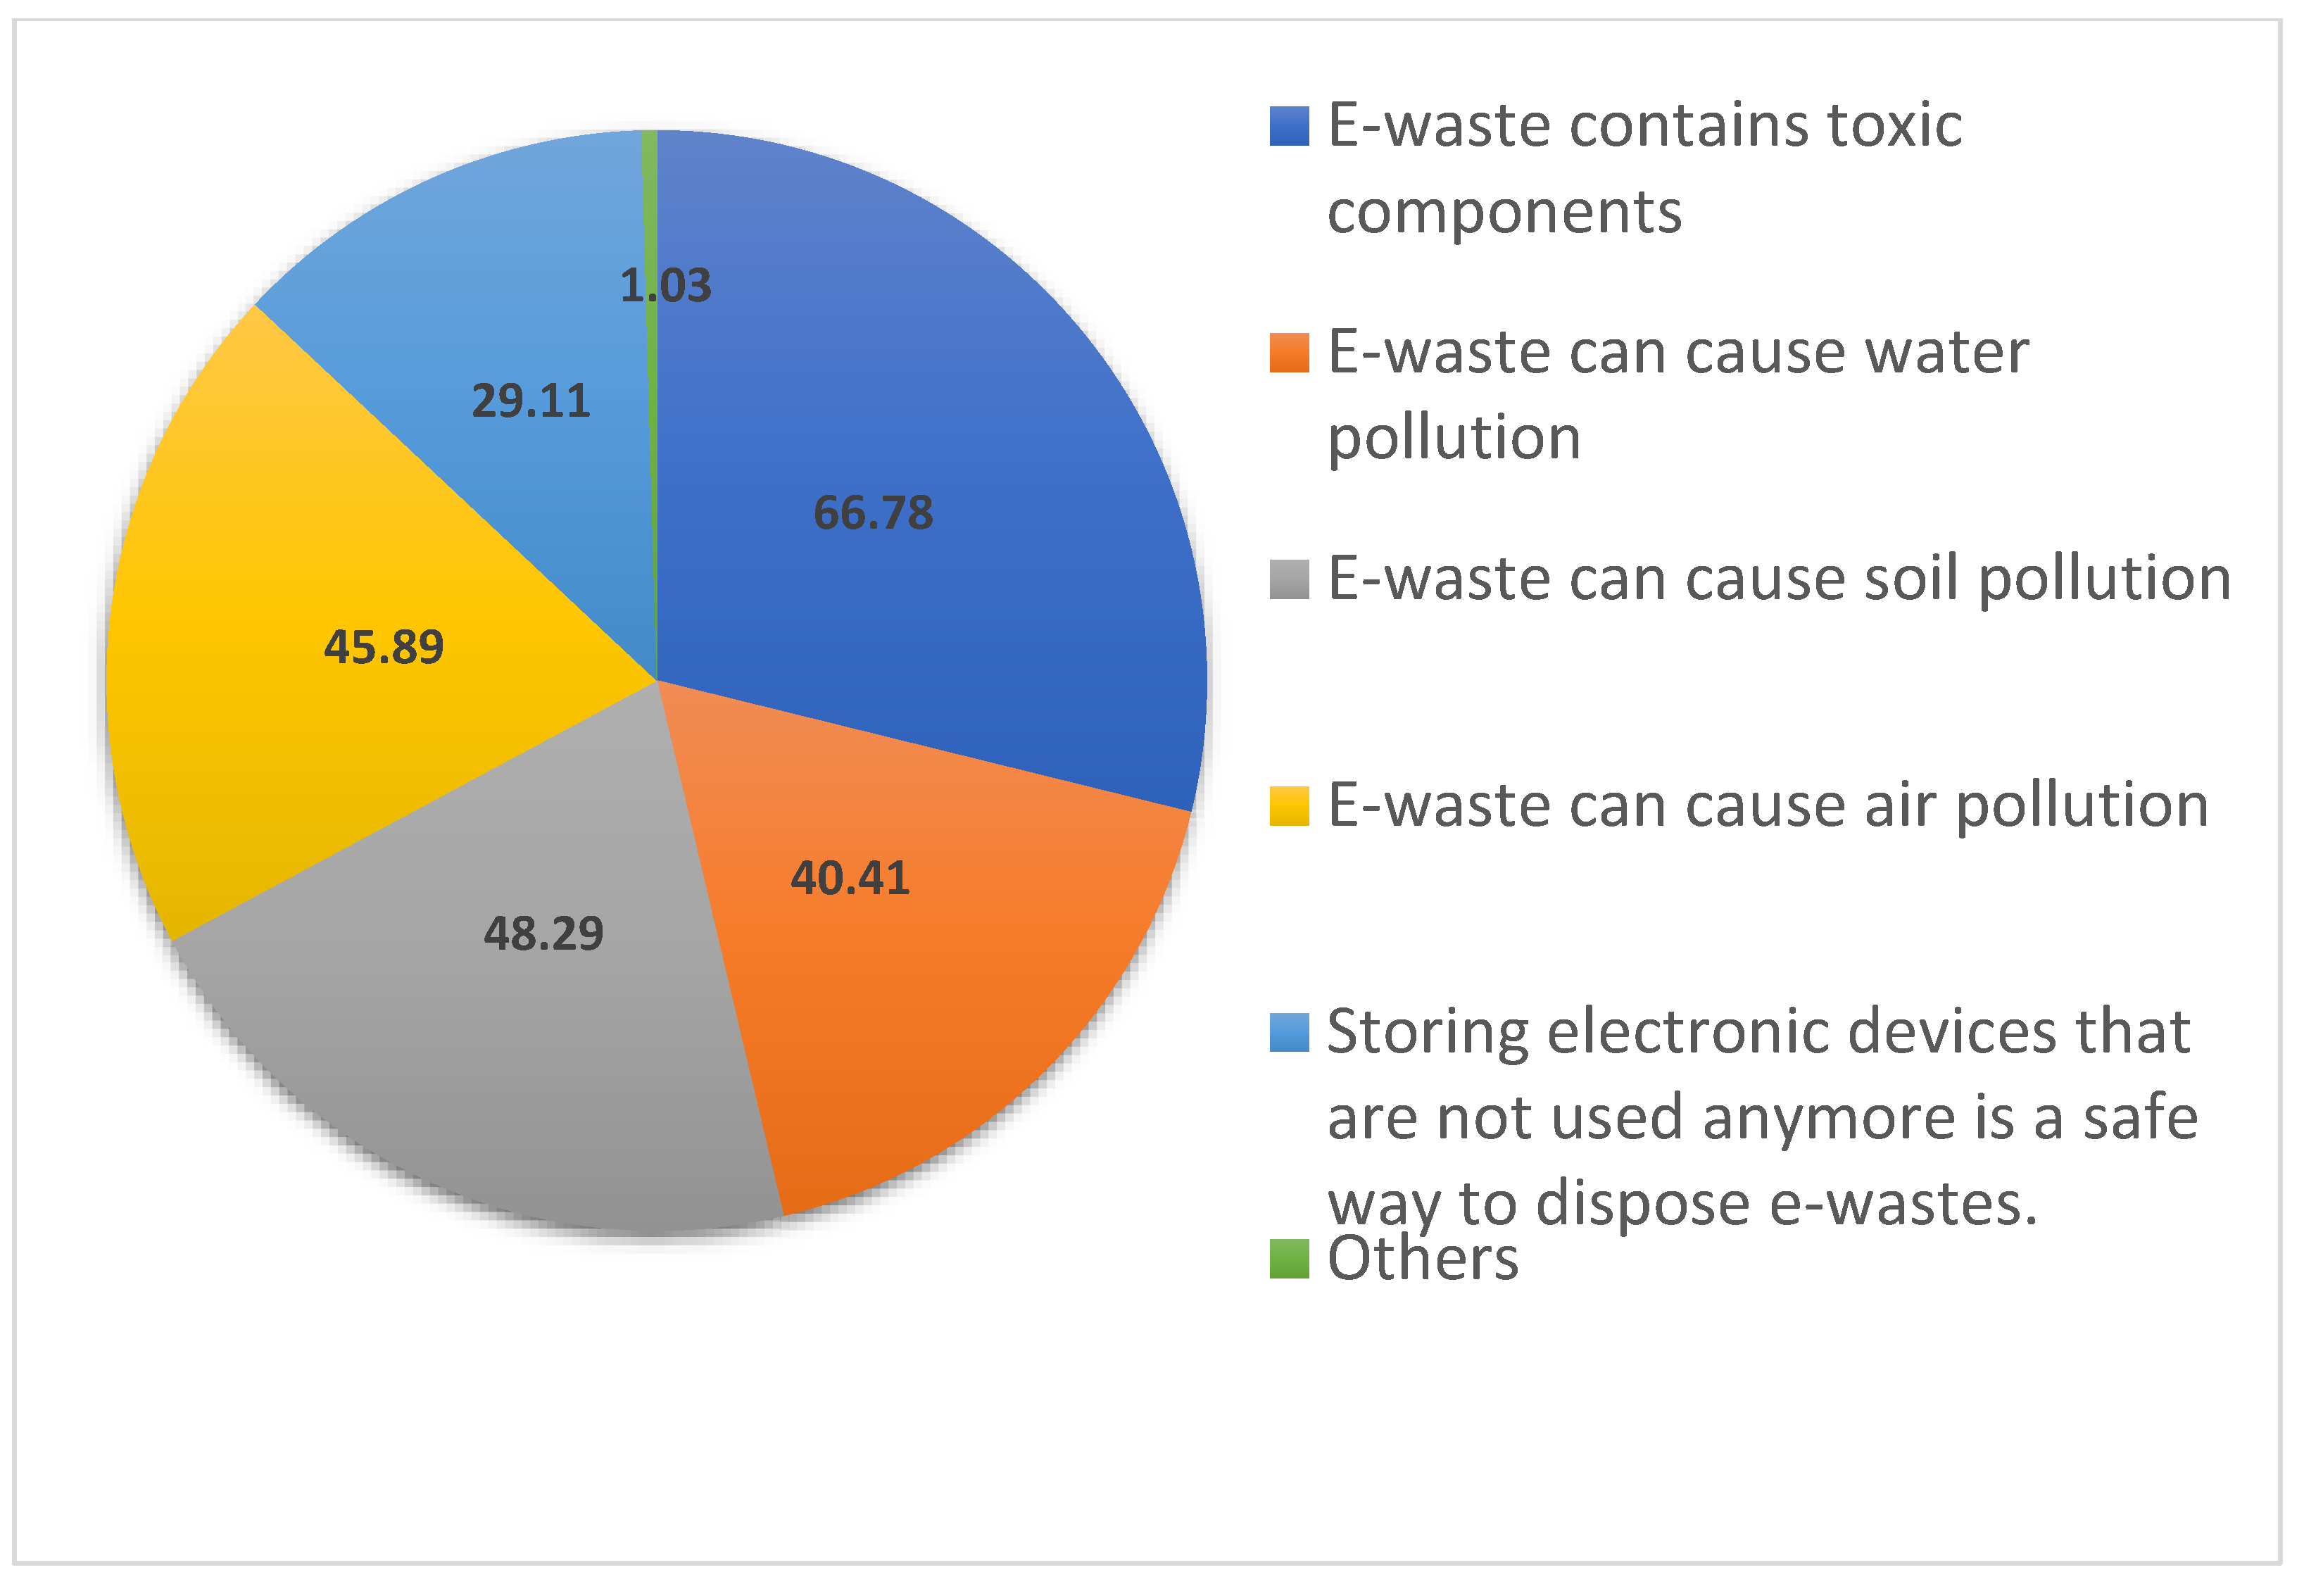
4.3.3. Awareness of Detrimental Effects of E-Waste

Figure 3 shows the respondents’ awareness of the detrimental effects of e-waste. A total of 66.78% of respondents were aware that the e-waste contains toxic components. Another 48.29% of respondents considered that e-waste can cause soil pollution. Furthermore, 45.89% and 40.41% of respondents opined that e-waste can cause air pollution, and e-waste can cause water pollution, respectively. Interestingly, 29.11% of respondents were also aware that storing unwanted e-devices was a safe way to manage e-waste.

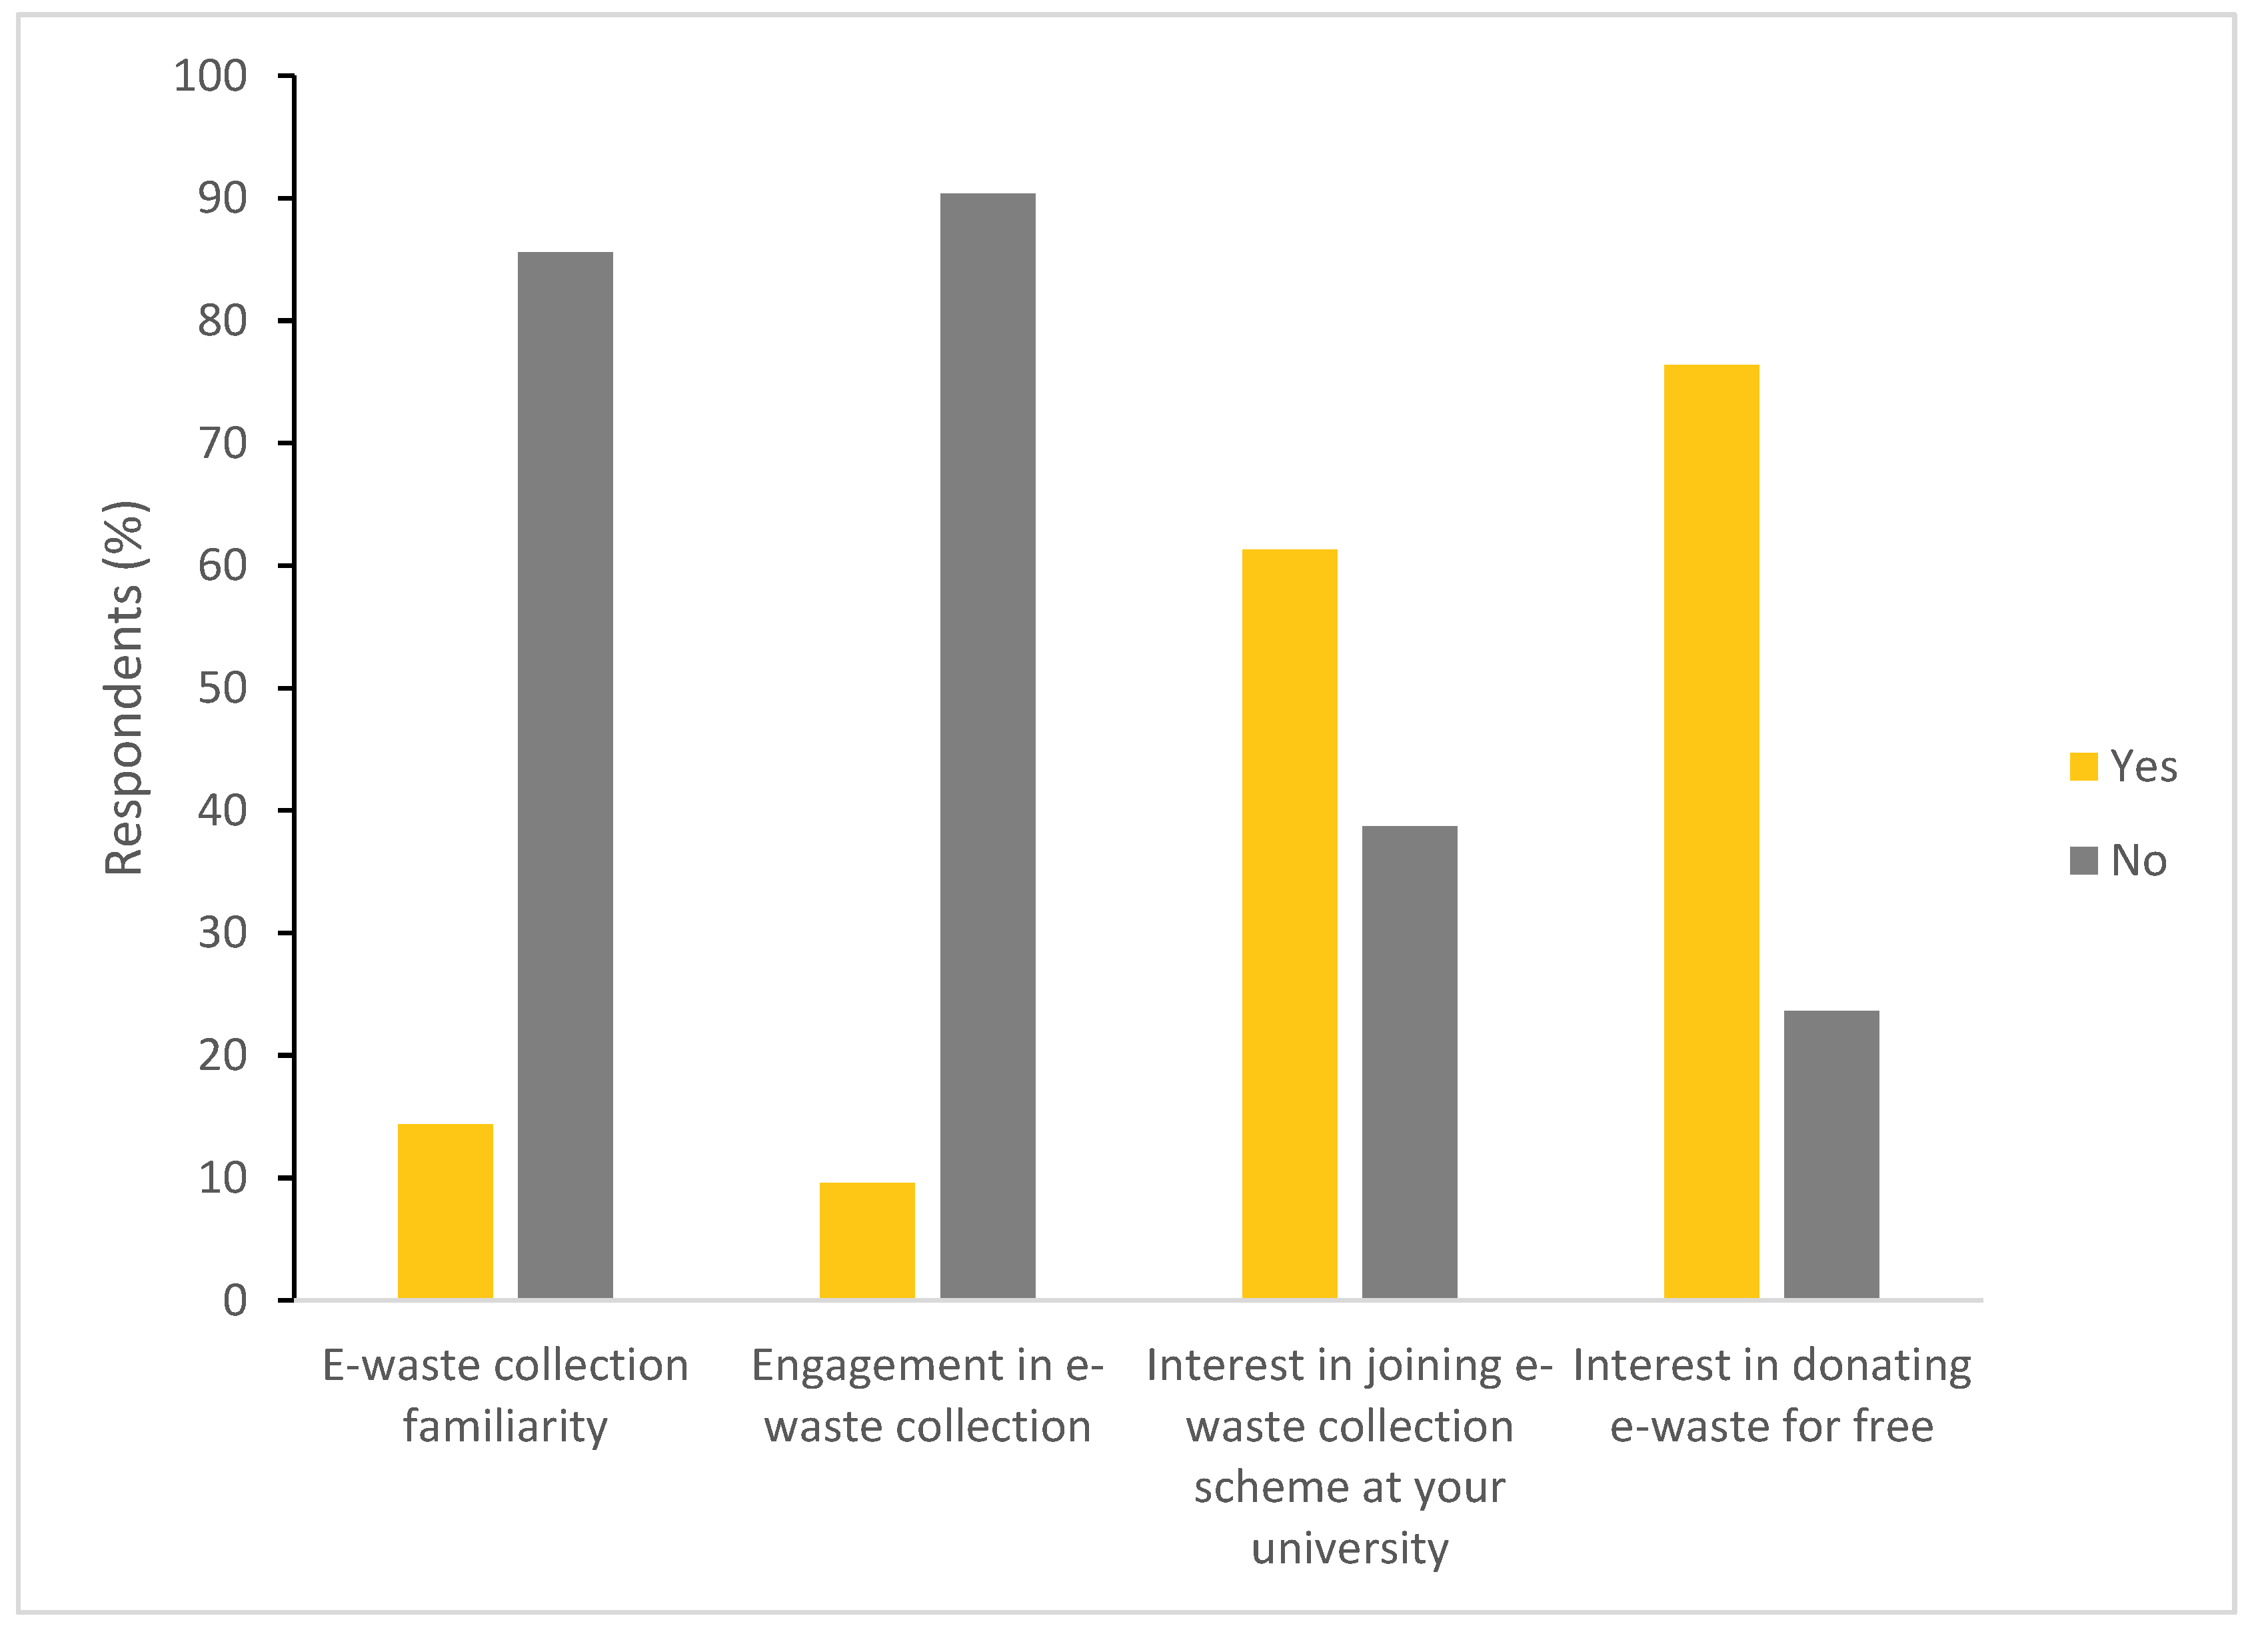
4.3.4. Participation in E-Waste Management

As shown in Figure 4, most (85.62%) of the respondents were not aware that e-waste was being collected by government authorities. Furthermore, 90.41% of respondents did not participate in e-waste-collection schemes organized by any authorities. However, 61.30% of respondents showed interest in joining e-waste collection at the university. Importantly, 76.37% of respondents showed inclination to donate the e-waste free of cost.

5. Discussion

The findings of the study lead to understanding of e-device purchase and e-waste awareness and disposal behaviours of university communities in the UAE. Regarding e-device-purchase behaviour, the study specifically revealed which e-device was purchased more often, the number of e-devices in possession, and the expenditure on e-devices. The study measured knowledge of e-waste and further investigated the awareness across different sample characteristics. The study identified how different kinds of e-devices were disposed. Further, the study investigated the level of awareness about the detrimental effects of e-devices and willingness to participate in e-waste-management initiatives.
The findings of e-device-purchase behaviour revealed that 47.95% percent of the population was involved in the purchase of mobile devices every year. Even though mobile phones are a durable product, the huge percentage of respondents purchasing mobile phones every year is an alarming phenomenon. This is happening because people are replacing their phones due to fast-changing technology. In their study, Bai et al. [64] observed that mobile phones were being replaced not because they were broken but due to advances in technology and new models entering the market, and also, the average service time for mobile phones was almost two years. As consumers buy more mobile devices, the more frequently they will also become e-waste. It was also observed that in e-waste, the quantity of small e-waste materials from mobile phones is constantly increasing. Chen et al. [65] found that the integrated potential toxicity of mobile phones waste increased even though increase in technological innovations were observed, and more regulations were put in place. This shows that technological innovations are more focused on the market than on toxicity reduction. One of the unexpected aspects of the purchase behaviour amongst the university students was the purchase of electronic toys. After mobile phones purchase, the respondents were buying more electronic toys annually. Around 22.95% of the respondents were purchasing electronic toys. The problem with electronic toys is that they can easily become part of e-waste, as it is very difficult to repair or recycle the small and cheap electronics inside them. As the smart toys industry is set to grow to a USD 18 billion market by 2023 [66], electronic toys are going to contribute to more e-waste. Electronic toys have toxic, flame-retardant materials. Many countries and the EU have a policy that flame-retardant materials in toys need to be reduced since they are highly toxic to the environment [67], but the same policy does not apply to toys made from recycled hazardous plastic. Other commonly purchased e-devices were laptops (15.75%), tablets (12.33%), and speakers (19.52%). With the increase in online education, the demand for laptops and tablets has increased.
Among the respondents, 65% of them owned 1–3 devices, and 22% of them owned 4–6 devices, and the respondents spent AED 1000–5000 annually on e-device purchases, and 26% spent AED 501–1000. The chi-square test results showed that the age, category, and major field of study did not have any effect on the number of devices owned by the respondents. However, gender was found to be significantly related with number of devices owned. Females were found to own more e-devices than males.
The analysis of the relationship between sample characteristics and knowledge of e-waste through ANOVA revealed that there is no effect of category and gender on knowledge of e-waste. Even though the difference is not statistically significant, females were more aware of the e-waste than males (significant at p-value < 0.10 level). Age and field of specialization were found to significantly affect knowledge of e-waste. The results showed that the respondents who were studying science-related subjects had more knowledge about e-waste when compared to the students in other streams of education. This study agrees with other studies that have shown that the respondents from the science background are more knowledgeable about the environment, and also, the awareness of females about the environment is greater when compared to males [27,68]. The findings of the study suggest that age and knowledge about e-waste are related. Older respondents appeared to have more knowledge about e-waste than younger ones.
Studies have shown that e-waste recycling can be enhanced in the young population by having online e-waste-collection platforms, which increases the ease of use by the participants. When e-waste collection is done online, it encourages formal ways of recycling when compared to informal ways [69]. Many of the respondents were disposing e-waste with the general household trash. Batteries (54.45%), earphones (50.68%), and electronic toys (35.27%) to a larger extent were put in the household trash. E-waste in household trash is a universal problem. As e-waste is highly toxic when compared to general household trash, there is an urgent need to reduce e-waste going out as household trash. One of the ways of stopping e-waste from being thrown out along with household trash is to ban e-waste in household trash [70]. It is also recommended that awareness about e-wastes contaminating household trash should be targeted towards more females, as they are the ones who are managing households. Many studies have shown that females have more environmental awareness and are willing to pay more to buy eco-friendly products [71,72].
The study showed that many of the e-devices such as laptops (45.89%), phones (42.81%), tablets (40.07%), PC (35.27%), and printers (34.59%) were mostly repaired. A very small percentage (less than 10%) of the respondents reported that they dispose laptops, phones, and tablets along with the household trash, and 40–50% of the respondents mentioned that they either donate these e-devices to others or sell them to second-hand users. Repair and reuse are considered to be a positive sign of reducing e-waste generation when compared to being put in household trash or being stored in the house. The ability to have things repaired stops e-waste from becoming waste and leads to value creation [73]. The government and manufacturers should focus on developing a stronger system that promotes recovering material from end-of-life (EOL) e-devices and supporting reuse, refurbishment, and remanufacturing [34]. Consumers’ preferences for green electronics can also push manufacturers to move towards more repair-oriented products [74]. Economies of repair and reuse are very important for reducing e-waste and can lead to the formation of secondary-use industries [73,75]. As the study has shown that e-waste was being sold to second-hand consumers informally, this can be further enhanced to bring informal e-waste collection into formal e-waste management to keep track of the e-waste being generated.
In our study, we found that 66.78% of the respondents were aware that the e-waste contains toxic components. Almost half of the respondents were aware that this toxic waste can cause soil, water, and air pollution. A positive sign of the study was that at least 29.11% of respondents were aware that storing e-waste was not a safe way of managing it.
It is important to note that many respondents (85.62%) were not aware about the government initiatives for e-waste collection. This finding implies that government agencies should advertise the e-waste-collection initiatives more effectively [76]. These findings are similar to [51], who found that the university students’ awareness of the e-waste existed, but they were not aware about the formal e-waste-recycling mechanisms put in place by the government. The study also showed that a large population, 90.41%, did not participate in the e-waste collection and also were not aware of the government-run e-waste-collection facilities in UAE. The results obtained in the study are similar to other studies where awareness did not necessarily lead to behavioural changes in recycling. A study carried out regarding e-waste-disposal behaviour in Malaysia also found that even though awareness levels of e-waste were high, but it did not convert into recycling of e-waste [50]. In their study, Arain et al. [27] also found that the recycling behaviour did not correlate with education.
The study found that 61.3% showed interest in participating in e-waste collection at the university. As the respondents have shown strong inclination to join proper e-waste disposal, it is imperative that the government runs special education plans in the university system to tap into this enthusiasm and enhance e-waste management [70,76]. Studies have shown that an increase in awareness drives change in recycling attitudes in a population. Furthermore, the convenience of recycling and reduced distances to collection points brings about changes in recycling behaviour [77]. Organizations should also identify internal and external barriers in the implementation of reverse logistics of created e-waste and put efforts into reducing these barriers [78].

6. Conclusions

The study was carried out to understand the e-device purchase and e-device-disposal behavior in the university communities in the UAE. As UAE is one of the major purchasers of e-devices, it is important to understand e-device-disposal methods and the level of awareness amongst the population regarding its disposal. With respect to e-device-purchase behaviour, the study found that 65% respondents owned 1–3 devices, and around 45% respondents spent AED 1000–5000 every year on e-devices. Interestingly, female respondents owned more e-devices than males. E-devices such as phones, laptops, tablets, PCs, and printers were mostly repaired, donated, or sold to second-hand users. The study also found that most of the respondents did not participate in any e-waste-collection program. Even though UAE has made major strides in the e-waste-disposal systems, there was still very poor awareness amongst the university students about the government’s schemes in e-waste disposal. Overall, the study theoretically implies that the UAE has the potential to contribute towards circular economy, as the results of the study suggest the people engage in pro-environmental behaviour while disposing e-waste. The findings about unawareness of the e-waste-disposal mechanisms practically imply that this could lead to failure of the pro-environmental e-waste-disposal programs run by the UAE government. As the majority of the respondents were not disposing e-waste properly, the practical implication of this is that policy makers should target awareness approaches and incentivize e-waste disposal. As many respondents were repairing, donating, or selling their e-devices to second-hand users informally, it is important to bring this into the formal sector to enhance a circular economy. The societal implication of the study is that proper disposal of e-waste could lead to environment benefits and also lead to revenue generation, as precious metals could be extracted.
Broadly, this study filled the gap of limited UAE-based studies in the e-waste literature and contributed in terms of recording the e-device purchase and disposal behaviours of university community members in the UAE. However, as the findings of the study are drawn from the survey conducted specifically among the community members of a federally funded university in the UAE, the findings need to be interpreted with caution when they are used in other contexts. The major limitation of the study is that the e-device purchase and disposal behaviours of the general population of the UAE could be different from that of the findings reported in the study. Furthermore, the study did not emphasize the comparison between the e-device purchase and disposal behaviours of the local Emirati population and that of the expatriate resident population (as 88.5% of the population of the UAE are expatriate residents [79]. Future research could explore e-waste-management practices of educational institutions in the UAE. Future research could empirically investigate the e-waste-recycling behavior through the application theory of planned behaviour and theory of reasoned action. Furthermore, repair and e-waste-recycling practices of the general population and the involvement of the informal sector in e-waste recycling could be empirically investigated [80]. Future research could also specifically address the e-waste purchase and disposal behaviours of the expatriate resident population in the UAE. Furthermore, future research could also investigate the e-device purchase and disposal behaviour of expatriate resident population of UAE when they bring the purchased e-devices to their home country.

Author Contributions

Data curation, M.E.G. and L.M.; formal analysis, W.K.A.; project administration, M.E.G.; resources, F.M.H.; visualization, F.M.H.; writing—original draft, A.S.; writing—review and editing, A.S., W.K.A. and M.E.G. All authors have read and agreed to the published version of the manuscript.

Funding

The APC was funded by [ZAYED UNIVERSITY, ABU DHABI, UAE].

Institutional Review Board Statement

The study was conducted in accordance with the Declaration of Helsinki, and approved by the Ethics Committee) of ZAYED UNIVERSITY, ABU DHABI, UAE (Application No. ZU18_37_F; 26 March 2018).

Informed Consent Statement

Informed consent was obtained from all subjects involved in the study.

Acknowledgments

This work was supported by the College of Natural and Health Sciences, Zayed University, Abu Dhabi, UAE.

Conflicts of Interest

The authors declare no conflict of interest.

Appendix A

Survey about Electronic Waste, also known as E-Waste
You are invited to participate in this study that explores the behavior of the technology users in the UAE towards the electronic waste, and by ‘electronic waste’, we mean the electronic material that the user is trying to get rid of and stopped using for any reason. Examples of electronic waste can be the charger of your laptop, empty battery, cables for charging mobiles … etc. This topic is important due to the great impact of these material (the electronic waste) on the environment and its residents, which makes the investigation into people’s behavior in disposing such material very valuable. According to this, your honest and open participation is vital to our ability to achieve our goals and purposes. The questionnaire covers two main aspects: the UAE residents’ awareness regarding the impact of e-waste and the most common e-waste-disposal methods that are being currently used.
Participation in this survey is completely voluntary. All data will remain confidential and will be used only for research purposes. Questionnaires are received anonymously; the participants are not requested at all to provide names or any details that could reveal their identity. The person who is invited to fill in this questionnaire is free to decline the invitation with no consequences.
We would highly appreciate your participation in this study. If you have any queries about the questionnaire or the study, please contact the team leader, Dr. Maisa El Gamal, at [email protected].
Questionnaire
(1)
Are you:
(a)
Instructor
(b)
Staff
(c)
Student
(2)
Are you:
(a)
Male
(b)
Female
(3)
What is your age?
(a)
17 to 19
(b)
20 to 29
(c)
30 to 39
(d)
40 to 49
(e)
50 or more
(4)
What is your field of study/work?
(a)
Natural and Health Sciences
(b)
Education
(c)
Nutrition
(d)
Nursing
(e)
Human Resources
(f)
Information Technology
(g)
Engineering
(h)
Business/Accounting/Management
(i)
Humanities and Social Sciences
(j)
Arts and Creative Enterprise
(k)
Others. Please specify: ______
Electronic waste, also known as e-waste, is the discarded electronic device. E-waste includes but is not limited to: batteries, earphones/headphones, keyboards, electronic toys, TVs, printers, cables, circuit boards, phones, clocks, calculators, radios, DVD players, iPods, MP3 players and CD players, lamps, and computer mouse.
(5)
Did you know about ‘e-waste’ before reading the above description?
(a)
Yes
(b)
No
If you answered ‘Yes’, what is the source of your information?
(6)
What is the main reason that makes you dispose an electronic device?
(You can select more than one answer as you find appropriate)
(a)
Broken device
(b)
Buy new one
(c)
Other. Please specify: _____
(7)
How do you dispose the following electronic devices?
Please insert ‘X’ in the appropriate cell of the following table:
Method of E-waste disposal
MaterialRepairDonate it to a Second-Hand UserSell it to a Second-Hand UserSell it to Scrap DealerPut it with Other
Household Trash
Other (Please
Specify)
Batteries
Earphones/Headphones
MP3/MP4 player or iPod
Laptop
Tablet
Mobile Phone
Electronic Toys
Speaker
PC
Monitor
Printer/Scanner
(8)
Which of the following statements do you think is correct?
(You can select more than one as you find appropriate)
(a)
E-waste contains toxic components.
(b)
Storing electronic devices that are not used anymore is a safe way to dispose e-wastes.
(c)
Burning e-waste is a safe way to dispose e-wastes.
(d)
E-waste can cause air pollution.
(e)
E-waste can cause water pollution.
(f)
E-waste can cause soil pollution.
(9)
Are you familiar with any e-waste collector in your area?
(a)
Yes
(b)
No
If you answered ‘Yes’, please mention them.
(10)
Were you engaged in any activity related to e-waste before?
(a)
Yes
(b)
No
If you answered ‘Yes’, please mention them.
(11)
Are any of your family members engaged in an activity that is related to e-waste?
(a)
Yes
(b)
No
If you answered ‘Yes’, please mention the type of activity.
(12)
Are you interested in joining an e-waste scheme at ZU?
(a)
Yes
(b)
No
(13)
Would you give your e-waste for free to an e-waste collector?
(a)
Yes
(b)
No
If you answered ‘No’, please mention the reasons.
(14)
How many electronic/electrical products do you purchase a year?
(a)
0
(b)
1 to 3
(c)
4 to 6
(d)
more than 6
(15)
What are the most common electronic devices that you purchase every year?
(You can select more than one as you find appropriate)
(a)
Batteries
(b)
Earphones/Headphones
(c)
MP3/MP4 player or iPod
(d)
Laptop
(e)
Tablet
(f)
Mobile Phone
(g)
Electronic Toys
(h)
Speaker
(i)
PC
(j)
Monitor
(k)
Printer/Scanner
(16)
How much do you spend on electronic products each year?
(a)
Less than AED 500
(b)
From AED 500 to AED 1000
(c)
From AED 1000 to AED 5000
(d)
From AED 5000 to AED 10,000
(e)
More than AED 10,000
Thank you for your participation!

References

  1. Widmer, R.; Oswald-Krapf, H.; Sinha-Khetriwal, D.; Schnellmann, M.; Böni, H. Global perspectives on e-waste. Environ. Impact Assess. Rev. 2005, 25, 436–458. [Google Scholar] [CrossRef]
  2. Ahirwar, R.; Tripathi, A.K. E-waste management: A review of recycling process, environmental and occupational health hazards, and potential solutions. Environ. Nanotechnol. Monit. Manag. 2021, 15, 100409. [Google Scholar] [CrossRef]
  3. Forti, V.; Baldé, C.P.; Kuehr, R.; Bel, G. The Global E-Waste Monitor 2020: Quantities, Flows, and the Circular Economy Potential; United Nations University/United Nations Institute for Training and Research: Bonn, Germany; International Telecommunication Union: Geneva, Switzerland; International Solid Waste Association (ISWA): Rotterdam, The Netherlands, 2020. [Google Scholar]
  4. Delcea, C.; Craciun, L.; Ioanas, C.; Ferruzzi, G.; Cotfas, L.A. Determinants of individuals’ e-waste recycling decision: A case study from Romania. Sustainability 2020, 12, 2753. [Google Scholar] [CrossRef] [Green Version]
  5. Tsydenova, O.; Bengtsson, M. Chemical hazards associated with treatment of waste electrical and electronic equipment. Waste Manag. 2011, 31, 45–58. [Google Scholar] [CrossRef]
  6. Yu, D.; Duan, H.; Song, Q.; Liu, Y.; Li, Y.; Li, J.; Shen, W.; Luo, J.; Wang, J. Characterization of brominated flame retardants from e-waste components in China. Waste Manag. 2017, 68, 498–507. [Google Scholar] [CrossRef]
  7. Tongesayi, T.; Kugara, J.; Tongesayi, S. Waste dumpsites and public health: A case for lead exposure in Zimbabwe and potential global implications. Environ. Geochem. Health 2018, 40, 375–381. [Google Scholar] [CrossRef]
  8. Alam, Z.F.; Ang, C.L.J.; Bondoc, I.V. Analysis of Heavy Metals in the Human Hair to Establish the E-waste Toxicity Among the Filipino Informal Recyclers Located at Various E-waste Dumpsites in and Around Manila, Philippines. Nat. Environ. Pollut. Technol. 2018, 17, 757–766. [Google Scholar]
  9. Moeckel, C.; Breivik, K.; Nøst, T.H.; Sankoh, A.; Jones, K.C.; Sweetman, A. Soil pollution at a major West African E-waste recycling site: Contamination pathways and implications for potential mitigation strategies. Environ. Int. 2020, 137, 105563. [Google Scholar] [CrossRef]
  10. Fujimori, T.; Itai, T.; Goto, A.; Asante, K.A.; Otsuka, M.; Takahashi, S.; Tanabe, S. Interplay of metals and bromine with dioxin-related compounds concentrated in e-waste open burning soil from Agbogbloshie in Accra, Ghana. Environ. Pollut. 2016, 209, 155–163. [Google Scholar] [CrossRef]
  11. Grant, K.; Goldizen, F.C.; Sly, P.D.; Brune, M.N.; Neira, M.; van den Berg, M.; Norman, R.E. Health consequences of exposure to e-waste: A systematic review. Lancet Glob. Health 2013, 1, e350–e361. [Google Scholar] [CrossRef] [Green Version]
  12. Chen, A.; Dietrich, K.N.; Huo, X.; Ho, S.M. Developmental neurotoxicants in e-waste: An emerging health concern. Environ. Health Perspect. 2011, 119, 431–438. [Google Scholar] [CrossRef] [PubMed]
  13. Wu, K.; Xu, X.; Peng, L.; Liu, J.; Guo, Y.; Huo, X. Association between maternal exposure to perfluorooctanoic acid (PFOA) from electronic waste recycling and neonatal health outcomes. Environ. Int. 2012, 48, 1–8. [Google Scholar] [CrossRef] [PubMed]
  14. Guo, L.C.; Liu, T.; Yang, Y.; Yu, S.; Gao, Y.; Huang, W.; Xiao, J.; Ma, W.; Rutherford, S.; Zhang, Y. Changes in thyroid hormone related proteins and gene expression induced by polychlorinated biphenyls and halogen flame retardants exposure of children in a Chinese e-waste recycling area. Sci. Total Environ. 2020, 742, 140597. [Google Scholar] [CrossRef] [PubMed]
  15. Zeng, X.; Xu, X.; Qin, Q.; Ye, K.; Wu, W.; Huo, X. Heavy metal exposure has adverse effects on the growth and development of preschool children. Environ. Geochem. Health 2019, 41, 309–321. [Google Scholar] [CrossRef]
  16. Zhang, B.; Huo, X.; Xu, L.; Cheng, Z.; Cong, X.; Lu, X.; Xu, X. Elevated lead levels from e-waste exposure are linked to decreased olfactory memory in children. Environ. Pollut. 2017, 231, 1112–1121. [Google Scholar] [CrossRef]
  17. Parajuly, K.; Thapa, K.B.; Cimpan, C.; Wenzel, H. Electronic waste and informal recycling in Kathmandu, Nepal: Challenges and opportunities. J. Mater. Cycles Waste Manag. 2018, 20, 656–666. [Google Scholar] [CrossRef]
  18. World Economic Forum. A New Circular Vision for Electronics Time for a Global Reboot. 2019, pp. 1–24. Available online: https://www3.weforum.org/docs/WEF_A_New_Circular_Vision_for_Electronics.pdf (accessed on 3 April 2022).
  19. Meenakshisundaram, S.; Sinha, S. E-Waste Management in the United Arab Emirates. 2011. Available online: https://sciforum.net/manuscripts/610/manuscript.pdf (accessed on 24 March 2022).
  20. Hamouda, K.; Adjroudi, R. Electronic Waste Generation and Management in the Middle East and North Africa (MENA) Region: Algeria as a Case Study. Environ. Qual. Manag. 2017, 26, 5–16. [Google Scholar] [CrossRef]
  21. Aboelmaged, M. E-waste recycling behaviour: An integration of recycling habits into the theory of planned behaviour. J. Clean. Prod. 2021, 278, 124182. [Google Scholar] [CrossRef]
  22. Attia, Y.; Soori, P.K.; Ghaith, F. Analysis of Households’ E-Waste Awareness, Disposal Behavior, and Estimation of Potential Waste Mobile Phones towards an Effective E-Waste Management System in Dubai. Toxics 2021, 9, 236. [Google Scholar] [CrossRef]
  23. Ben Yahya, T.; Jamal, N.M.; Sundarakani, B.; Omain, S.Z. The Potential Determinants for Smartphone Recycling Behaviour Sustainability in UAE. Sustainability 2022, 14, 2282. [Google Scholar] [CrossRef]
  24. Barr, S.; Gilg, A.; Ford, N. Defining the multi-dimensional aspects of household waste management: A study of reported behavior in Devon. Resour. Conserv. Recycl. 2005, 45, 172–192. [Google Scholar] [CrossRef]
  25. Gainforth, H.L.; Sheals, K.; Atkins, L.; Jackson, R.; Michie, S. Developing interventions to change recycling behaviors: A case study of applying behavioral science. Appl. Environ. Educ. Commun. 2016, 15, 325–339. [Google Scholar] [CrossRef] [Green Version]
  26. Marinescu, C.; Ciocoiu, C.N.; Cicea, C. Socioeconomic Factors Affecting E-Waste Collection Rate in Countries From European Union. In Proceedings of the 10th International Management Conference, Challenges of Modern Management, Bucharest, Romania, 3–4 November 2016; pp. 152–160. [Google Scholar]
  27. Arain, A.L.; Pummill, R.; Adu-Brimpong, J.; Becker, S.; Green, M.; Ilardi, M.; Van Dam, E.; Neitzel, R.L. Analysis of e-waste recycling behavior based on survey at a Midwestern US University. Waste Manag. 2020, 105, 119–127. [Google Scholar] [CrossRef]
  28. Hong Thi Thu, N.; Hung, R.J.; Lee, C.H.; Hong Thi Thu, N. Determinants of residents’ E-waste recycling behavioral intention: A case study from Vietnam. Sustainability 2018, 11, 164. [Google Scholar] [CrossRef] [Green Version]
  29. Wang, Z.; Guo, D.; Wang, X. Determinants of residents’ e-waste recycling behaviour intentions: Evidence from China. J. Clean. Prod. 2016, 137, 850–860. [Google Scholar] [CrossRef]
  30. UAE Electronics Industry [WWW Document], 2021 URL. Available online: https://www.statista.com/statistics/964133/uae-consumer-electronics-market-value/ (accessed on 24 March 2022).
  31. WAM. World’s Largest E-Waste Recycling Facility in Dubai. Gulf News, 2021. Available online: https://gulfnews.com/uae/worlds-largest-e-waste-recycling-facility-opens-in-dubai-1.62884040#:~:text=Dubai%3A%20Dubai%20e%2Dwaste%20specialist,EU%20standards%20for%20e%2Dwaste (accessed on 24 March 2022).
  32. Tadweer: Abu Dhabi Waste Management Center [WWW Document], n.d. URL. Available online: https://www.tadweer.gov.ae/en/Pages/FutureProjects.aspx (accessed on 24 March 2022).
  33. Xavier, L.H.; Ottoni, M.; Lepawsky, J. Circular economy and e-waste management in the Americas: Brazilian and Canadian frameworks. J. Clean. Prod. 2021, 297, 126570. [Google Scholar] [CrossRef]
  34. Parajuly, K.; Wenzel, H. Product Family Approach in E-Waste Management: A Conceptual Framework for Circular Economy. Sustainability 2017, 9, 768. [Google Scholar] [CrossRef] [Green Version]
  35. Morseletto, P. Targets for a circular economy. Resour. Conserv. Recycl. 2020, 153, 104553. [Google Scholar] [CrossRef]
  36. Babbitt, C.W.; Gaustad, G.; Fisher, A.; Chen, W.; Liu, G. Closing the loop on circular economy research: From theory to practice and back again. Resour. Conserv. Recycl. 2018, 135, 2. [Google Scholar] [CrossRef]
  37. Awasthi, A.K.; Li, J.; Koh, L.; Ogunseitan, O.A. Circular economy and electronic waste. Nat. Electron. 2019, 2, 86–89. [Google Scholar] [CrossRef] [Green Version]
  38. Marinello, S.; Gamberini, R. Multi-Criteria Decision-Making Approaches Applied to Waste Electrical and Electronic Equipment (WEEE): A Comprehensive Literature Review. Toxics 2021, 9, 13. [Google Scholar] [CrossRef]
  39. Tong, X.; Wang, T.; Chen, Y.; Wang, Y. Resources, Conservation & Recycling Towards an inclusive circular economy: Quantifying the spatial flows of e- waste through the informal sector in China. Resour. Conserv. Recycl. 2018, 135, 163–171. [Google Scholar] [CrossRef]
  40. Hartley, K.; Van Santen, R.; Kirchherr, J.; Education, T.; Kong, H.; Kong, H. Resources, Conservation & Recycling Policies for transitioning towards a circular economy: Expectations from the European Union (EU). Resour. Conserv. Recycl. 2020, 155, 104634. [Google Scholar] [CrossRef]
  41. Rahman, N. Environmental Sustainability in the Computer Industry for Competitive Advantage. In Green Computing Strategies for Competitive Advantage and Business Sustainability; IGI Global: Hershey, PA, USA, 2018; pp. 110–130. [Google Scholar] [CrossRef]
  42. Maranesi, C.; De Giovanni, P. Modern Circular Economy: Corporate Strategy, Supply Chain, and Industrial Symbiosis. Sustainability 2020, 12, 9383. [Google Scholar] [CrossRef]
  43. Järvenpää, A.; Salminen, V.; Kantola, J. Industrial Symbiosis, Circular Economy and Industry 4.0—A Case Study in Finland. Manage. Prod. Eng. Rev. 2021, 12, 111–121. [Google Scholar] [CrossRef]
  44. Baldassarre, B.; Schepers, M.; Bocken, N.; Cuppen, E.; Korevaar, G.; Calabretta, G. Industrial Symbiosis: Towards a design process for eco-industrial clusters by integrating Circular Economy and Industrial Ecology perspectives. J. Clean. Prod. 2019, 216, 446–460. [Google Scholar] [CrossRef]
  45. Wen, Z.; Meng, X. Quantitative assessment of industrial symbiosis for the promotion of circular economy: A case study of the printed circuit boards industry in China’s Suzhou New District. J. Clean. Prod. 2015, 90, 211–219. [Google Scholar] [CrossRef]
  46. Lopes, M. Orchestrating entrepreneurial ecosystems in circular economy: The new paradigm of sustainable competitiveness. Manag. Environ. Qual. 2022, 33, 103–123. [Google Scholar] [CrossRef]
  47. Cao, J.; Lu, B.; Chen, Y.; Zhang, X.; Zhai, G.; Zhou, G.; Jiang, B.; Schnoor, J.L. Extended producer responsibility system in China improves e-waste recycling: Government policies, enterprise, and public awareness. Manag. Environ. Qual. 2016, 62, 882–894. [Google Scholar] [CrossRef]
  48. Chibunna, J.B.; Siwar, C.; Begum, R.A.; Fariz, A. The challenges of e-waste management among institutions: A case study of UKM. Procedia-Soc. Behav. Sci. 2012, 59, 644–649. [Google Scholar] [CrossRef] [Green Version]
  49. Jayaraman, K.; Vejayon, S.; Raman, S.; Mosta, I. The proposed e-waste management model from the conviction of individual laptop disposal practices-An empirical study in Malaysia. J. Clean. Prod. 2019, 208, 688–696. [Google Scholar] [CrossRef] [Green Version]
  50. Mahat, H.; Hashim, M.; Nayan, N.; Saleh, Y.; Norkhaidi, S.B. E-waste disposal awareness among the Malaysian community. Knowl. Manag. E Learn. 2019, 11, 393–408. [Google Scholar] [CrossRef] [Green Version]
  51. Islam, M.T.; Dias, P.; Huda, N. Young consumers’ e-waste awareness, consumption, disposal, and recycling behavior: A case study of university students in Sydney, Australia. J. Clean. Prod. 2021, 282, 124490. [Google Scholar] [CrossRef]
  52. Sari, D.P.; Masruroh, N.A.; Asih, A.M.S. Consumer Intention to Participate in E-Waste Collection Programs: A Study of Smartphone Waste in Indonesia. Sustainability 2021, 13, 2759. [Google Scholar] [CrossRef]
  53. Kumar, R.; Kumar, R. Impact of various demographic factors on consumer behaviour—An empirical study of electronic products in rural Himachal (India). Indian J. Econ. Bus. 2019, 19, 109–127. [Google Scholar]
  54. Meffert, H.; Bruhn, M. Das Umweltbewußtsein von Konsunenten. Die Betr. 1996, 56, 621–658. [Google Scholar]
  55. Patel, J.; Modi, A.; Paul, J. Pro-Environmental Behavior and Socio-Demographic Factors in an Emerging Market. Asian J. Bus. Ethics 2017, 6, 189–214. [Google Scholar] [CrossRef]
  56. Oerke, B.; Bogner, F.X. Gender, age and subject matter: Impact on teachers’ ecological values. Environmentalist 2010, 30, 111–122. [Google Scholar] [CrossRef]
  57. Xiao, C.; Hong, D. Gender differences in environmental behaviours in China. Popul. Environ. 2010, 32, 88–104. [Google Scholar] [CrossRef]
  58. Samarasinghe, D.S.R. A green segmentation: Identifying the green consumer demographic profiles in Sri Lanka. Int. J. Mark. Technol. 2012, 2, 318–331. [Google Scholar]
  59. Getzner, M.; Grabner-Kraüter, S. Consumer preferences and marketing strategies for ‘green shares. Int. J. Bank Mark. 2004, 22, 260–278. [Google Scholar] [CrossRef]
  60. Abeliotis, K.; Koniari, C.; Sardianou, E. The profile of the green consumer in Greece. Int. J. Consum. Stud. 2010, 34, 153–160. [Google Scholar] [CrossRef]
  61. Sánchez, M.; Natalia, L.-M.; Lera-López, F. Improving pro-environmental behaviours in Spain: The role of attitudes and socio-demographic and political factors. J. Environ. Policy Plan. 2015, 18, 47–66. [Google Scholar] [CrossRef]
  62. Chen, X.; Peterson, M.N.; Hull, V.; Lu, C.; Lee, G.D.; Hong, D.; Liu, J. Effects of attitudinal and socio-demographic factors on pro-environmental behaviour in urban China. Environ. Conserv. 2011, 38, 45–52. [Google Scholar] [CrossRef] [Green Version]
  63. Zayed University Fact Book 2020-21, Zayed University, UAE. Available online: https://allt-uae.zu.ac.ae/www-zu/open-data/wp-content/uploads/sites/2/2022/02/FactBook2020_21-Final.pdf (accessed on 22 March 2022).
  64. Bai, H.; Wang, J.; Zeng, A.Z. Exploring Chinese consumers’ attitude and behavior toward smartphone recycling. J. Clean. Prod. 2018, 188, 227–236. [Google Scholar] [CrossRef]
  65. Chen, Y.; Chen, M.; Li, Y.; Wang, B.; Chen, S.; Xu, Z. Impact of technological innovation and regulation development on e-waste toxicity: A case study of waste mobile phones. Sci. Rep. 2018, 8, 7100. [Google Scholar] [CrossRef] [Green Version]
  66. Shasha, S.; Mahmoud, M.; Mannan, M.; Youssef, A. Playing with danger: A taxonomy and evaluation of threats to smart toys. IEEE Internet Things J. 2019, 6, 2986–3002. [Google Scholar] [CrossRef] [Green Version]
  67. Yousef, D.K. (n.d.). GCC’s Health, Safety Rules for Toy Makers Are No Child’s Play. 2010. Available online: https://gulfnews.com/business/retail/gccs-health-safety-rules-for-toy-makers-are-no-childs-play-1.733953 (accessed on 24 March 2022).
  68. Dinçol Özgür, S.; Varoǧlu, L.; Yılmaz, A. Environment from a different perspective: Analysing the environmental problem awareness of undergraduates. SHS Web Conf. 2018, 48, 01023. [Google Scholar] [CrossRef]
  69. Ramzan, S.; Liu, C.G.; Xu, Y.; Munir, H.; Gupta, B. The adoption of online e-waste collection platform to improve environmental sustainability: An empirical study of Chinese millennials. Manag. Environ. Qual. Int. J. 2020, 32, 193–209. [Google Scholar] [CrossRef]
  70. Wibowo, N.; Piton, J.K.; Nurcahyo, R.; Gabriel, D.S.; Farizal, F.; Madsuha, A.F. Strategies for Improving the E-Waste Management Supply Chain Sustainability in Indonesia (Jakarta). Sustainability 2021, 13, 13955. [Google Scholar] [CrossRef]
  71. Vitale, S.; Biondo, F.; Giosuè, C.; Bono, G.; Okpala, C.O.R.; Piazza, I.; Sprovieri, M.; Pipitone, V. Consumers’ perception and willingness to pay for eco-labeled seafood in Italian hypermarkets. Sustainability 2020, 12, 1434. [Google Scholar] [CrossRef] [Green Version]
  72. Mohr, M.; Schlich, M. Socio-demographic basic factors of German customers as predictors for sustainable consumerism regarding foodstuffs and meat products. Int. J. Consum. Stud. 2016, 40, 158–167. [Google Scholar] [CrossRef]
  73. Corwin, J.E. “Nothing is useless in nature”: Delhi’s repair economies and value-creation in an electronics “waste” sector. Environ. Plan. A 2018, 50, 14–30. [Google Scholar] [CrossRef]
  74. Meng, Q.; Zhu, H.; Li, Z.; Du, J.; Wang, X.; Kim, M.J. How green building product decisions from customers can be transitioned to manufacturers: An agent-based model. Sustainability 2018, 10, 3977. [Google Scholar] [CrossRef] [Green Version]
  75. Tran, C.D.; Salhofer, S.P. Analysis of recycling structures for e-waste in Vietnam. J. Mater. Cycles Waste Manag. 2018, 20, 110–126. [Google Scholar] [CrossRef]
  76. Cruz-Sotelo, S.E.; Ojeda-Benítez, S.; Jáuregui Sesma, J.; Velázquez-Victorica, K.I.; Santillán-Soto, N.; García-Cueto, O.R.; Alcántara Concepción, V.; Alcántara, C. E-Waste Supply Chain in Mexico: Challenges and Opportunities for Sustainable Management. Sustainability 2017, 9, 503. [Google Scholar] [CrossRef] [Green Version]
  77. Meneses, G.D.; Palacio, A.B. Recycling behavior: A multidimensional approach. Environ. Behav. 2005, 37, 837–860. [Google Scholar] [CrossRef] [Green Version]
  78. Vieira, B.d.O.; Guarnieri, P.; Camara e Silva, L.; Alfinito, S. Prioritizing Barriers to Be Solved to the Implementation of Reverse Logistics of E-Waste in Brazil under a Multicriteria Decision Aid Approach. Sustainability 2020, 12, 4337. [Google Scholar] [CrossRef]
  79. Fact Sheet. Available online: https://u.ae/en/about-the-uae/fact-sheet (accessed on 28 March 2022).
  80. Murthy, V.; Ramakrishna, S. A Review on Global E-Waste Management: Urban Mining towards a Sustainable Future and Circular Economy. Sustainability 2022, 14, 647. [Google Scholar] [CrossRef]
Figure 1. Investigation model of the study.
Sustainability 14 04805 g001
Figure 2. Steps involved in the planning and execution of the research project.
Sustainability 14 04805 g002
Figure 3. Knowledge of detrimental effects of e-waste.
Sustainability 14 04805 g003
Figure 4. Respondents’ willingness to engage in e-waste management.
Sustainability 14 04805 g004
Table 1. Descriptive statistics of the sample.
Sample CharacteristicsNo. of
Respondents
Percentage of
Respondents
Category of Respondents
Student27192.81
Staff217.19
Gender
Male9231.51
Female20068.49
Age
17 to 19 Years7525.68
20 to 29 Years20871.23
30 to 39 Years31.03
40 to 49 Years31.03
50 Years or More31.03
Field of study
Natural and Health Sciences5017.12
Arts and Creative Enterprise62.05
Business5619.18
Engineering and IT11338.70
Public Health and Nutrition72.40
Education134.45
Humanities and Social Sciences258.56
Science124.11
Media and Communication103.42
Table 2. E-device purchase behaviour.
FactorsNo. of
Respondents
Percentage of
Respondents
Most common E-device purchase every year
MP3/MP4 Player or iPod196.51
Laptop4615.75
Tablet3612.33
Mobile Phone14047.95
Electronic Toys6722.95
Monitor82.74
PC144.79
Speaker5719.52
Printer/Scanner3411.64
No. of E-devices possessed
None186.16
1 to 319165.41
4 to 65819.86
More than 6258.56
Expenditure on E-devices/year
Less than AED 5004415.07
AED 501 to AED 10007626.03
AED.1001 to AED 500013445.89
AED 5001 to AED 10,0003110.62
More than AED 10,00072.40
Table 3. Results of cross-tab analysis.
Independent VariableDependent Variable: No. of Electronic Products Possessed
None1 to 34 to 6More than 6TotalChi-Squarep-Value
Category
Student181775323271
Staff0145221
Total1819158252921.6020.659
Gender
Male649241392
Female121423412200
Total18191582529210.5440.014
Age
17 to 19 Years85110675
20 to 29 Years101344519208
30 to 39 Years02103
40 to 49 Years01203
50 Years or More03003
Total18191582529211.7660.465
Field
Natural and Health Sciences3404350
Arts and Creative Enterprise05106
Business53512456
Engineering and IT6652814113
Public Health and Nutrition14207
Education1102013
Humanities and Social Sciences1193225
Science165012
Media and Communication071210
Total18191582529223.9940.462
Table 4. Results of Analysis of Variance (ANOVA).
Independent VariableDependent Variable: Knowledge in E-Waste
No. of
Respondents
MeanF-Valuep-Value
Category
Student2712.410
Staff212.3330.0750.785
Gender
Male922.228
Female2002.4852.7620.098
Age
17 to 19 Years752.760
20 to 29 Years2082.260
30 to 39 Years33.000
40 to 49 Years31.333
50 Years or More34.0004.5000.002
Field
Natural and Health Sciences502.880
Arts and Creative Enterprise61.667
Business562.446
Engineering and IT1132.389
Public Health and Nutrition72.571
Education132.000
Humanities and Social Sciences252.240
Science121.583
Media and Communication102.2002.2380.025
Table 5. E-waste disposal behaviour.
Type of E-WasteMethod of Disposal (% of Respondents)
Put It with Other
Household Trash
RepairDonate It to a Second-Hand UserSell It to a Second-Hand UserSell It to Scrap DealerOthers
Batteries54.4522.612.335.146.167.88
Earphones/Headphones50.6817.4719.867.535.146.85
MP3/MP4 player/iPod20.5524.6628.0815.419.5912.67
Laptop6.5145.8923.2918.8411.310.62
Tablet8.940.0724.3217.1212.3311.3
Mobile Phone7.8842.8123.9719.529.2510.96
Electronic Toys35.2718.4932.888.98.568.22
Speaker29.4526.0321.9213.019.258.9
PC12.6735.2734.2517.471.3710.96
Monitor16.7829.4522.9515.0711.313.01
Printer/Scanner18.8434.5927.0513.0110.967.53
Publisher’s Note: MDPI stays neutral with regard to jurisdictional claims in published maps and institutional affiliations.

