
Potential Hydrogen Market: Value-Added Services Increase Economic Efficiency for Hydrogen Energy Suppliers


Abstract
:1. Introduction
2. Methodology
2.1. Model Structure
- (1)
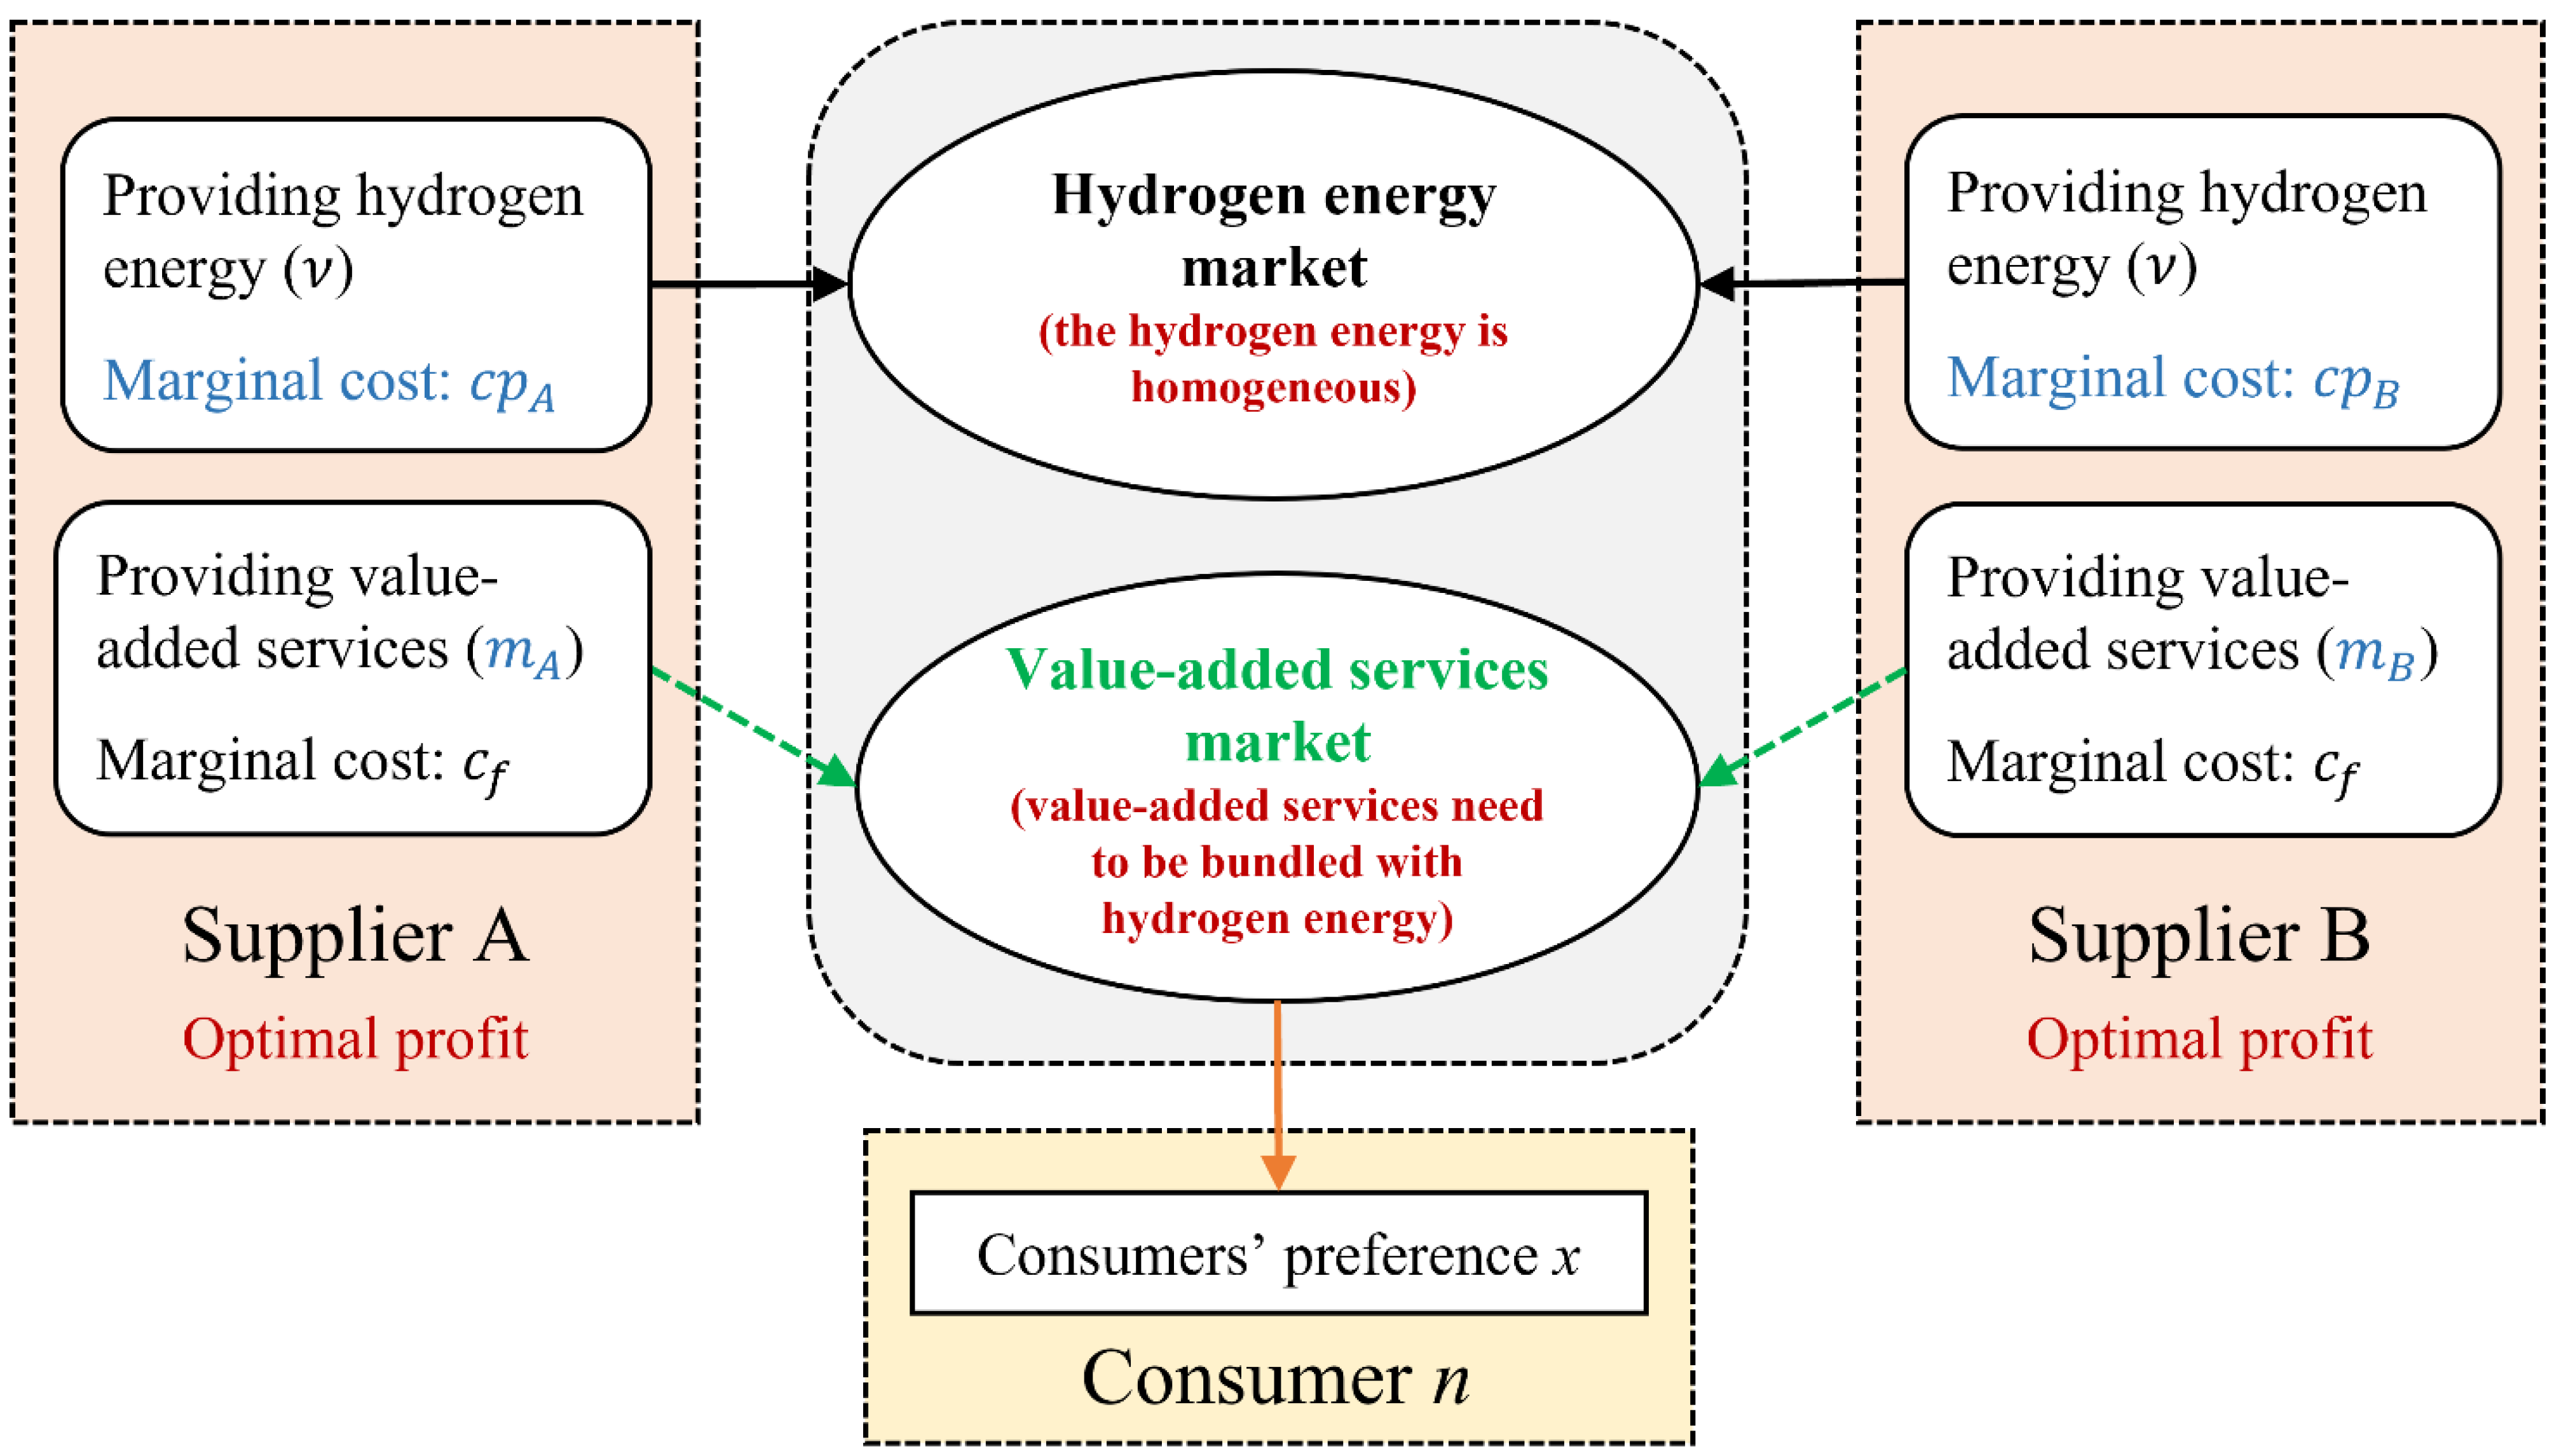
- There are only hydrogen energy suppliers A and B in the hydrogen energy market, and both suppliers are capable of providing hydrogen energy and value-added services. The market always has positive demand for suppliers A and B, which means it is fully covered by suppliers A and B at all times.
- (2)
- The hydrogen energy of the two suppliers is homogeneous. The intrinsic value of hydrogen energy is ν, but the marginal cost and the intrinsic value of value-added services are different. The marginal cost of value-added services is , the same for suppliers A and B.
- (3)
- The value-added services need to be bundled with hydrogen energy, which means the value-added services are not compatible.
- (4)
- Because the intrinsic value of value-added services is different, consumers with different preferences will make their own choices. Two suppliers are assumed to be located at two ends of a Hoteling line of length 1, that is, , and x is a random variable uniformly distributed within the line, representing the degree of consumer preference [43]. When products or services fail to meet consumers’ expectations, the utility loss will occur. Assuming that the unit utility loss is t, the utility loss for the consumer with preference x who chooses supplier A is , and for consumers who chooses supplier B. Here, t also represents consumers’ sensitivity to differences in services [44].
- (5)
- The total consumer number of hydrogen energy is N. The demand for hydrogen energy and value-added services is in unit demand.
2.2. Sales Strategy
2.3. Model Formulation
2.3.1. Consumer Utility Functions
2.3.2. Demand and Profit Functions
2.3.3. Optimal Pricing and Profit Functions
3. Model Discussion
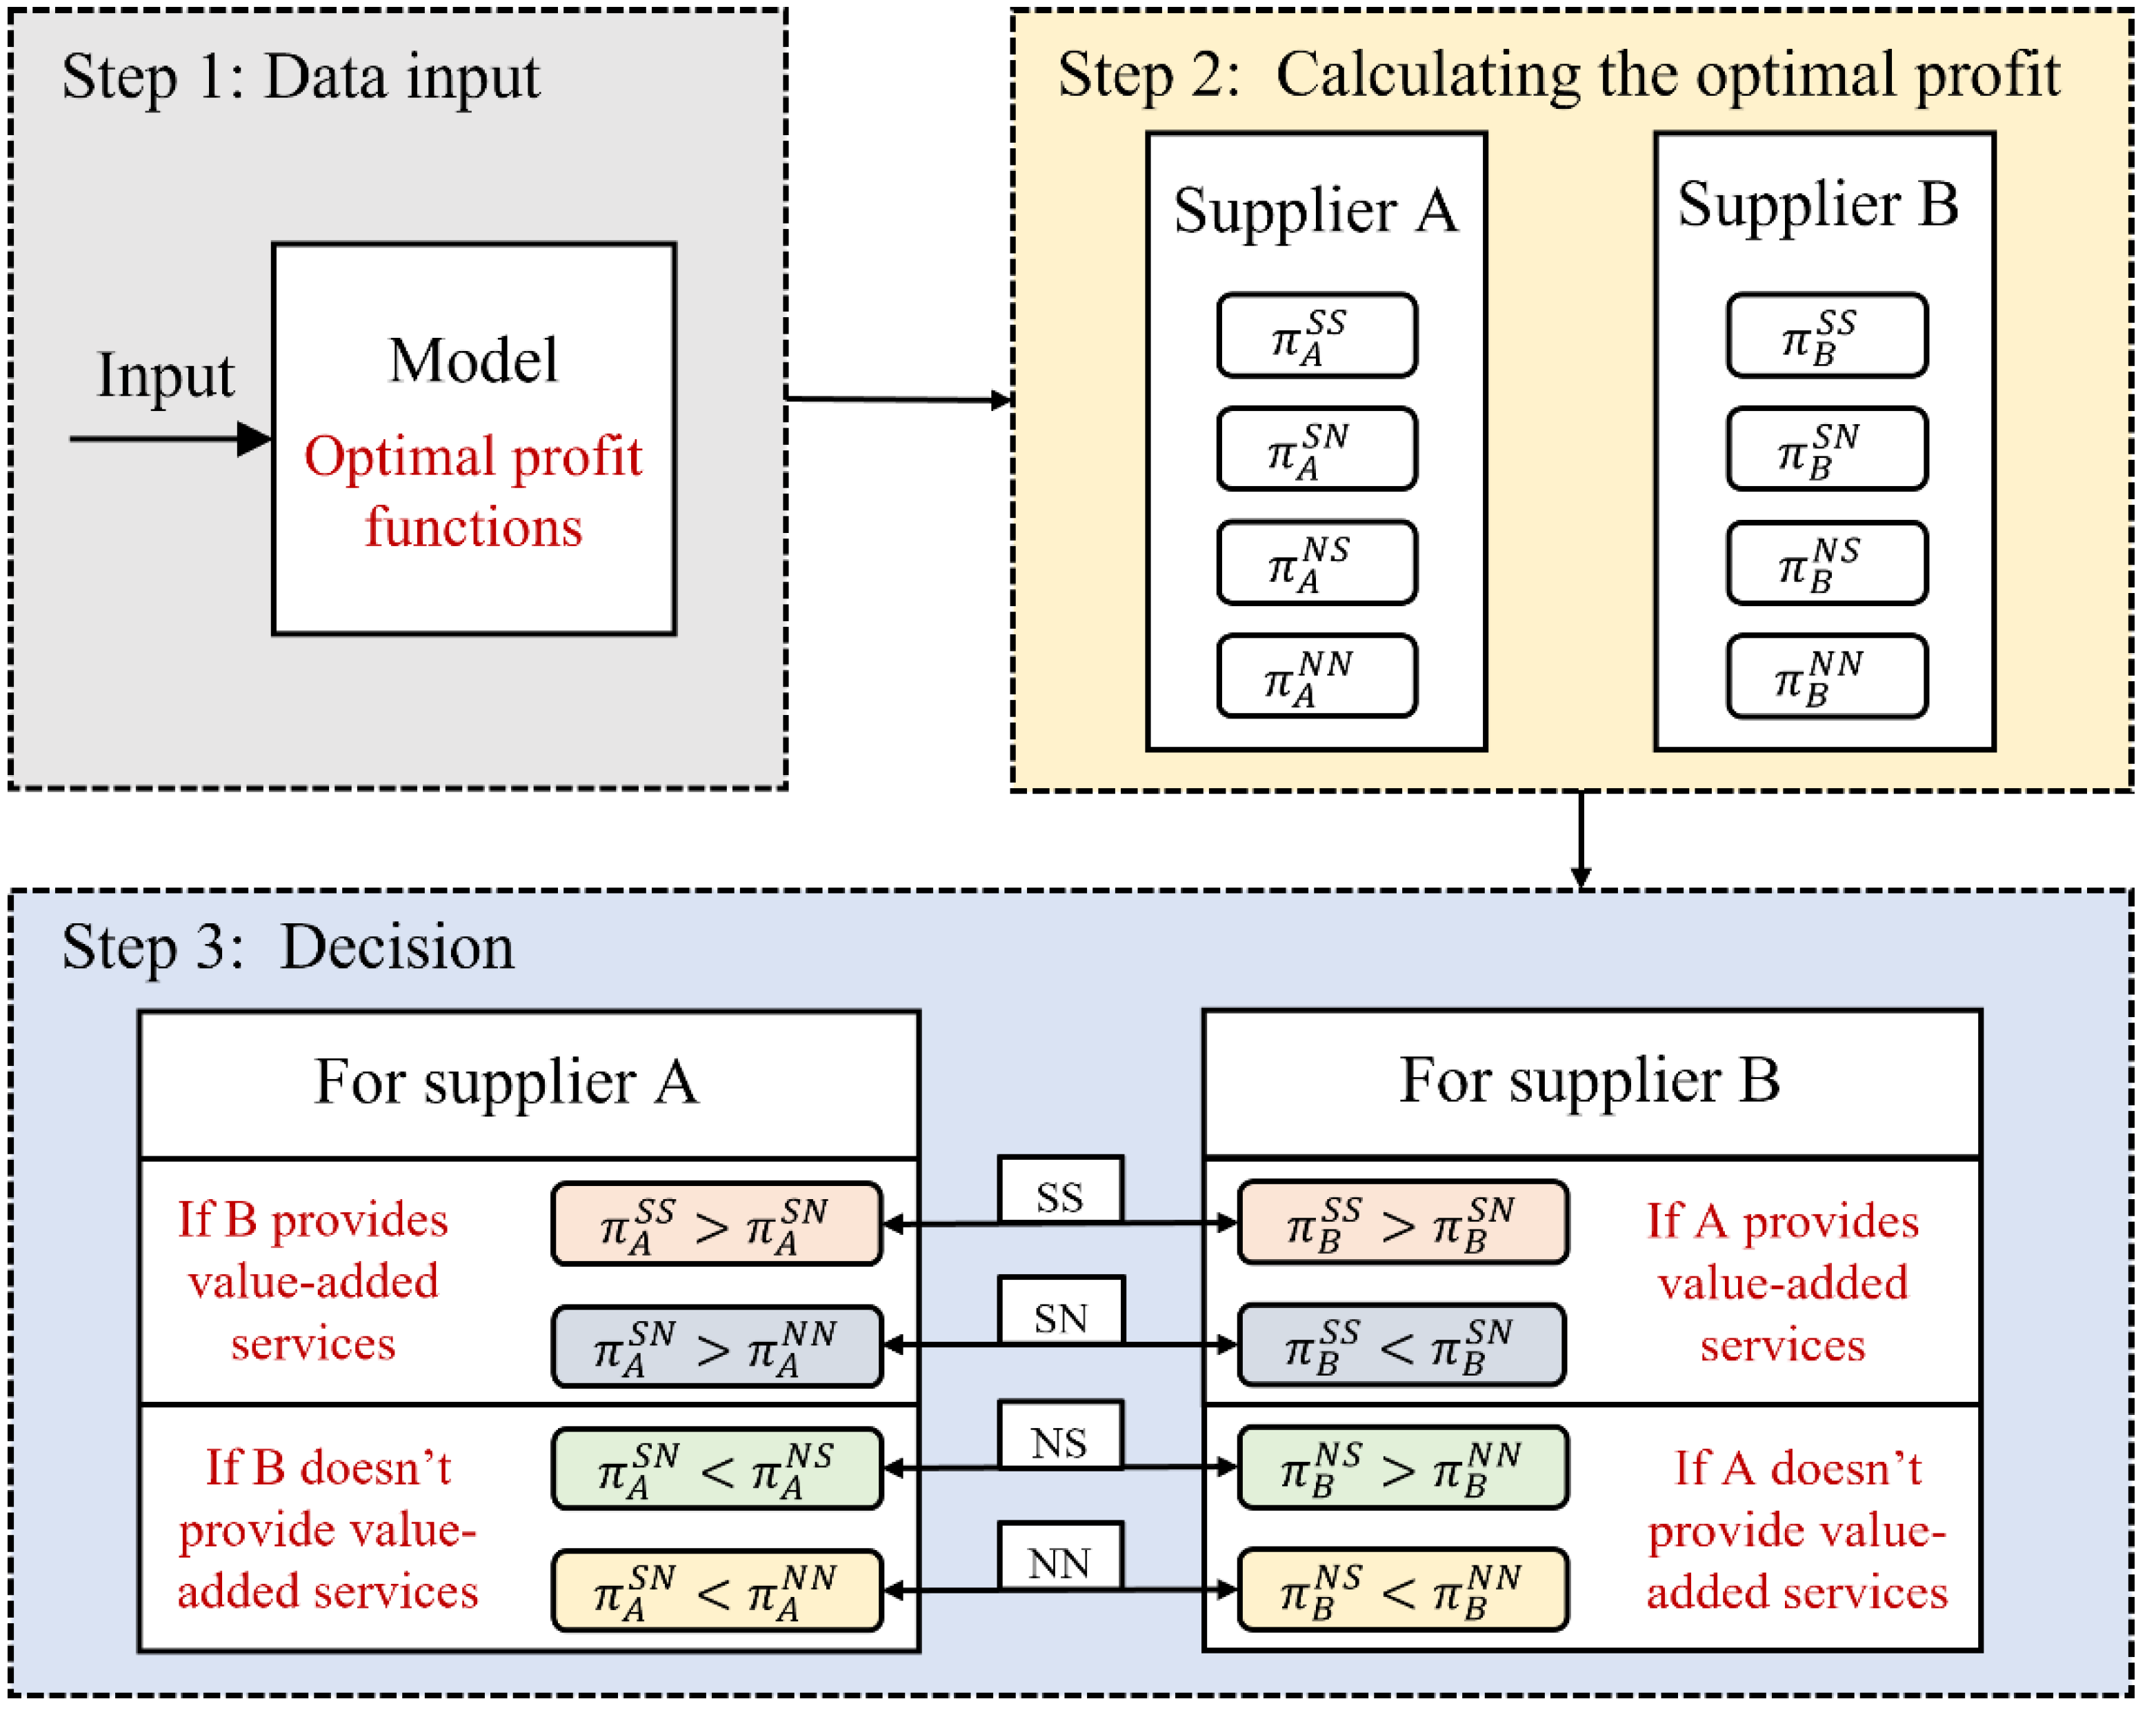
3.1. Application Scenarios
3.2. Influencing Factors for Optimal Profits
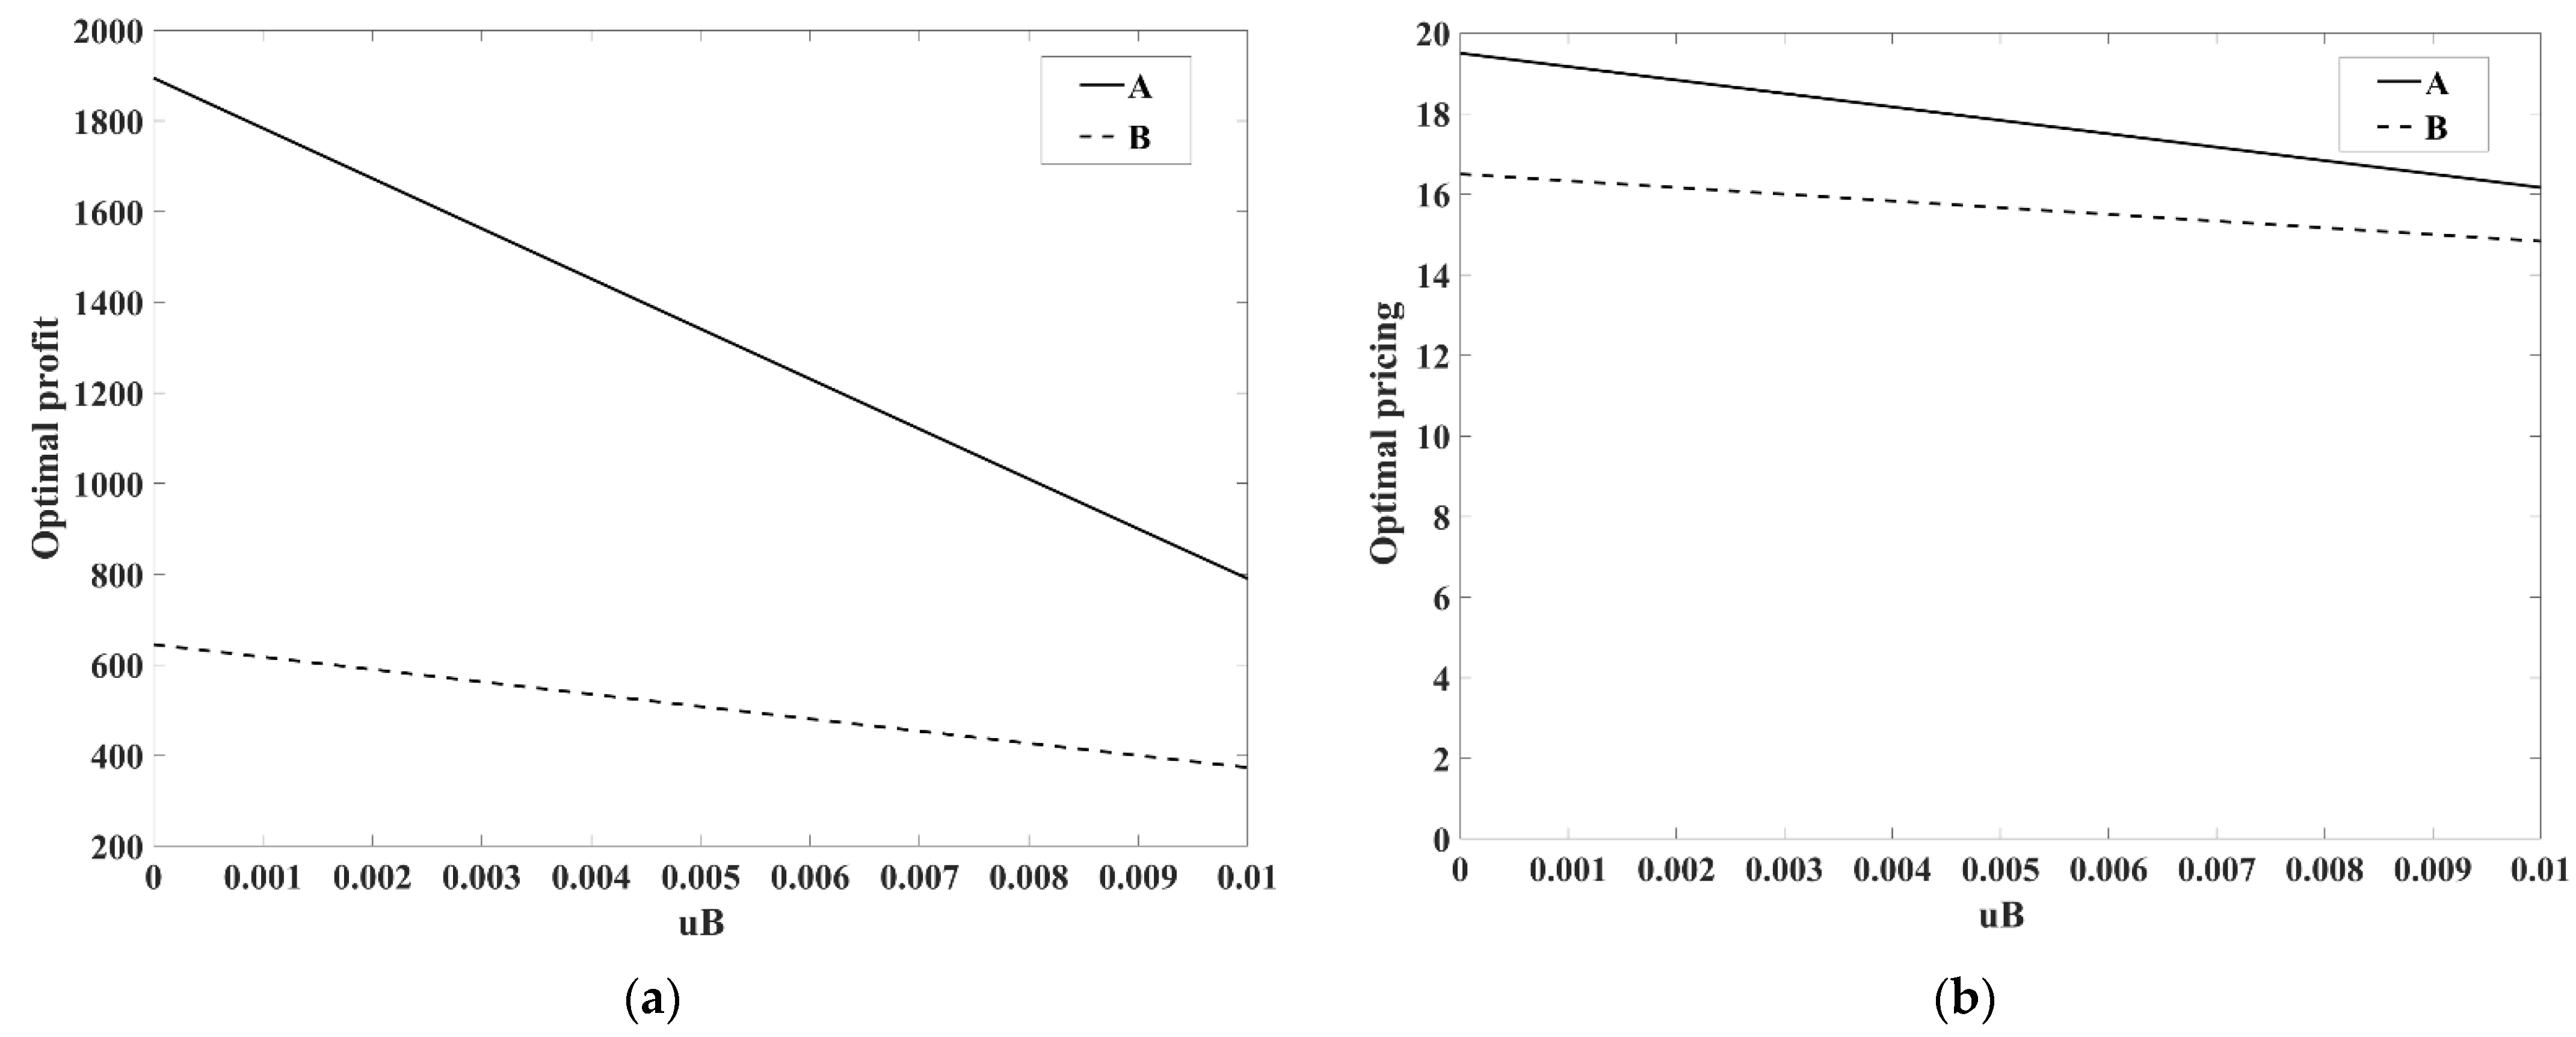
3.2.1. Network Effects
- 1.
- Under scenario , we take the supplier A as an example:
- 2.
- For scenarios and , we take as an example:
- 3.
- For scenario :
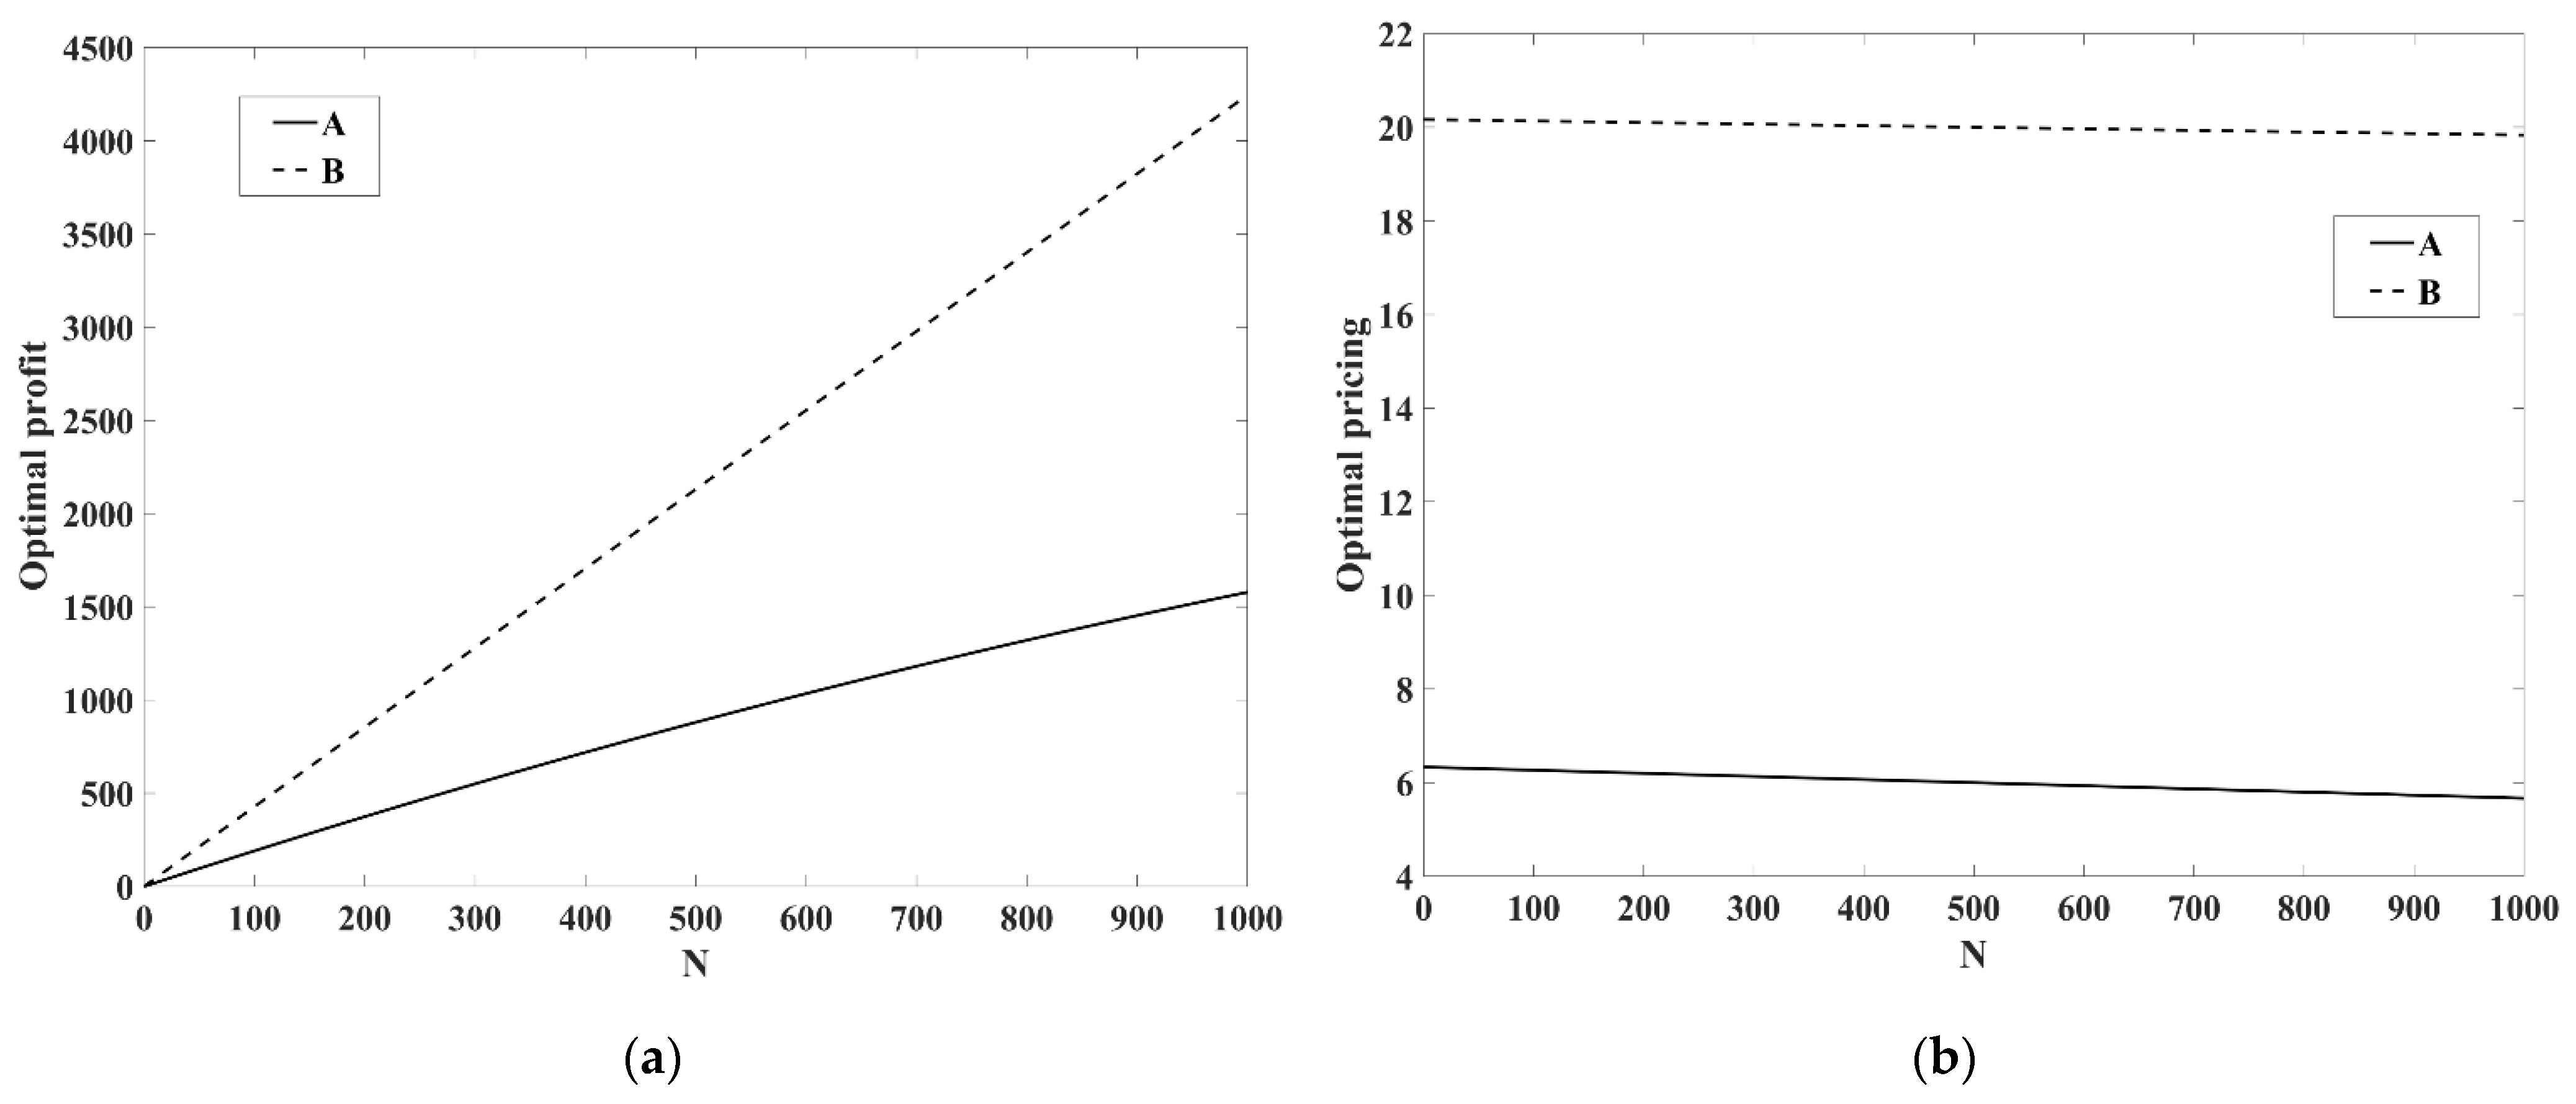
3.2.2. Market Size
- 1.
- For scenario :
- 2.
- For scenarios and , we take as an example:
4. Numerical Analysis
4.1. Data
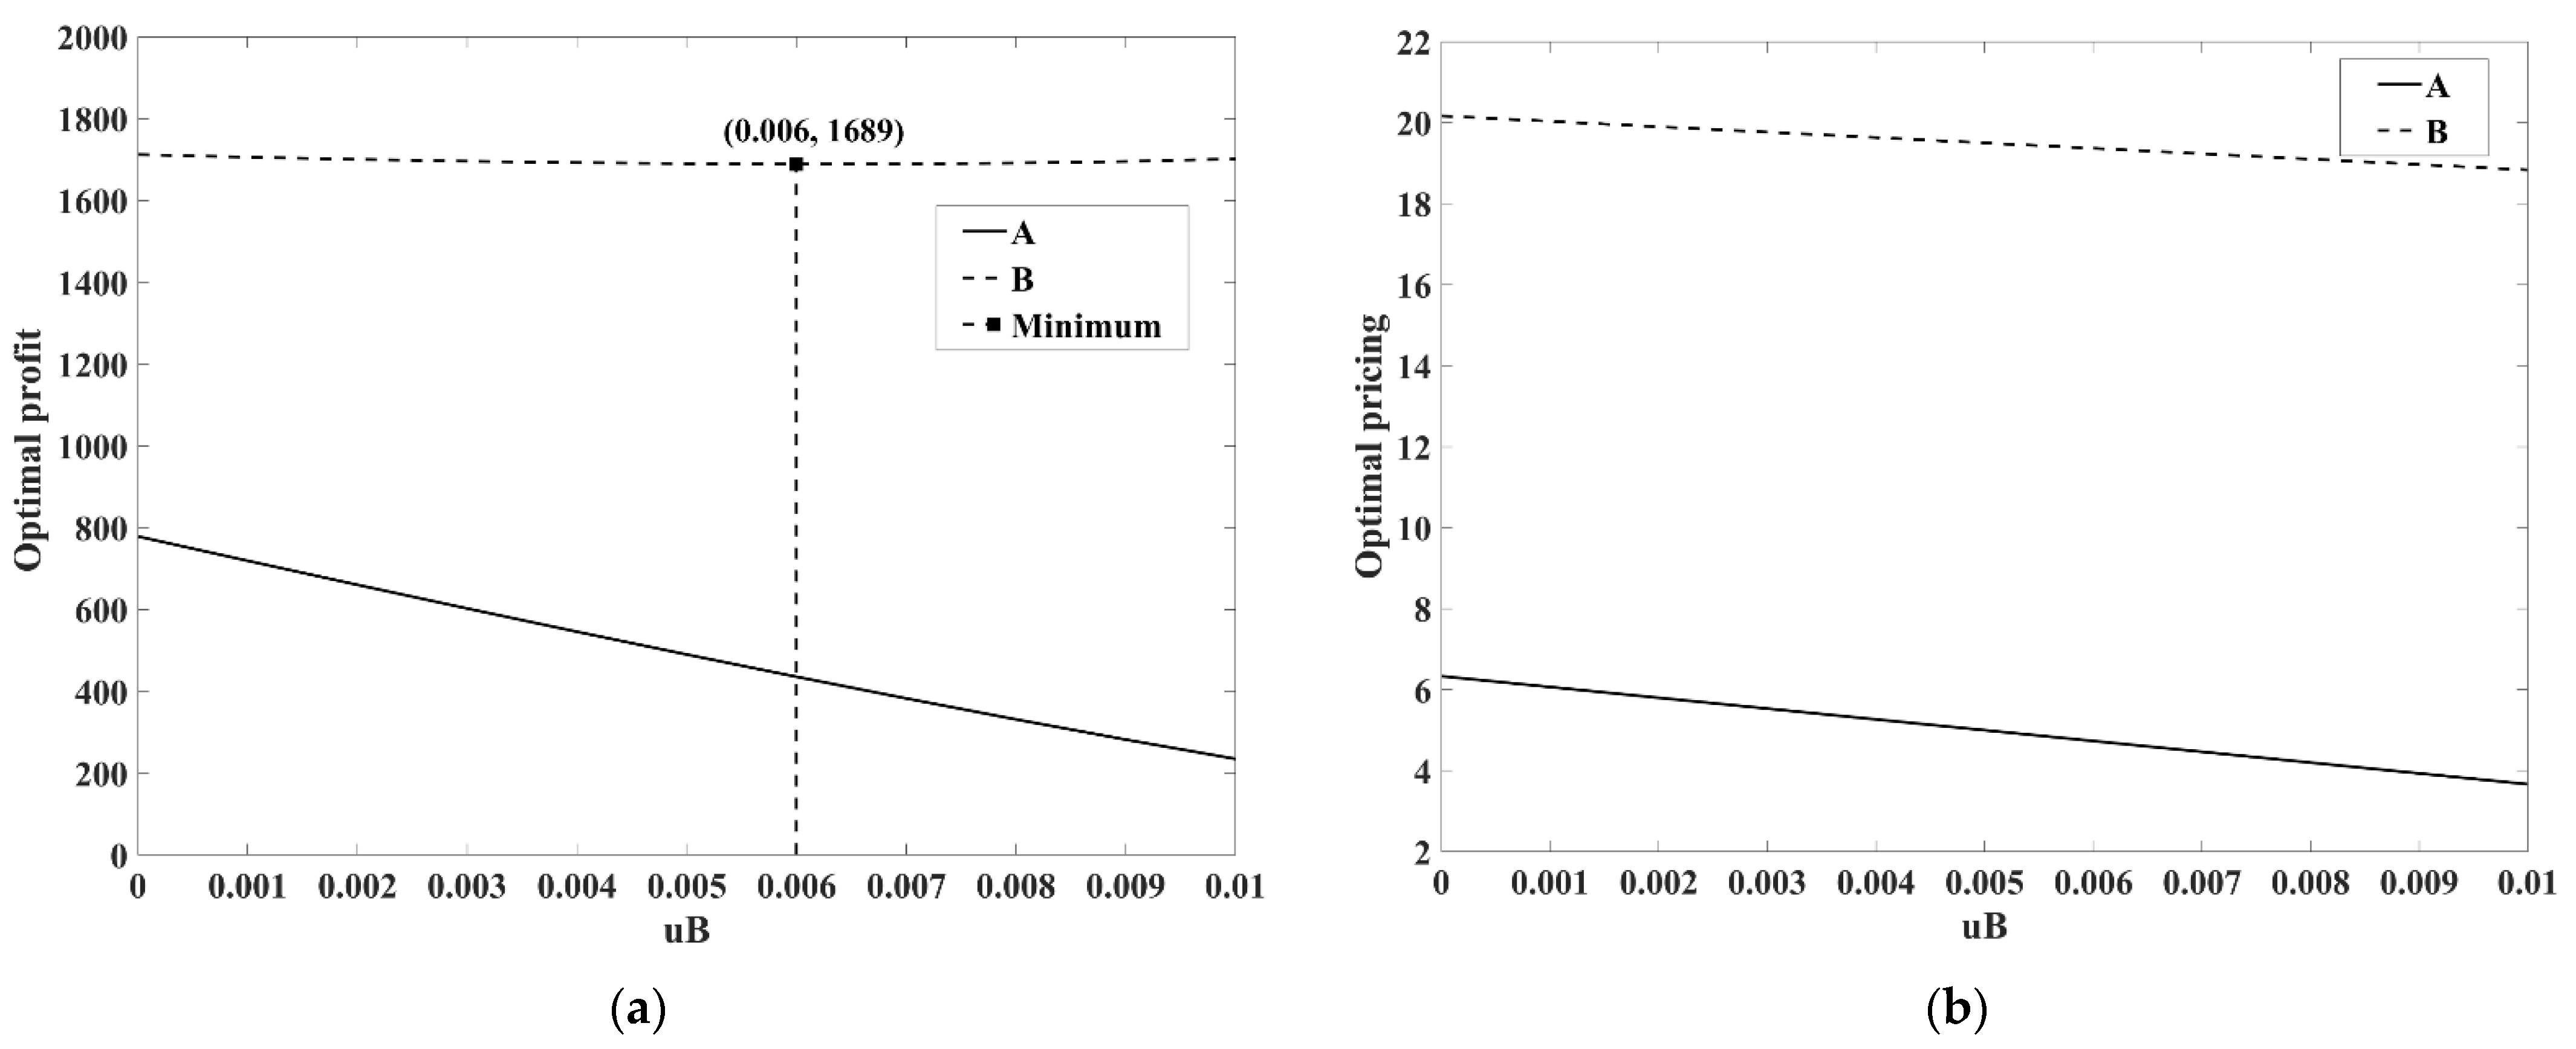
4.2. Network Effects Analysis
- The SS situation:
- 2.
- The NS situation:
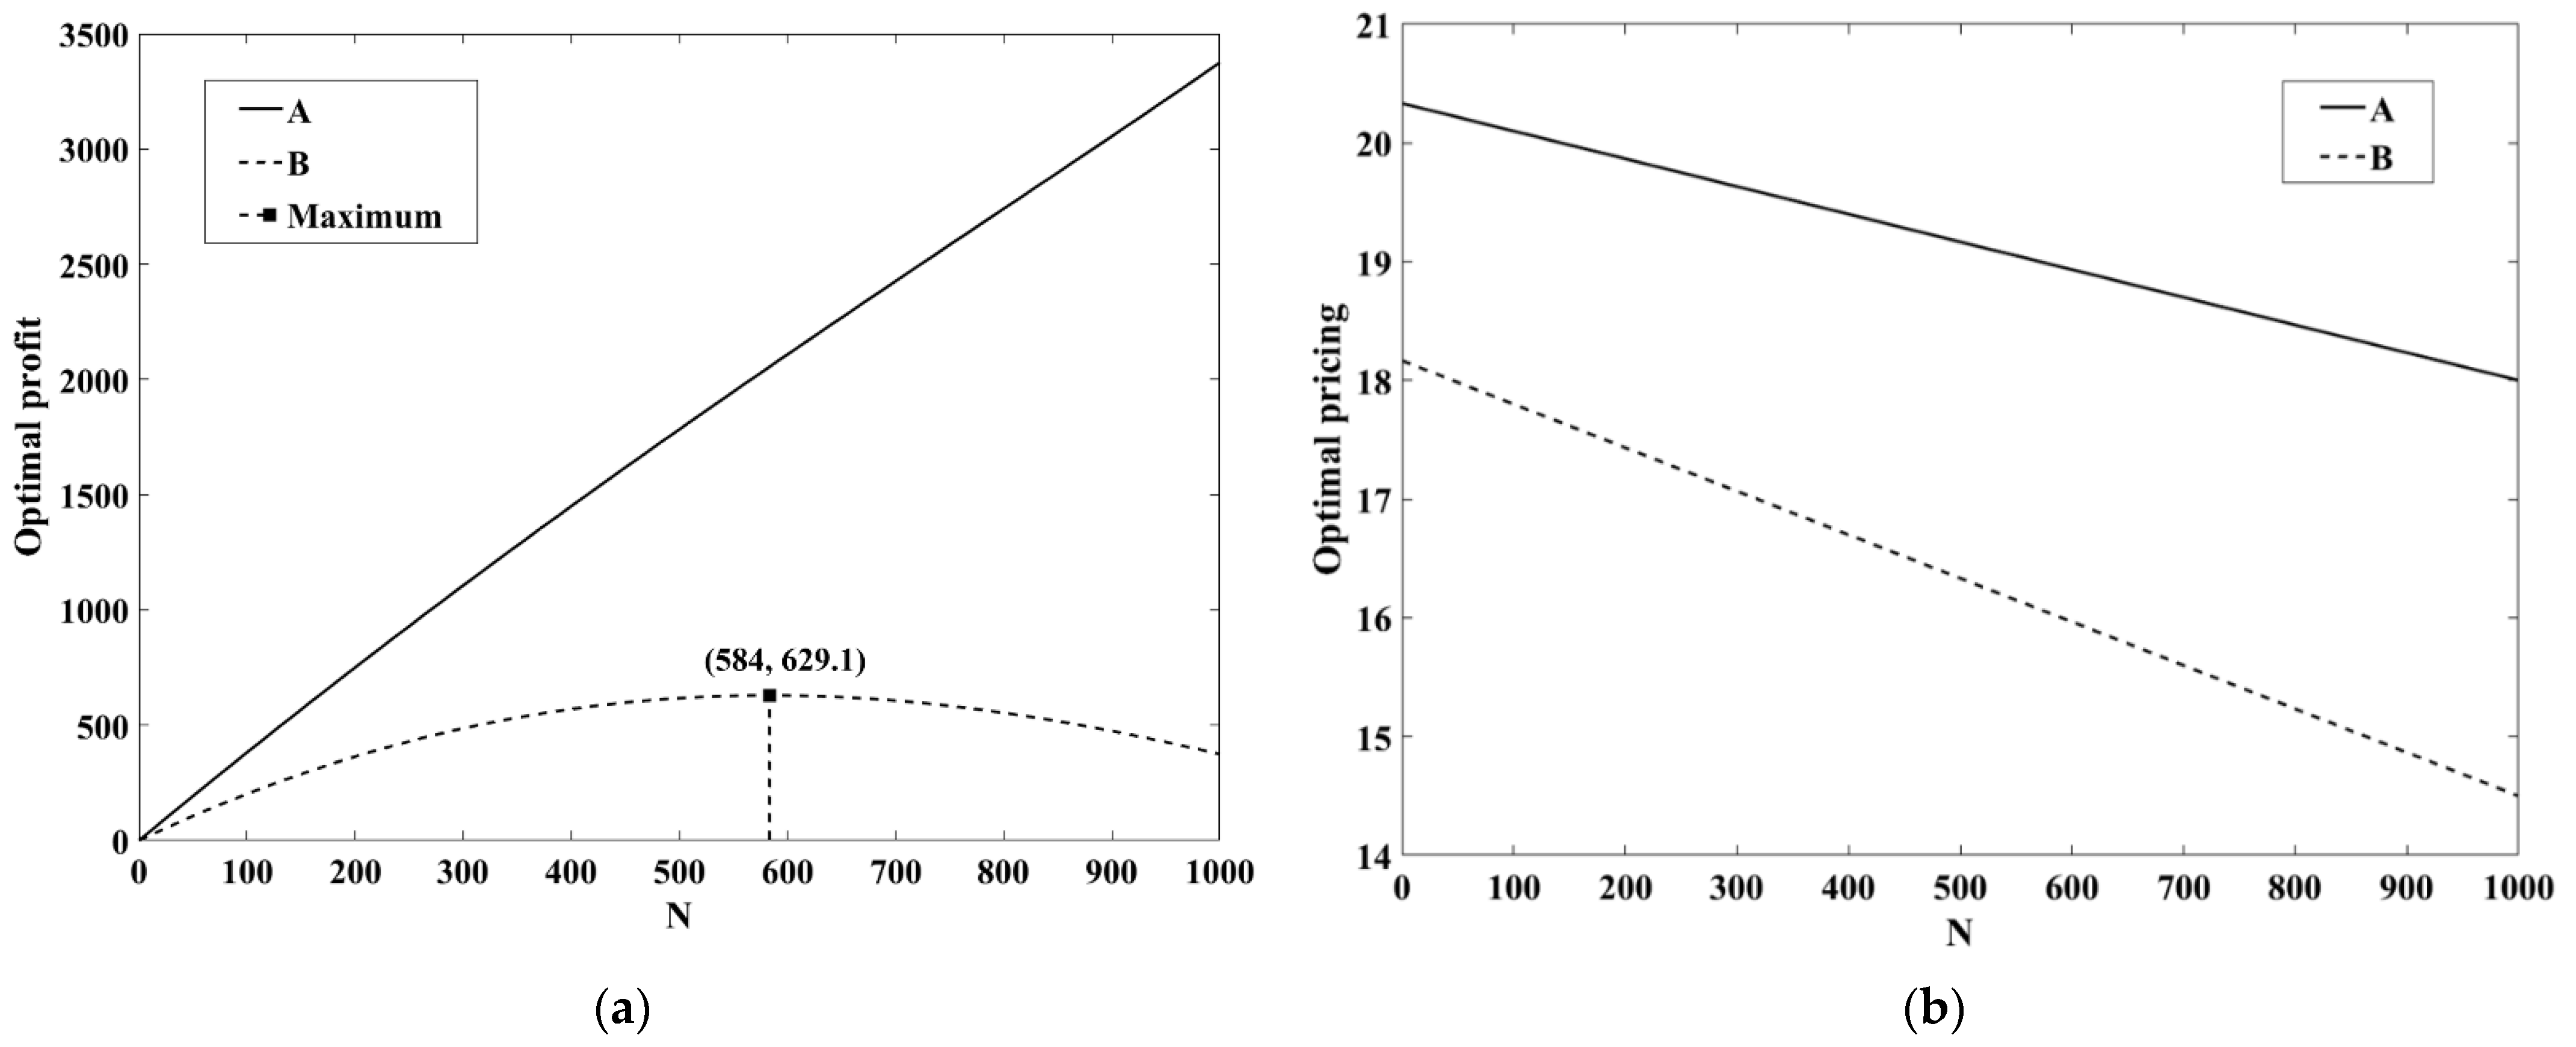
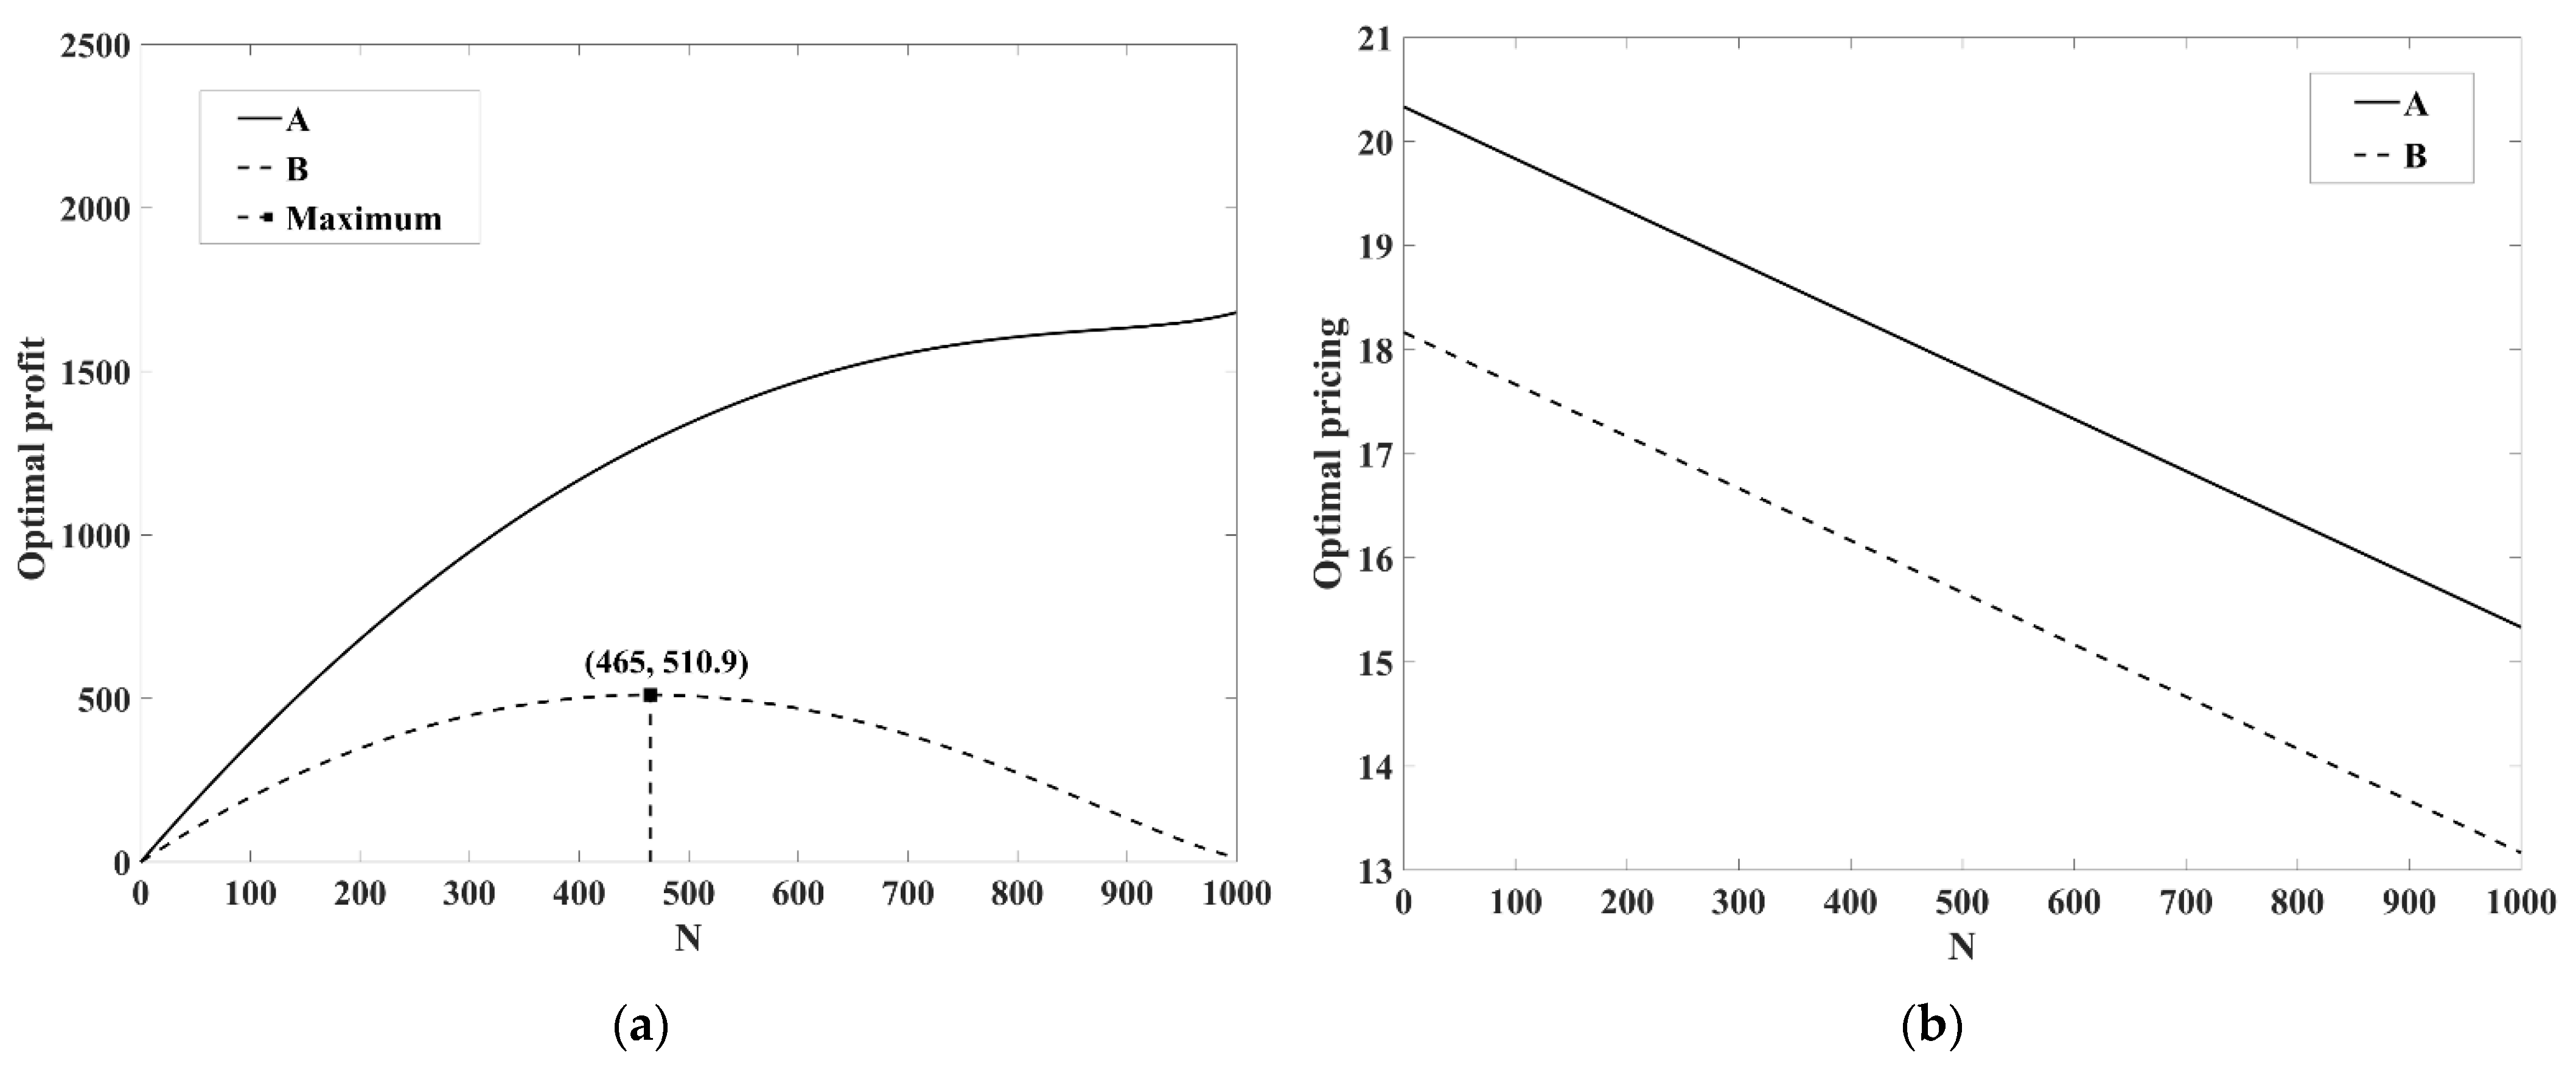
4.3. Market Size Analysis
- 1.
- Scenario
- 2.
- Scenario
- 3.
- Scenario ;
- 4.
- Scenario ;
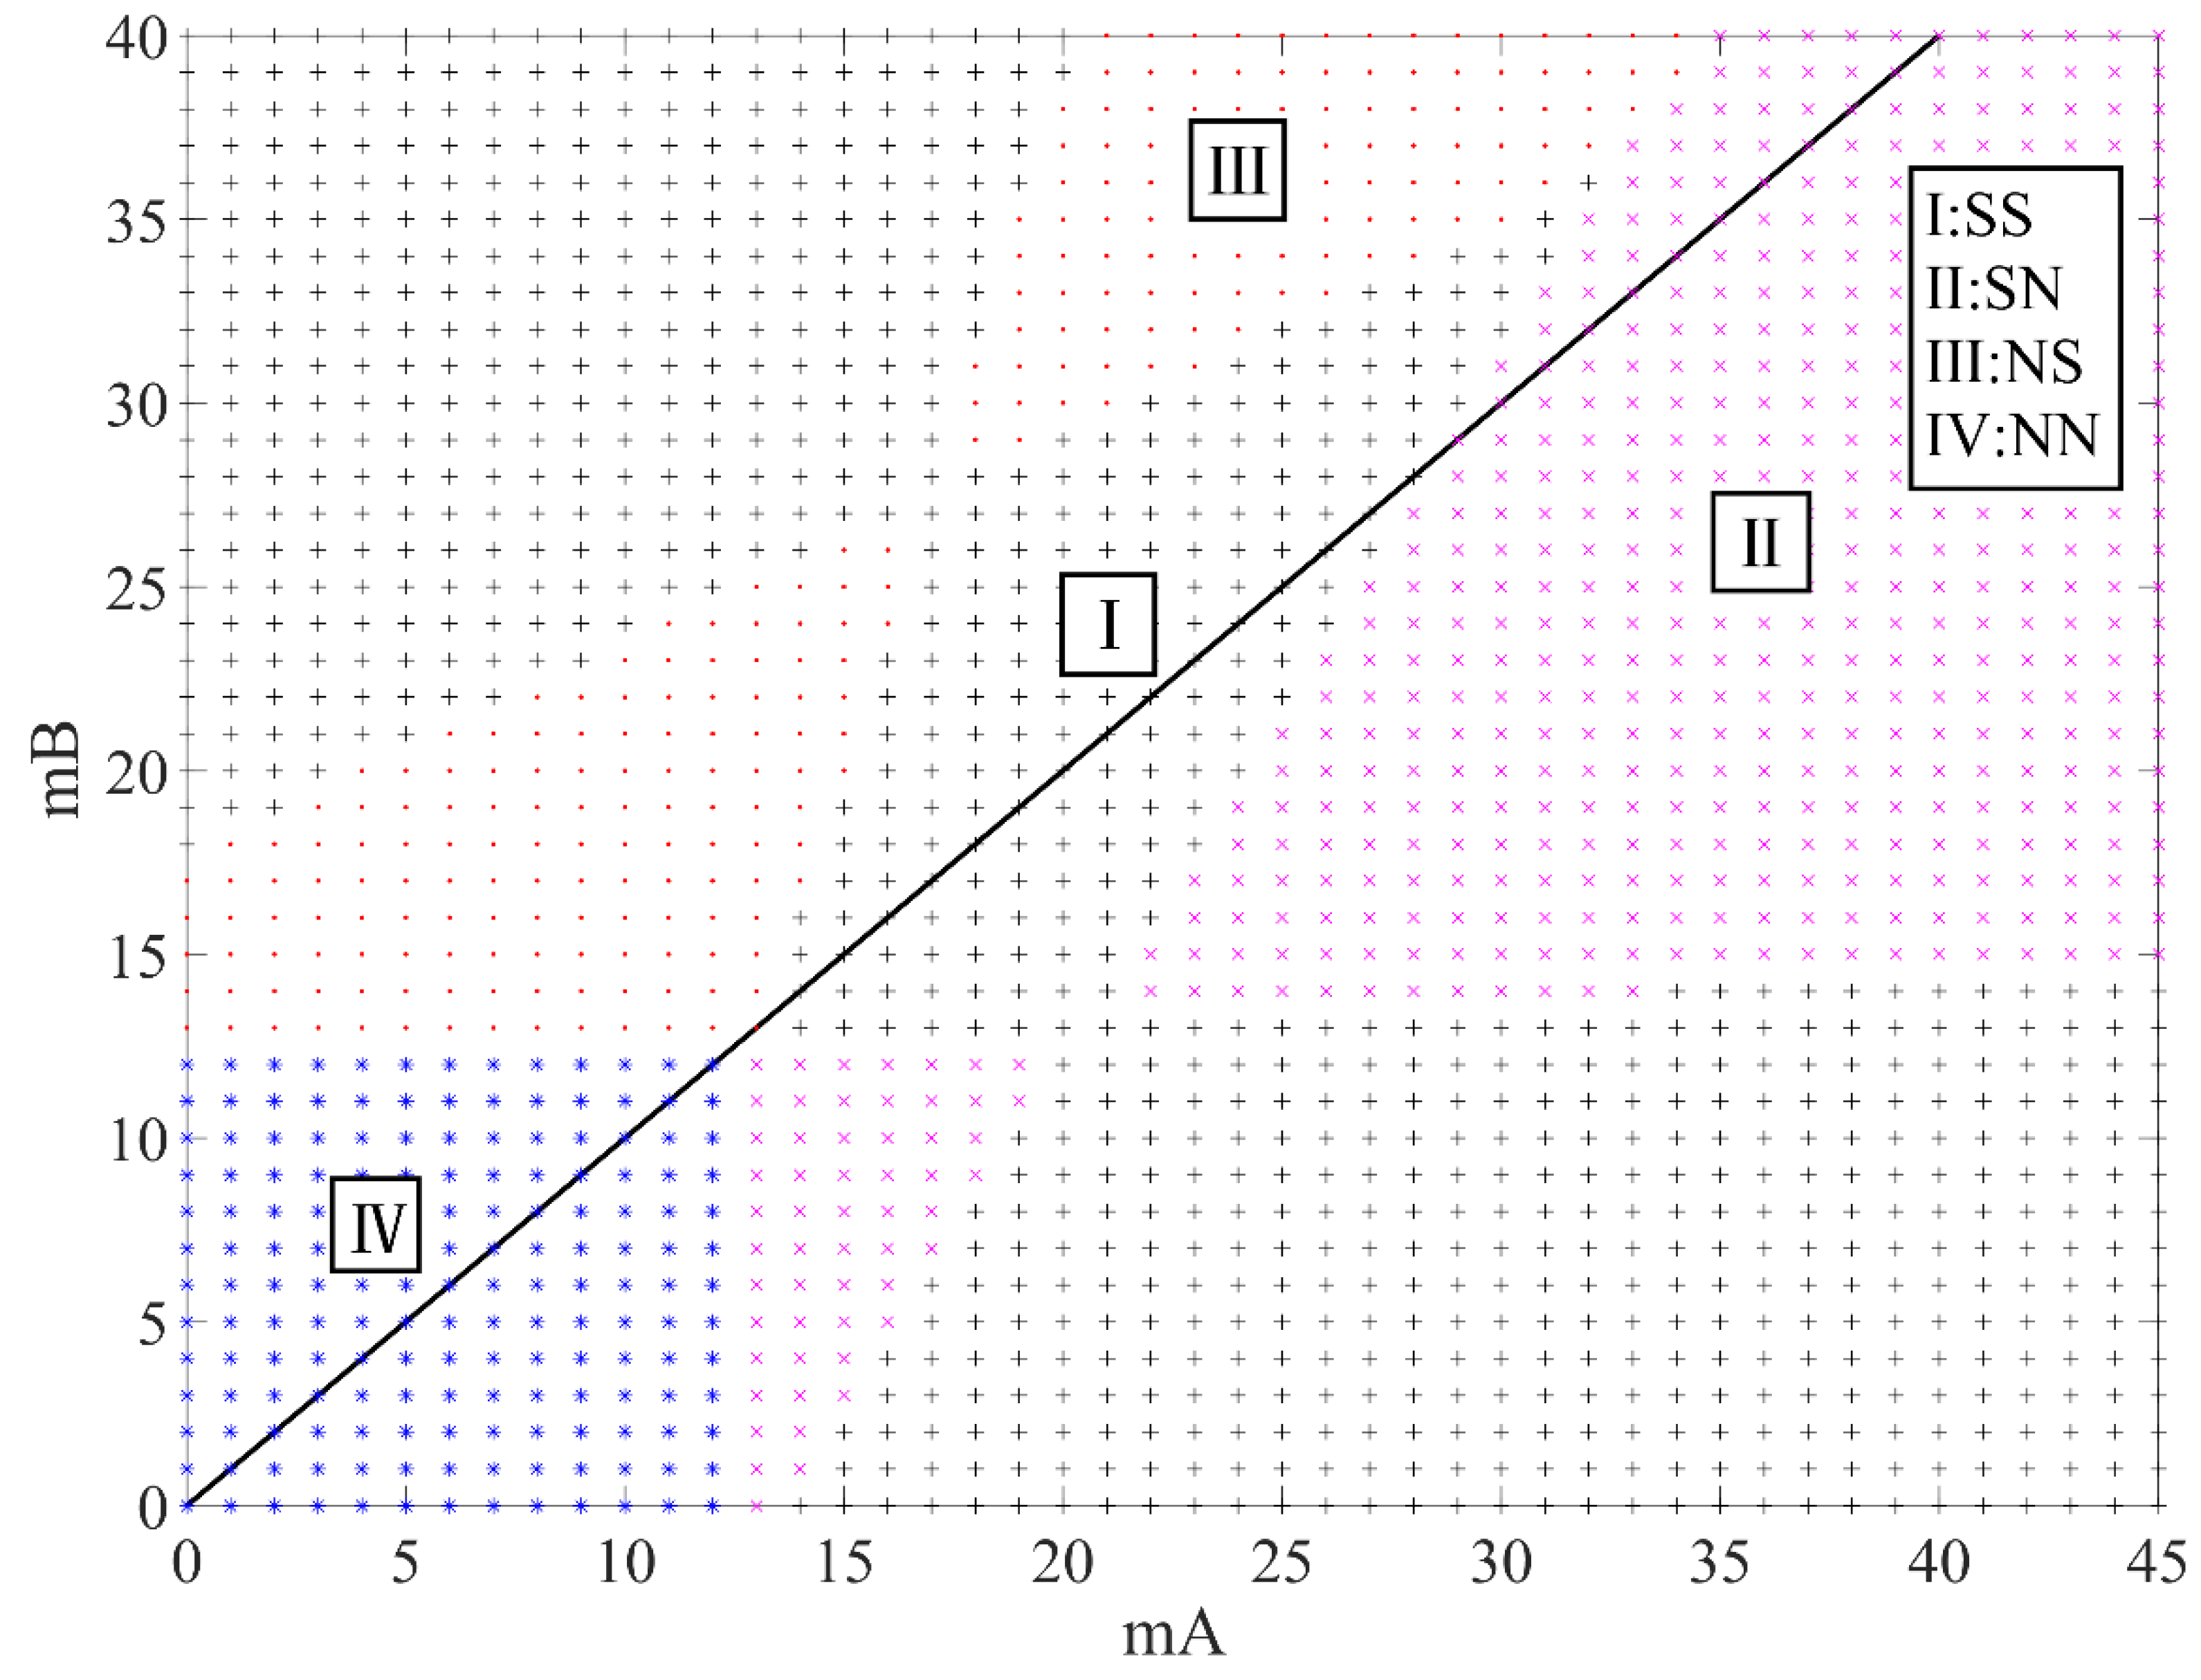
4.4. Sales Strategy Analysis
5. Conclusions
- (1)
- A hydrogen energy supplier’s provision of value-added services does not necessarily increase its profits. Only when the intrinsic value of its value-added services exceeds a certain threshold its profits will increase, and the threshold varies in different scenarios;
- (2)
- The profit of a hydrogen energy supplier is affected by four key factors: the intrinsic value of value-added services, the network effect of value-added services, the size of consumers, and the sales strategies of competitors. When the intrinsic value of value-added services is higher than the threshold, the profit of the hydrogen energy supplier increases with the increase of its service network effect and consumer network size but decreases with the increase of competitors’ value-added services network effects. When the intrinsic value of value-added services is lower than the threshold, it shows the opposite trend.
- (3)
- When the two hydrogen energy suppliers both provide value-added services, their profits will decrease with the increase of value-added service network effects, independent of the intrinsic value of the value-added services, so hydrogen energy suppliers should avoid vicious competition in the value-added services market. Finally, this paper obtains the optimal sales strategies for two suppliers in a specific scenario with the different intrinsic values of value-added services, which is quite practical for the application in a practical scenario.
Author Contributions
Funding
Institutional Review Board Statement
Informed Consent Statement
Data Availability Statement
Conflicts of Interest
References
- Ceseña, E.A.M.; Mancarella, P. Energy systems integration in smart districts: Robust optimisation of multi-energy flows in integrated electricity, heat and gas networks. IEEE Trans. Smart Grid 2018, 10, 1122–1131. [Google Scholar] [CrossRef]
- International Renewable Energy Agency. Hydrogen from Renewable Power: Technology Outlook for the Energy Transition. Available online: https://irena.org/publications/2018/Sep/Hydrogen-from-renewable-power (accessed on 20 February 2020).
- Han, X.; Zhang, X.H.; Yan, H.G.; Kang, J.D.; Li, J.H.; Zhang, H. Current Situation and Prospect of Global Hydrogen Energy Industry Policy. Electr. Power Inf. Commun. Technol. 2021, 19, 27–34. [Google Scholar] [CrossRef]
- Strategy & Middle East—PwC. The Dawn of Green Hydrogen: Maintaining the GCC’s Edge in a Decarbonized World. Available online: https://www.strategyand.pwc.com/m1/en/reports/2020/the-dawn-of-green-hydrogen/the-dawn-of-green-hydrogen.pdf (accessed on 15 March 2022).
- IEA. Global Hydrogen Review 2021. Available online: https://www.iea.org/reports/global-hydrogen-review-2021 (accessed on 15 March 2022).
- Kakoulaki, G.; Kougias, I.; Taylor, N.; Dolci, F.; Moya, J.; Jäger-Waldau, A. Green hydrogen in Europe–A regional assessment: Substituting existing production with electrolysis powered by renewables. Energy Convers. Manag. 2021, 228, 113649. [Google Scholar] [CrossRef]
- Hydrogen Council. Hydrogen Insights–A Perspective on Hydrogen Investment, Market Development and Cost Competitiveness. Available online: http://www.stdlibrary.com/p-1368016.html (accessed on 26 February 2021).
- Fuel Cells and Hydrogen. Hydrogen Roadmap Europe: A Sustainable Pathway for the European Energy Transition. Available online: https://www.fch.europa.eu/sites/default/files/Hydrogen%20Roadmap%20Europe_Report.pdf (accessed on 10 February 2021).
- Wang, Y.Y.; Gao, L.; Liu, Y.D. The Inspiration of the National Hydrogen Energy Roadmap of US. Future Dev. 2015, 39, 22–29. [Google Scholar]
- Fu, G.Y.; Xiong, H.W. The models of hydrogen energy development in Japan, Germany and the United States and enlightenments. Macroecon. Manag. 2020, 6, 84–90. [Google Scholar] [CrossRef]
- Bao, J.C.; Zhao, Z.L.; Ma, Q.Y. Overview of the development trends of hydrogen energy technologies. Automot. Dig. 2020, 2, 6–11. [Google Scholar] [CrossRef]
- Xia, F.J.; Zhou, Y. Current status and perspective of hydrogen energy and fuel cell technologies in Germany. Mar. Electr. Electr. Eng. 2015, 35, 49–52. [Google Scholar] [CrossRef]
- Ding, M. Characteristics, motivation, international coordination of Japan’s hydrogen strategy. Contemp. Econ. Jpn. 2021, 4, 28–41. [Google Scholar] [CrossRef]
- Wang, L.; Cao, Y. Utilization of hydrogen energy and its enlightenment to China’s development. Shanghai Energy Conserv. 2021, 5, 444–448. [Google Scholar] [CrossRef]
- Chung, Y.; Hong, S.; Kim, J. Which of the technologies for producing hydrogen is the most prospective in Korea?: Evaluating the competitive priority of those in near-, mid-, and long-term. Energy Policy 2014, 65, 115–125. [Google Scholar] [CrossRef]
- Lee, B.; Chae, H.; Choi, N.H.; Moon, C.; Moon, S.; Lim, H. Economic evaluation with sensitivity and profitability analysis for hydrogen production from water electrolysis in Korea. Int. J. Hydrogen Energy 2017, 42, 6462–6471. [Google Scholar] [CrossRef]
- Hartley, P.G.; Au, V. Towards a Large-Scale Hydrogen Industry for Australia. Engineering 2020, 6, 1346–1348. [Google Scholar] [CrossRef]
- Andreasen, K.P.; Sovacool, B.K. Energy sustainability, stakeholder conflicts, and the future of hydrogen in Denmark. Renew. Sustain. Energy Rev. 2014, 39, 891–897. [Google Scholar] [CrossRef]
- Nikolaidis, P.; Poullikkas, A. A comparative overview of hydrogen production processes. Renew. Sustain. Energy Rev. 2017, 67, 597–611. [Google Scholar] [CrossRef]
- Acar, C.; Beskese, A.; Temur, G.T. Sustainability analysis of different hydrogen production options using hesitant fuzzy AHP. Int. J. Hydrogen Energy 2018, 43, 18059–18076. [Google Scholar] [CrossRef]
- Huang, Y.S.; Liu, S.J. Efficiency evaluation of a sustainable hydrogen production scheme based on super efficiency SBM model. J. Clean. Prod. 2020, 256, 120447. [Google Scholar] [CrossRef]
- Muthurasu, A.; Ojha, G.P.; Lee, M.; Kim, H.Y. Zeolitic imidazolate framework derived Co3S4 hybridized MoS2–Ni3S2 heterointerface for electrochemical overall water splitting reactions. Electrochim. Acta 2020, 334, 135537. [Google Scholar] [CrossRef]
- Muthurasu, A.; Ojha, G.P.; Lee, M.; Kim, H.Y. Integration of cobalt metal–organic frameworks into an interpenetrated prussian blue analogue to derive dual metal–organic framework-assisted cobalt iron derivatives for enhancing electrochemical total water splitting. J. Phys. Chem. C 2020, 124, 14465–14476. [Google Scholar] [CrossRef]
- Huo, X.X.; Wang, J.; JIang, L.; Xu, Q.S. Review on key technologies and applications of hydrogen energy storage system. Energy Storage Sci. Technol. 2016, 5, 197–203. [Google Scholar]
- Wan, C.; Zhou, L.; Xu, S.M.; Jin, B.Y.; Ge, X.; Qian, X.; Xu, L.X.; Chen, F.Q.; Zhan, X.L.; Yang, Y.R. Defect engineered mesoporous graphitic carbon nitride modified with AgPd nanoparticles for enhanced photocatalytic hydrogen evolution from formic acid. Chem. Eng. J. 2022, 429, 132388. [Google Scholar] [CrossRef]
- Ren, Z.H.; Zhang, X.; Gao, M.X.; Pan, H.G.; Liu, Y.F. Research Progress in Ti-Based Catalysts-Modified NaAIH4 Hydrogen Storage Materials. Chin. J. Rare Met. 2021, 45, 569–582. [Google Scholar] [CrossRef]
- Burkhardt, J.; Patyk, A.; Tanguy, P.; Retzke, C. Hydrogen mobility from wind energy–A life cycle assessment focusing on the fuel supply. Appl. Energy 2016, 181, 54–64. [Google Scholar] [CrossRef]
- Xu, S.S.; Zhang, R.Y.; Cheng, J.; Wang, H.J.; Lu, C.Z. Application and development of electrolytic hydrogen production and high temperature fuel cell in electric power industry. Proc. CSEE 2019, 39, 2531–2537. [Google Scholar] [CrossRef]
- Li, J.R.; Lin, J.; Song, Y.H.; Xing, X.T.; Fu, C. Operation optimization of power to hydrogen and heat (P2HH) in ADN coordinated with the district heating network. IEEE Trans. Sustain. Energy 2018, 10, 1672–1683. [Google Scholar] [CrossRef]
- Grube, T.; Doré, L.; Hoffrichter, A.; Hombach, L.E.; Raths, S.; Robinius, M.; Nobis, M.; Schiebahn, S.; Tietze, V.; Schnettler, A. An option for stranded renewables: Electrolytic-hydrogen in future energy systems. Sustain. Energy Fuels 2018, 2, 1500–1515. [Google Scholar] [CrossRef]
- Parra, D.; Valverde, L.; Pino, F.J.; Patel, M.K. A review on the role, cost and value of hydrogen energy systems for deep decarbonisation. Renew. Sustain. Energy Rev. 2019, 101, 279–294. [Google Scholar] [CrossRef]
- Ju, H.; Badwal, S.; Giddey, S. A comprehensive review of carbon and hydrocarbon assisted water electrolysis for hydrogen production. Appl. Energy 2018, 231, 502–533. [Google Scholar] [CrossRef]
- Hosseini, S.E.; Wahid, M.A. Hydrogen production from renewable and sustainable energy resources: Promising green energy carrier for clean development. Renew. Sustain. Energy Rev. 2016, 57, 850–866. [Google Scholar] [CrossRef]
- Phoumin, H.; Kimura, F.; Arima, J. Potential renewable hydrogen from curtailed electricity to decarbonize ASEAN’s emissions: Policy implications. Sustainability 2020, 12, 10560. [Google Scholar] [CrossRef]
- Rosen, M.A.; Koohi-Fayegh, S. The prospects for hydrogen as an energy carrier: An overview of hydrogen energy and hydrogen energy systems. Energy Ecol. Environ. 2016, 1, 10–29. [Google Scholar] [CrossRef] [Green Version]
- Soinio, J.; Tanskanen, K.; Finne, M. How logistics-service providers can develop value-added services for SMEs: A dyadic perspective. Int. J. Logist. Manag. 2012, 23, 31–49. [Google Scholar] [CrossRef]
- Dan, B.; Zhang, S.G.; Zhou, M.S. Strategies for warranty service in a dual-channel supply chain with value-added service competition. Int. J. Prod. Res. 2018, 56, 5677–5699. [Google Scholar] [CrossRef]
- Yi, S.M.; Yu, L.Y.; Zhang, Z.Y. Research on Pricing Strategy of Dual-Channel Supply Chain Based on Customer Value and Value-Added Service. Mathematics 2021, 9, 11. [Google Scholar] [CrossRef]
- Li, K.P.; Mu, Q.T.; Wang, F.; Gao, Y.J.; Li, G.; Shafie-Khah, M.; Catalão, J.P.; Yang, Y.C.; Ren, J.F. A business model incorporating harmonic control as a value-added service for utility-owned electricity retailers. IEEE Trans. Ind. Appl. 2019, 55, 4441–4450. [Google Scholar] [CrossRef]
- Dou, G.W.; He, P.; Xu, X. One-side value-added service investment and pricing strategies for a two-sided platform. Int. J. Prod. Res. 2016, 54, 3808–3821. [Google Scholar] [CrossRef]
- Wang, W. Study on technology commercialization strategies of the innovator in the presence of network Effects. Soft Sci. 2020, 34, 90–96. [Google Scholar] [CrossRef]
- Chen, N.Y.; Chen, Y.J. Duopoly competition with network effects in discrete choice models. Oper. Res. 2021, 69, 545–559. [Google Scholar] [CrossRef]
- Nie, L.; Wang, X.J. Complementary two-sided platforms’ advertising decision Problem based on hoteling Model. J. Tianjin Univ. 2021, 23, 20–24. [Google Scholar]
- Lv, K.; Hu, H.H.; Wang, X.H. Bundling competition with scope economics and switching costs. J. Manag. Sci. China 2012, 15, 10–24. [Google Scholar]
- Li, X.X.; Chen, Y.X. Corporate IT standardization: Product compatibility, exclusive purchase commitment, and competition effects. Inf. Syst. Res. 2012, 23, 1158–1174. [Google Scholar] [CrossRef]


| A Provides Value-Added Services | B Provides Value-Added Services | |
|---|---|---|
| NN | No | No |
| NS | No | Yes |
| SN | Yes | No |
| SS | Yes | Yes |
| Demand Function of Supplier A | Demand Function of Supplier B | |
|---|---|---|
| NN | ||
| NS | ||
| SN | ||
| SS |
| Profit Function of Supplier A | Profit Function of Supplier B | |
|---|---|---|
| NN | ||
| NS | ||
| SN | ||
| SS |
| The Optimal Pricing of Supplier A | The Optimal Pricing of Supplier B | |
|---|---|---|
| NN | ||
| NS | ||
| SN | ||
| SS |
| The Optimal Profit of Supplier A | The Optimal Profit of Supplier B | |
|---|---|---|
| NN | ||
| NS | ||
| SN | ||
| SS |
| Scenarios | A Provides Value-Added Services | B Provides Value-Added Services | The Network Effect of Value-Added Services Is the Same |
|---|---|---|---|
| Yes | Yes | No | |
| Yes | No | No | |
| No | Yes | No | |
| Yes | Yes | Yes |
| Parameters | Value | Parameters | Value |
|---|---|---|---|
| N | 0–1000 | 0.005 | |
| 0–45 | 0.001–0.01 | ||
| 0–40 | 12 | ||
| 12 | 1.5 | ||
| 6 | 1 |
| Parameters | Value | Parameters | Value |
|---|---|---|---|
| N | 1000 | 0.005 | |
| 20 | 0.001 | ||
| 18 | 12 | ||
| 12 | 1.5 | ||
| 6 | 1 |
| Supplier A | 2893.52 | 6670.63 | 911.62 | 2835.65 |
| Supplier B | 560.19 | 3.97 | 5578.28 | 3168.98 |
Publisher’s Note: MDPI stays neutral with regard to jurisdictional claims in published maps and institutional affiliations. |
© 2022 by the authors. Licensee MDPI, Basel, Switzerland. This article is an open access article distributed under the terms and conditions of the Creative Commons Attribution (CC BY) license (https://creativecommons.org/licenses/by/4.0/).
Share and Cite
Zhao, W.; Ma, J.; Wang, Z.; Li, Y.; Zhang, W. Potential Hydrogen Market: Value-Added Services Increase Economic Efficiency for Hydrogen Energy Suppliers. Sustainability 2022, 14, 4804. https://doi.org/10.3390/su14084804
Zhao W, Ma J, Wang Z, Li Y, Zhang W. Potential Hydrogen Market: Value-Added Services Increase Economic Efficiency for Hydrogen Energy Suppliers. Sustainability. 2022; 14(8):4804. https://doi.org/10.3390/su14084804
Chicago/Turabian StyleZhao, Wenhui, Jibin Ma, Zhanyang Wang, Youting Li, and Weishi Zhang. 2022. "Potential Hydrogen Market: Value-Added Services Increase Economic Efficiency for Hydrogen Energy Suppliers" Sustainability 14, no. 8: 4804. https://doi.org/10.3390/su14084804
APA StyleZhao, W., Ma, J., Wang, Z., Li, Y., & Zhang, W. (2022). Potential Hydrogen Market: Value-Added Services Increase Economic Efficiency for Hydrogen Energy Suppliers. Sustainability, 14(8), 4804. https://doi.org/10.3390/su14084804