Article

Seasonal Variations and Influencing Factors of Gross Nitrification Rate in Desert Steppe Soil

1
College of Grassland, Resource and Environment, Inner Mongolia Agricultural University, Hohhot 010011, China
2
Key Laboratory of Grassland Resources, Ministry of Education of the China, Hohhot 010011, China
3
Inner Mongolia Academy of Agricultural and Animal Husbandry Sciences, Hohhot 010031, China
4
College of Vocation and Technology, Inner Mongolia Agricultural University, Baotou 014109, China
*
Authors to whom correspondence should be addressed.
Sustainability 2022, 14(8), 4787; https://doi.org/10.3390/su14084787
Submission received: 25 March 2022 / Revised: 11 April 2022 / Accepted: 13 April 2022 / Published: 16 April 2022

Abstract

:
Nitrification plays an important role in nitrogen (N) turnover and N cycling. To date, there have been many studies on the net N turnover in grassland. However, few studies have specifically focused on the gross N turnover, which is mainly due to methodological limitations. Here, we set up an enclosed plot in a desert steppe and determined the gross nitrification (GN) rate of the soil by using the barometric process separation method. We found the seasonal dynamics of the GN in the desert steppe soil, such that the GN in the summer (117.65 ± 24.86 μg N kg−1 h−1) was significantly greater than in the spring and autumn (65.17 ± 7.33 μg N kg−1 h−1), and it peaked in July (213.75 ± 44.66 μg N kg−1 h−1). Additionally, the GN was lowest in the spring, with a means of 50.52 ± 3.95 μg N kg−1 h−1. The seasonal variation in the GN was different than the seasonal variation in the net nitrification rate, and the GN was generally much higher than the net nitrification rate. We further demonstrated that the soil moisture, temperature, bulk density and NH4+-N were the main factors that influenced the seasonal variations in the GN, and that the soil moisture had the greatest impact on the GN among all the factors measured.

1. Introduction

Nitrogen (N) is a key ecological factor that determines the productivity of terrestrial ecosystems and that influences the community structure and carbon (C) sequestration, especially in arid and semiarid zones [1]. Nitrification is the process of the oxidation of ammonia, ammonium or organic N to nitrate under the action of microorganisms (NH4+/ RNH2 → H2NOH → NO2 → NO3). The contents of ammonium and nitrate in soil are controlled by nitrification. Ammonium and nitrate are the main N forms that are absorbed by higher plants. Ammonium and nitrate are assimilated in planta, and thus they can have an impact on plant growth and production [2]. The nitrate in soil can be absorbed by plants, and its strong mobility can also cause soil water pollution, which is harmful to human health. Nitrous oxide (N2O), which is a potent greenhouse gas, can also be produced during nitrification [3].
Nitrification could be affected by many environmental factors, such as the soil pH, the oxygen, the temperature, the soil water content, the C/N of litter and soil nutrients [4]. In addition, microbial action is also involved in the process of soil nitrification [5]. The nitrification rate in the growing season with optimal hydrothermal conditions is generally higher than that in the nongrowing season [6]. However, some studies that are based on the net nitrification rate have found that the soil nitrification rate in the summer is low, or even negative, in grassland ecosystems [7]. This nitrification rate is often divided into the gross nitrification rate and the net nitrification rate. The gross nitrification rate, which is also known as the “primary turnover rate”, refers to the actual rate at which ammonium is transformed into nitrate. The net turnover rate is obtained by measuring the pool size of the nitrate per unit of time. A variety of reactions occur at the same time, some of which consume nitrate, while others produce nitrate. Therefore, the net nitrification rate is the result of the combined effect of multiple reaction pathways on nitrate, and it cannot reflect the actual production of nitrate [8]. The net nitrification rate reflects the net content of the nitrate in the soil and does not reflect the gross nitrate content. Therefore, the nitrate content that is derived from the net nitrification rate may be lower than the actual nitrate that is produced.
The desert steppe is a climatogenic ecotone that is located in desert and in typical steppe. It is an important grassland type in the grasslands of Europe and Asia, and it accounts for ca. 11% of Inner Mongolia’s steppe area. The climate is cold and dry, with an average rainfall of 150–250 mm per year. The soil is barren, with low organic matter content, and low nitrogen and phosphorus contents, but it is rich in potassium [9]. Nitrogen deficiency is one of the main factors that limit plant growth in arid and semiarid zones [4,10,11]. Improving the nitrogen utilization efficiency by managing the nitrogen transformation process is helpful to alleviate soil nitrogen deficiency. Therefore, research on nitrogen nitrification in the desert steppe is of great significance for reducing nitrogen loss and N2O emissions. The objective of the study was to determine the seasonal changes of the soil gross nitrification and the related soil parameters in the enclosed plots by using barometric process separation (BaPS) technology. We hypothesized that the gross nitrification rate should be greater in the growing season than in the nongrowing season in the desert steppe. In the present study, we explore the following two questions: (1) What is the trend of the seasonal variation in the gross soil nitrification in the desert steppe? (2) What are the main factors that affect the gross nitrification rate in the soil of the desert steppe?

2. Materials and Methods

2.1. General Description of Study Sites

This study was conducted at the Zhaohe desert steppe experiment station (41°21′ N, 111°112′ E, and 1602 m above sea level.), which is located in Damao Banner, the Nei Mongolia Autonomous Region, China. The study site has a temperate continental climate, with four distinct seasons: spring (March–May), summer (June–August), autumn (September–November) and winter (December–February). The average annual precipitation is about 281 mm, and more than 60% of the rain falls from July to September. The average air temperature is about 2.5 °C per year. The typical soil in this region is light chestnut soil, according to the Chinese soil classification system, with a loamy and sandy texture. The thickness of the soil is about 30 cm, on average. The common species at the study site are: Stipa sareptana Becker var. krylovii (Chinese name: xī běi zhēn máo); Leymus chinensis (Chinese name: yáng cǎo); Cleistogenes songorica (Chinese name: wú máng yǐn zǐ cǎo); Agropyron mongolicum (Chinese name: bīng cǎo); Artemisia frigida (Chinese name: lěng hāo); Convolvulus ammannii (Chinese name: yín huī xuán huā); Allium tenuissimum (Chinese name: xì yè jiǔ); Aster altaicus (Chinese name: ā ěr tài gǒu wá huā); Carex duriuscula (Chinese name: cùn cǎo tái); and Silene jenisseensis (Chinese name: shān mǎ zhà cǎo). Table 1 shows the main chemical properties of the soil for the experimental grassland.

2.2. Experimental Design

In 2014, a grazing experiment was set up and was randomly designed with 3 enclosed plots, with 3 replicates. The plot area was 120 m × 110 m. For more details about the plot settings, please refer to [12]. The control plots, which are no-grazing plots in the study of Wang et al. [12], were used in this study.

2.3. Soil Sampling

Soil was sampled in July–November in 2017 and March–June in 2018. Five sampling points were randomly set up in each community (four points at the corner and one point in the center). A standard soil sampling ring was used to take a sample of the undisturbed soil at a depth of 10–15 cm, and the samples were then put into an aluminum incubator with ice bags. Samples were brought back to the laboratory, were placed in a refrigerator at 4 °C and were used to determine the gross nitrification rate as soon as possible. We collected additional soil samples while collecting the undisturbed soil to determine other soil indicators, and the soil pH, bulk density, soil moisture content, soil temperature, gross nitrogen, NH4+-N, NO3-N and organic carbon were measured.

2.4. Measurement of Soil Characteristics

Soil pH was measured by an acidometer (PHBJ-260, REX) with a soil-deionized water mass ratio of 2:5. Bulk density was measured by the soil core method at the subsurface depth (10–15 cm) by using the BaPS soil core sampler, and soil water content was measured by the gravimetric method after drying and weighing. Soil temperature was determined by a portable meter (Delta-T, Cambridge, UK) when sampling in the field. The NH4+-N and NO3-N contents in the soil were measured by a multichannel flow analyzer (Foss-FIAstar 5000, Foss Tecator, Denmark) after extracting fresh soil with 2 mol/L of KCl. Organic carbon and gross nitrogen were determined by an elemental analyzer after diluting with hydrochloric acid to remove calcium carbonate (Vario, Elementar, Germany) [13]. Total phosphorus (P) and potassium (K) were determined with the molybdenum antimony colorimetric method and flame photometry. The experiment site was equipped with a weather monitoring system (PC-4, JinZhou, China), which can continuously monitor the temperature of the surface soil.
The gross nitrification rate of the soil was measured by barometric process separation (BaPS, for short) technology with a refrigerated/heated bath circulator (Thermo Scitentific lab., Newington, NH, USA) [14]. The BaPS methodology depends on the main changes in the air (CO2, O2 and other gas) pressure that were due to the microbial processes of nitrification (pressure decrease: NH4+ + 2O2 → NO3 + H2O + 2H+); denitrification (pressure increase: 5CH2O + 4NO3 + 4H+ → 5CO2 + 7H2O + 2NxOy); respiration (pressure neutral: CH2O + O2 → CO2 + H2O, the coefficient of respiration is equal to 0.9); and the nonbiological (physicochemical) process of the CO2 dissolution into the soil solution [15].
The pressure changes in the system include the changes in the O2, CO2 and NxOy over time, as shown in the equation: (Δn/Δt) = (ΔO2/Δt) + (ΔCO2/Δt) + (ΔNxOy/Δt), where Δn is the change in the total number of moles of gas that can be obtained, according to the change in the pressure and the ideal gas formula; ΔO2 is the change in the O2 concentration before and after culture (ΔCO2). The change in the CO2 concentration before and after ΔNxOy is the amount of nitrogen-containing gas that is generated before and after incubation; and Δt is the incubation time. By monitoring the changes in the pressure change per unit of time (i.e., the CO2 and O2 concentrations in the system), the denitrification rate can be obtained from the amount of NxOy produced. The soil respiration rate and the nitrification rate were calculated by the inverse denitrification rate [16].
After collecting 5 intact soil cores from each plot, we weighed them as a group of samples in the lab, placed them in the BaPS incubation chamber, covered with a measuring head (a lid with incorporated sensor fittings), and allowed the soil samples to attain the required temperature through a thermostat with a water bath (set to the field temperature during sampling). After the system was equilibrated for 1 h and it reached temperature stability, we checked the gas tightness of the container with a syringe, and then started the reading with the supplied Windows software. The weight of the fresh soil, the pH and the soil respiration coefficient (RQ) were used to determine the nitrification rate. To overcome the measurement error of the BaPS for alkaline calcareous soil, the RQ was set to 0.9, as described by Conidi et al. [14]. The data collection time was more than 12 h, and the measurement was stopped manually. The weight of the dried soil was obtained later after drying and weighing, and the system automatically recalculated the gross soil nitrification rate (GN).

2.5. Statistical Analysis

All data were collected and saved in WPS office 2016 (Kingsoft, China), and we used SIMCA-P 11.5 (Umetrics, Umea, Sweden) to perform the partial least squares (PLS) regression for the analysis of the gross nitrification. The comparison of the GN means in different seasons was carried out by using SPSS Statistics 21.0. The LSD and Tamhane’s T2 tests were selected for comparing the means of the different seasons. The significance level for the test was p < 0.05.

3. Results

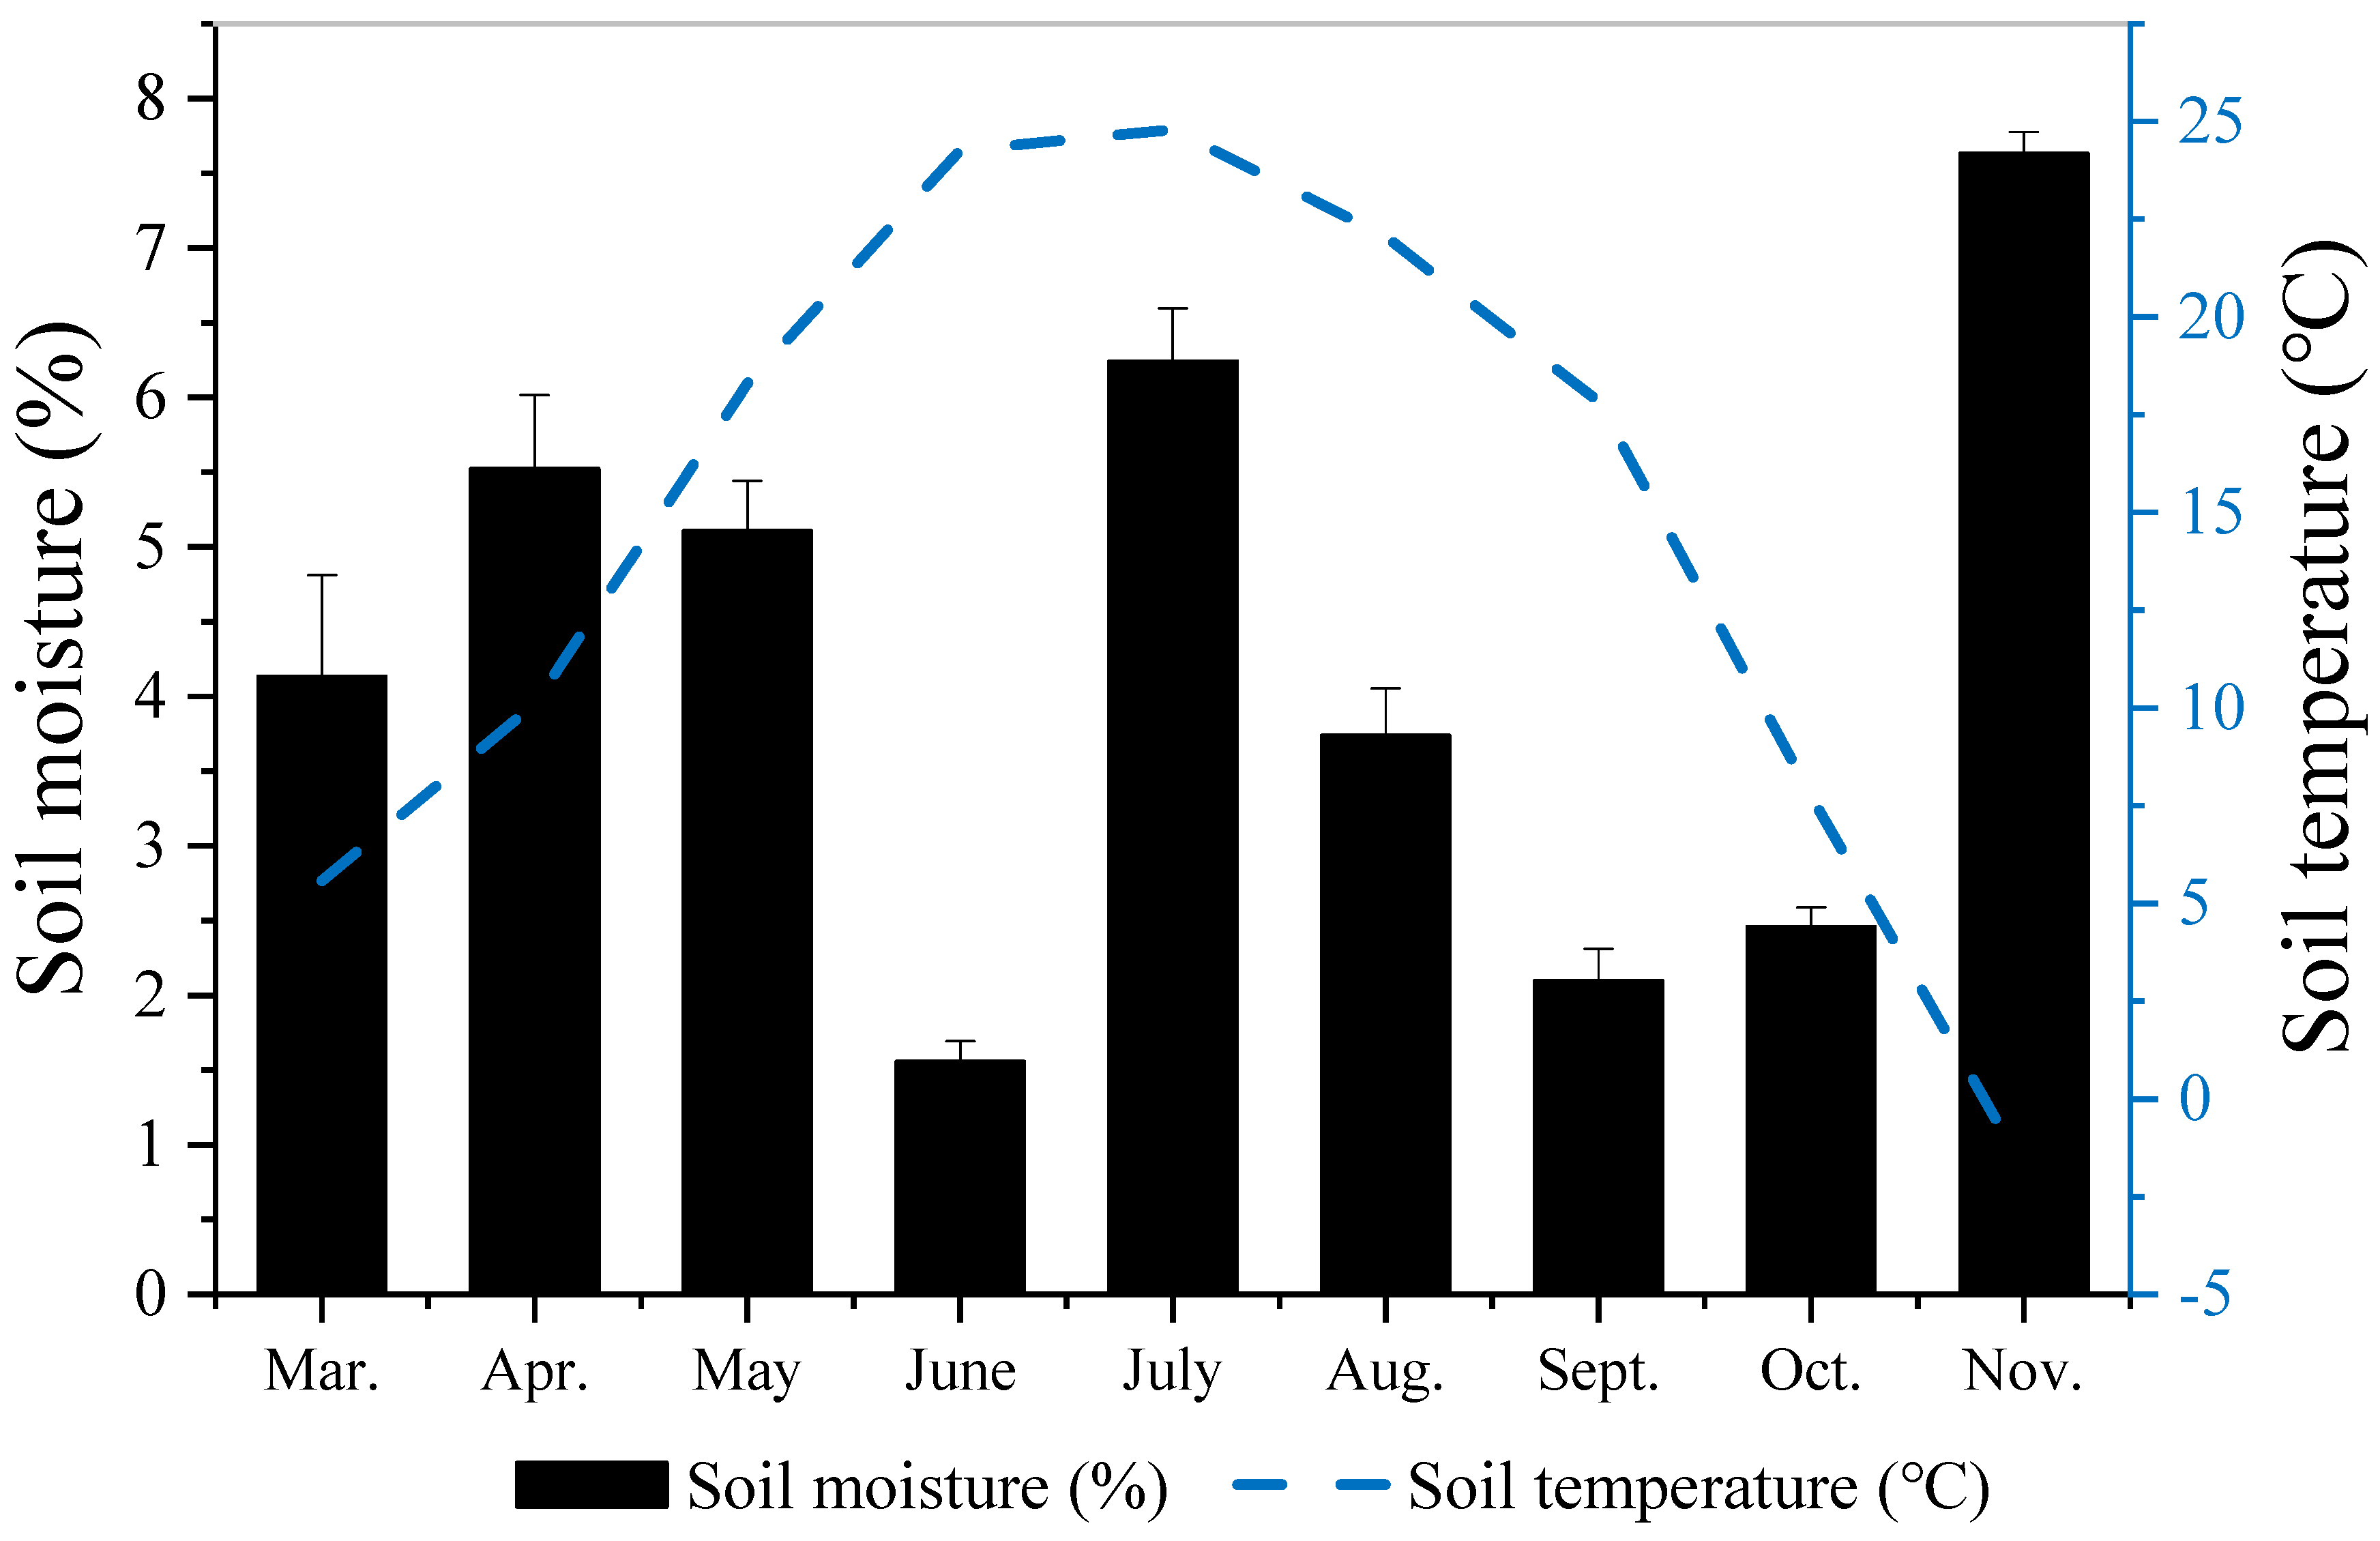
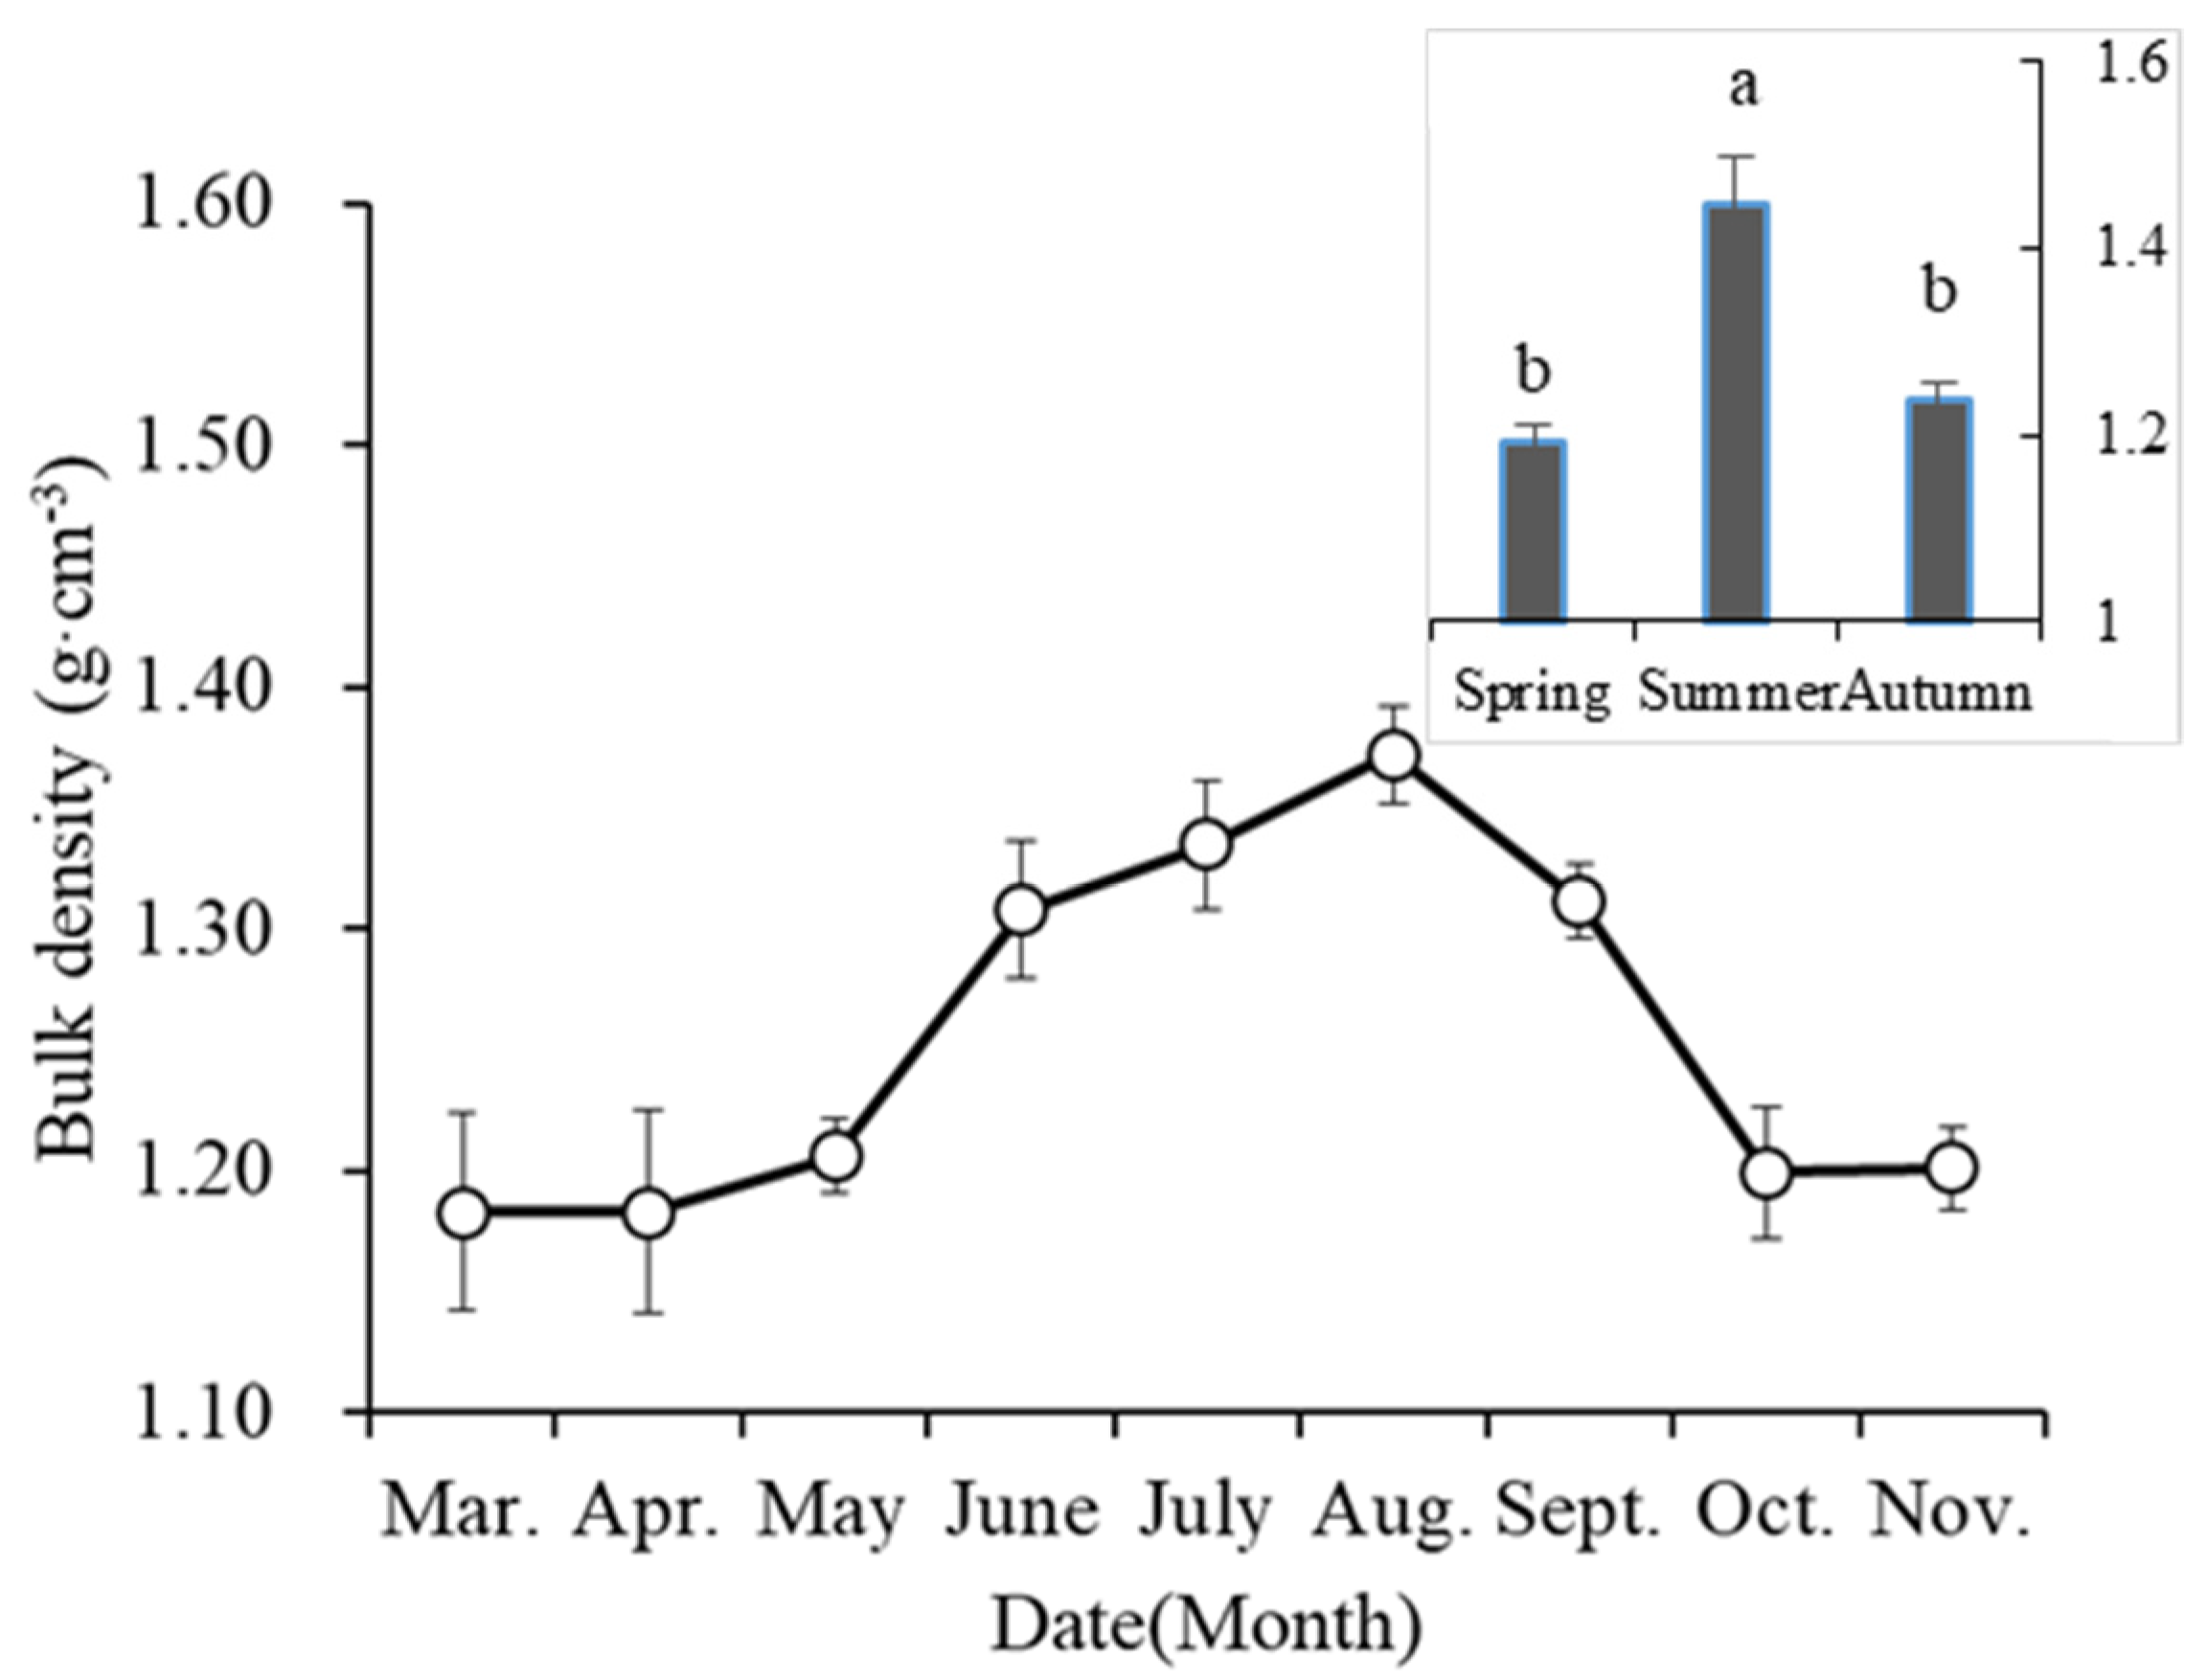
3.1. Temporal Variation of Soil Temperature, Moisture and Bulk Density in the Desert Steppe

During the sampling periods, from March to November, the monthly average temperature of the topsoil ranged between −1.78 and 24.80 °C (Figure 1), which increased from March to a maximum value of 24.80 °C in July, and thereafter gradually decreased, reaching the minimum value in November (−1.78 °C).
The soil bulk density of the desert steppe had obvious seasonal fluctuations (Figure 2). The bulk density was greatest in the summer, and it was significantly greater than in the spring and autumn. The average bulk density was 1.34 ± 0.02 g cm−3 in the summer, 1.24 ± 0.02 g cm−3 in the autumn and 1.19 ± 0.02 g cm3 in the spring.
The soil moisture ranged from 1.56 to 7.63% during the same sampling periods. The soil moisture remained relatively constant between March and May, reached its lowest value of 1.56% in June, rose rapidly in July and decreased in August (Figure 1). In contrast, the soil moisture was relatively low in September, and it rose again in November (Figure 1).

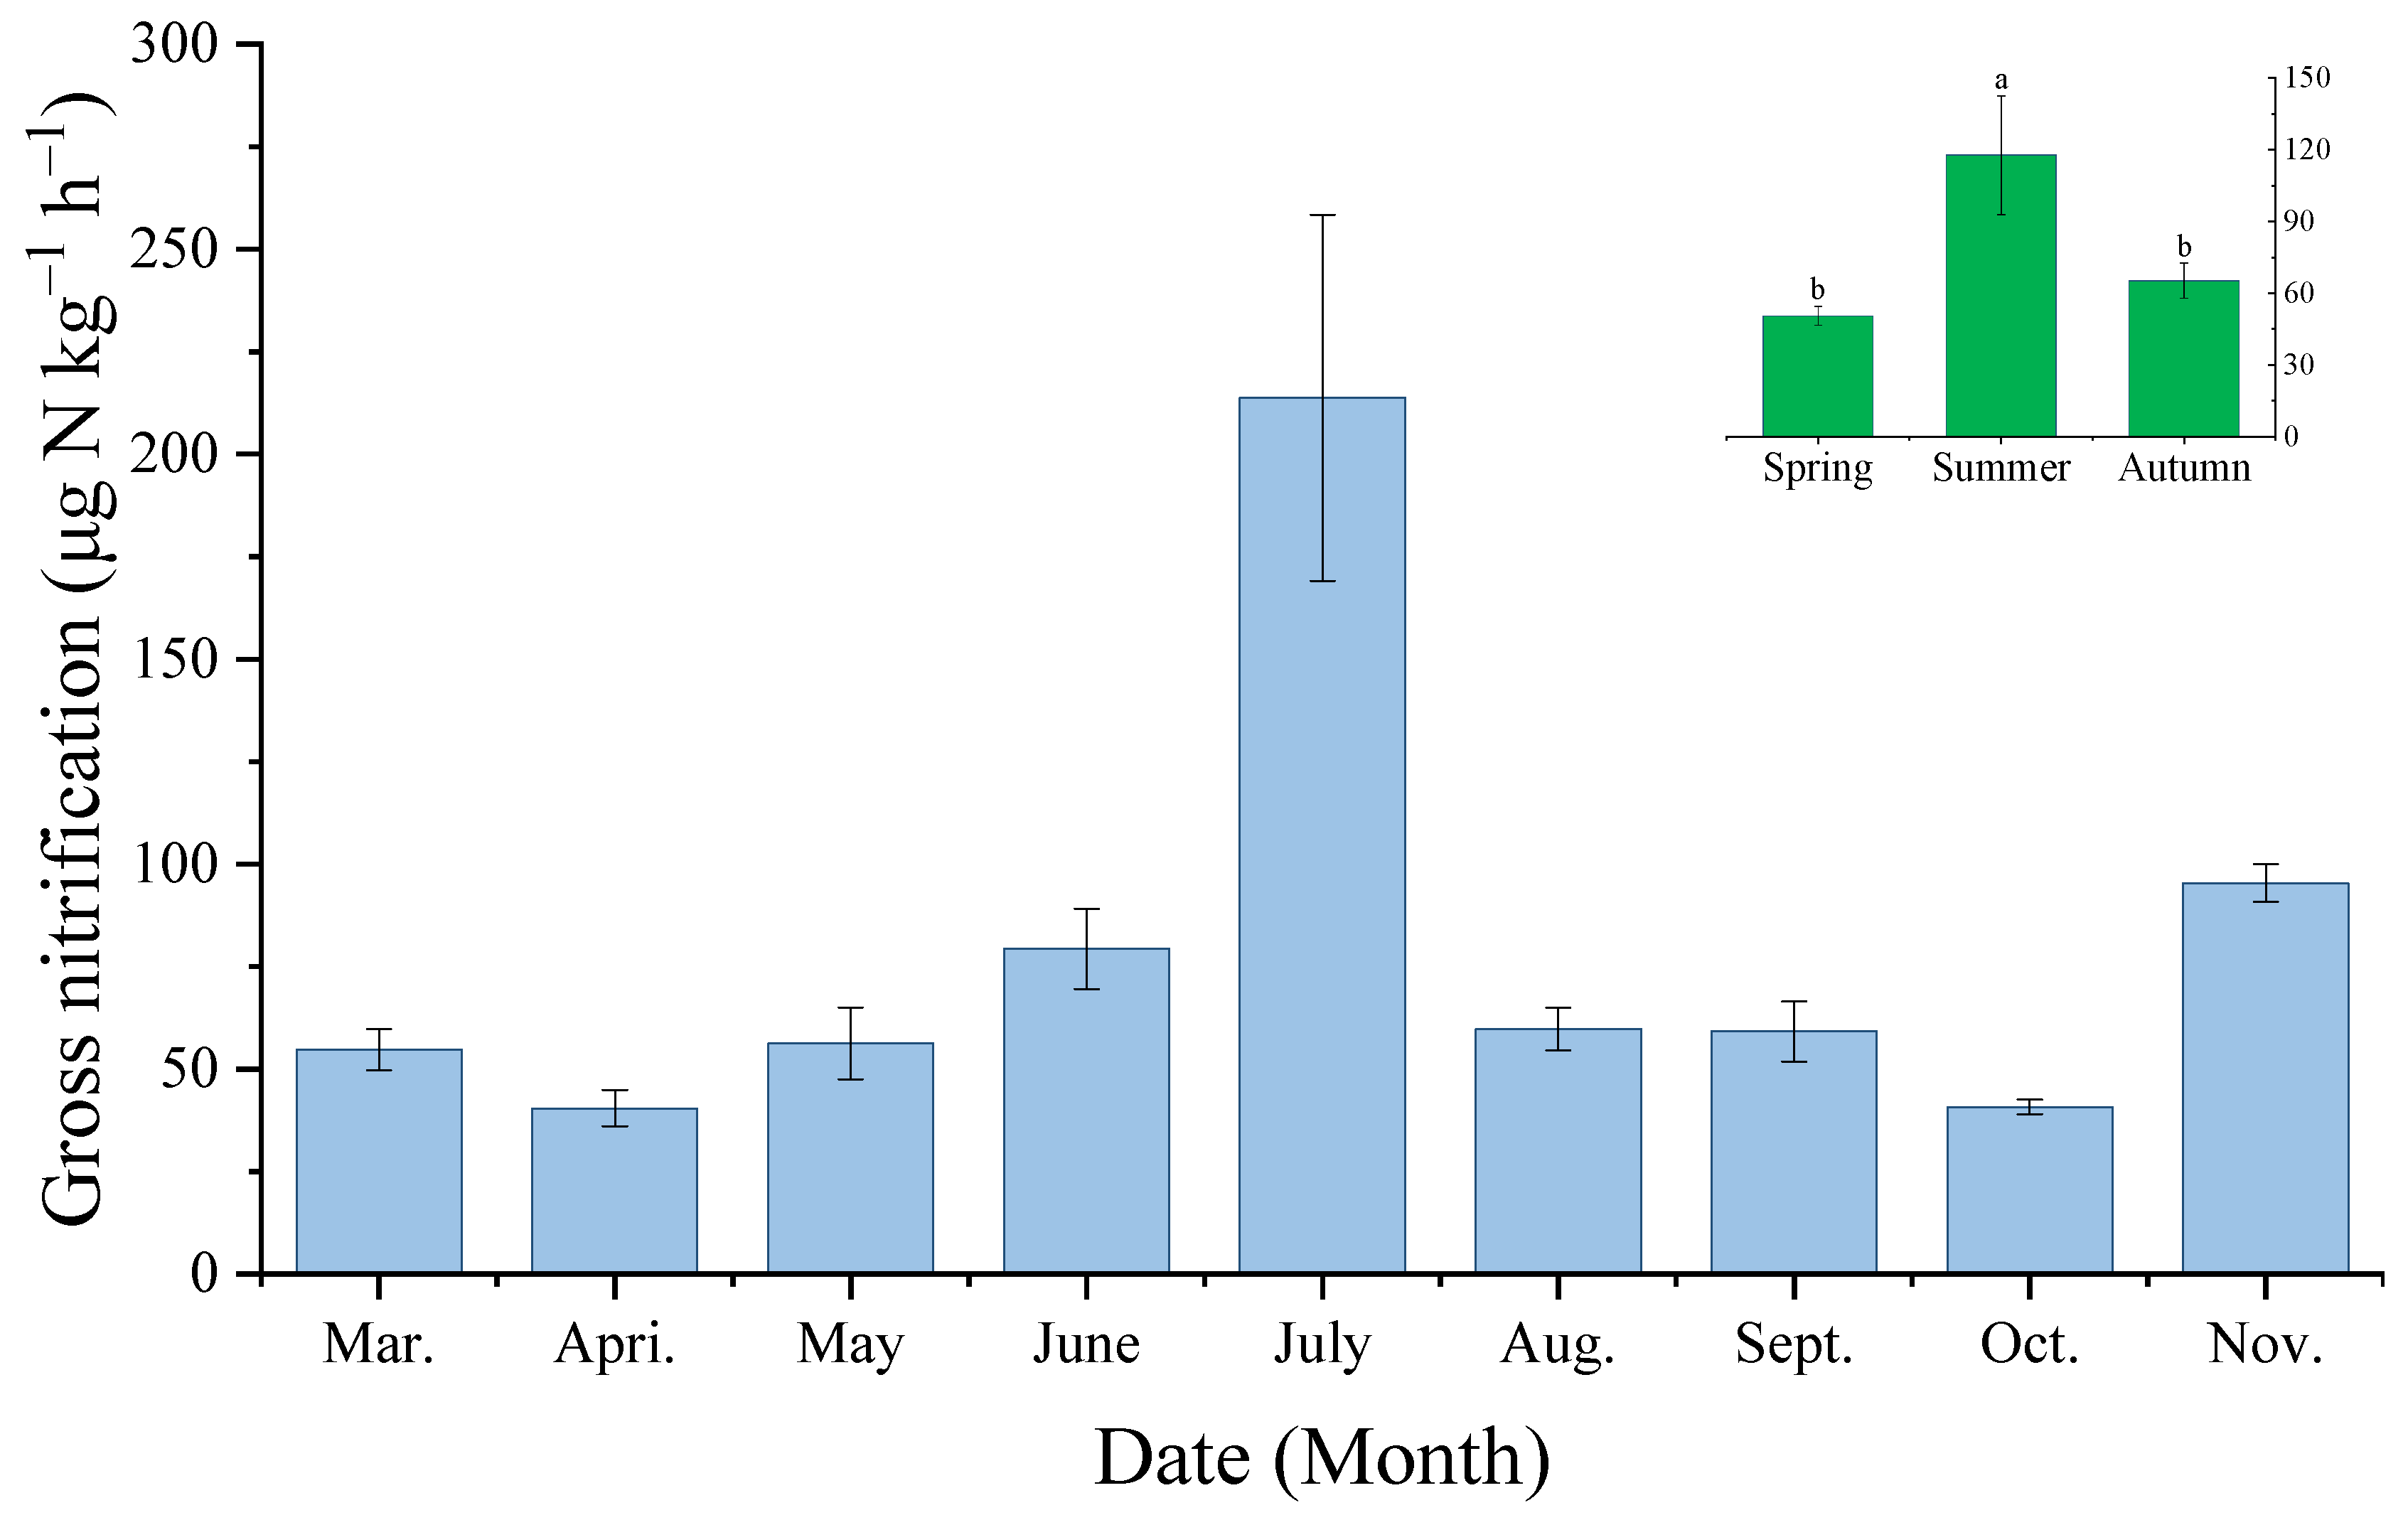
3.2. Seasonal Changes of Gross Nitrification Rate in Desert Steppe Soil

During the sampling periods, between March and November, the gross nitrification rates of the soil ranged from 40.48 ± 4.40 μg N kg−1 h−1 (April) to 213.75 ± 44.66 μg N kg−1 h−1 (July) (Figure 3). The gross nitrification rate gradually increased from March, reached its maximum in July, then dropped sharply and reached its minimum in October (i.e., 40.83 μg N kg−1 h−1), before increasing again in November. The greatest soil nitrification rate was 117.65 ± 24.86 μg N kg−1 h−1 in the summer, which was significantly (p < 0.05) greater than that in the spring and autumn. The GN rate was 50.52 ± 3.95 μg N kg−1 h−1 in the spring, and 65.17 ± 7.33 μg N kg−1 h−1 in the autumn (Figure 3).

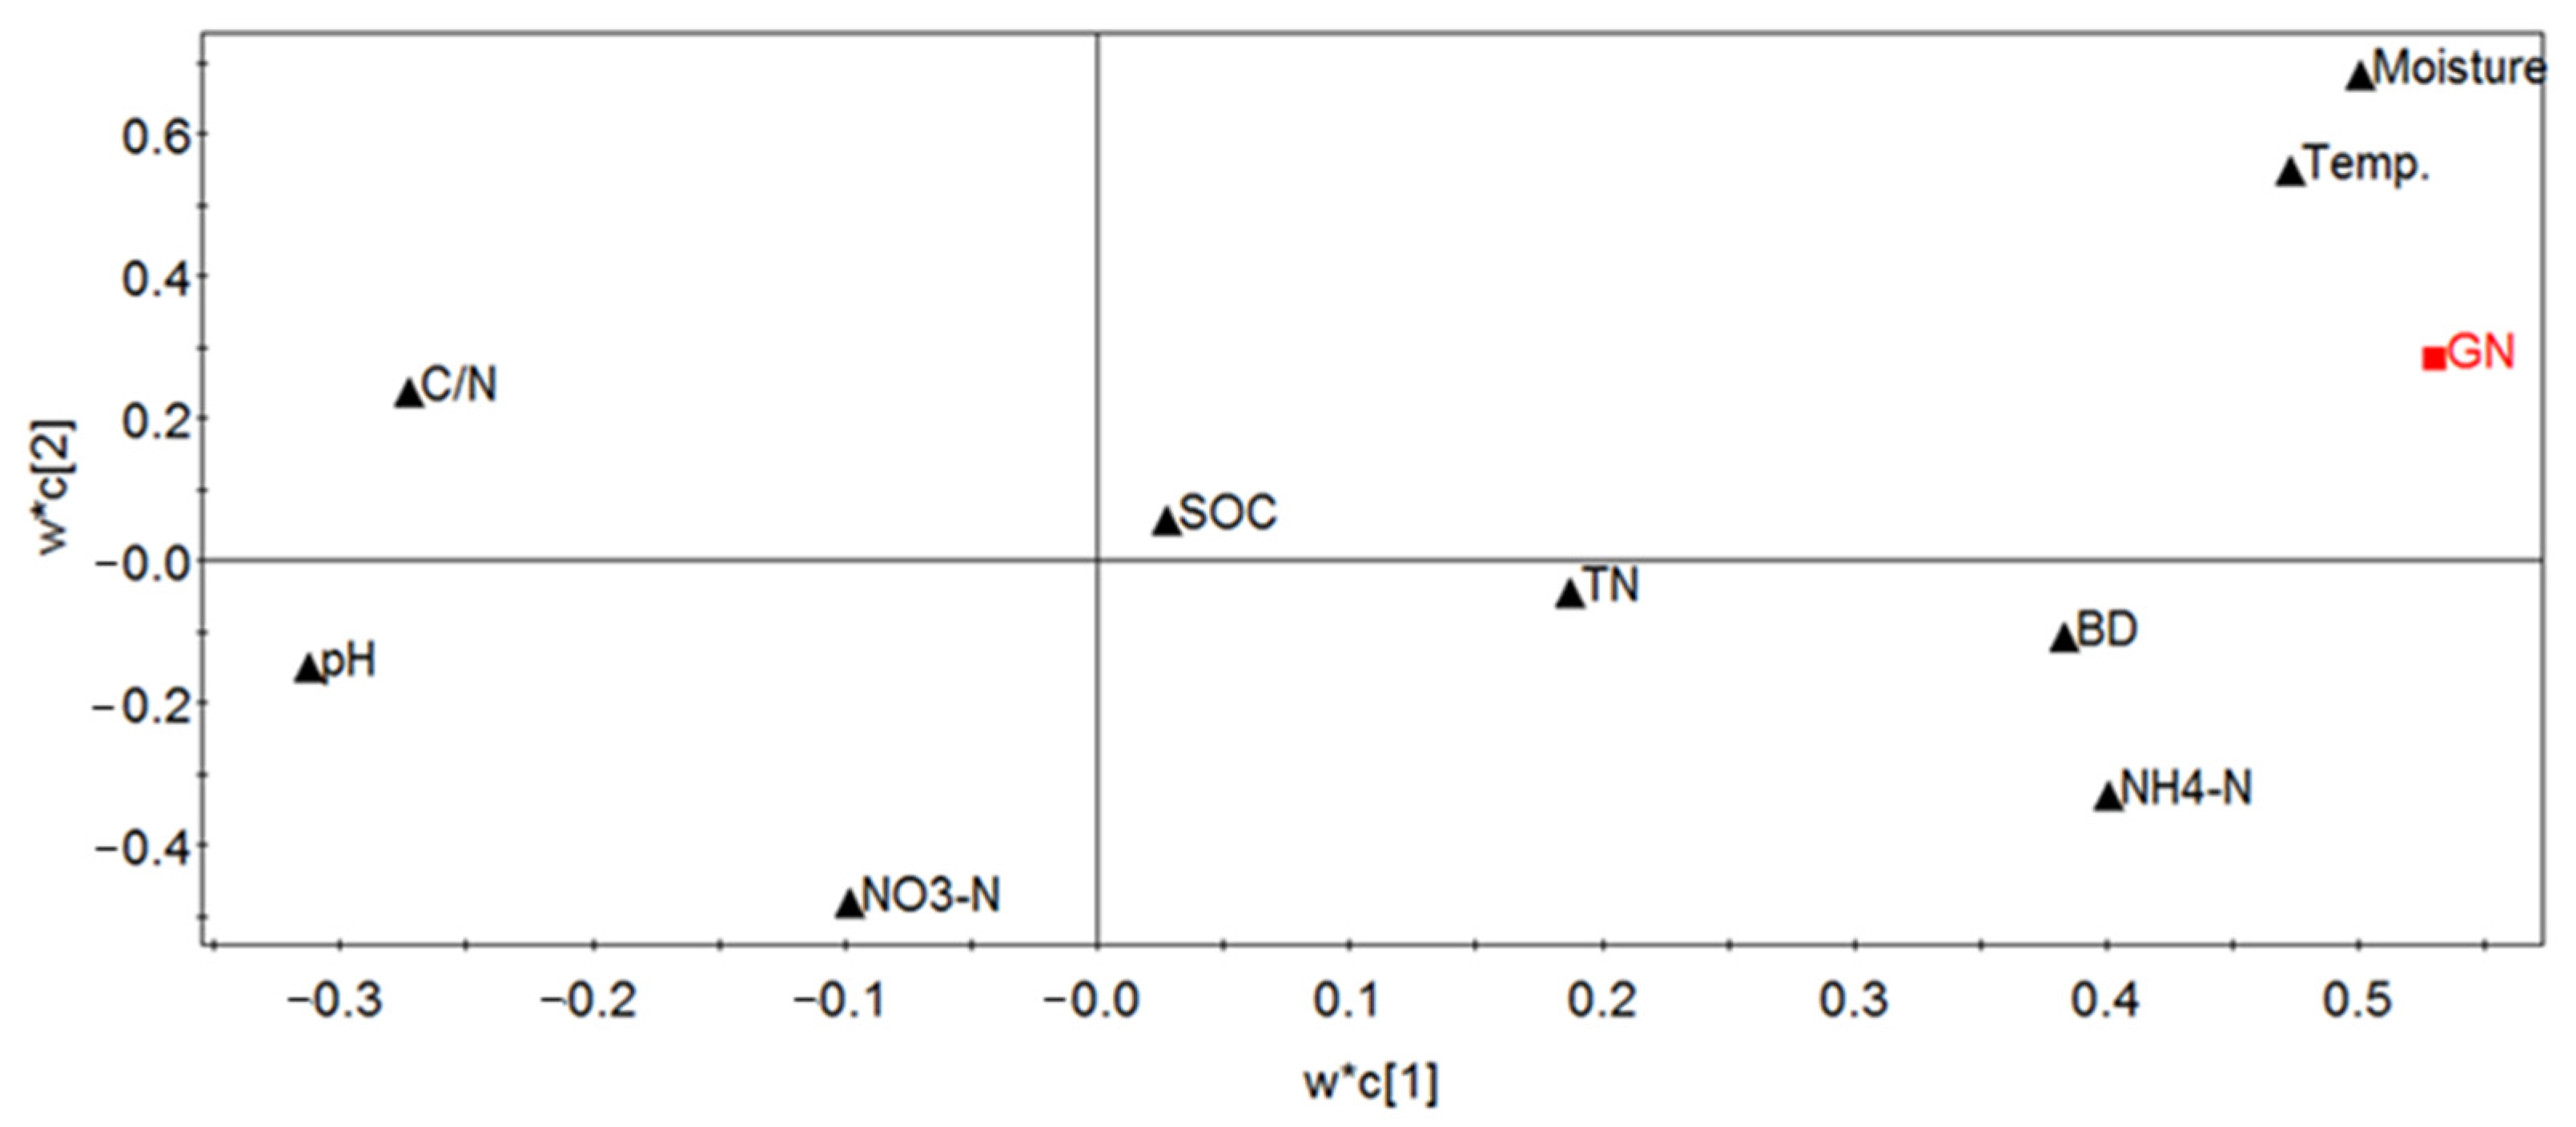
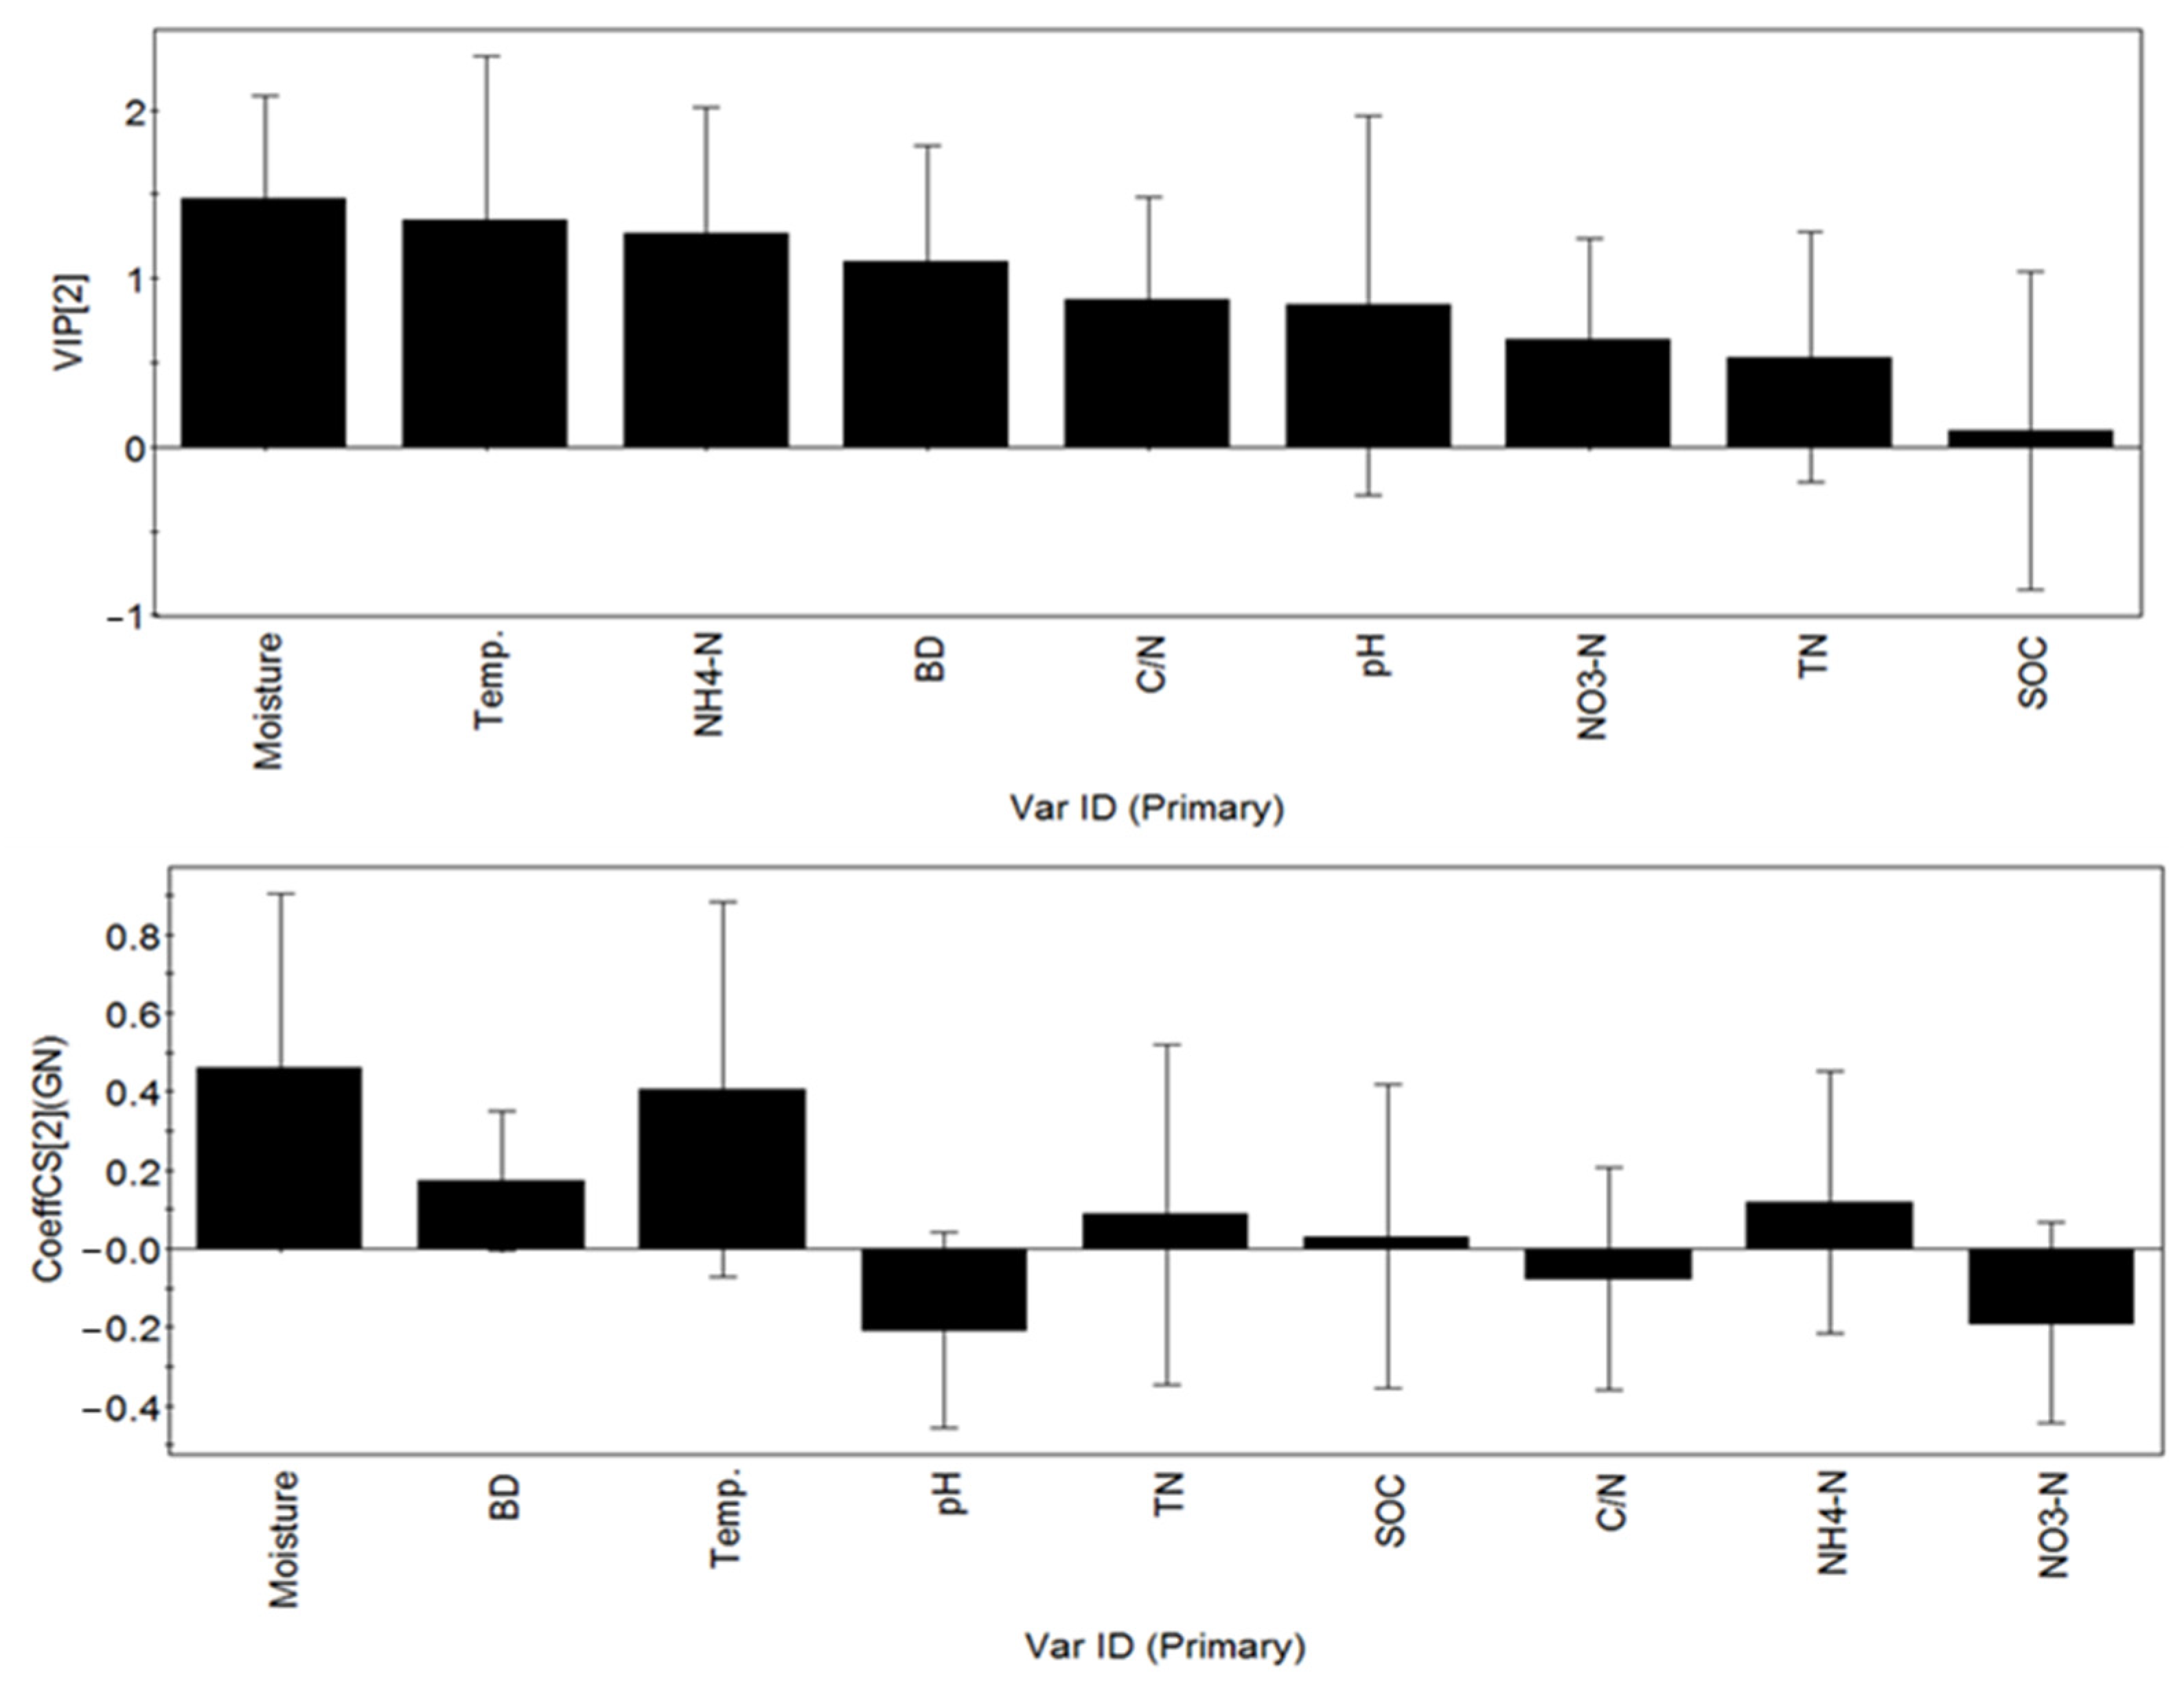
3.3. Partial Least Squares Regression of Factors Affecting the Gross Nitrification Rate of Desert Steppe Soil

Considering the colinear relationship between the independent soil variables, partial least squares regression analysis was used to analyze the data. The results show that the probability of the hypothesis test for the main component (c [1]) was less than 0.05, and the regression model yielded R2 = 0.36 and Q2 = 0.203, which indicate that 36% of the independent variables can explain 20.3% of the GN variation. The loading of different factors showed that the soil GN valve was positively correlated with the moisture, temperature, NH4+-N and bulk density (Figure 4), and that the GN was weakly and negatively correlated with the C/N and pH of the soil. The parameters, the SOC, the TN and the nitrate nitrogen, had little effect on the GN. There were four variables with importance (VIP) greater than 1.0 (i.e., soil moisture, soil temperature, NH4+-N and bulk density (BD)) (Figure 4). The soil moisture was the most important among all the factors, followed by the soil temperature, the NH4+-N and the bulk density (Figure 5).

4. Discussion

4.1. Seasonal Dynamics of Gross Nitrification Rate in Desert Steppe Soil

During the sampling period, the gross nitrification rate of 10–20 cm-depth soil ranged from 40.48 ± 4.40 μg·kg−1·h −1 (April) to 213.75 ± 44.66 μg·kg−1·h−1 (July) in this study (Figure 3). The nitrification rate of German old grassland (Fluvic Gleysol) was 160–220 μg·kg−1·h−1, which was determined by 15N labelling [17]. The measured value of chernozem soil (pH = 7.4) in the farmland of northern China was 0.25–1 mg N ·kg−1·d−1 (equal to 10.42–41.67 μg·kg−1·h−1) [18], and Master et al. [19] measured the gross nitrification rate of alpine meadow soil (pH = 6) at 1.81–19.36 mg N·kg−1·d−1 (equal to 75.42–806.67 μg·kg−1·h−1). Therefore, our result of the gross nitrification rate is within the range that is reported in the literature.
Han et al. [20] found that the net nitrification rate of desert steppe ranged from −0.37 mg N·kg−1·d−1 (July) to 0.56 mg N·kg−1·d−1 (September) (equal to −15.42–24.33 μg∙kg−1∙h−1). The maximum gross nitrification rate in this study was 213.75 (Figure 3), which is nine times higher than the maximum net nitrification rate, while the net nitrification rate in the same period was negative. This result indicates that the actual production of nitrate in the same period was very high, despite the low net nitrification rate. This also shows that the turnover of the nitrate in the soil disappeared very quickly in July, and that the amount that disappeared exceeded the amount that was produced, thus leading to a negative net nitrification rate. Xu et al. [21] found that the net nitrification rate of temperate steppe soil in Inner Mongolia was also low in July and August. In addition, because of the high rainfall in this area in July, nitrate migration, leaching and root absorption caused substantial nitrate loss, which may also be the reason for the low net nitrification rate in July.

4.2. Influencing Factors of Gross Nitrification Rate in Desert Steppe Soil

In this study, the GN value was positively correlated with the soil moisture, the temperature, the NH4+-N and the bulk density. The soil moisture was the key factor among all the involved factors, followed by the soil temperature, the NH4+-N content, the bulk density and the C/N (Figure 5).
Soil nitrification rates are known to increase with the soil water content, and then to progressively decrease as the soil becomes saturated. The rate of the soil nitrification is high under moderate soil water content, while it will be reduced by higher and lower water contents. The GN rate was optimum at 65% of the water-filled pore space [22]. Mathieu et al. [23] report that, in unsaturated soil, the nitrification would be in a water-limited condition and that it would increase with the water content, while, in saturated soil, the nitrification would decrease with an increasing soil water content because of the poor aeration conditions. The temperate desert steppe for this study is drought, and the lack of rain is compared with a typical steppe, with an average annual precipitation of about 285 mm. The rainfall in the summer accounts for more than 60% of the total annual precipitation. The maximum water-filled pore space was 15.42% during the sampling period in this study. Therefore, the soil is frequently exposed to a water-deficit regime.
In this study, the soil temperature also had a positive effect on the GN rate in the temperate desert steppe (Figure 5). This effect may be caused by the activity of microbes, which are related to nitrification, including ammonia-oxidizing archaea (AOA) and ammonia-oxidizing bacteria (AOB). The activity of the AOA in the soil was the highest at 35 to 40 °C, while the activity of the AOB was the highest at 25 to 31 °C [24,25,26]. In addition, different geographic zones have different temperature regimes, which also have an impact on microorganisms. The optimal temperature for the growth of soil microorganisms has also been adjusted after the long-term adaptation of the local climate [27]. In our study, the nitrification rate of the soil generally increased with the mean temperature per year [28].
In this study, the GN rate was positively correlated with the NH4+–N content of the desert steppe soil (Figure 5). It is well known that ammonium is the basic substrate of the nitrification in soil. Beule et al. [29] report that the content of ammonium in soil was the main factor affecting the abundance of related genes: AOA–amoA and AOB–amoA, which were used to indicate the abundances of the AOA and AOB, respectively. Pan [30] found that the ammonia oxidation in lightly grazed soils was dominated by AOA, and that the ammonia oxidation in heavily grazed soils was dominated by AOB in typical steppes. Therefore, AOA and AOB should coexist in the desert steppe.
In this study, the GN rate was positively correlated with the soil bulk density content (Figure 5). In spring and autumn, there is an alternating freeze–thaw phenomenon. The freezing of the soil water increases its volume and reduces its bulk density. The bulk density is positively correlated with the moisture, the temperature and the ammonium content. The bulk density is higher in summer, when the temperature is high, and rainfall is abundant. Mora and Lázaro [31] also found that the soil bulk density in a semiarid zone was significantly greater in summer than in winter, and that its value was influenced by the rainfall in the first week before sampling. A study of alfalfa grassland and permanent cropland also found that the soil bulk density in the summer was significantly greater than in other seasons [32]. Ammonium mainly comes from the mineralization of organic nitrogen, which is beneficial to mineralization in summer. The difference in the soil bulk density may affect the soil moisture and aeration, as well as the mineralization.
In this study, the GN and the C/N showed a negative correlation (Figure 5). Research on forest soils found that the GN rate had a negative correlation with the C/N. Soil with a low C/N has a much higher nitrogen content than organic carbon content, and a higher nitrification rate is correlated with a higher nitrogen content in grasslands [12].
In this study, the GN value was negatively correlated with the soil pH (Figure 5), and the soil pH ranged from 7.61 to 8.17 (means = 7.76 ± 0.02, Table 1). Ying et al. [33] found that, with decreasing soil pH, the AOB abundance decreased, while the AOA abundance mostly increased. Pan [28] found that the ammonia oxidation in lightly grazed soils was dominated by AOA; the soil in this study belongs to lightly grazed soils.
In this study, the SOC, the total N and the nitrate content had little effect on the GN (Figure 5). This may be because these soil characteristics showed relatively little variation in our study site. In natural conditions, the soil organic carbon and the total nitrogen contents generally change little, and it will take decades to have significant changes [34].

5. Conclusions

Our results demonstrate that: (1) The GN rate of 10–15 cm soil in the desert steppe ranged from 40.48 ± 4.40 to 213.75 ± 44.66 μg N·kg−1·h−1. The GN rate had obvious seasonal variation and was greater in the summer than in the spring and autumn. This implies that, for the management of the soil nitrogen in desert steppe grassland, we should focus on implementing the relevant measures in the summer in order to reduce the nitrogen fertilizer losses and greenhouse gas emissions. The GN rate was much higher than the net nitrification rate, and it showed a different pattern of seasonal variation from the net nitrification rate. The soil GN rate can better reflect the actual conversion situation than the net nitrification rate; (2) The soil moisture, the temperature, the bulk density and the NH4+-N content were the main influencing factors on the gross nitrification rate of desert steppe soil. Thus, the soil moisture plays an important role in the nitrification of desert steppe soil. These results suggest that we should pay attention to the significant interaction between the soil water content and the nitrogen use in the sustainable management of the desert steppe in the future.

Author Contributions

C.W. and Z.W. conceived of and designed the experiments; X.Q., N.G. and J.H. performed the experiments; X.Q. and Z.W. analyzed the data; X.Q. and Z.W. wrote the paper; C.W. revised the manuscript. All authors have read and agreed to the published version of the manuscript.

Funding

This research was funded by the Program of Science and Technology of Inner Mongolia (2021ZY0020; 2019GG245), the Project for the Revitalization of Inner Mongolia through Science and Technology (2021CG0020), which is an open project of the Yinshanbeilu Grassland Eco-Hydrology National Observation and Research Station and the China Institute of Water Resources and Hydropower Research.

Institutional Review Board Statement

Not applicable.

Informed Consent Statement

Not applicable.

Data Availability Statement

Not applicable.

Acknowledgments

This research was mainly assisted by the Innovation Research Team of the Ministry of Education, China (IRT17R59), and the team of the National Forestry and Grassland Science and Technology Innovation Talent Plan, China.

Conflicts of Interest

The authors declare no conflict of interest.

References

  1. Yahdjian, L.; Gherardi, L.; Sala, O.E. Nitrogen limitation in arid-subhumid ecosystems: A meta-analysis of fertilization studies. J. Arid Environ. 2011, 75, 675–680. [Google Scholar] [CrossRef]
  2. Beeckman, F.; Motte, H.; Beeckman, T. Nitrification in agricultural soils: Impact, actors and mitigation. Curr. Opin. Biotechnol. 2018, 50, 166–173. [Google Scholar] [CrossRef] [PubMed]
  3. Barnard, R.; Leadley, P.W.; Hungate, B.A. Global change, nitrification, and denitrification: A review. Glob. Biogeochem. Cycles 2005, 19, 1–13. [Google Scholar] [CrossRef]
  4. Zaman, M.; Chang, S.X. Substrate type, temperature, and moisture content affect gross and net N mineralization and nitrification rates in agroforestry systems. Biol. Fertil. Soils 2004, 39, 269–279. [Google Scholar] [CrossRef]
  5. Xu, W.; Cai, Y.P.; Yang, Z.F.; Yin, X.A.; Tan, Q. Microbial nitrification, denitrification and respiration in the leached cinnamon soil of the upper basin of Miyun Reservoir. Sci. Rep. 2017, 7, 42032. [Google Scholar] [CrossRef]
  6. Fu, W.; Wang, X.; Wei, X. No response of soil N mineralization to experimental warming in a northern middle-high latitude agro-ecosystem. Sci. Total Environ. 2019, 659, 240–248. [Google Scholar] [CrossRef]
  7. Liu, Y.; He, N.; Wen, X.; Xu, L.; Sun, X.; Yu, G.; Liang, L.; Schipper, L.A. The optimum temperature of soil microbial respiration: Patterns and controls. Soil Biol. Biochem. 2018, 121, 35–42. [Google Scholar] [CrossRef]
  8. Di, H.J.; Cameron, K.C.; McLaren, R.G. Isotopic dilution methods to determine the gross transformation rates of nitrogen, phosphorus, and sulfur in soil: A review of the theory, methodologies, and limitations. Aust. J. Soil Res. 2000, 38, 213–230. [Google Scholar] [CrossRef]
  9. Liang, Y.; Gao, Y.; Wang, R.; Yang, X. Fungal community characteristics and driving factors during the decaying process of Salix psammophila sand barriers in the desert. PLoS ONE 2021, 16, e0258159. [Google Scholar] [CrossRef]
  10. Dijkstra, F.A.; Carrillo, Y.; Blumenthal, D.M.; Mueller, K.E.; LeCain, D.R.; Morgan, J.A.; Zelikova, T.J.; Williams, D.G.; Follett, R.F.; Pendall, E. Elevated CO2 and water addition enhance nitrogen turnover in grassland plants with implications for temporal stability. Ecol. Lett. 2018, 21, 674–682. [Google Scholar] [CrossRef]
  11. Knapp, A.K.; Ciais, P.; Smith, M.D. Reconciling inconsistencies in precipitation–productivity relationships: Implications for climate change. New Phytol. 2017, 214, 41–47. [Google Scholar] [CrossRef] [PubMed] [Green Version]
  12. Wang, C.; Wang, N.; Zhu, J.; Liu, Y.; Xu, X.; Niu, S.; Yu, G.; Han, X.; He, N. Soil gross N ammonification and nitrification from tropical to temperate forests in eastern China. Funct. Ecol. 2018, 32, 83–94. [Google Scholar] [CrossRef] [Green Version]
  13. Liu, Y.; Sun, Q.; Li, J.; Lian, B. Bacterial diversity among the fruit bodies of ectomycorrhizal and saprophytic fungi and their corresponding hyphosphere soils. Sci. Rep. 2018, 8, 11672. [Google Scholar] [CrossRef] [PubMed] [Green Version]
  14. Conidi, C.; Macedonio, F.; Ali, A.; Cassano, A.; Criscuoli, A.; Argurio, P.; Drioli, E. Treatment of flue gas desulfurization wastewater by an integrated membrane-based process for approaching zero liquid discharge. Membranes 2018, 8, 117. [Google Scholar] [CrossRef] [Green Version]
  15. Ingwersen, J.; Butterbach-Bahl, K.; Gasche, R.; Richter, O.; Papen, H. Barometric Process Separation: New Method for Quantifying Nitrification, Denitrification, and Nitrous Oxide Sources in Soils. Soil Sci. Soc. Am. J. 1999, 63, 117–128. [Google Scholar] [CrossRef]
  16. Lu, X.; Yan, Y.; Fan, J.; Wang, X. Gross nitrification and denitrification in alpine grassland ecosystems on the tibetan plateau. Arctic, Antarct. Alp. Res. 2012, 44, 188–196. [Google Scholar] [CrossRef]
  17. Müller, C.; Abbasi, M.K.; Kammann, C.; Clough, T.J.; Sherlock, R.R.; Stevens, R.J.; Jäger, H.-J. Soil Respiratory Quotient Determined via Barometric Process Separation Combined with Nitrogen-15 Labeling. Soil Sci. Soc. Am. J. 2004, 68, 1610–1615. [Google Scholar] [CrossRef] [Green Version]
  18. Stange, C.F.; Neue, H.U. Measuring and modelling seasonal variation of gross nitrification rates in response to long-term fertilisation. Biogeosciences 2009, 6, 2181–2192. [Google Scholar] [CrossRef] [Green Version]
  19. Master, Y.; Laughlin, R.J.; Stevens, R.J.; Shaviv, A. Nitrite Formation and Nitrous Oxide Emissions as Affected by Reclaimed Effluent Application. J. Environ. Qual. 2004, 33, 852. [Google Scholar] [CrossRef]
  20. Han, M.Q.; Pan, Z.L.; Jin, Y.X.; Qin, J.; Li, J.W.; Wang, Z.W.; Han, G. Response of soil nitrogen mineralization to different stocking rates on the Stipa breviflora desert steppe. Acta Prataculturae Sin. 2017, 26, 27–35. [Google Scholar]
  21. Xu, L.; Xu, X.; Tang, X.; Xin, X.; Ye, L.; Yang, G.; Tang, H.; Lv, S.; Xu, D.; Zhang, Z. Managed grassland alters soil N dynamics and N2O emissions in temperate steppe. J. Environ. Sci. 2018, 66, 20–30. [Google Scholar] [CrossRef] [PubMed]
  22. Kiese, R.; Hewett, B.; Butterbach-Bahl, K. Seasonal dynamic of gross nitrification and N2O emission at two tropical rainforest sites in Queensland, Australia. Plant Soil 2008, 309, 105–117. [Google Scholar] [CrossRef]
  23. Mathieu, O.; Hénault, C.; Lévêque, J.; Baujard, E.; Milloux, M.J.; Andreux, F. Quantifying the contribution of nitrification and denitrification to the nitrous oxide flux using 15N tracers. Environ. Pollut. 2006, 144, 933–940. [Google Scholar] [CrossRef] [PubMed]
  24. Ouyang, Y.; Norton, J.M.; Stark, J.M. Ammonium availability and temperature control contributions of ammonia oxidizing bacteria and archaea to nitrification in an agricultural soil. Soil Biol. Biochem. 2017, 113, 161–172. [Google Scholar] [CrossRef]
  25. Taylor, A.E.; Giguere, A.T.; Zoebelein, C.M.; Myrold, D.D.; Bottomley, P.J. Modeling of soil nitrification responses to temperature reveals thermodynamic differences between ammonia-oxidizing activity of archaea and bacteria. ISME J. 2017, 11, 896–908. [Google Scholar] [CrossRef] [PubMed]
  26. Duan, P.; Wu, Z.; Zhang, Q.; Fan, C.; Xiong, Z. Thermodynamic responses of ammonia-oxidizing archaea and bacteria explain N2O production from greenhouse vegetable soils. Soil Biol. Biochem. 2018, 120, 37–47. [Google Scholar] [CrossRef]
  27. Liu, R.; Suter, H.; He, J.; Hayden, H.; Chen, D. Influence of temperature and moisture on the relative contributions of heterotrophic and autotrophic nitrification to gross nitrification in an acid cropping soil. J. Soils Sediments 2015, 15, 2304–2309. [Google Scholar] [CrossRef]
  28. Li, Z.; Zeng, Z.; Tian, D.; Wang, J.; Fu, Z.; Zhang, F.; Zhang, R.; Chen, W.; Luo, Y.; Niu, S. Global Patterns and Controlling Factors of Soil Nitrification Rate; Wiley: Hoboken, NJ, USA, 2020; Volume 26, ISBN 0000000223942. [Google Scholar]
  29. Beule, L.; Corre, M.D.; Schmidt, M.; Göbel, L.; Veldkamp, E.; Karlovsky, P. Conversion of monoculture cropland and open grassland to agroforestry alters the abundance of soil bacteria, fungi and soil-N-cycling genes. PLoS ONE 2019, 14, e0218779. [Google Scholar] [CrossRef]
  30. Pan, H. Study on the Microbial Driving Mechanism of Nitrogen Transformation in Inner Mongolia Typical Steppe. Ph.D. Thesis, Zhejiang University, Hangzhou, China, 2018. [Google Scholar]
  31. Mora, J.L.; Lázaro, R. Seasonal changes in bulk density under semiarid patchy vegetation: The soil beats. Geoderma 2014, 235–236, 30–38. [Google Scholar] [CrossRef]
  32. Omer, M.; Idowu, O.J.; Ulery, A.L.; VanLeeuwen, D.; Guldan, S.J. Seasonal changes of soil quality indicators in selected arid cropping systems. Agriculture 2018, 8, 124. [Google Scholar] [CrossRef] [Green Version]
  33. Ying, J.; Li, X.; Wang, N.; Lan, Z.; He, J.; Bai, Y. Contrasting effects of nitrogen forms and soil pH on ammonia oxidizing microorganisms and their responses to long-term nitrogen fertilization in a typical steppe ecosystem. Soil Biol. Biochem. 2017, 107, 10–18. [Google Scholar] [CrossRef]
  34. Ou, Y.; Rousseau, A.N.; Wang, L.; Yan, B. Spatio-temporal patterns of soil organic carbon and pH in relation to environmental factors—A case study of the Black Soil Region of Northeastern China. Agric. Ecosyst. Environ. 2017, 245, 22–31. [Google Scholar] [CrossRef]
Figure 1. Monthly changes of surface soil temperature and moisture in the experimental site.
Sustainability 14 04787 g001
Figure 2. Seasonal variation of soil bulk density in the experiment site. Data are means ± se (n = 5). The same letters on the column indicate there is no significant difference between the treatments.
Sustainability 14 04787 g002
Figure 3. Temporal variation of soil gross nitrification for the experiment site (the same letters on the column indicate there is no significant difference between the treatments).
Sustainability 14 04787 g003
Figure 4. The score scatter plot of the factors influencing the soil gross nitrification rate. W*c[1]/c[2]: weight of first or second components; Temp: temperature of the donated soil; SOC: soil organic carbon; TN: gross nitrogen; BD: bulk density; NH4+-N: ammonium form of nitrogen; NO3-N: nitrate form of nitrogen; GN is gross nitrification; C/N is the ratio of the total carbon content to the total nitrogen content.
Sustainability 14 04787 g004
Figure 5. The importance rankings and standardized regression coefficient diagram of the factors influencing the soil gross nitrification rate. VIP: variable importance; CoeffCS: coefficients; Temp: temperature of the donated soil; SOC: soil organic carbon; TN: gross nitrogen; BD: bulk density; NH4+-N: ammonium form of nitrogen; NO3-N: nitrate form of nitrogen; C/N is the ratio of the total carbon content to the total nitrogen content.
Sustainability 14 04787 g005
Table 1. Main chemical properties of soil in the study site.
SoilSoil Organic CTotal NTotal PTotal K
pH(g kg−1)(g kg−1)(g kg−1)(g kg−1)
7.76 ± 0.0214.98 ± 0.201.71 ± 0.030.39 ± 0.0717.23 ± 1.19
Publisher’s Note: MDPI stays neutral with regard to jurisdictional claims in published maps and institutional affiliations.

