
Environmental Impact Assessment of an Ignition Pencil Coil by a Combination of Carbon Footprint and Environmental Priority Strategies Methodology


Abstract
:1. Introduction
2. Methodology and Materials
2.1. Life Cycle Assessment
2.2. EPS 2000
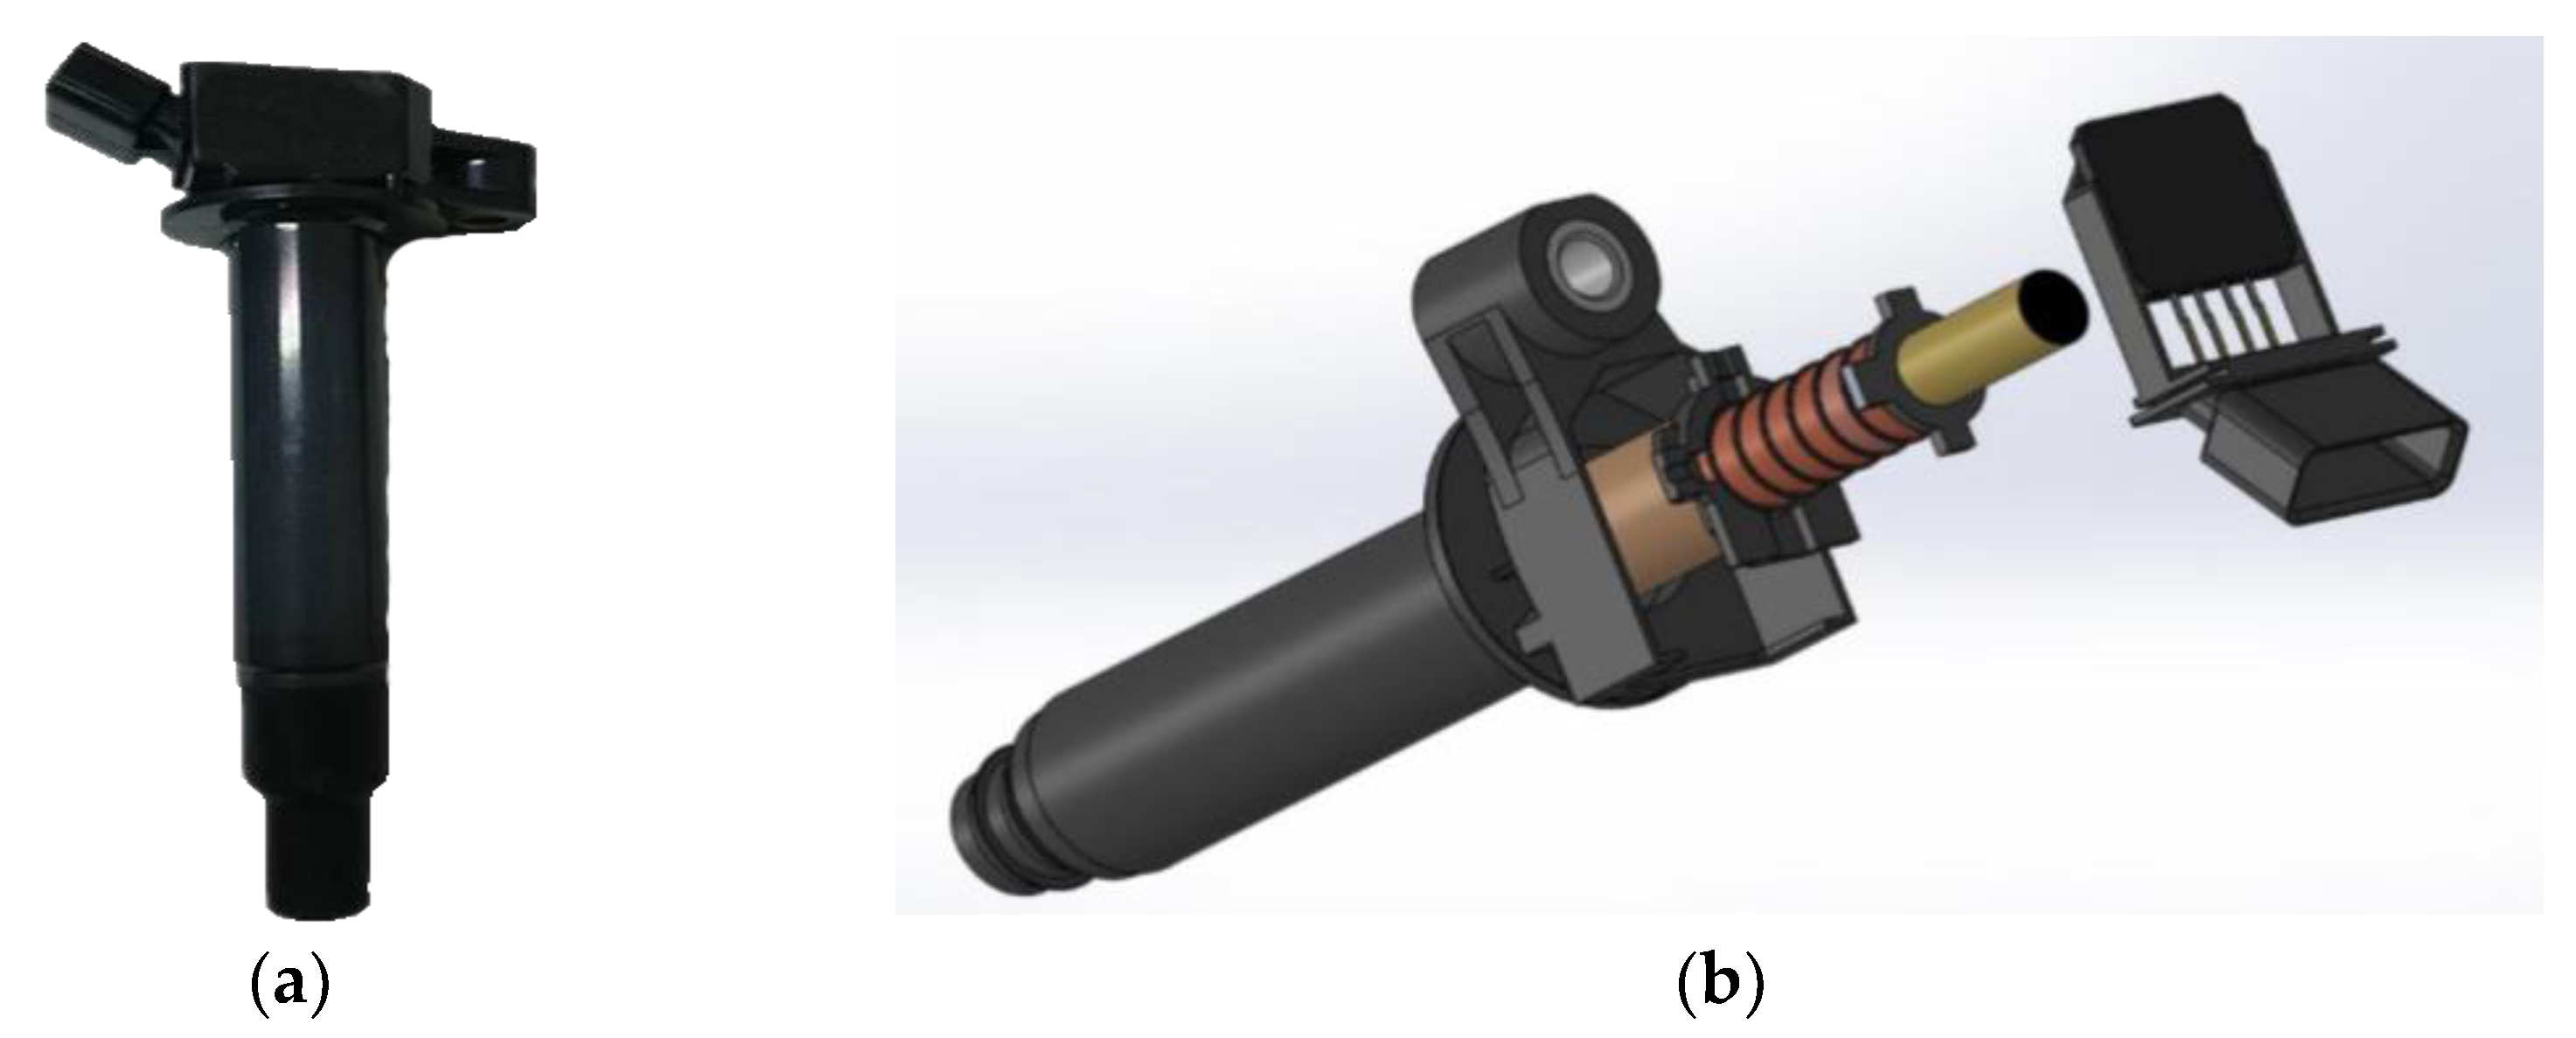
2.3. AS-507 Ignition Coil
2.4. System Boundaries and Material Composition
3. Results and Discussion
3.1. Carbon Footprint
3.2. Environment DAMAGE Assessment
4. Conclusions
Author Contributions
Funding
Institutional Review Board Statement
Informed Consent Statement
Data Availability Statement
Acknowledgments
Conflicts of Interest
References
- Matthews, H.S.; Hendrickson, C.T.; Weber, C.L. The Importance of Carbon Footprint Estimation Boundaries. Environ. Sci. Technol. 2008, 42, 5839–5842. [Google Scholar] [CrossRef] [PubMed] [Green Version]
- Zhang, L.; Huang, H.; Hu, D.; Li, B.; Zhang, C. Greenhouse gases (GHG) emissions analysis of manufacturing of the hydraulic press slider within forging machine in China. J. Clean. Prod. 2015, 113, 565–576. [Google Scholar] [CrossRef]
- Mirasgedis, S.; Hontou, V.; Georgopoulou, E.; Sarafidis, Y.; Gakis, N.; Lalas, D.; Loukatos, A.; Gargoulas, N.; Mentzis, A.; Economidis, D.; et al. Environmental damage costs from airborne pollution of industrial activities in the greater Athens, Greece area and the resulting benefits from the introduction of BAT. Environ. Impact Assess. Rev. 2008, 28, 39–56. [Google Scholar] [CrossRef]
- Benjaafar, S.; Li, Y.; Daskin, M. Carbon Footprint and the Management of Supply Chains: Insights From Simple Models. IEEE Trans. Autom. Sci. Eng. 2013, 10, 99–116. [Google Scholar] [CrossRef]
- Ibbotson, S.; Kara, S. LCA case study. Part 1:cradle-to-grave environmental footprint asalysis of composites and stainless stainless I-beams. Int. J. Life Cycle Assess. 2013, 18, 208–217. [Google Scholar] [CrossRef]
- Le Duigou, A.; Davies, P.; Baley, C. Environmental Impact Analysis of the Production of Flax Fibres to be Used as Composite Material Reinforcement. J. Biobased Mater. Bioenergy 2011, 5, 153–165. [Google Scholar] [CrossRef]
- Shen, L.; Worrell, E.; Patel, M.K. Open-loop recycling: A LCA case study of PET bottle-to-fibre recycling. Resour. Conserv. Recycl. 2010, 55, 34–52. [Google Scholar] [CrossRef]
- Song, Q.; Wang, Z.; Li, J.; Zeng, X. Life cycle assessment of TV sets in China: A case study of the impacts of CRT monitors. Waste Manag. 2012, 32, 1926–1936. [Google Scholar] [CrossRef]
- Available online: https://www.techwalla.com/articles/led-tv-vs-crt-power (accessed on 15 March 2022).
- Min, S.-H.; Lim, S.-Y.; Yoo, S.-H. Consumers’ Willingness to Pay a Premium for Eco-Labeled LED TVs in Korea: A Contingent Valuation Study. Sustainability 2017, 9, 814. [Google Scholar] [CrossRef] [Green Version]
- Tao, Y.-J.; Lin, Y.-S.; Lee, H.-S.; Gan, G.-Y.; Tu, C.-S. Using a Product Life Cycle Cost Model to Solve Supplier Selection Problems in a Sustainable, Resilient Supply Chain. Sustainability 2022, 14, 2423. [Google Scholar] [CrossRef]
- Meyer, D.E.; Katz, J.P. Analyzing the environmental impacts of laptop enclosures using screening-level life cycle assessment to support sustainable consumer electronics. J. Clean. Prod. 2016, 112, 369–383. [Google Scholar] [CrossRef]
- Kara, S.; Manmek, S.; Herrmann, C. Global manufacturing and the embodied energy of products. CIRP Ann. 2010, 59, 29–32. [Google Scholar] [CrossRef]
- De Felice, F.; Elia, V.; Gnoni, M.; Petrillo, A. Comparing environmental product footprint for electronic and electric equipment: A multi-criteria approach. Int. J. Sustain. Eng. 2014, 7, 360–373. [Google Scholar] [CrossRef]
- Elduque, A.; Elduque, D.; Javierre, C.; Fernández, Á.; Santolaria, J. Environmental impact analysis of the injection molding process: Analysis of the processing of high-density polyethylene parts. J. Clean. Prod. 2015, 108, 80–89. [Google Scholar] [CrossRef]
- Laurent, A.; Olsen, S.I.; Hauschild, M.Z. Carbon footprint as environmental performance indicator for the manufacturing industry. CIRP Ann. 2010, 59, 37–40. [Google Scholar] [CrossRef]
- Andrae, A. Life-Cycle Assessment of Consumer Electronics: A review of methodological approaches. IEEE Consum. Electron. Mag. 2015, 5, 51–60. [Google Scholar] [CrossRef]
- Morini, A.A.; Ribeiro, M.J.; Hotza, D. Early-stage materials selection based on embodied energy and carbon footprint. Mater. Des. 2019, 178, 107861. [Google Scholar] [CrossRef]
- Chang, H.L.; Chen, C.M.; Sun, C.H.; Lin, H.D. Carbon footprint of automotive ignition coil, IOP Conf. Ser. Mater. Sci. Eng. 2015, 87, 012016. [Google Scholar]
- Chen, C.-M.; Sun, C.-H.; Chang, H.-L. Environmental impact analysis of an automotive ignition coil in a supply chain. Carbon Manag. 2019, 11, 69–80. [Google Scholar] [CrossRef]
- Herrmann, I.T.; Moltesen, A. Does it matter which Life Cycle Assessment (LCA) tool you choose?—A comparative assessment of SimaPro and GaBi. J. Clean. Prod. 2015, 86, 163–169. [Google Scholar] [CrossRef]
- Gong, C.; Qi, L.; Heming, L.; Karimian, H.; Yuqin, M. Spatio-temporal simulation and analysis of regional ecological security based on LSTM. ISPRS Ann. Photogramm. Remote Sens. Spat. Inf. Sci. 2017, IV-4/W2, 153–160. [Google Scholar] [CrossRef] [Green Version]
- Chen, G.; Li, Q.; Peng, F.; Karamian, H.; Tang, B. Henan Ecological Security Evaluation Using Improved 3D Ecological Footprint Model Based on Emergy and Net Primary Productivity. Sustainability 2019, 11, 1353. [Google Scholar] [CrossRef] [Green Version]
- Karimian, H.; Li, Q.; Chen, H.F. Assessing Urban Sustainable Development in Isfahan. Appl. Mech. Mater. 2012, 253–255, 244–248. [Google Scholar] [CrossRef]
- ISO. BS EN ISO 14040:2006 Environmental Management. In Life Cycle Assessment. Principles and Framework; BSI: Lugano, Switzerland, 2006. [Google Scholar]
- ISO. BS EN ISO 14044:2006 Environmental Management. In Life Cycle Assessment. Requirements and Guidelines; BSI: Lugano, Switzerland, 2006. [Google Scholar]
- Solomon, S.; Qin, D.; Manning, M. Intergovernmental Panel on Climate Change (IPCC) Climate change 2007. In The Physical Science Basis Contribution of Working Group I to the Fourth Assessment Report; IPCC: Geneva, Switzerland, 2007. [Google Scholar]
- Ramaswamy, V.; Boucher, O.; Haigh, J.; Hauglustaine, D.; Haywood, J.; Myhre, G.; Nakajima, T.; Shi, G.Y.; Solomon, S. IPCC Third Assessment Report-Climate Change 2001. In Radiative Forcing of Climate Change, 6.12 Global Warming Potentials; Chapter 6; IPCC: Geneva, Switzerland, 2001; pp. 385–391. [Google Scholar]
- Steen, B. Calculation of Monetary Values of Environmental Impacts from Emissions and Resource Use The Case of Using the EPS 2015d Impact Assessment Method. J. Sustain. Dev. 2016, 9, 15. [Google Scholar] [CrossRef] [Green Version]
- Steen, B. A Systematic Approach to Environmental Priority Strategies in Products Development (EPS). Version 2000-General System Characteristics; CPM Report 1999:4; Chalmers University of Technology: Gotheburg, Sweden, 1999. [Google Scholar]
- Steen, B. A systematic Approach to Environmental Priority Strategies in Products Development (EPS). Version 2000-Models and Data; CPM Report 1999:5; Chalmers University of Technology: Gotheburg, Sweden, 1999. [Google Scholar]
- Chen, C.-M.; Chang, H.-L.; Lee, C.-Y. Improvement Prediction on the Dynamic Performance of Epoxy Composite Used in Packaging by Using Nano-Particle Reinforcements in Addition to 2-Hydroxyethyl Methacrylate Toughener. Materials 2021, 14, 4193. [Google Scholar] [CrossRef]


| Standard Motor Products | Original Number | Corresponding to the Car Maker | Corresponding Model | Corresponding Vehicle Type |
|---|---|---|---|---|
| UF-333 UF-494 | 90919-02243 | Toyota | Sedan, Sport Utility Vehicle | Camry Highlander RAV4 Solara |
| 90919-02244 | Toyota | Sedan, Sport Utility Vehicle | Camry Corolla Highlander Matrix RAV4 Solara | |
| Scion (Division of Toyota) | Sedan | tC xB | ||
| 90080-19023 | Toyota | Sedan | Camry Solara | |
| 90919-02266 | Toyota | Sedan, Sport Utility Vehicle | Camry Corolla Highlander Matrix RAV4 Corolla | |
| 90919-19023 | Scion (Division of Toyota) | Sedan | tC xB | |
| Lexus | Sedan | HS250h | ||
| Toyota | Sedan, Sport Utility Vehicle | Matrix RAV4 Highlander Solara Camry | ||
| Scion (Division of Toyota) | Sedan | tC |
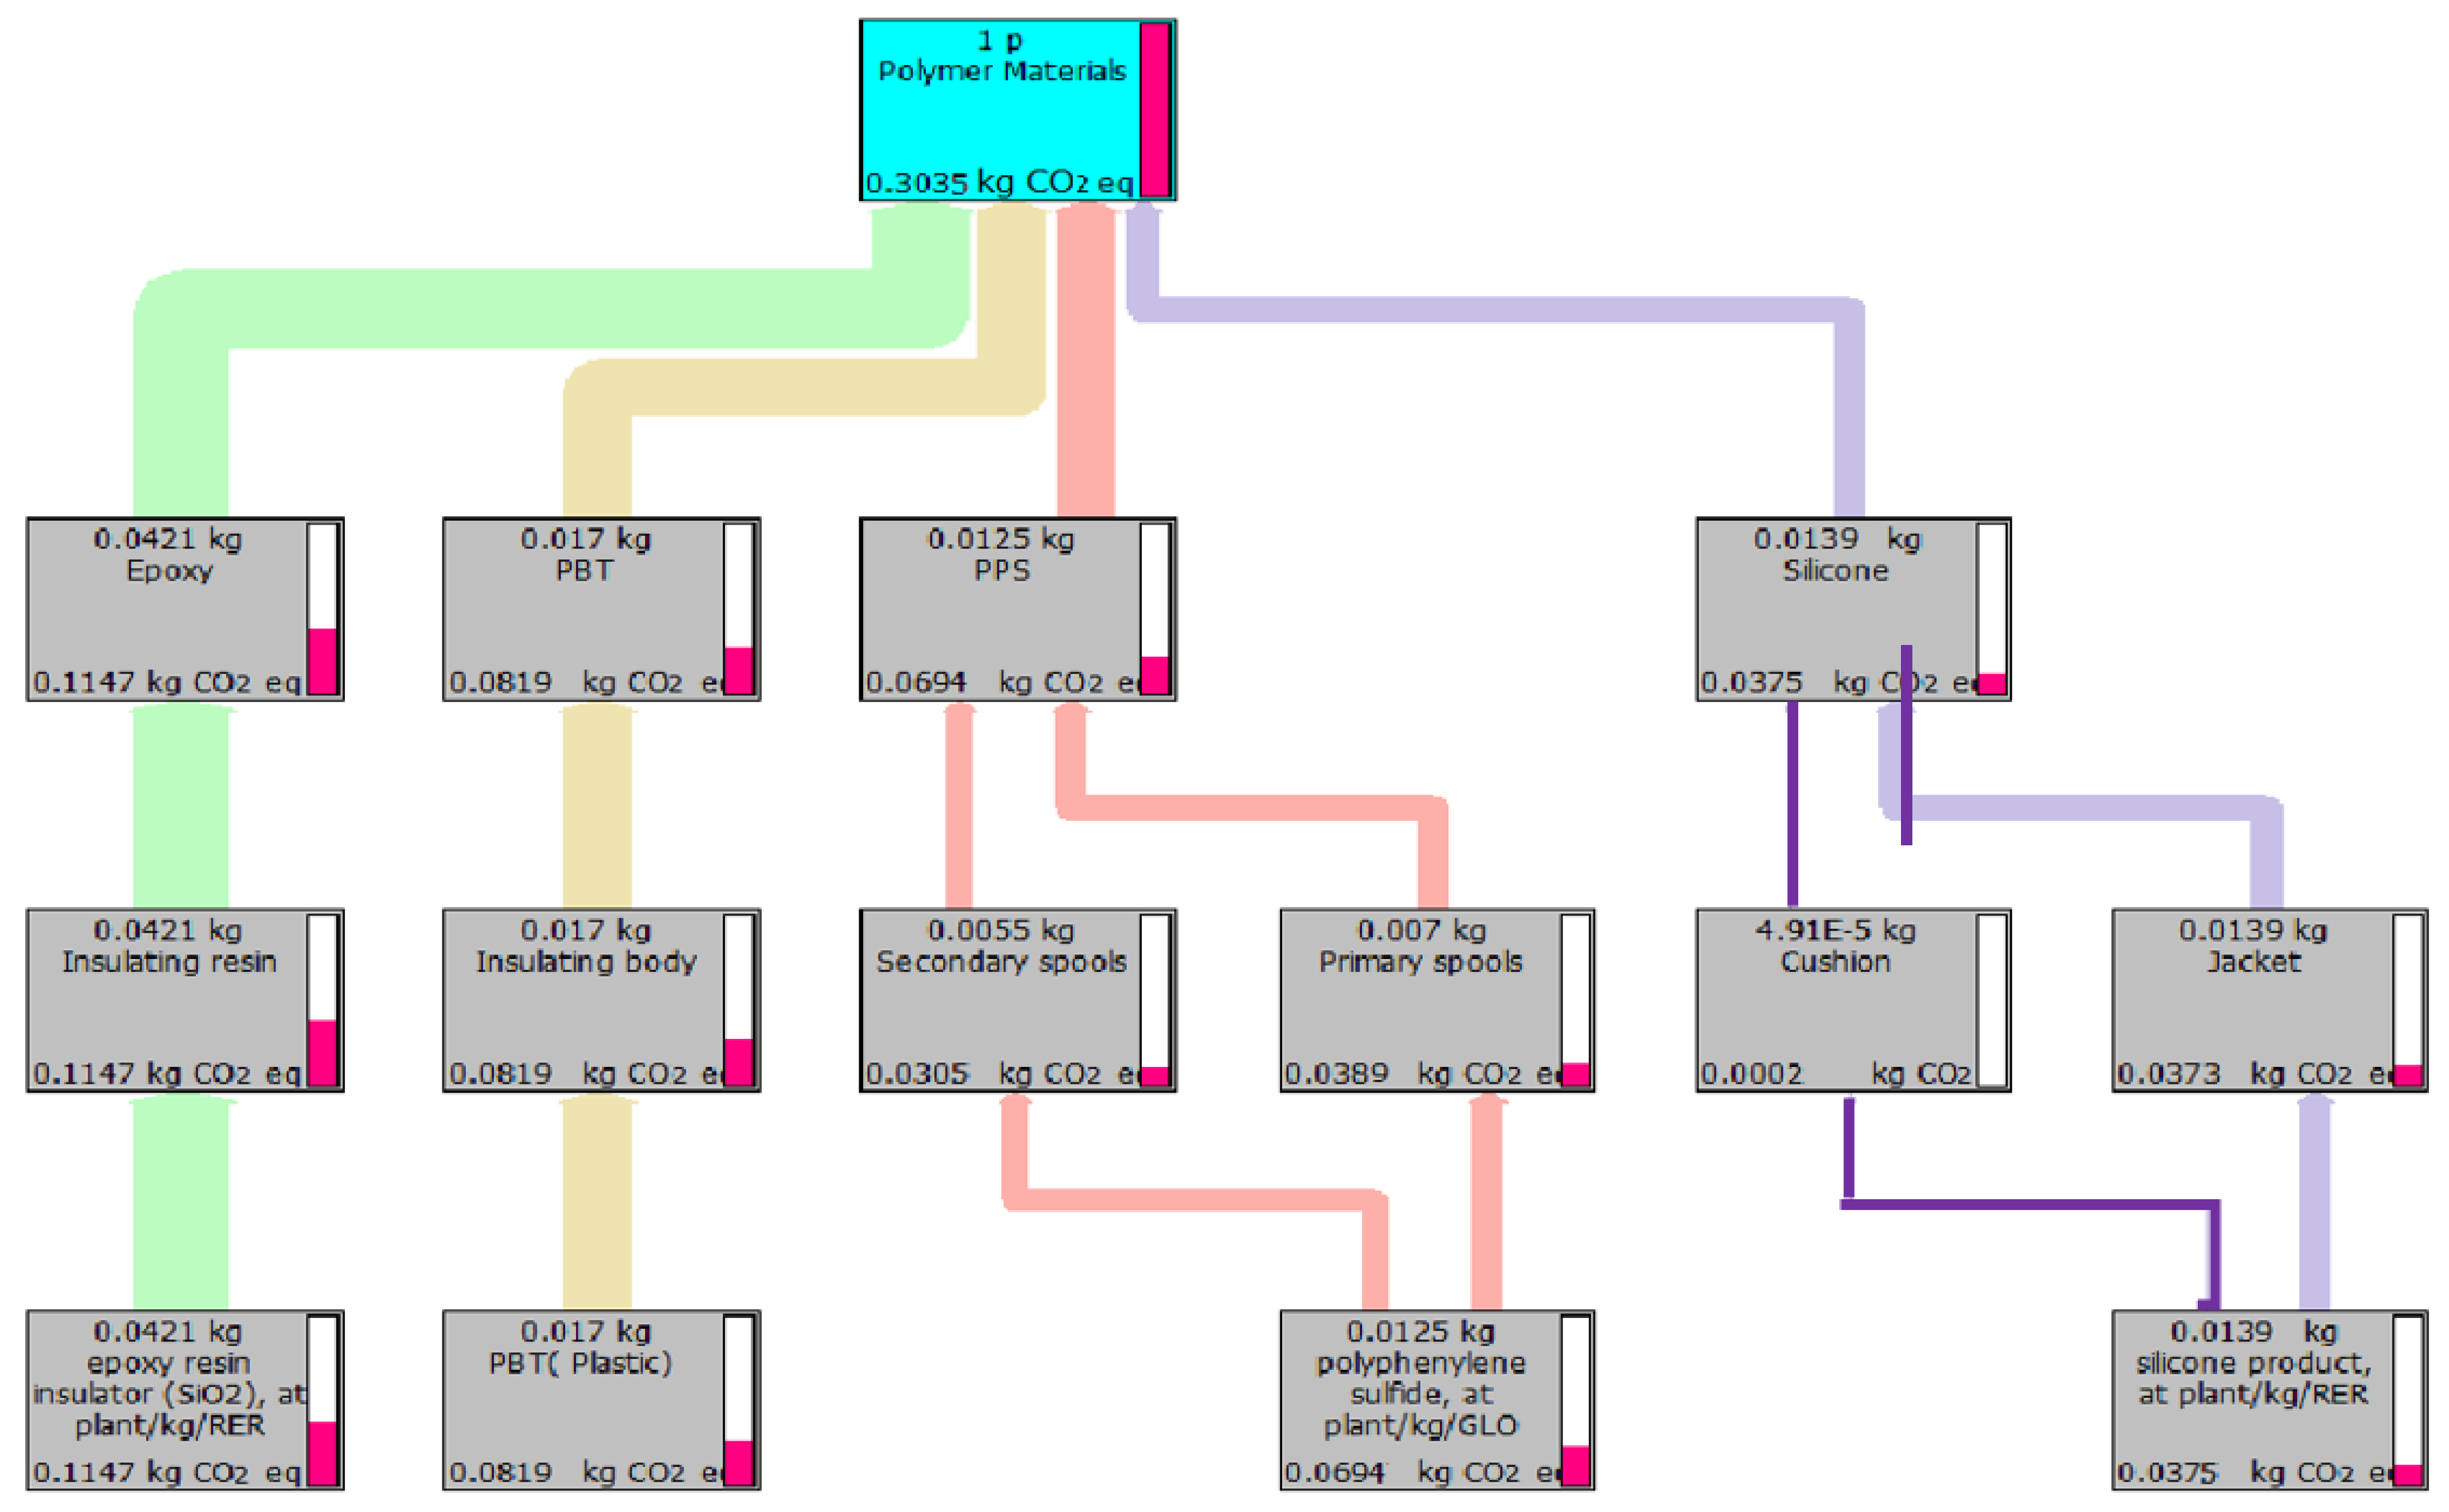
| Component | Packaging Materials | Material Composition | Mass (g) |
|---|---|---|---|
| Cushion | Silicone | 0.0491 | |
| Primary spools | PPS (Polyphenylene sulfide) | 7.0000 | |
| Secondary spools | PPS | 5.5000 | |
| Insulating body | PBT (Polybutylene terephthalate) | 17.0000 | |
| Insulating resin | Epoxy resin | 42.1000 | |
| Jacket | Silicone | 13.8000 | |
| Terminal | Copper | 0.3000 | |
| Coil | Copper | 47.6000 | |
| Secondary terminal | Copper | 0.2000 | |
| Terminal block | Copper | 0.7000 | |
| Core | Iron | 37.6000 | |
| Bush | Iron | 3.0000 | |
| High-voltage terminal | Aluminum | 0.5000 | |
| Spring | Stainless steel | 0.2000 | |
| Tin wire | Tin | 0.2000 | |
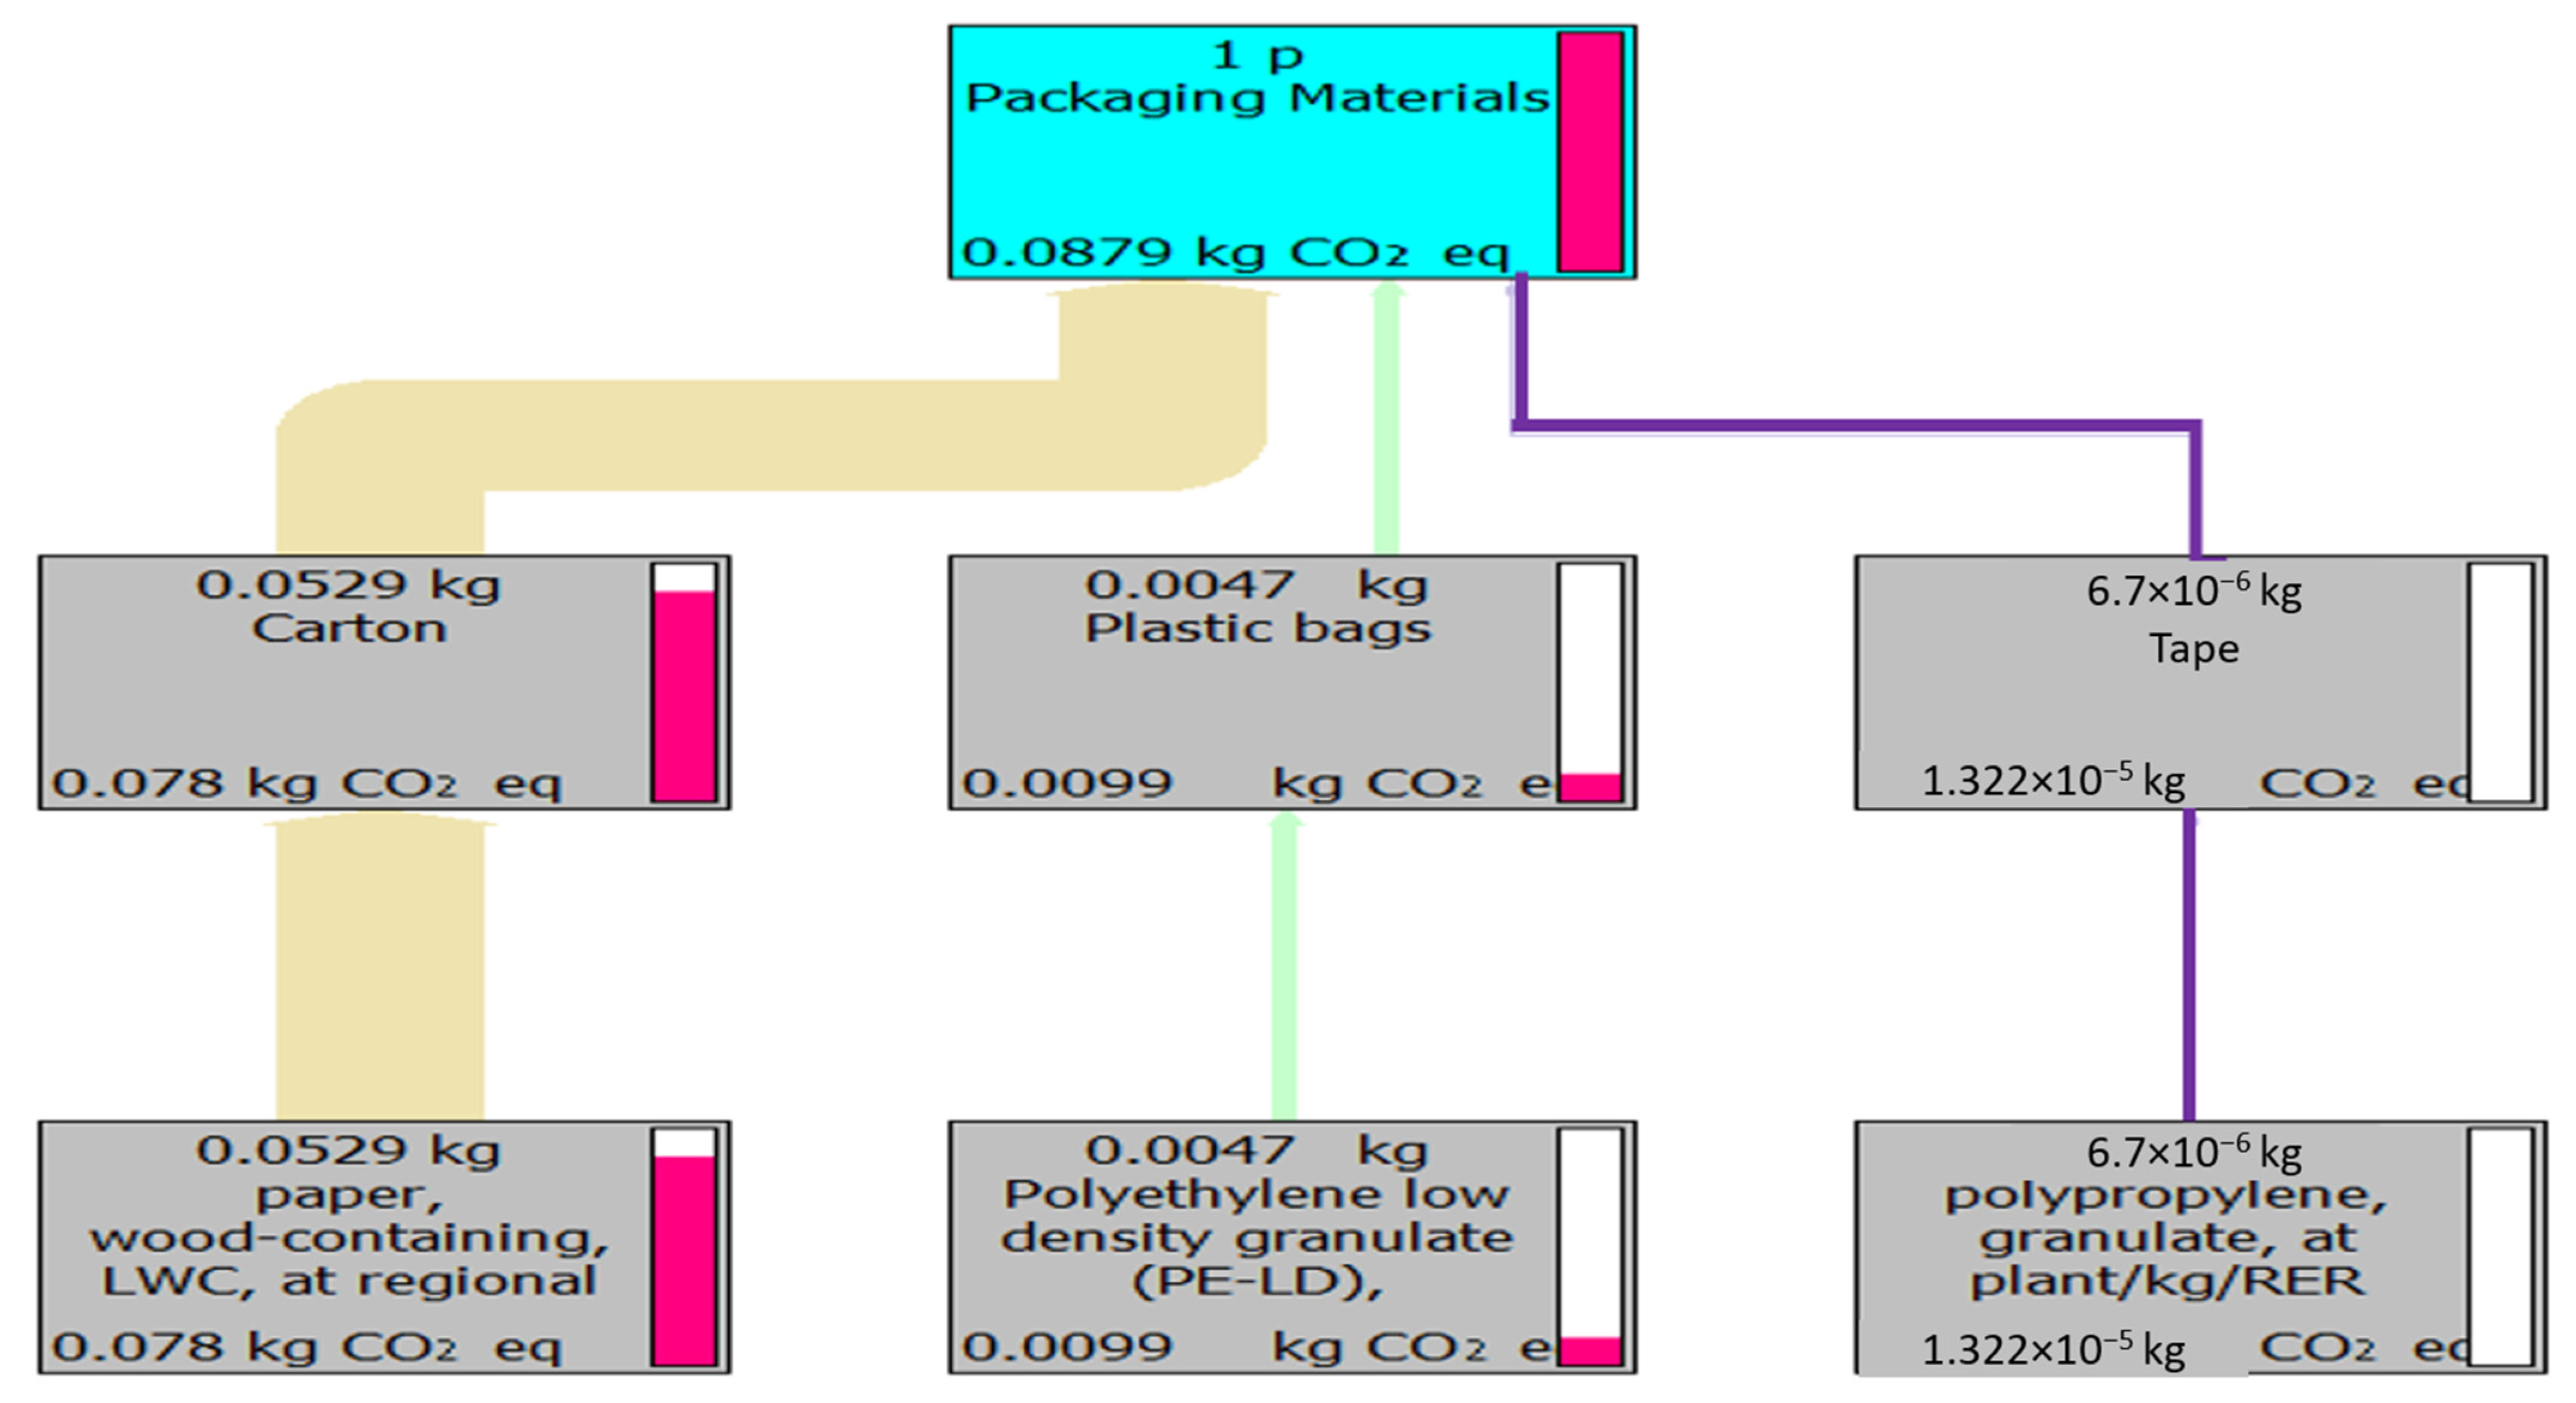
| Tape | PP (Polypropylene) | 0.0067 | |
| Carton | paper | 52.9000 | |
| plastic bags | PE (Polyethylene) | 4.7000 |
| Emission Source | Total Mass Usage (g) | Carbon Footprint (KgCO2eq) | Emission Source Carbon Footprint (%) |
|---|---|---|---|
| Epoxy resin | 42.1000 | 0.1147 | 21.83 |
| PBT | 17.0000 | 0.0819 | 15.60 |
| PBS | 12.5000 | 0.0694 | 13.20 |
| Silicone | 13.9000 | 0.0375 | 7.13 |
| Copper | 48.8000 | 0.0919 | 17.50 |
| Iron | 40.8000 | 0.0372 | 7.07 |
| Tin | 0.2000 | 0.0034 | 0.65 |
| Aluminum | 0.5000 | 0.0015 | 0.30 |
| Paper | 52.9000 | 0.0780 | 14.84 |
| PE | 4.7000 | 0.0099 | 1.88 |
| PP | 0.0067 | 0.0000 (1.322 × 10⁻⁵) | 0.00 |
| Total | 233.4067 | 0.5254 | 100.00 |
| Impact Category | Unit | Total | Polymer | Metal | Energy Consumption |
|---|---|---|---|---|---|
| Human health | ELU | 2.38 × 10⁻¹ | 4.95 × 10⁻² | 1.61 × 10⁻¹ | 2.75 × 10⁻² |
| Ecosystem production capacity | ELU | 1.906 × 10⁻³ | 7.82 × 10⁻⁴ | 7.38 × 10⁻⁴ | 3.86 × 10⁻⁴ |
| Abiotic stock resource | ELU | 8.80 | 1.21 × 10⁻¹ | 8.65 | 2.88 × 10⁻² |
| Biodiversity | ELU | 1.08 × 10⁻³ | 4.27 × 10⁻⁴ | 3.89 × 10⁻⁴ | 2.61 × 10⁻⁴ |
| Impact Category | Unit | Total | Polymer | Metal | Energy Consumption |
|---|---|---|---|---|---|
| Human health | Pt. | 2.38 × 10⁻¹ (100%) | 4.95 × 10⁻² (20.80%) | 1.61 × 10⁻¹ (67.65%) | 2.75 × 10⁻² (11.55%) |
| Ecosystem production capacity | Pt. | 1.906 × 10⁻³ (100%) | 7.82 × 10⁻⁴ (41.0%) | 7.38 × 10⁻⁴ (38.7%) | 3.86 × 10⁻⁴ (20.3%) |
| Abiotic stock resource | Pt. | 8.80 (100%) | 1.21 × 10⁻¹ (1.38%) | 8.65 (98.29%) | 2.88 × 10⁻² (0.33%) |
| Biodiversity | Pt. | 1.08 × 10⁻³ (100%) | 4.27 × 10⁻⁴ (39.81%) | 3.89 × 10⁻⁴ (36.02%) | 2.61 × 10⁻⁴ (24.17%) |
| Material | Unit | Total | Human Health | Ecosystem Production Capacity | Abiotic Stock Resource | Biodiversity |
|---|---|---|---|---|---|---|
| Polymer | Pt. | 6.23 × 10⁻² | 4.95 × 10⁻² | 7.82 × 10⁻⁴ | 1.21 × 10⁻² | 4.27 × 10⁻⁴ |
| Metal | Pt. | 8.81 × 10⁻³ | 1.61 × 10⁻¹ | 7.38 × 10⁻⁴ | 8.65 | 3.89 × 10⁻⁴ |
| Energy consumption | Pt. | 5.68 × 10⁻² | 2.75 × 10⁻² | 3.86 × 10⁻⁴ | 2.88 × 10⁻² | 2.61 × 10⁻⁴ |
Publisher’s Note: MDPI stays neutral with regard to jurisdictional claims in published maps and institutional affiliations. |
© 2022 by the authors. Licensee MDPI, Basel, Switzerland. This article is an open access article distributed under the terms and conditions of the Creative Commons Attribution (CC BY) license (https://creativecommons.org/licenses/by/4.0/).
Share and Cite
Chen, C.-M.; Chang, H.-L. Environmental Impact Assessment of an Ignition Pencil Coil by a Combination of Carbon Footprint and Environmental Priority Strategies Methodology. Sustainability 2022, 14, 4783. https://doi.org/10.3390/su14084783
Chen C-M, Chang H-L. Environmental Impact Assessment of an Ignition Pencil Coil by a Combination of Carbon Footprint and Environmental Priority Strategies Methodology. Sustainability. 2022; 14(8):4783. https://doi.org/10.3390/su14084783
Chicago/Turabian StyleChen, Chih-Ming, and Huey-Ling Chang. 2022. "Environmental Impact Assessment of an Ignition Pencil Coil by a Combination of Carbon Footprint and Environmental Priority Strategies Methodology" Sustainability 14, no. 8: 4783. https://doi.org/10.3390/su14084783
APA StyleChen, C.-M., & Chang, H.-L. (2022). Environmental Impact Assessment of an Ignition Pencil Coil by a Combination of Carbon Footprint and Environmental Priority Strategies Methodology. Sustainability, 14(8), 4783. https://doi.org/10.3390/su14084783