
Exploring Patterns of Transportation-Related CO2 Emissions Using Machine Learning Methods


Abstract
1. Introduction
Literature Review
2. Materials and Methods
2.1. Dataset
2.1.1. Socioeconomic Features
2.1.2. Transportation Features
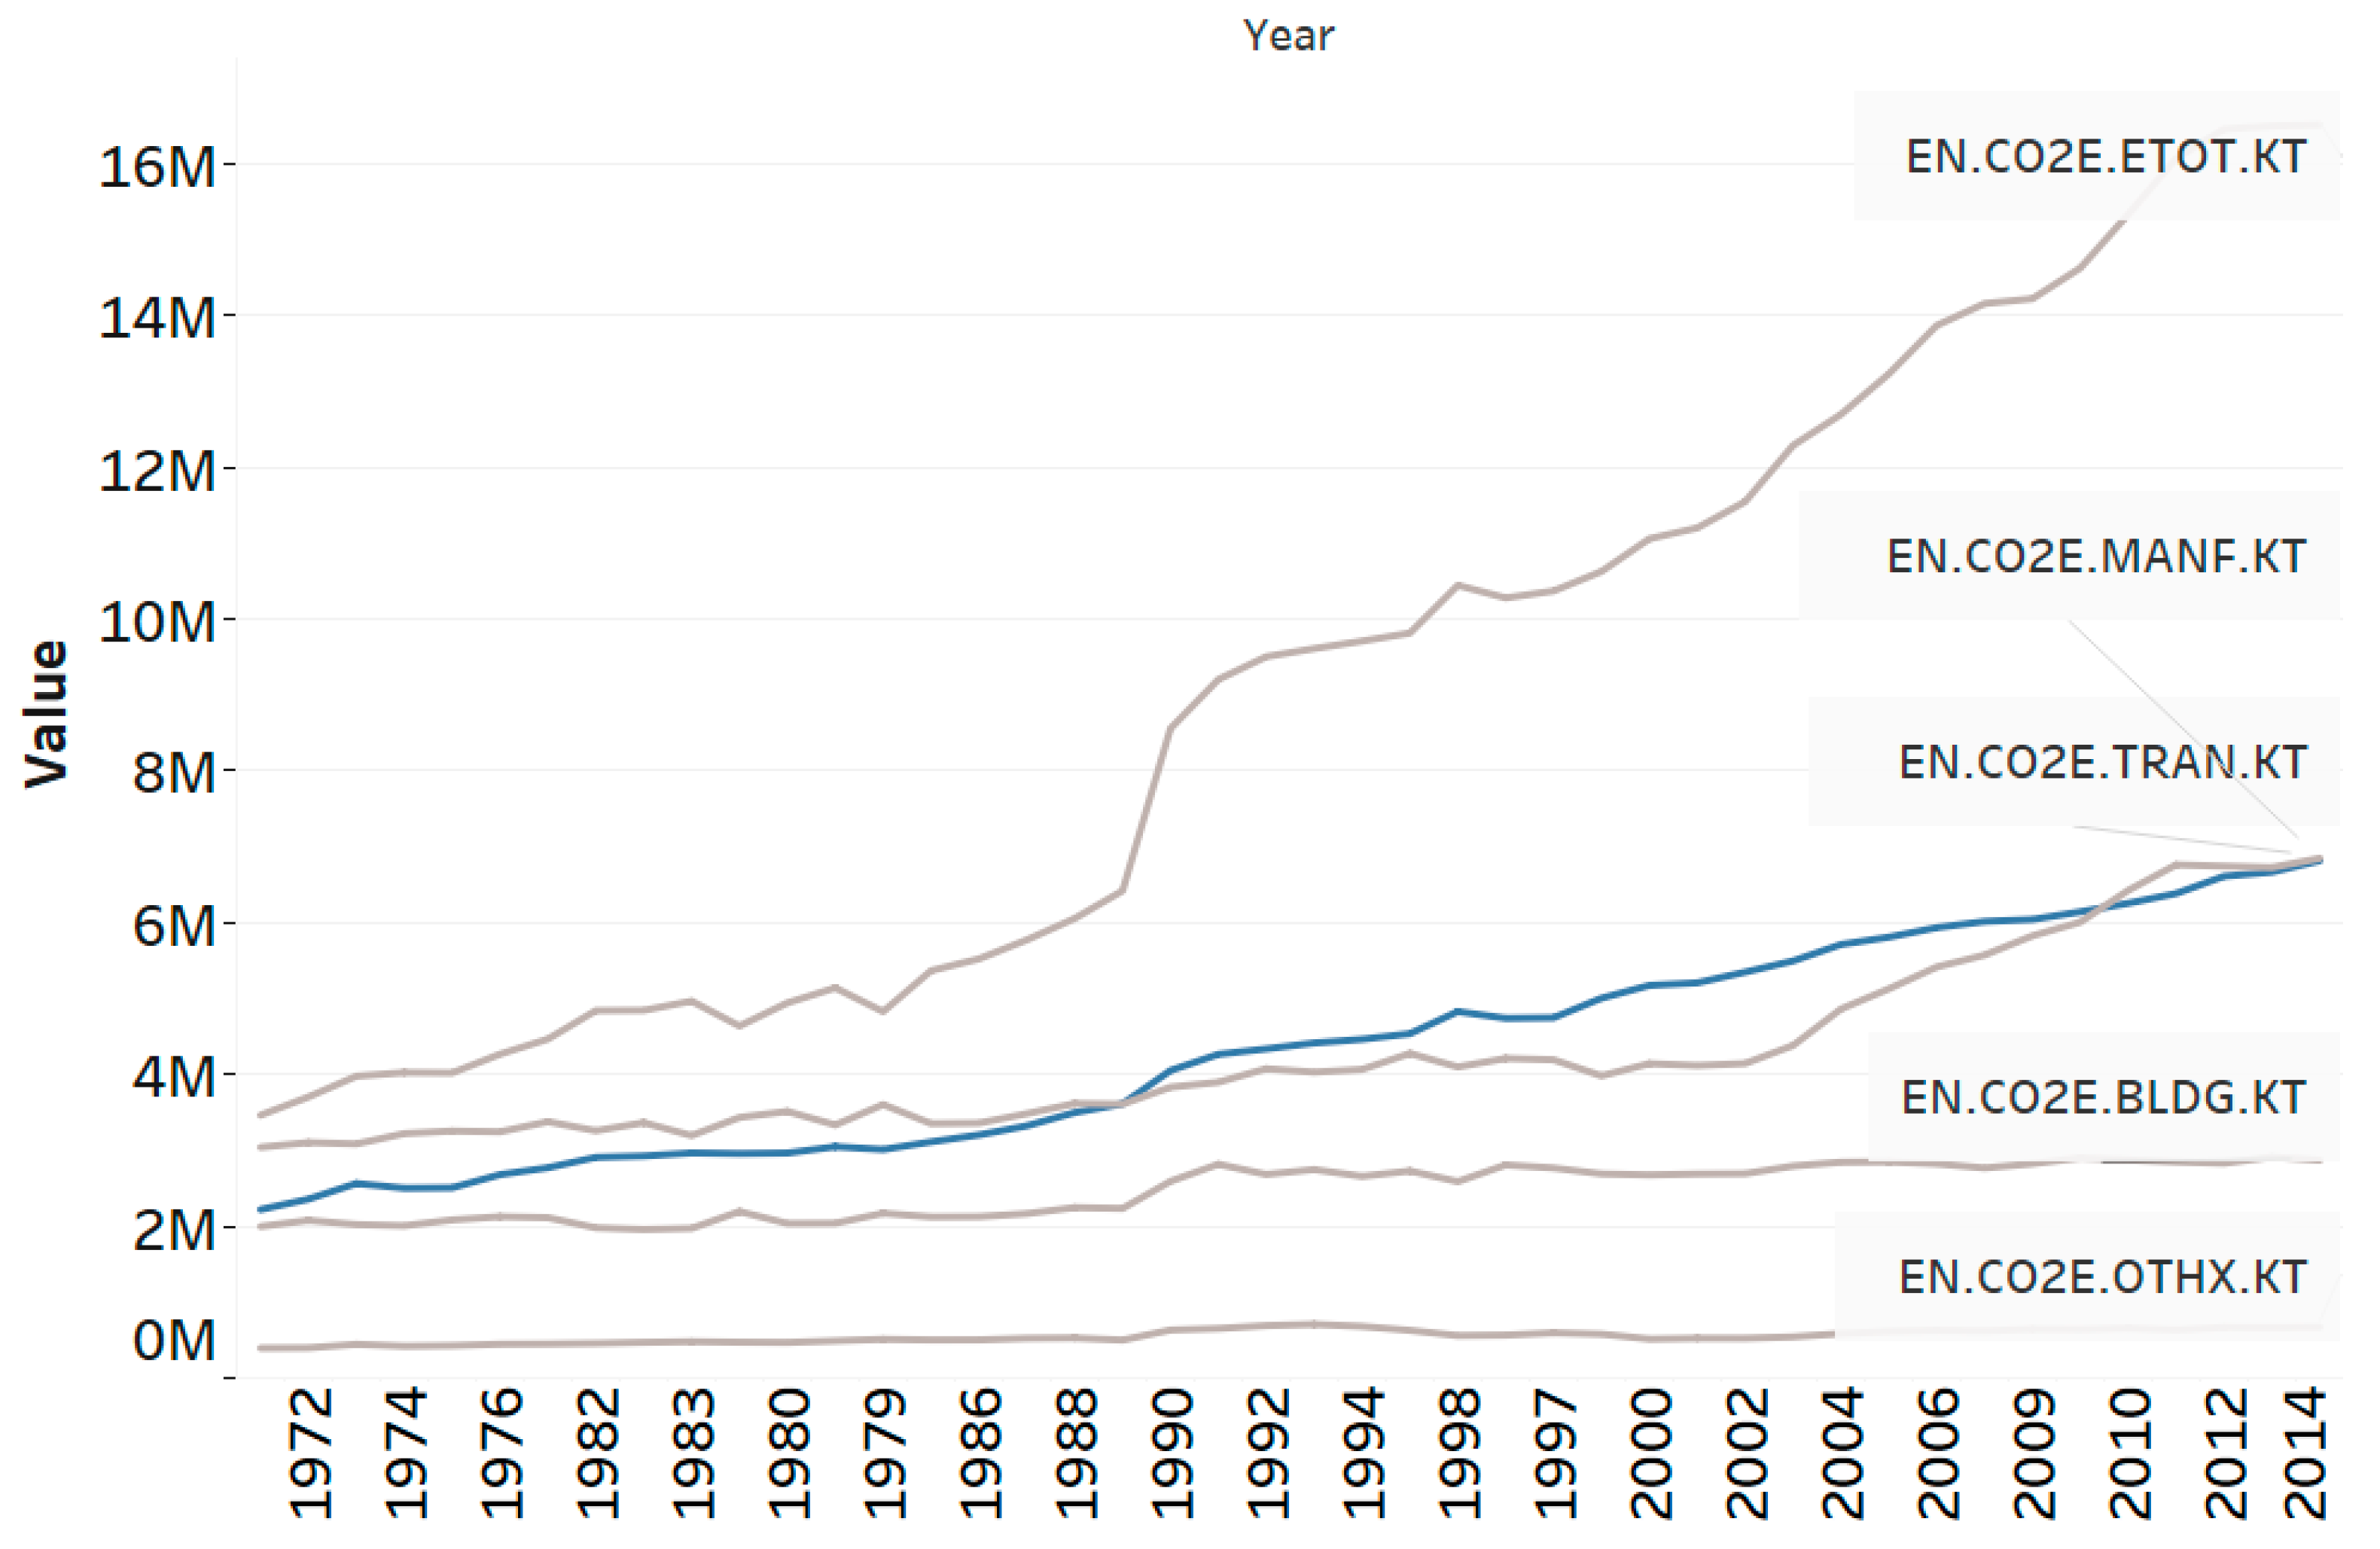
2.1.3. CO2 Emissions by Sector, Year, and Country
2.2. Method
2.2.1. Ordinary Least Squares
2.2.2. Support Vector Machine
2.2.3. Gradient Boosting Regression
2.3. Evaluation
2.3.1. MAE
2.3.2. rRMSE
2.3.3. MAPE
2.3.4. R2
2.3.5. N-fold Cross-Validation
- Randomly shuffle the dataset and split the dataset into n subsets.
- For each subset in the n subsets:
- Take the subset as a holdout or test dataset.
- Take the remaining n–1 subset as a training dataset.
- Fit a model on the training set and evaluate it on the test set.
- Retain the evaluation score and discard the model.
- Average the evaluation score of n iterations.
3. Results
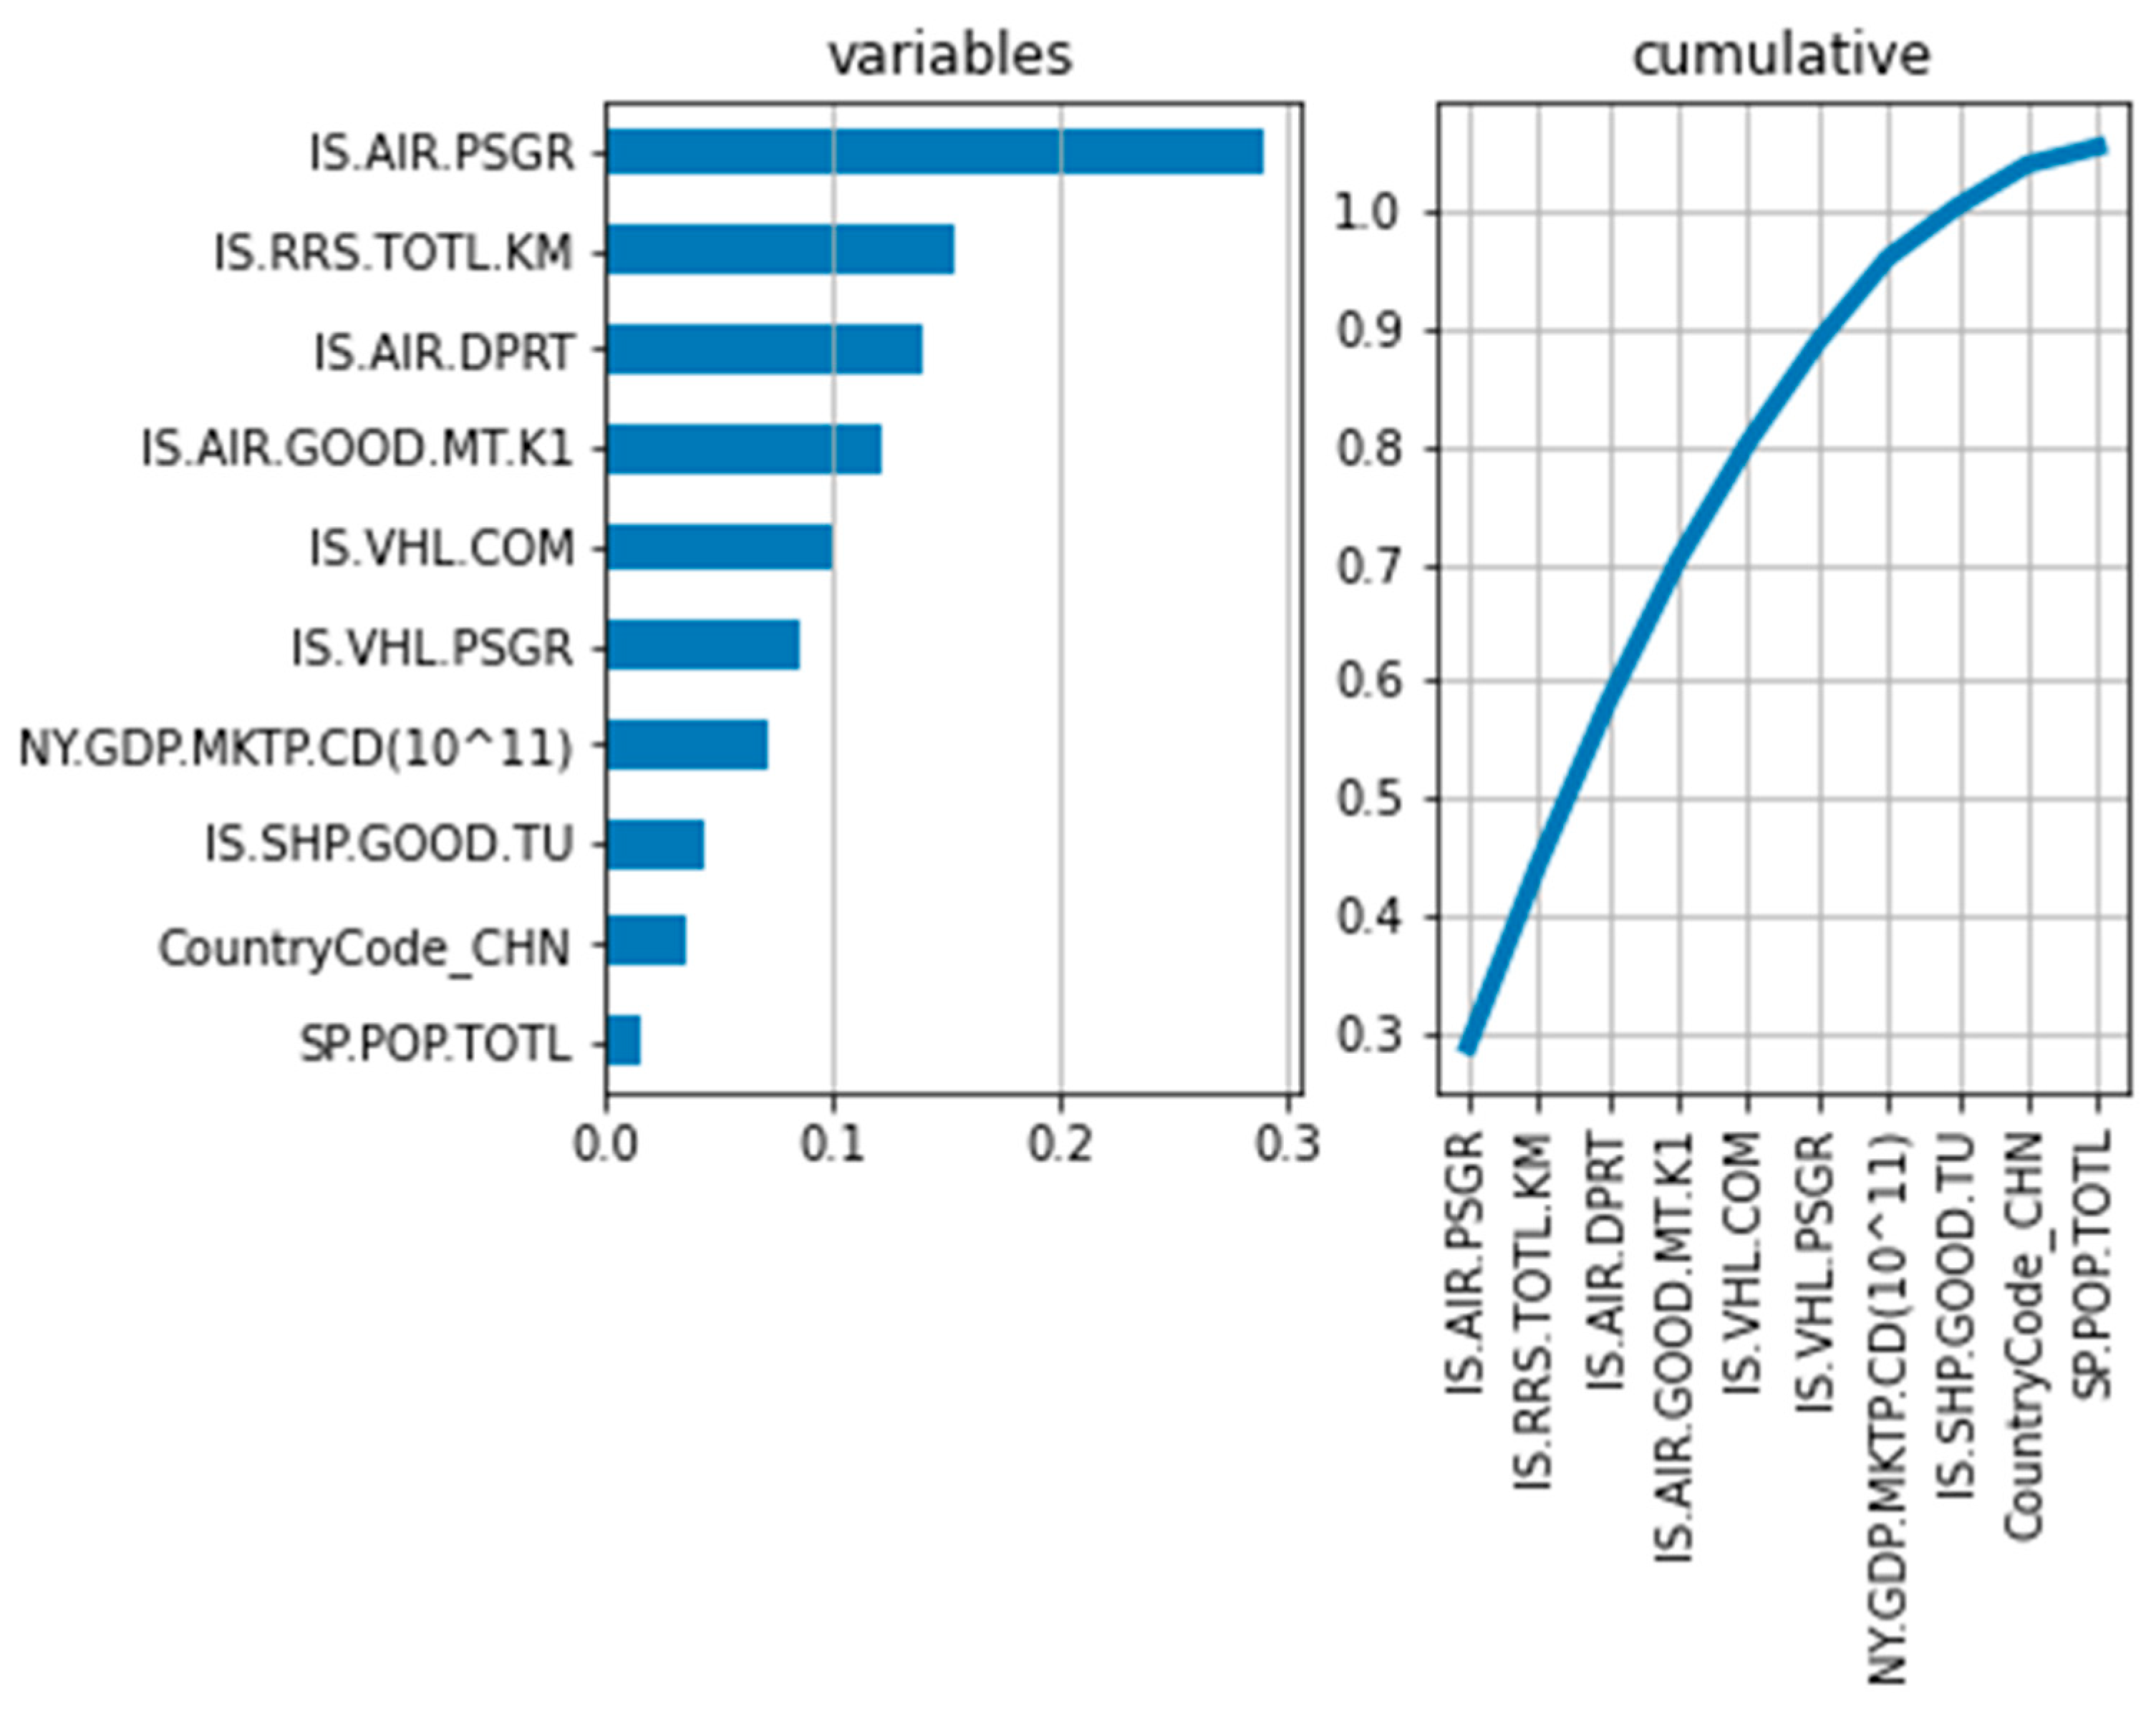
3.1. Prediction of Transportation-Based CO2 Emissions Using ML Methods
Features for Prediction Analysis
3.2. Predicting Transportation-Based CO2 Emissions for Tier 1 Countries
3.3. Predicting Transportation-Based CO2 Emissions for Tier 2 Countries
4. Discussion
5. Conclusions
Author Contributions
Funding
Conflicts of Interest
References
- United Nation. Climate Change, ‘Biggest Threat Modern Humans Have Ever Faced’, World-Renowned Naturalist Tells Security Council, Calls for Greater Global Cooperation. 2021. Available online: https://www.un.org/press/en/2021/sc14445.doc.htm (accessed on 10 January 2022).
- IPCC 2001. Climate Change 2001 Synthesis Report: Mitigation. In Contribution of Working Group III to the Third Assessment Report of the Intergovernmental Panel on Climate Change, 2001; Watson, R.T., Ed.; Cambridge University Press: Cambridge, UK, 2001. [Google Scholar]
- Pachauri, R.K.; Meyer, L.A. (Eds.) IPCC 2014 Climate Change 2014: Synthesis Report. In Contribution of Working Groups I, II and III to the Fifth Assessment Report of the Intergovernmental Panel on Climate Change; IPCC: Geneva, Switzerland, 2014; p. 151. [Google Scholar]
- Nallapaneni, M.K.; Dash, A. Internet of things: An opportunity for transportation and logistics. In Proceedings of the International Conference on Inventive Computing and Informatics, ICICI, Coimbatore, India, 23–24 November 2017; pp. 194–197. [Google Scholar]
- Onat, N.C.; Kucukvar, M.; Tatari, O. Towards life cycle sustainability assessment of alternative passenger vehicles. Sustainability 2014, 6, 9305–9342. [Google Scholar] [CrossRef]
- Garcia-Lopez, M.-L.; Pasidis, I.; Viladecans-Marsal, E. Express delivery to the suburbs: The effects of transportation in Europe’s heterogeneous cities. SSRN Electron. J. 2015. [Google Scholar] [CrossRef]
- Danish, T.H.; Baloch, M.A.; Suad, S. Modeling the impact of transport energy consumption on CO2 emission in Pakistan: Evidence from ARDL approach. Environ. Sci. Pollut. Res. 2018, 25, 9461–9473. [Google Scholar] [CrossRef] [PubMed]
- Tarhan, C.; Çil, M.A. A study on hydrogen, the clean energy of the future: Hydrogen storage methods. J. Energy Storage 2021, 40, 102676. [Google Scholar] [CrossRef]
- Giannakis, E.; Serghides, D.; Dimitriou, S.; Zittis, G. Land transport CO2 emissions and climate change: Evidence from Cyprus. Int. J. Sustain. Energy 2020, 39, 634–647. [Google Scholar] [CrossRef]
- U.S. Energy Information Administration. International Energy Outlook 2016; U.S. Energy Information Administration: Washington, DC, USA, 2016. Available online: https://www.eia.gov/outlooks/ieo/pdf/transportation.pdf (accessed on 2 January 2022).
- Sajida, M.J.; Cao, Q.; Kanga, W. Transport sector carbon linkages of EU’s top seven emitters. Transp. Policy 2019, 80, 24–38. [Google Scholar] [CrossRef]
- Gonzalez, R.M.; Marrero, G.; Rodriguez-Lopes, J.; Marrero, A. Analyzing CO2 emissions from passenger cars in Europe: A dynamic panel data approach. Energy Policy 2019, 129, 1271–1281. [Google Scholar] [CrossRef]
- United Nations Treaty Collection. Paris Agreement; United Nations Treaty Collection: New York, NY, USA, 2015; Available online: https://unfccc.int/process-and-meetings/the-paris-agreement/the-paris-agreement (accessed on 2 January 2022).
- Lean, H.H.; Huang, W.; Hong, J. Logistics and economic development: Experience from China. Transp. Policy 2014, 32, 96–104. [Google Scholar] [CrossRef]
- Yaacob, N.F.F.; Mat Yazid, M.R.; Abdul Maulud, K.N.; Ahmad Basri, N.E. A Review of the Measurement Method, Analysis and Implementation Policy of Carbon Dioxide Emission from Transportation. Sustainability 2020, 12, 5873. [Google Scholar] [CrossRef]
- Song, W.; Ren, A.; Li, X.; Li, Q. The Orchestrating Role of Carbon Subsidies in a Capital-Constrained Supply Chain. Math. Probl. Eng. 2021, 2021, 8920624. [Google Scholar] [CrossRef]
- Beyzatlar, M.A.; Karacal, M.; Yetkiner, H. Granger-causality between transportation and GDP: A panel data approach. Transp. Res. 2014, 63, 43–55. [Google Scholar] [CrossRef]
- Pradhan, R.P.; Bagchi, T.P. Effect of transportation infrastructure on economic growth in India: The VECM approach. Res. Transp. Econ. 2013, 38, 139–148. [Google Scholar] [CrossRef]
- Kustepeli, Y.; Gulcan, Y.; Akgungor, S. Transportation infrastructure investment, growth and international trade in Turkey. Appl. Econ. 2012, 44, 2619–2629. [Google Scholar] [CrossRef]
- Yu, N.; De Jong, M.; Storm, S.; Mi, J. Transport infrastructure, spatial clusters and regional economic growth in China. Transp. Rev. 2012, 32, 3–28. [Google Scholar] [CrossRef]
- Liddle, B.; Lung, S. The long-run causal relationship between transport energy consumption and GDP: Evidence from heterogeneous panel methods robust to cross-sectional dependence. Econ. Lett. 2013, 121, 524–527. [Google Scholar] [CrossRef]
- Lean, C.S. Empirical tests to discern linkages between construction and other economic sectors in Singapore. Constr. Manag. Econ. 2001, 19, 355–363. [Google Scholar]
- Eruygur, A.; Kaynak, M.; Mert, M. Transportation-communication capital and economic growth: A VECM analysis for Turkey. Eur. Plan. Stud. 2012, 20, 341–363. [Google Scholar] [CrossRef]
- Lakshmanan, T.R.; Han, X. Factors underlying transportation CO2 emissions in the U.S.A.: A decomposition analysis. Transp. Res. Transp. Environ. 1997, 2, 1–15. [Google Scholar] [CrossRef]
- Scholl, L.; Schipper, L.; Kiang, N. CO2 emissions from passenger transport: A comparison of international trends from 1973 to 1992. Energy Policy 1996, 24, 17–30. [Google Scholar] [CrossRef]
- Lu, I.J.; Lin, S.J.; Lewis, C. Decomposition and decoupling effects of carbon dioxide emission from highway transportation in Taiwan, Germany, Japan and South Korea. Energy Policy 2007, 35, 3226–3235. [Google Scholar] [CrossRef]
- Timilsina, G.R.; Shrestha, A. Transport sector CO2 emissions growth in Asia: Underlying factors and policy options. Energy Policy 2009, 37, 4523–4539. [Google Scholar] [CrossRef]
- Zhu, X.; Li, R. An Analysis of Decoupling and Influencing Factors of Carbon Emissions from the Transportation Sector in the Beijing-Tianjin-Hebei Area, China. Sustainability 2017, 9, 722. [Google Scholar] [CrossRef]
- Liang, Y.; Niu, D.; Wang, H.; Li, Y. Factors Affecting Transportation Sector CO2 Emissions Growth in China: An LMDI Decomposition Analysis. Sustainability 2017, 9, 1730. [Google Scholar] [CrossRef]
- Kim, S. Decomposition Analysis of Greenhouse Gas Emissions in Korea’s Transportation Sector. Sustainability 2019, 11, 1986. [Google Scholar] [CrossRef]
- Yuan, Y.; Wang, Y.; Chi, Y.; Jin, F. Identification of Key Carbon Emission Sectors and Analysis of Emission Effects in China. Sustainability 2020, 12, 8673. [Google Scholar] [CrossRef]
- Hassouna, F.; Al-Sahili, K. Environmental impact assessment of the transportation sector and hybrid vehicle implications in Palestine. Sustainability 2020, 12, 7878. [Google Scholar] [CrossRef]
- Lotfalipour, M.; Falahi, M.; Bastam, M. Prediction of CO2 emissions in Iran using Grey and ARIMA models. Int. J. Energy Econ. Policy 2013, 3, 229–237. [Google Scholar]
- Chigora, F.; Thabani, N.; Mutambara, E. Forecasting 2 emission for Zimbabwe’s tourism destination vibrancy: A univariate approach using box-Jenkins ARIMA model. Afr. J. Hosp. Tour. Leis. 2019, 8. [Google Scholar]
- Ayvaz, B.; Kusakci, A.O.; Temur, G.T. Energy-related CO2 emission forecast for Turkey and Europe and Eurasia. Grey Syst. Theory Appl. 2017, 7, 436–452. [Google Scholar] [CrossRef]
- Ofosu-Adarkwa, J.; Xie, N.; Javed, S.A. Forecasting CO2 emissions of China’s cement industry using a hybrid Verhulst-GM (1, N) model and emissions’ technical conversion. Renew. Sustain. Energy Rev. 2020, 130, 109945. [Google Scholar] [CrossRef]
- Yang, H.; O’Connell, J.F. Short-term carbon emissions forecast for aviation industry in Shanghai. J. Clean. Prod. 2020, 275, 122734. [Google Scholar] [CrossRef]
- Ang, C.; Morad, N.; Ismail, M.; Ismail, N. Projection of carbon dioxide emissions by energy consumption and transportation in Malaysia: A time series approach. J. Energy Technol. Policy 2013, 3, 63–75. [Google Scholar]
- Rezaei, M.H.; Sadeghzadeh, M.; Alhuyi Nazari, M.; Ahmadi, M.H.; Astaraei, F.R. Applying GMDH artificial neural network in modeling CO2 emissions in four nordic countries. Int. J. Low Carbon Technol. 2018, 13, 266–271. [Google Scholar] [CrossRef]
- Tsay, Y.-S.; Yeh, C.-Y.; Chen, Y.-H.; Lu, M.-C.; Lin, Y.-C. A Machine Learning-Based Prediction Model of LCCO2 for Building Envelope Renovation in Taiwan. Sustainability 2021, 13, 8209. [Google Scholar] [CrossRef]
- Zeng, H.; Shao, B.; Bian, G.; Dai, H.; Zhou, F. Analysis of Influencing Factors and Trend Forecast of CO2 Emission in Chengdu-Chongqing Urban Agglomeration. Sustainability 2022, 14, 1167. [Google Scholar] [CrossRef]
- Hui, M. 2020 World Development Indicators from World Bank Open Data; Kaggle: San Francisco, CA, USA, 2021; Available online: https://www.kaggle.com/manchunhui/world-development-indicators (accessed on 2 January 2022).
- United Nations. Country Classification. 2014. Available online: https://www.un.org/en/development/desa/policy/wesp/wesp_current/2014wesp_country_classification.pdf (accessed on 6 January 2022).
- Ritchie, H. Cars, Planes, Trains: Where Do CO2 Emissions from Transport Come from? Ourworldindata. 2020. Available online: https://ourworldindata.org/co2-emissions-from-transport (accessed on 2 January 2022).
- Bakay, M.S.; Agbulut, Ü. Electricity production-based forecasting of green- house gas emissions in Turkey with deep learning, support vector machine and artificial neural network algorithms. J. Clean. Prod. 2021, 285, 125324. [Google Scholar] [CrossRef]
- Hidecker, M.J.C.; Ho, N.T.; Dodge, N.; Hurvitz, E.A.; Slaughter, J.; Workinger, M.S.; Paneth, N. Inter-relationships of functional status in cerebral palsy: Analyzing gross motor function, manual ability, and communication function classification systems in children. Dev. Med. Child. Neurol. 2012, 54, 737–742. [Google Scholar] [CrossRef]
- Stock, J.H.; Watson, M.W. Introduction to Econometrics; Addison Wesley: Boston, MA, USA, 2003. [Google Scholar]
- Cortes, C.; Vapnik, V. Support-Vector Networks. Mach. Learn. 1995, 20, 273–297. [Google Scholar] [CrossRef]
- Harris, D.; Burges, C.J.C.; Kaufman, L.; Smola, A.J.; Vapnik, V. Support Vector Regression Machines, in Advances in Neural Information Processing Systems 9. NIPS 1997, 779–784. [Google Scholar]
- Joachims, T. Transductive Inference for Text Classification using Support Vector Machines. In Proceedings of the 1999 International Conference on Machine Learning (ICML 1999); Universität Dortmund: Dortmund, Germany, 1999; pp. 200–209. [Google Scholar]
- Ben-Hur, A.; Horn, D.; Siegelmann, H.; Vapnik, V. Support vector clustering. J. Mach. Learn Res. 2001, 2, 125–137. [Google Scholar] [CrossRef]
- Hsu, C.-W.; Lin, C.-J. A Comparison of Methods for Multiclass Support Vector Machines. IEEE Trans. Neural Netw. Learn. Syst. 2002, 13, 415–425. [Google Scholar] [CrossRef] [PubMed]
- Polson, N.G.; Scott, S.L. Data Augmentation for Support Vector Machines. Bayesian Anal. 2011, 6, 1–23. [Google Scholar] [CrossRef]
- Friedman, J.H. Greedy Function Approximation: A Gradient Boosting Machine. Ann. Stat. 2001, 29, 1189–1232. [Google Scholar] [CrossRef]
- Cai, J.; Xu, K.; Zhu, Y.; Hu, F.; Li, L. Prediction and analysis of net ecosystem carbon exchange based on gradient boosting regression and random forest. Appl. Energy 2020, 262, 114566. [Google Scholar] [CrossRef]
- Hu, W.; Shao, M.; Reichardt, K. Using a new criterion to identify sites for mean soil water storage evaluation. Soil Sci. Soc. Am. J. 2010, 74, 762–773. [Google Scholar] [CrossRef]
- Chen, J.L.; Li, G.S.; Wu, S.J. Assessing the potential of support vector machine for estimating daily solar radiation using sunshine duration. Energy Convers. Manag. 2013, 75, 311–318. [Google Scholar] [CrossRef]
- Ağbulut, Ü. Forecasting of transportation-related energy demand and CO2 emissions in Turkey with different machine learning algorithms. Sustain. Prod. Consum. 2022, 29, 141–157. [Google Scholar] [CrossRef]
- Kim, S.; Kim, H. A new metric of absolute percentage error for intermittent demand forecasts. Int. J. Forecast. 2016, 32, 669–679. [Google Scholar] [CrossRef]
- Chakraborty, D.; Elzarka, H. Performance testing of energy models: Are we using the right statistical metrics? J. Build. Perform. Simul. 2018, 11, 433–448. [Google Scholar] [CrossRef]
- Li, Q.; Deleger, L.; Lingren, T.; Zhai, H.J.; Kaiser, M.; Stoutenborough, L.; Jegga, A.G.; Cohen, K.B.; Solti, I. Mining FDA drug labels for medical conditions. BMC Med. Inf. Decis. Mak. 2013, 13, 53. [Google Scholar] [CrossRef]
- Montaño Moreno, J.J.; Palmer Pol, A.; Sesé Abad, A.; Cajal Blasco, B. Using the R-MAPE index as a resistant measure of forecast accuracy. Psicothema 2013, 25, 500–506. [Google Scholar] [CrossRef]
- Tuncer, A.D.; Sözen, A.; Afshari, F.; Khanlari, A.; Şirin, C.; Gungor, A. Testing of a novel convex-type solar absorber drying chamber in dehumidification process of municipal sewage sludge. J. Clean. Prod. 2020, 272, 122862. [Google Scholar] [CrossRef]


| Description | Indicators | Source |
|---|---|---|
| Socioeconomic Factors (SoEco) | ||
| GDP (current USD) | NY.GDP.MKTP.CD | WDI |
| Unemployment, total (% of total labor force) (modeled ILO estimate) | SL.UEM.TOTL.ZS | WDI |
| Agriculture, value added per worker (constant 2010 USD) | NV.AGR.EMPL.KD | WDI |
| Industry, value added per worker (constant 2010 USD) | NV.IND.EMPL.KD | WDI |
| Services, value added per worker (constant 2010 USD) | NV.SRV.EMPL.KD | WDI |
| Developed or developing country | Developing0Developed1 | UN |
| Fuel-exporting country | Fuel-exportingCountries | UN |
| High income, upper middle income, lower middle income, low income | High Income Upper Middle Income Lower Middle Income | UN |
| Population, total | SP.POP.TOTL | WDI |
| Transportation factors (TRAN) | WDI | |
| Air transportation, passengers carried | IS.AIR.PSGR | WDI |
| Air transportation, registered carrier departures worldwide | IS.AIR.DPRT | WDI |
| Air transportation, freight (million tons in km) | IS.AIR.GOOD.MT.K1 | WDI |
| Container port traffic (TEU: 20 foot equivalent units) | IS.SHP.GOOD.TU | WDI |
| Rail lines (total routes in km) | IS.RRS.TOTL.KM | WDI |
| Commercial vehicles in use (per 1000 units) | IS.VHL.COM | OICA |
| Passengers cars in use (per 1000 units) | IS.VHL.PSGR | OICA |
| CO2 related factors | ||
| CO2 emissions (kt) | EN.ATM.CO2E.KT | WDI |
| CO2 emissions from residential buildings and commercial and public services (% of total fuel combustion) | EN.CO2.BLDG.ZS | WDI |
| CO2 emissions from electricity and heat production, total (% of total fuel combustion) | EN.CO2.ETOT.ZS | WDI |
| CO2 emissions from manufacturing industries and construction (% of total fuel combustion) | EN.CO2.MANF.ZS | WDI |
| CO2 emissions from other sectors, excluding residential buildings and commercial and public services (% of total fuel combustion) | EN.CO2.OTHX.ZS | WDI |
| CO2 emissions from transportation (% of total fuel combustion) | EN.CO2.TRAN.ZS | WDI |
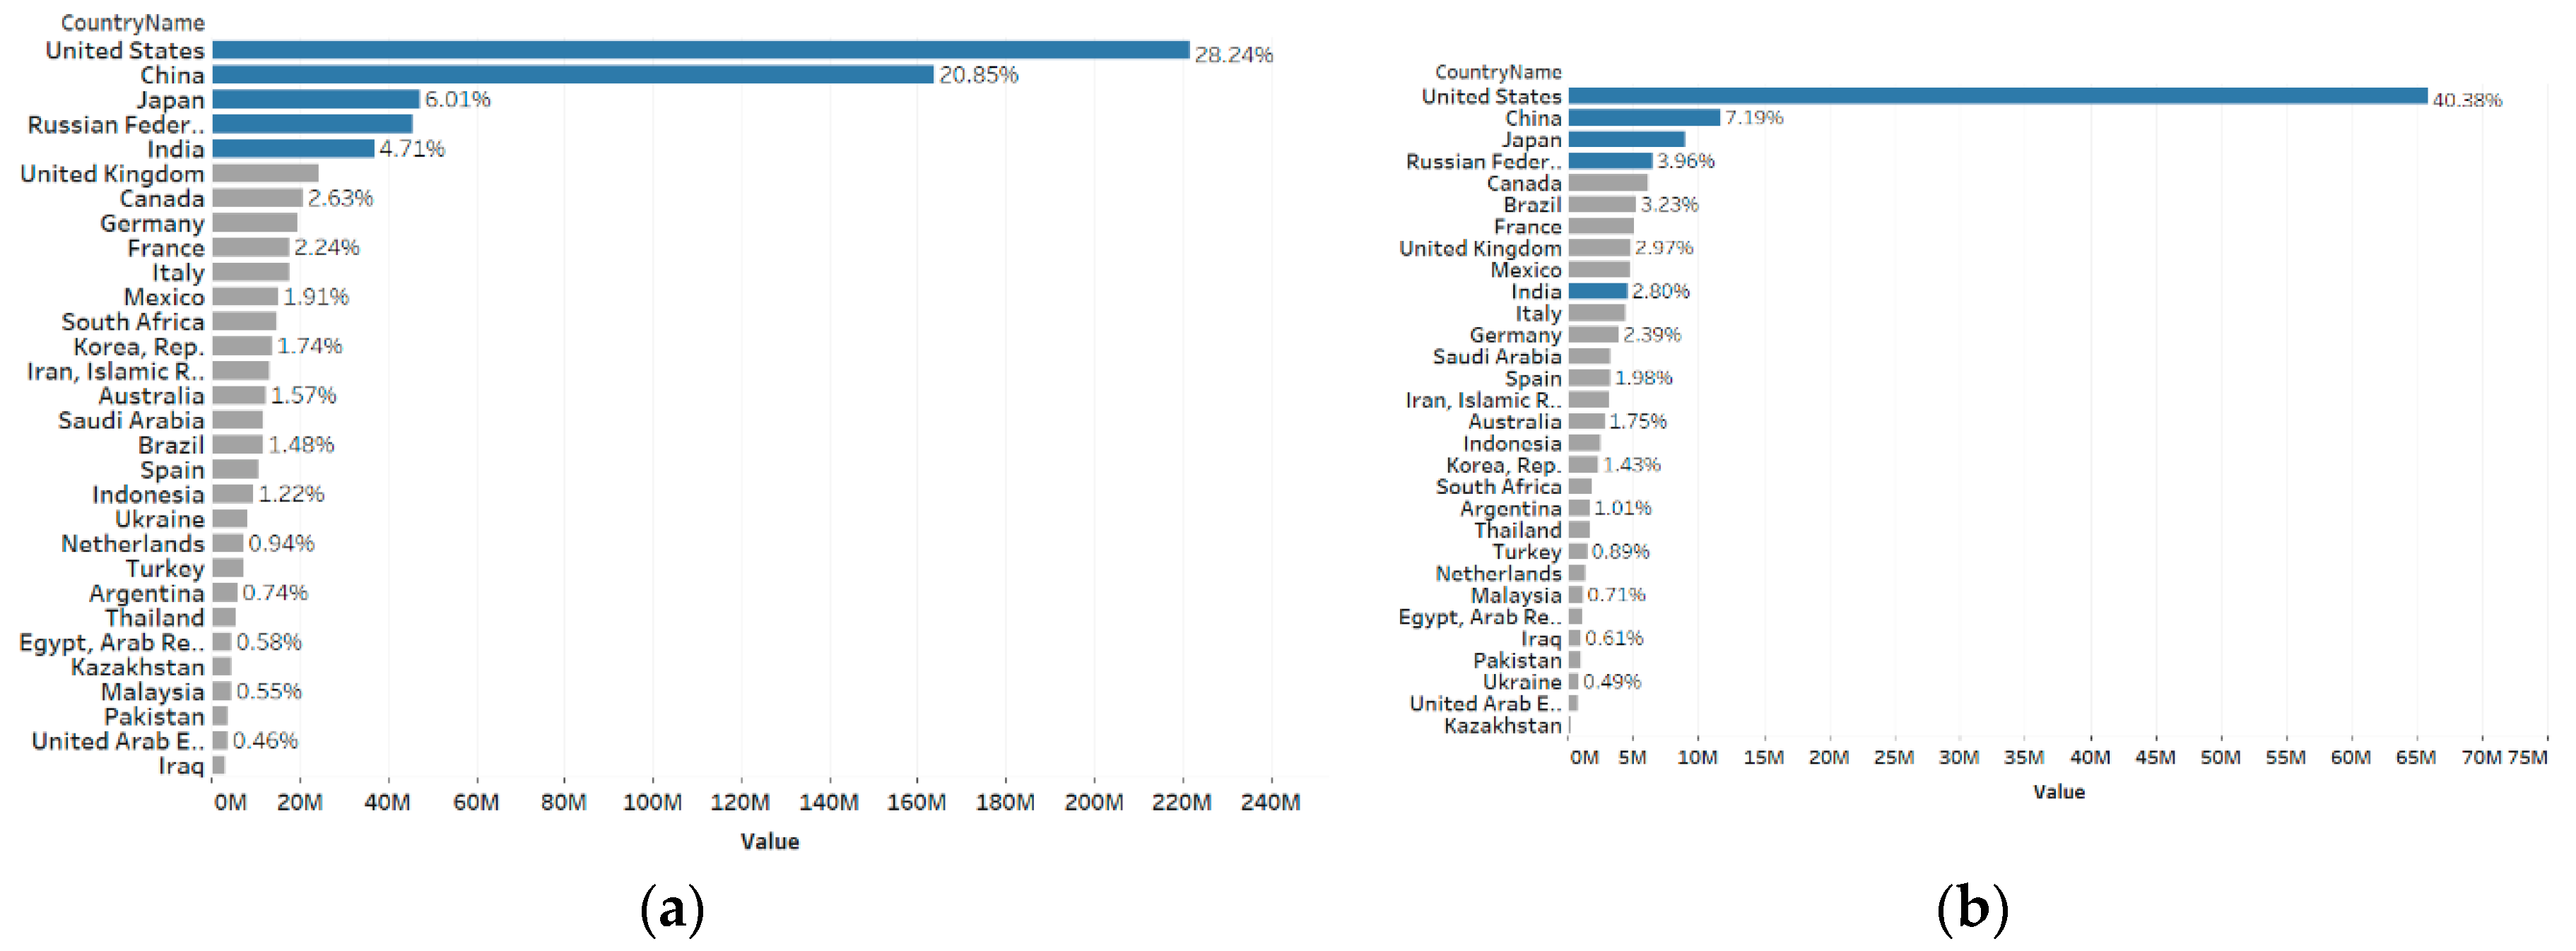
| Tier | Country Name | Country Code | % of Total CO2 Emissions | Avg. Yearly CO2 Emissions from Transportation (kt) (2005–2014) | Avg. Yearly Per Capita CO2 Emissions from Transportation (kt) (2005–2014) |
|---|---|---|---|---|---|
| Tier 1 (five countries with 61% of total CO2 emissions from 2005–2014) | China | CHN | 27.85% | 656,467 | 0.49 |
| United States | USA | 18.15% | 1,744,667 | 5.68 | |
| India | IND | 5.71% | 199,638 | 0.16 | |
| Russian Federation | RUS | 5.67% | 263,744 | 1.84 | |
| Japan | JAP | 4.04% | 227,222 | 1.78 | |
| Tier 2 (25 countries with 35% of total CO2 emissions from 2005–2014) | Iran | IRN | 1.88% | 135,256 | 1.84 |
| Canada | CAN | 1.81% | 168,799 | 5 | |
| Korea | KOR | 1.79% | 89,484 | 1.81 | |
| United Kingdom | GBR | 1.63% | 123,077 | 1.97 | |
| Saudi Arabia | SAU | 1.62% | 126,382 | 4.63 | |
| Mexico | MEX | 1.61% | 162,303 | 1.43 | |
| South Africa | ZAF | 1.57% | 56,821 | 1.11 | |
| Brazil | BRA | 1.40% | 189,664 | 0.97 | |
| Indonesia | IDN | 1.40% | 109,557 | 0.45 | |
| Italy | ITA | 1.37% | 116,602 | 1.97 | |
| Australia | AUS | 1.26% | 85,210 | 3.9 | |
| France | FRA | 1.17% | 131,503 | 2.03 | |
| Poland | POL | 1.03% | 44,409 | 1.17 | |
| Turkey | TUR | 0.99% | 52,053 | 0.72 | |
| Spain | ESP | 0.99% | 102,749 | 2.25 | |
| Ukraine | UKR | 0.98% | 35,142 | 0.76 | |
| Thailand | THA | 0.84% | 65,667 | 0.98 | |
| Kazakhstan | KAZ | 0.77% | 13,835 | 0.85 | |
| Malaysia | MYS | 0.70% | 52,240 | 1.87 | |
| Egypt, Arab Rep. | EGY | 0.68% | 48,031 | 0.58 | |
| Argentina | ARG | 0.62% | 47,167 | 1.16 | |
| Venezuela, RB | VEN | 0.60% | 53,289 | 1.89 | |
| Netherlands | NLD | 0.59% | 36,837 | 2.22 | |
| United Arab Emirates | ARE | 0.57% | 32,214 | 4.29 | |
| Pakistan | PAK | 0.54% | 43,081 | 0.24 |
| Feature Type | Features | Count | Mean | Std | Min | 50% | Max |
|---|---|---|---|---|---|---|---|
| SocEco | Year | 300 | 2010 | 3 | 2005 | 2010 | 2014 |
| SocEco | SP.POP.TOTL (10^8) | 300 | 1.60 | 3.08 | 0.46 | 0.61 | 13.64 |
| TRAN | IS.AIR.DPRT | 296 | 758,007 | 1,743,070 | 17,302 | 315,383 | 10,095,200 |
| TRAN | IS.AIR.GOOD.MT.K1 | 300 | 4023 | 7393 | 1 | 1386 | 40,618 |
| TRAN | IS.SHP.GCNW.XQ | 290 | 50 | 25 | 8 | 41 | 135 |
| SocEco | NY.GDP.MKTP.CD (10^8) | 300 | 17,193.7 | 29,169.1 | 571.24 | 8427.63 | 175,217.5 |
| SocEco | NV.IND.EMPL.DK | 298 | 53,633 | 42,761 | 2678 | 32,233 | 202,808 |
| SocEco | NV.AGR.EMPL.KD | 298 | 28,539 | 40,609 | 1029 | 12,938 | 305,042 |
| SocEco | NV.SRV.EMPL.KD | 298 | 39,589 | 32,555 | 4156 | 23,095 | 104,388 |
| SocEco | SL.UEM.TOTL.ZS | 300 | 7 | 5 | 0 | 6 | 29 |
| TRAN | IS.AIR.PSGR | 296 | 67,599,190 | 133,450,700 | 1,160,286 | 33,191,170 | 762,710,000 |
| TRAN | IS.RRS.TOTL.KM | 224 | 27,536 | 40,124 | 58 | 15,026 | 194,431 |
| TRAN | IS.SHP.GOOD.TU | 288 | 12,972,780 | 25,000,180 | 516,698 | 6,586,637 | 186,679,100 |
| TRAN | IS.VHL.COM | 300 | 8074 | 21,318 | 69 | 3388 | 137,043 |
| TRAN | IS.VHL.PSGR | 300 | 20,227 | 26,123 | 796 | 11,067 | 135,882 |
| Target Variable | EN.CO2E.TRAN.KT | 300 | 173,770 | 316,713 | 10,794 | 89,566 | 1,838,933 |
| Country | Correlation Coefficient | Country | Correlation Coefficient | Country | Correlation Coefficient | Features | Correlation Coefficient |
|---|---|---|---|---|---|---|---|
| USA | 0.92 | GBR | −0.03 | SAU | −0.03 | Tier 1 | 0.63 |
| CHN | 0.28 | ITA | −0.03 | TUR | −0.07 | Tier 2 | −0.15 |
| RUS | 0.05 | IDN | −0.04 | EGY | −0.07 | ||
| JPN | 0.03 | ESP | −0.04 | ARG | −0.07 | Developing 0, Developed 1 | 0.23 |
| IND | 0.02 | KOR | −0.05 | POL | −0.08 | Fuel-exporting Countries 1 | 0.14 |
| BRA | 0.01 | AUS | −0.05 | PAK | −0.08 | High Income | 0.18 |
| CAN | 0.00 | THA | −0.06 | NLD | −0.08 | Upper Middle Income | −0.09 |
| MEX | −0.01 | ZAF | −0.07 | UKR | −0.08 | Lower Middle Income | −0.12 |
| IRN | −0.02 | VEN | −0.07 | ARE | −0.08 | ||
| FRA | −0.02 | MYS | −0.07 | KAZ | −0.09 |
| MAE | RMAE | rRMAE | MAPE | ||
|---|---|---|---|---|---|
| OLS_ALL | 0.0111 | 0.0161 | 0.1770 | 0.3132 | 0.9866 |
| SVM_ALL | 0.0069 | 0.0127 | 0.1391 | 0.2144 | 0.9927 |
| GBR_ALL | 0.0061 | 0.0112 | 0.1165 | 0.1408 | 0.9943 |
| OLS_TRAN | 0.0150 | 0.0205 | 0.2312 | 0.4715 | 0.9800 |
| SVM_TRAN | 0.0092 | 0.0150 | 0.1687 | 0.2791 | 0.9896 |
| GBR_TRAN | 0.0067 | 0.0122 | 0.1163 | 0.1355 | 0.9930 |
| OLS_SoEco | 0.0188 | 0.0280 | 0.3207 | 0.5405 | 0.9577 |
| SVM_SoEco | 0.0099 | 0.0159 | 0.1997 | 0.3838 | 0.9880 |
| GBR_SoEco | 0.0091 | 0.0179 | 0.1728 | 0.1491 | 0.9789 |
| MAE | RMAE | rRMSE | MAPE | ||
|---|---|---|---|---|---|
| OLS_ALL | 0.0037 | 0.0050 | 0.1007 | 0.1282 | 0.9783 |
| SVM_ALL | 0.0027 | 0.0046 | 0.0878 | 0.0787 | 0.9805 |
| GBR_ALL | 0.0019 | 0.0025 | 0.1818 | 0.0628 | 0.9948 |
| OLS_TRAN | 0.0027 | 0.0046 | 0.0885 | 0.0814 | 0.9813 |
| SVM_TRAN | 0.0037 | 0.0049 | 0.1015 | 0.1127 | 0.9782 |
| GBR_TRAN | 0.0018 | 0.0024 | 0.1980 | 0.0538 | 0.9950 |
| OLS_SoEco | 0.0098 | 0.0130 | 0.2615 | 0.1086 | 0.8481 |
| SVM_SoEco | 0.0026 | 0.0039 | 0.0738 | 0.0876 | 0.9877 |
| GBR_SoEco | 0.0037 | 0.0064 | 0.2613 | 0.0551 | 0.9244 |
| MAE | RMAE | rRMSE | MAPE | ||
|---|---|---|---|---|---|
| OLS_ALL | 0.0104 | 0.0145 | 0.2217 | 0.3178 | 0.9460 |
| SVM_ALL | 0.0050 | 0.0097 | 0.1465 | 0.1289 | 0.9780 |
| GBR_ALL | 0.0058 | 0.0103 | 0.2959 | 0.4957 | 0.9700 |
| OLS_TRAN | 0.0137 | 0.0182 | 0.2778 | 0.4482 | 0.9124 |
| SVM_TRAN | 0.0070 | 0.0132 | 0.2021 | 0.2098 | 0.9566 |
| GBR_TRAN | 0.0060 | 0.0100 | 0.3015 | 0.1277 | 0.9738 |
| OLS_SoEco | 0.0192 | 0.0271 | 0.4164 | 0.4947 | 0.7917 |
| SVM_SoEco | 0.0086 | 0.0125 | 0.1974 | 0.2444 | 0.9527 |
| GBR_SoEco | 0.0064 | 0.0110 | 0.3872 | 0.1558 | 0.9614 |
Publisher’s Note: MDPI stays neutral with regard to jurisdictional claims in published maps and institutional affiliations. |
© 2022 by the authors. Licensee MDPI, Basel, Switzerland. This article is an open access article distributed under the terms and conditions of the Creative Commons Attribution (CC BY) license (https://creativecommons.org/licenses/by/4.0/).
Share and Cite
Li, X.; Ren, A.; Li, Q. Exploring Patterns of Transportation-Related CO2 Emissions Using Machine Learning Methods. Sustainability 2022, 14, 4588. https://doi.org/10.3390/su14084588
Li X, Ren A, Li Q. Exploring Patterns of Transportation-Related CO2 Emissions Using Machine Learning Methods. Sustainability. 2022; 14(8):4588. https://doi.org/10.3390/su14084588
Chicago/Turabian StyleLi, Xiaodong, Ai Ren, and Qi Li. 2022. "Exploring Patterns of Transportation-Related CO2 Emissions Using Machine Learning Methods" Sustainability 14, no. 8: 4588. https://doi.org/10.3390/su14084588
APA StyleLi, X., Ren, A., & Li, Q. (2022). Exploring Patterns of Transportation-Related CO2 Emissions Using Machine Learning Methods. Sustainability, 14(8), 4588. https://doi.org/10.3390/su14084588