
Investigating a Retrofit Thermal Power Plant from a Sustainable Environment Perspective—A Fuel Lifecycle Assessment Case Study

Abstract
:
1. Introduction
1.1. Policy of Energy Transition in Taiwan
1.2. Use NG for Electricity Generation
1.3. Environmental Footprint of Power Generation
1.4. Purpose of the Study
2. Materials and Methods
2.1. Object and Scope of the Study
2.2. Fuel LCA for Power Generation
2.3. Energy Supply and Use
2.3.1. Scenarios of Energy Supply
2.3.2. Scenarios of Energy Use
2.4. Fuel LCA Emissions
2.4.1. Calculation of Emissions
2.4.2. GHGs
2.4.3. Air Pollutants
3. Results
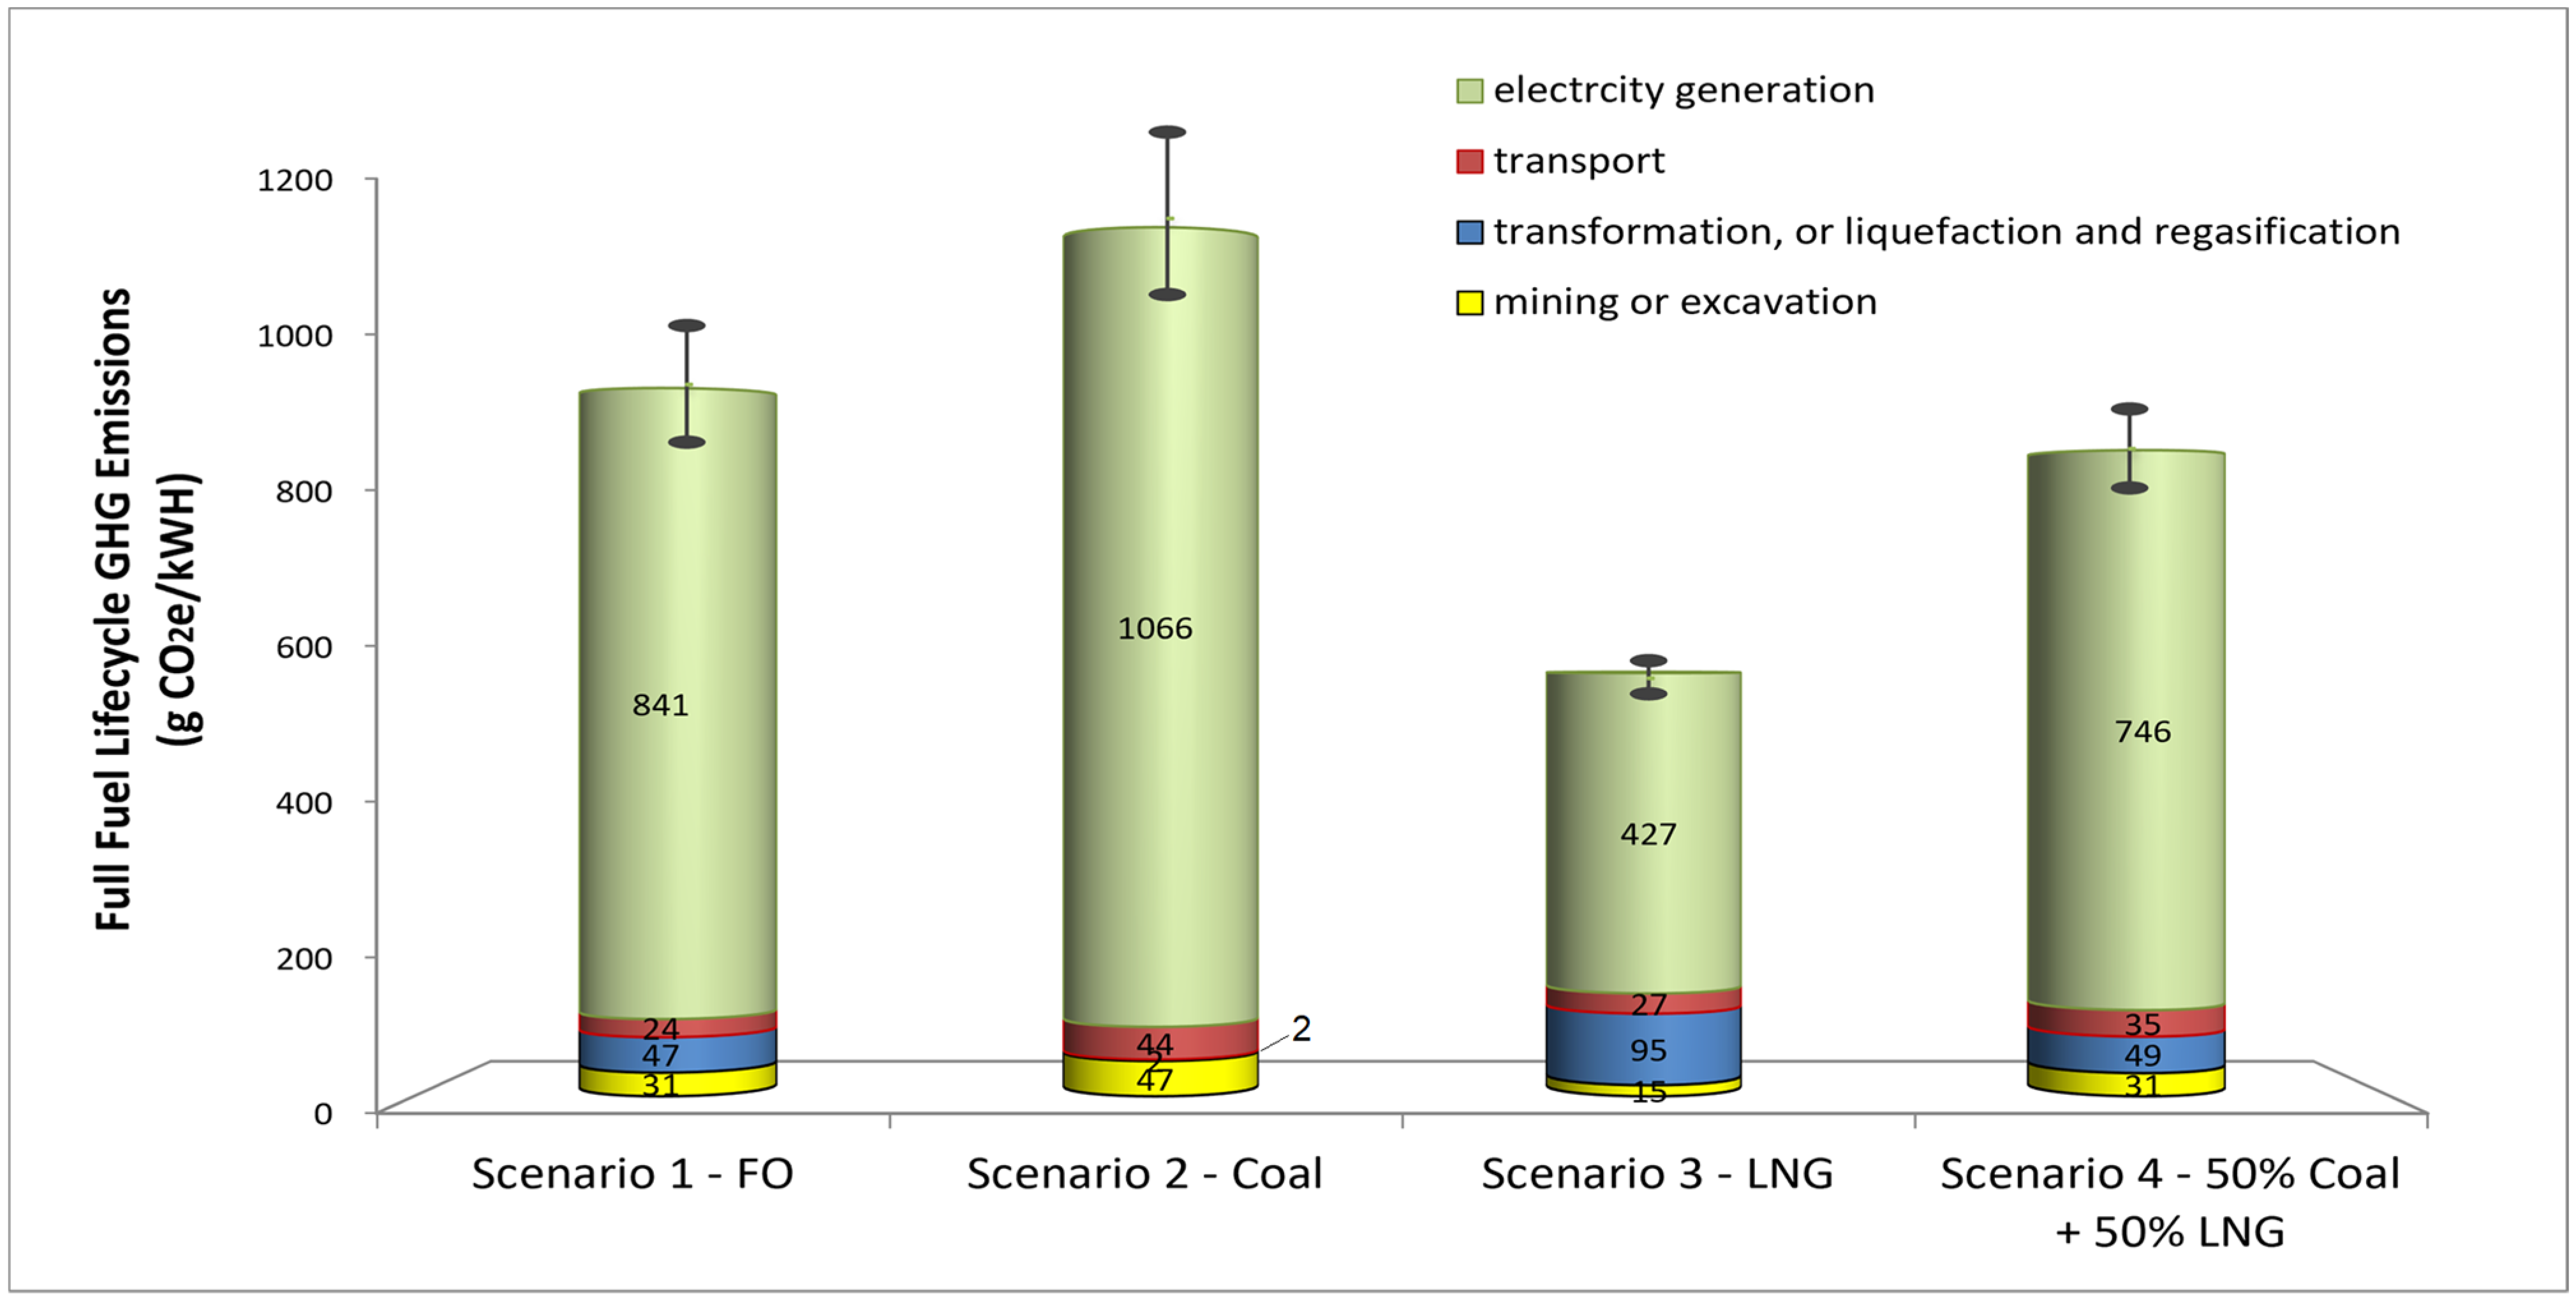
3.1. GHG Emissions
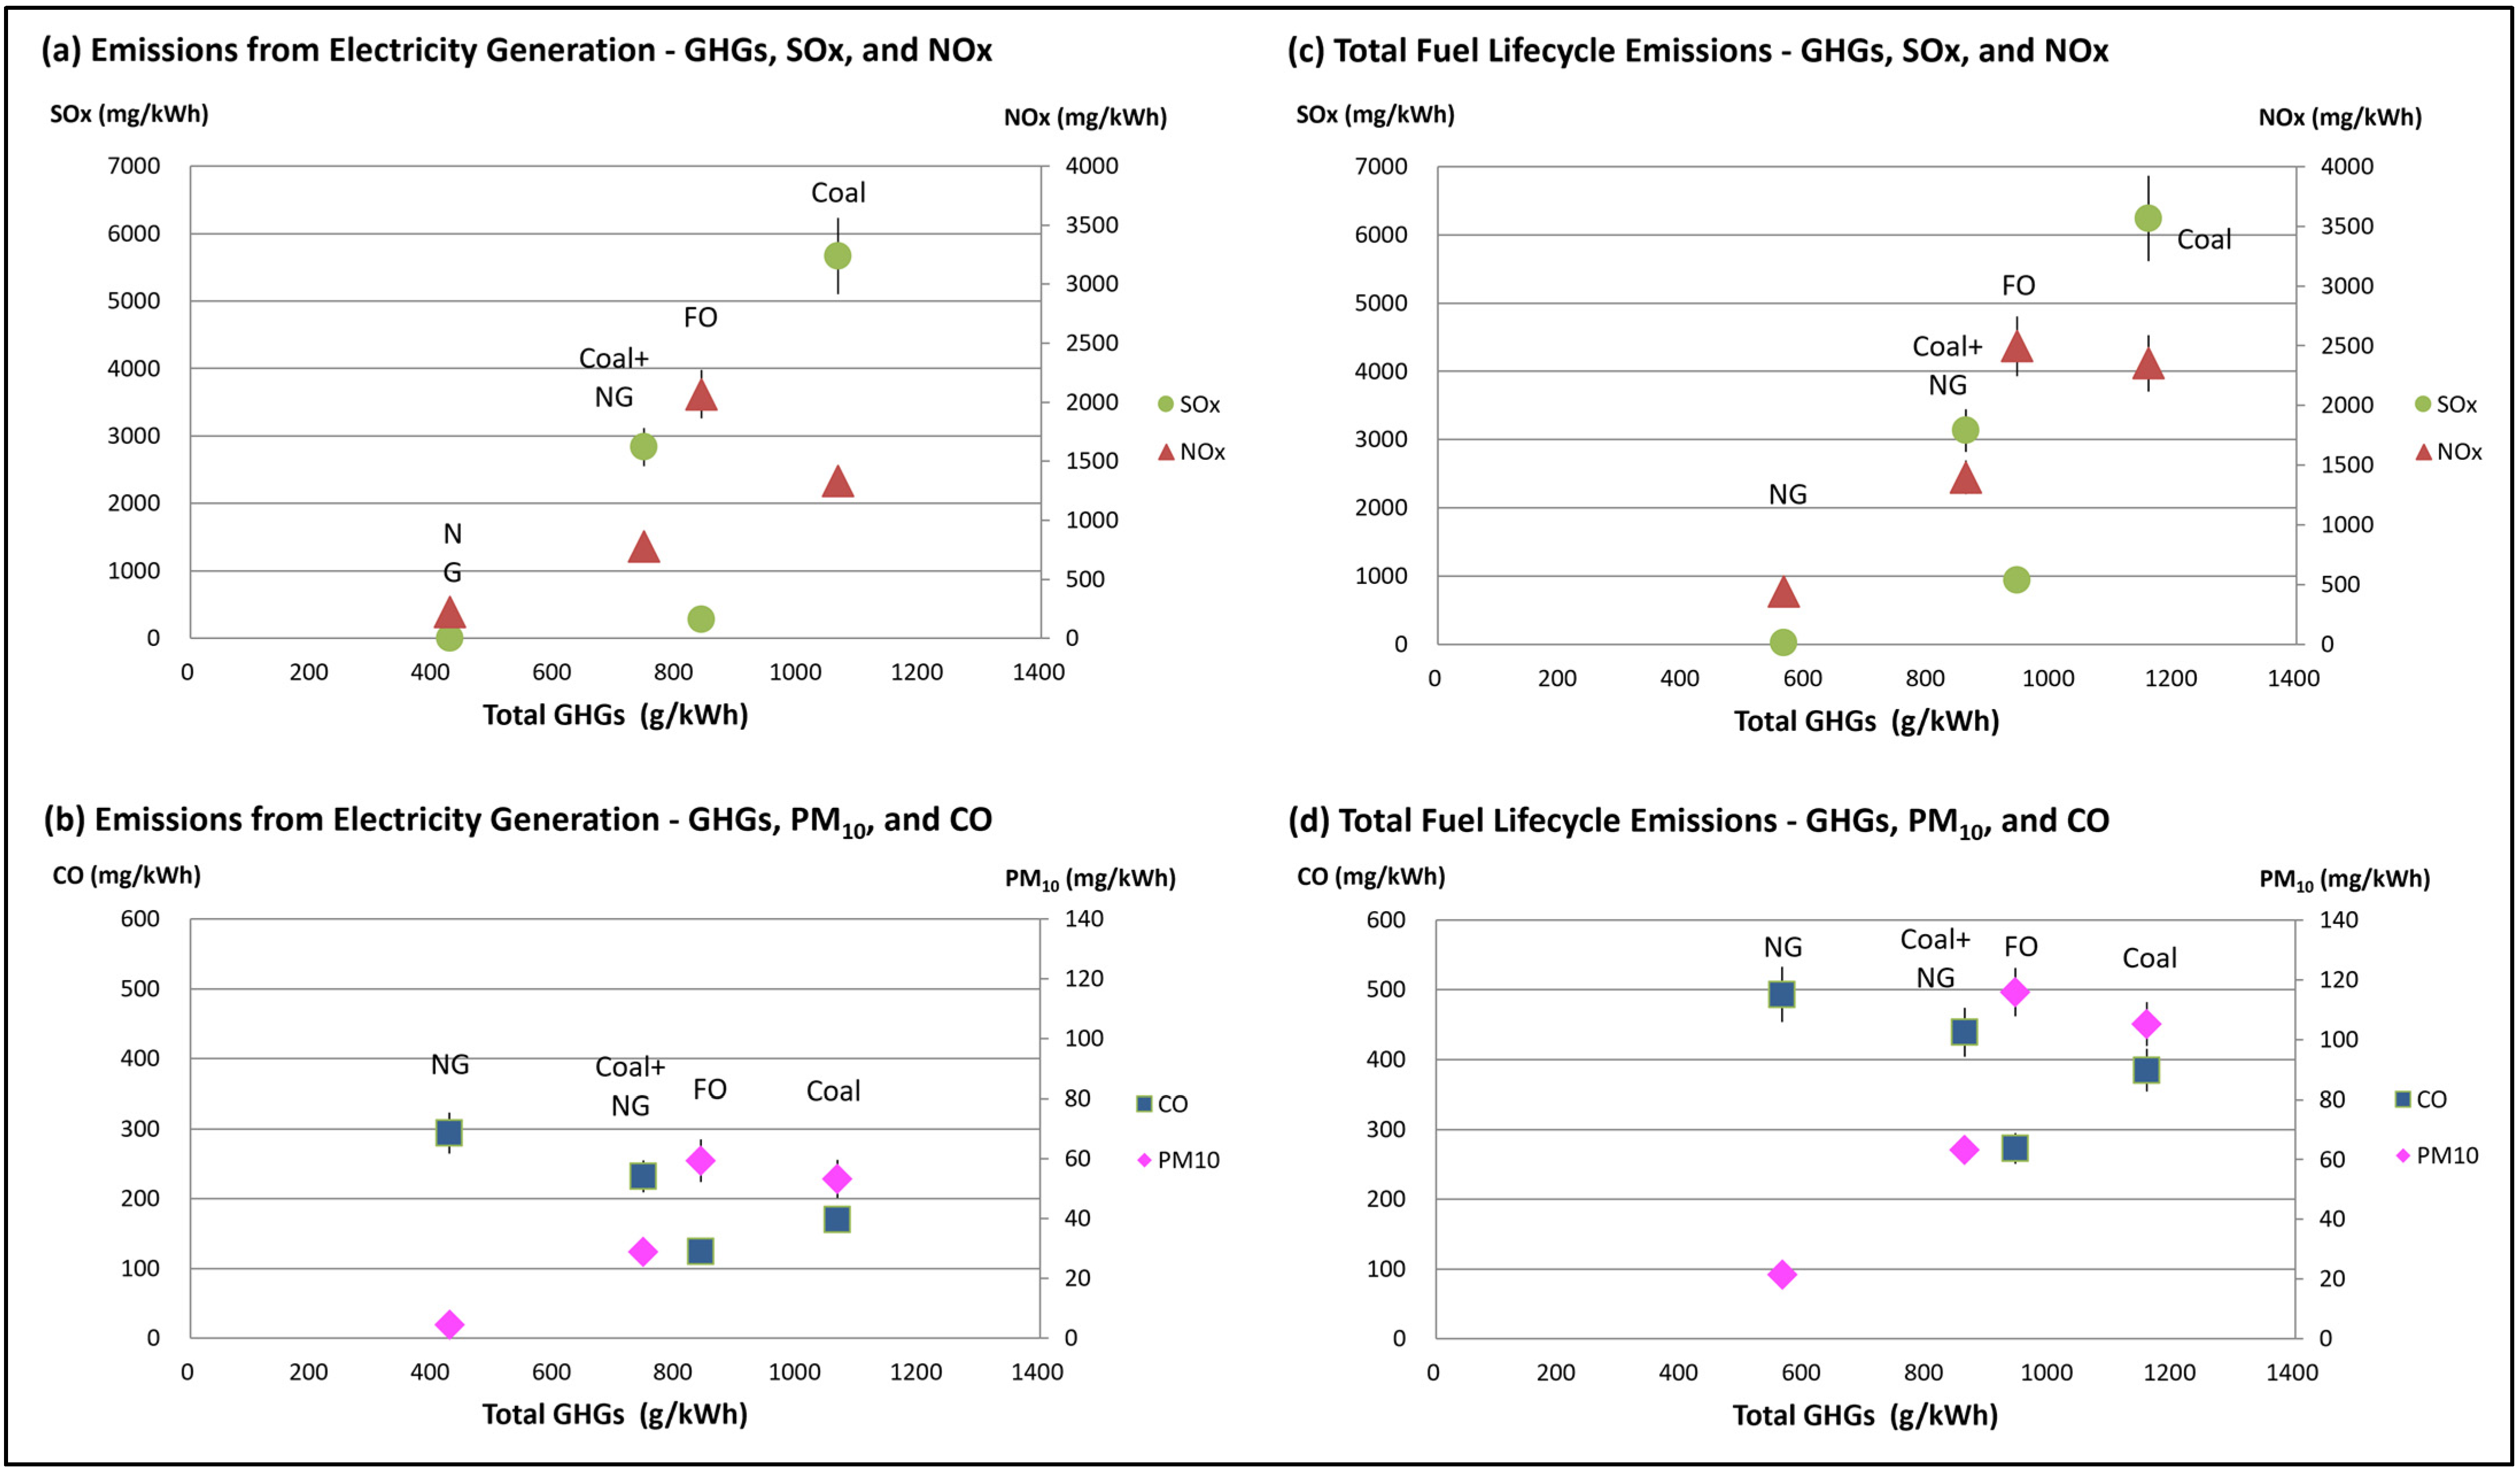
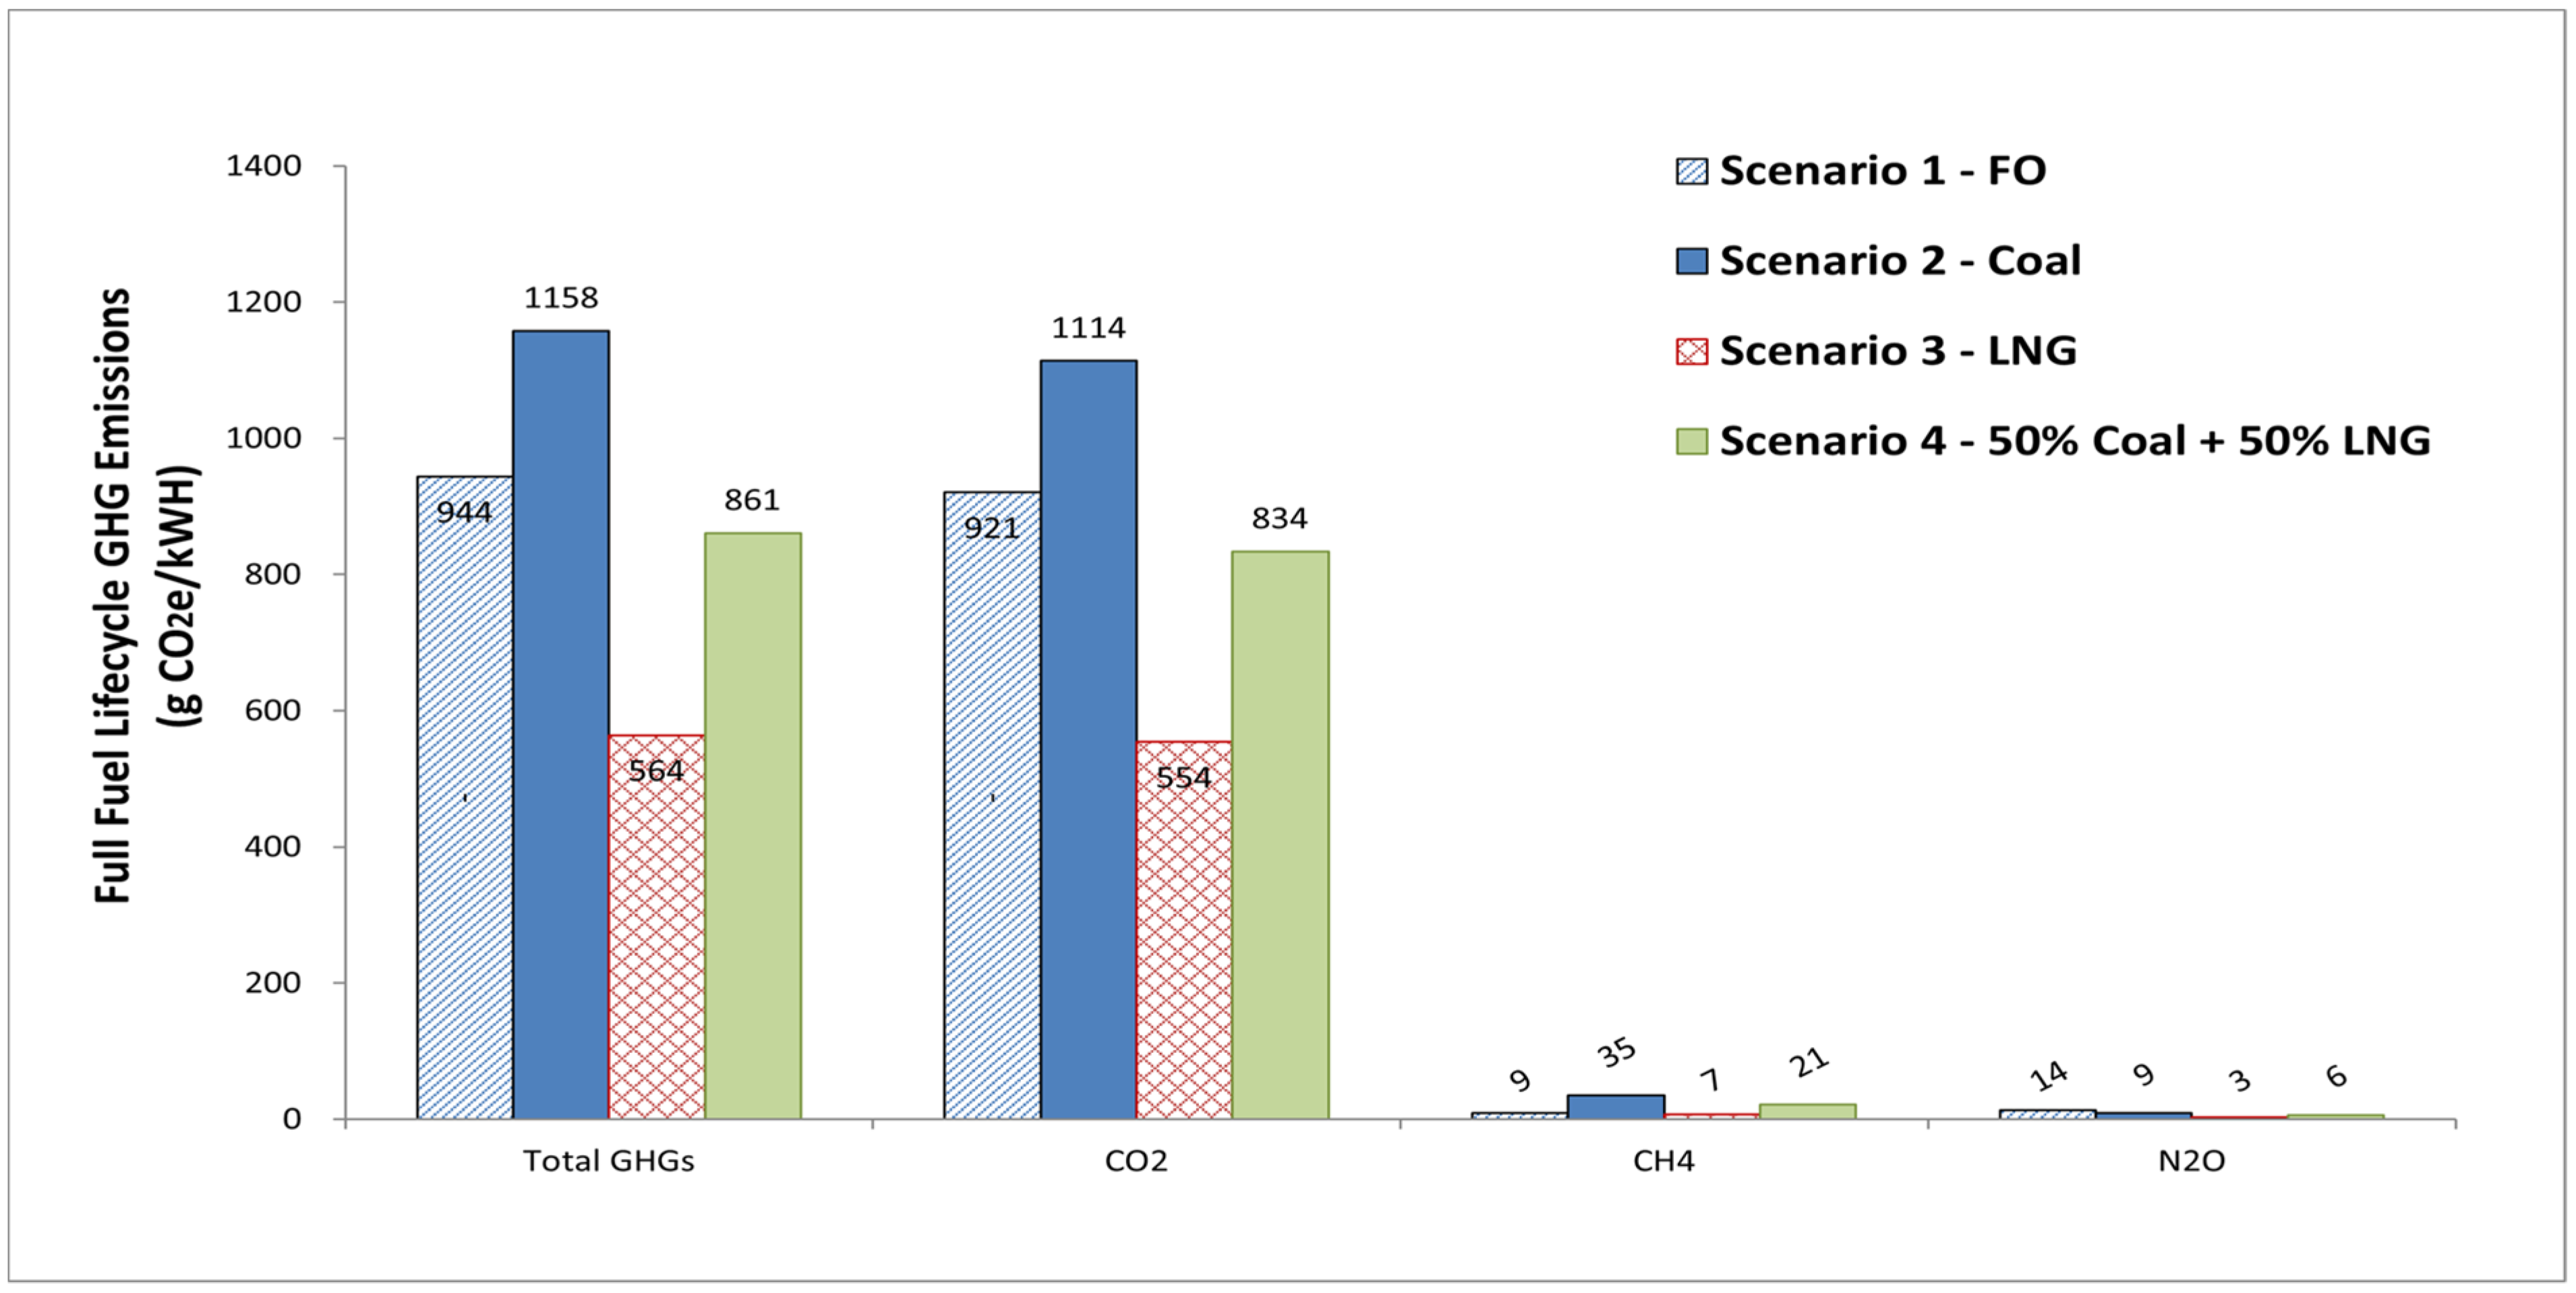
3.1.1. Comparison of Major GHG Emissions across Fuel Choices
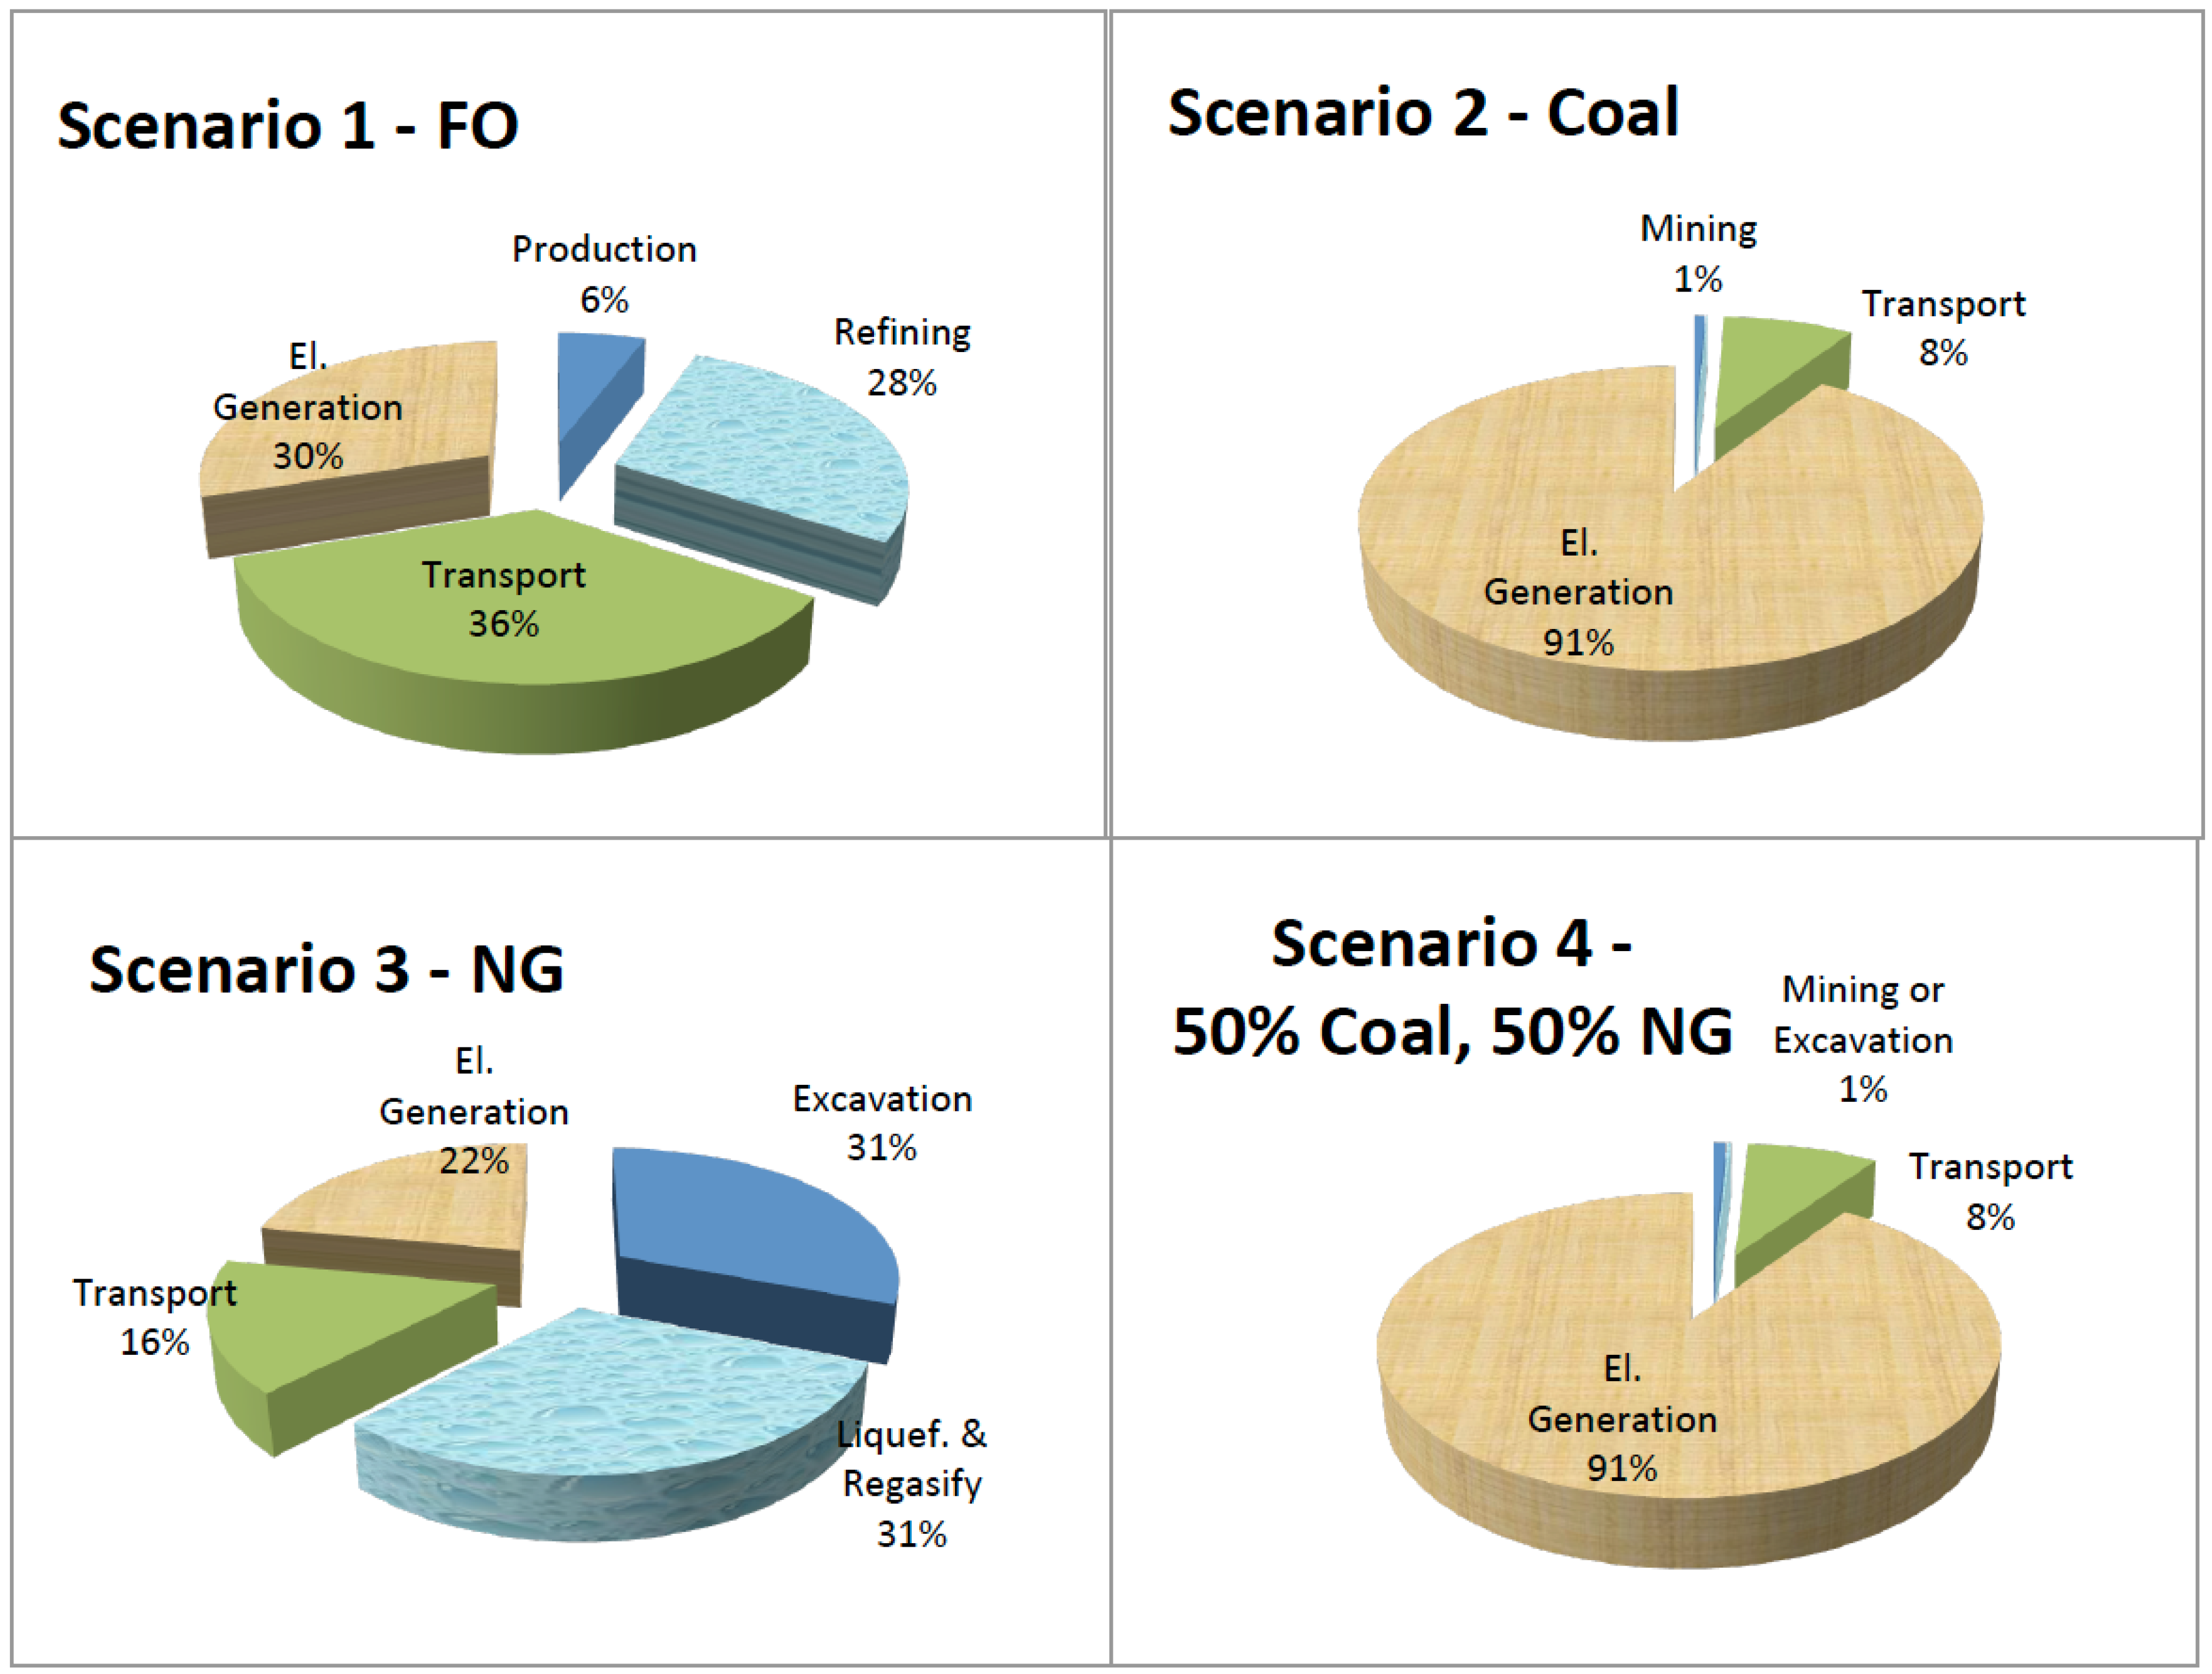
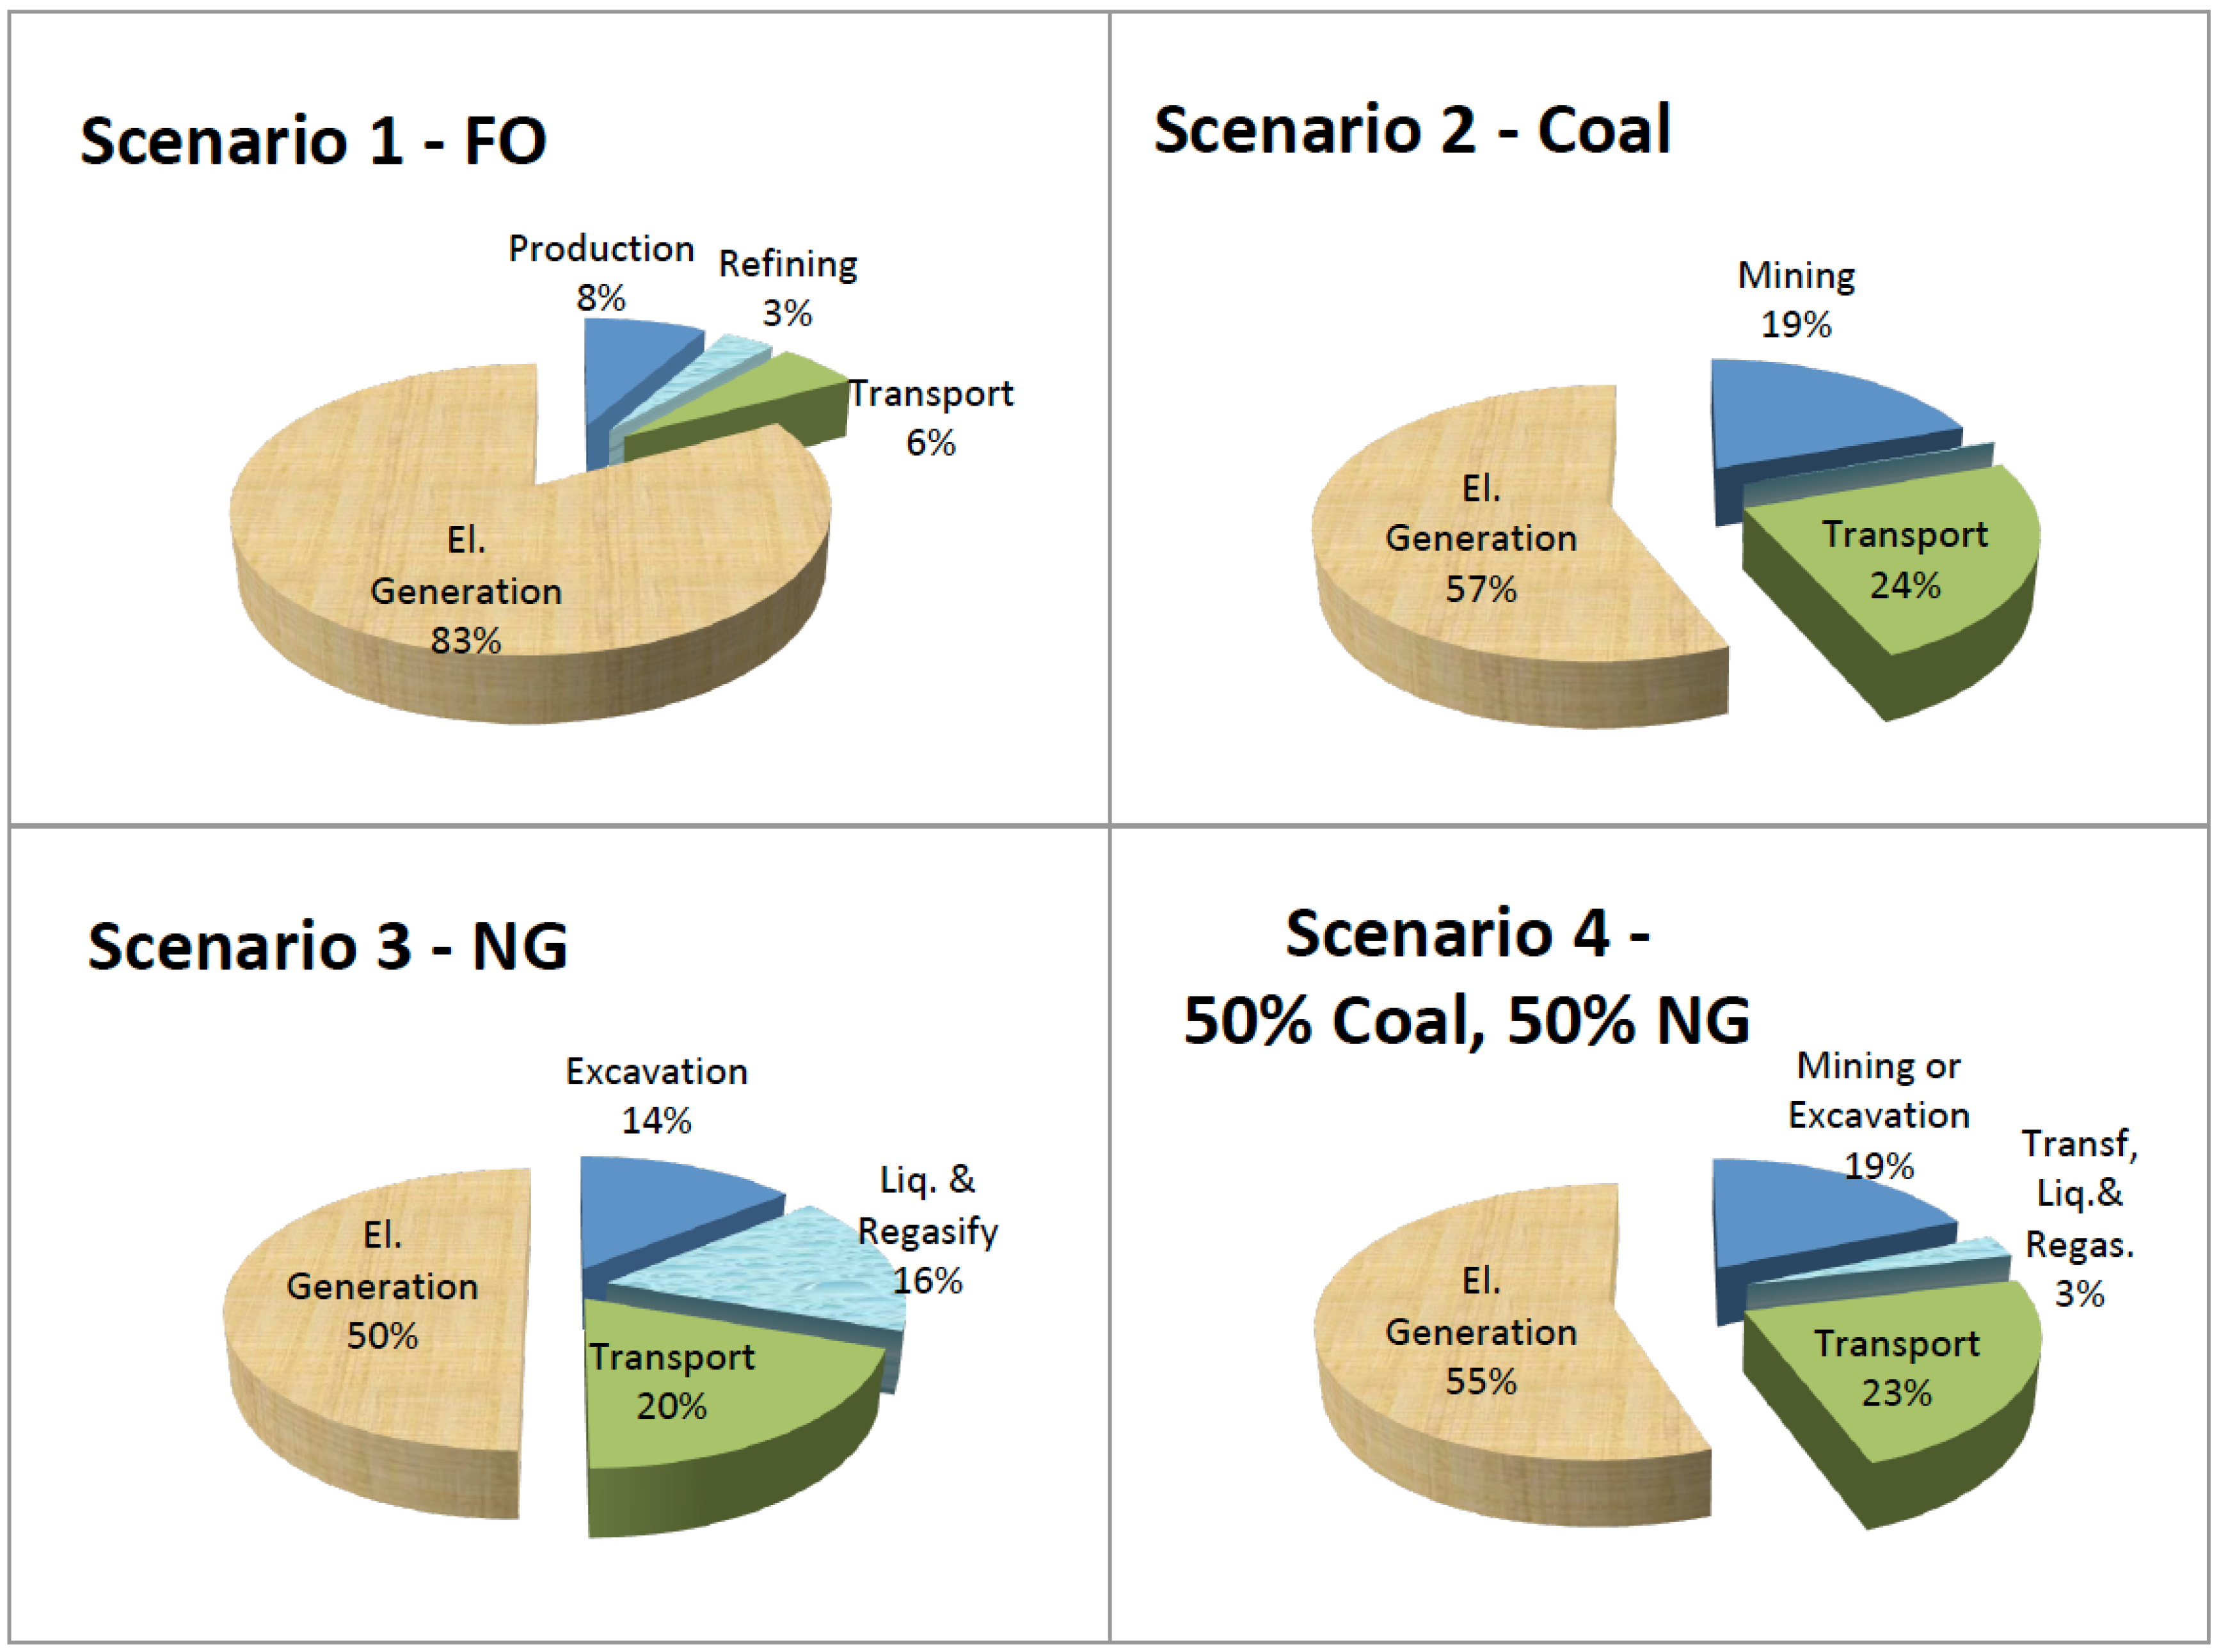
3.1.2. Relative Contribution of Total GHG Emissions from Four Fuel Lifecycle Stages
3.1.3. Analysis of the Four Major Specific GHGs
3.2. Air Pollutants’ Emissions
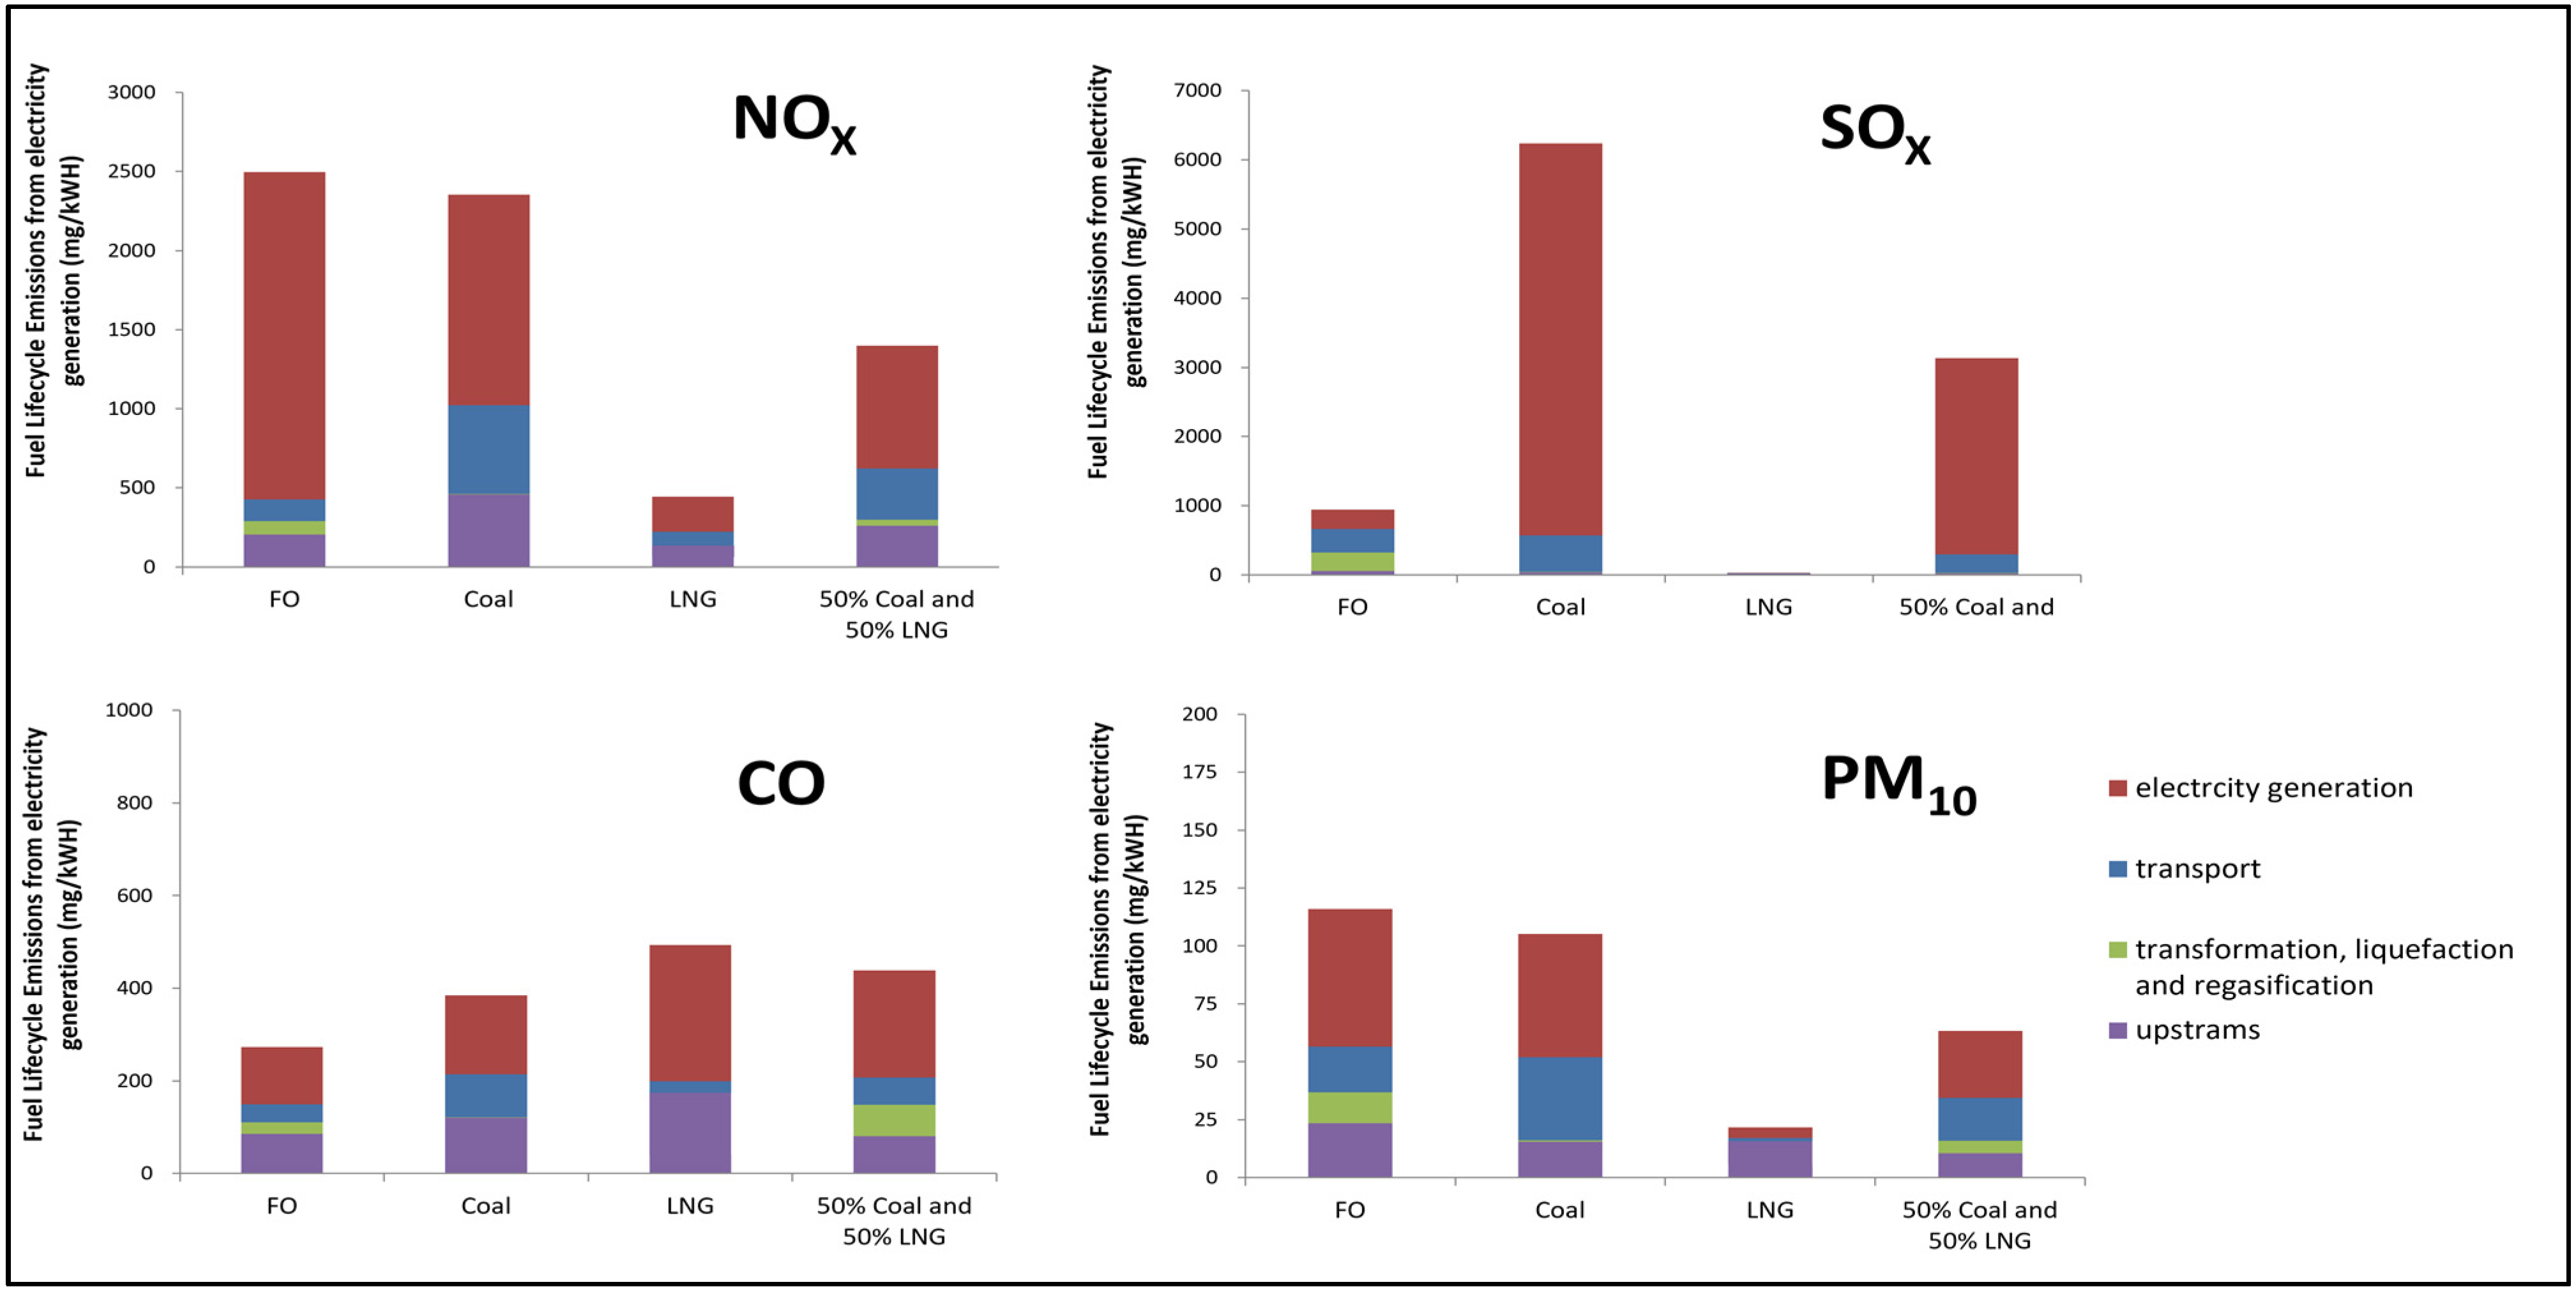
3.2.1. Total Fuel Lifecycle Emissions of Major Air Pollutants
3.2.2. Contribution of Fuel Lifecycle Stages
3.3. Uncertainty Analysis
4. Discussions
4.1. GHG Mitigation through the Fuel Choice for Electricity Generation
4.2. Co-Benefits of Emission Reduction
5. Conclusions
5.1. Sustainable Environment Perspective
5.2. Uncertainties and Limitations
Author Contributions
Funding
Acknowledgments
Conflicts of Interest
Abbreviations
| CH4 | methane |
| CO2 | carbon dioxide |
| CO2e | CO2 equivalent |
| FO | fuel oil |
| GHGs | greenhouse gases |
| GW | gigawatt |
| GWh | gigawatt hour |
| GWP | global warming potential |
| HHPP | Hsieh-ho Power Plant |
| LCA | lifecycle assessment |
| LNG | Liquefied natural gas |
| MW | megawatt |
| MWh | megawatt hour |
| NG | natural gas |
| NGCC | natural gas combined cycle |
| N2O | nitrous oxide |
| NOx | nitrogen oxides |
| PM | particulate matter |
| SF6 | sulfur hexafluoride |
| SOx | sulfuric oxide |
| TPC | Taipower Company |
References
- Bureau of Energy Taiwan. Energy Statistical Annual Reports, 2019 Edition; Bureau of Energy Taiwan: Taipei, Taiwan, 2019.
- EPA Taiwan. 2019 Republic of China National Greenhouse Gas Inventory Report; EPA Taiwan: Taipei, Taiwan, 2019.
- IEA. IEA Countries and Regions-Chinese Taipei. Available online: https://www.iea.org/countries/chinese-taipei (accessed on 17 August 2021).
- Bureau of Energy Taiwan. New Energy Policy of Taiwan. Available online: http://web3.moeaboe.gov.tw/ECW/english/content/Content.aspx?menu_id=969 (accessed on 25 May 2019).
- Abrahams, L.S.; Samaras, C.; Griffin, W.M.; Matthews, H.S. Life Cycle Greenhouse Gas Emissions From U.S. Liquefied Natural Gas Exports: Implications for End Uses. Environ. Sci. Technol. 2015, 49, 3237–3245. [Google Scholar] [CrossRef] [PubMed] [Green Version]
- Hayhoe, K.; Kheshgi, H.S.; Jain, A.K.; Wuebbles, D.J. Substitution of Natural Gas for Coal: Climatic Effects of Utility Sector Emissions. Clim. Chang. 2002, 54, 107–139. [Google Scholar] [CrossRef]
- Mallia, E.; Lewis, G. Life cycle greenhouse gas emissions of electricity generation in the province of Ontario, Canada. Int. J. Life Cycle Assess. 2013, 18, 377–391. [Google Scholar] [CrossRef]
- Marriott, J.; Matthews, H.S.; Hendrickson, C.T. Impact of Power Generation Mix on Life Cycle Assessment and Carbon Footprint Greenhouse Gas Results. J. Ind. Ecol. 2010, 14, 919–928. [Google Scholar] [CrossRef]
- Vandani, A.M.K.; Joda, F.; Bozorgmehry Boozarjomehry, R. Exergic, economic and environmental impacts of natural gas and diesel in operation of combined cycle power plants. Energy Convers. Manag. 2016, 109, 103–112. [Google Scholar] [CrossRef]
- Kong, Z.; Dong, X.; Liu, G. Coal-based synthetic natural gas vs. imported natural gas in China: A net energy perspective. J. Clean. Prod. 2016, 131, 690–701. [Google Scholar] [CrossRef]
- Holladay, J.S.; LaRiviere, J. The impact of cheap natural gas on marginal emissions from electricity generation and implications for energy policy. J. Environ. Econ. Manag. 2017, 85, 205–227. [Google Scholar] [CrossRef]
- Arsalis, A.; Alexandrou, A. Design and modeling of 1–10 MWe liquefied natural gas-fueled combined cooling, heating and power plants for building applications. Energy Build. 2015, 86, 257–267. [Google Scholar] [CrossRef]
- Ghasemiasl, R.; Khalili Abhari, M.; Javadi, M.A.; Ghomashi, H. 4E investigating of a combined power plant and converting it to a multigeneration system to reduce environmental pollutant production and sustainable development. Energy Convers. Manag. 2021, 245, 114468. [Google Scholar] [CrossRef]
- Javadi, M.A.; Khalaji, M.; Ghasemiasl, R. Exergoeconomic and environmental analysis of a combined power and water desalination plant with parabolic solar collector. Desalin. Water Treat. 2020, 193, 212–223. [Google Scholar] [CrossRef]
- Alexopoulos, T.A. The growing importance of natural gas as a predictor for retail electricity prices in US. Energy 2017, 137, 219–233. [Google Scholar] [CrossRef]
- Christensen, T.H.; Gentil, E.; Boldrin, A.; Larsen, A.W.; Weidema, B.P.; Hauschild, M. C balance, carbon dioxide emissions and global warming potentials in LCA-modelling of waste management systems. Waste Manag. Res. 2009, 27, 707–715. [Google Scholar] [CrossRef] [PubMed]
- Guinée, J.B.; Heijungs, R.; Huppes, G.; Zamagni, A.; Masoni, P.; Buonamici, R.; Ekvall, T.; Rydberg, T. Life Cycle Assessment: Past, Present, and Future. Environ. Sci. Technol. 2011, 45, 90–96. [Google Scholar] [CrossRef] [PubMed]
- Guinée, J.B.; Lindeijer, E. Handbook on Life Cycle Assessment: Operational Guide to the ISO Standards; Springer Science & Business Media: Berlin/Heidelberg, Germany, 2002. [Google Scholar]
- ISO-14040; Environmental Management–Life Cycle Assessment–Principles and Framework. International Organization for Standardization: Geneva, Switzerland, 2006.
- Finnveden, G.; Hauschild, M.Z.; Ekvall, T.; Guinée, J.; Heijungs, R.; Hellweg, S.; Koehler, A.; Pennington, D.; Suh, S. Recent developments in Life Cycle Assessment. J. Environ. Manag. 2009, 91, 1–21. [Google Scholar] [CrossRef] [PubMed]
- Corbett, J.J.; Winebrake, J.J. Emissions Tradeoffs among Alternative Marine Fuels: Total Fuel Cycle Analysis of Residual Oil, Marine Gas Oil, and Marine Diesel Oil. J. Air Waste Manag. Assoc. 2008, 58, 538–542. [Google Scholar] [CrossRef] [PubMed]
- Winebrake, J.J.; Corbett, J.J.; Meyer, P.E. Energy Use and Emissions from Marine Vessels: A Total Fuel Life Cycle Approach. J. Air Waste Manag. Assoc. 2007, 57, 102–110. [Google Scholar] [CrossRef] [Green Version]
- Rajović, V.; Kiss, F.; Maravić, N.; Bera, O. Environmental flows and life cycle assessment of associated petroleum gas utilization via combined heat and power plants and heat boilers at oil fields. Energy Convers. Manag. 2016, 118, 96–104. [Google Scholar] [CrossRef]
- Meng, F.; Dillingham, G. Life Cycle Analysis of Natural Gas-Fired Distributed Combined Heat and Power versus Centralized Power Plant. Energy Fuels 2018, 32, 11731–11741. [Google Scholar] [CrossRef]
- Dalir, F.; Shafiepour Motlagh, M.; Ashrafi, K. A Pseudo-Comprehensive LCA Carbon Footprint Model for Fossil Fuel Power Plants (an Iranian Case). Pol. J. Environ. Stud. 2017, 26, 1975–1980. [Google Scholar] [CrossRef]
- Jordaan, S.M.; Combs, C.; Guenther, E. Life cycle assessment of electricity generation: A systematic review of spatiotemporal methods. Adv. Appl. Energy 2021, 3, 100058. [Google Scholar] [CrossRef]
- Šerešová, M.; Štefanica, J.; Vitvarová, M.; Zakuciová, K.; Wolf, P.; Kočí, V. Life Cycle Performance of Various Energy Sources Used in the Czech Republic. Energies 2020, 13, 5833. [Google Scholar] [CrossRef]
- Hondo, H. Life cycle GHG emission analysis of power generation systems: Japanese case. Energy 2005, 30, 2042–2056. [Google Scholar] [CrossRef]
- Ou, X.; Xiaoyu, Y.; Zhang, X. Life-cycle energy consumption and greenhouse gas emissions for electricity generation and supply in China. Appl. Energy 2011, 88, 289–297. [Google Scholar] [CrossRef]
- Ji, S.; Chen, B. LCA-based carbon footprint of a typical wind farm in China. Energy Procedia 2016, 88, 250–256. [Google Scholar] [CrossRef] [Green Version]
- Padey, P.; Blanc, I.; Le Boulch, D.; Xiusheng, Z. A Simplified Life Cycle Approach for Assessing Greenhouse Gas Emissions of Wind Electricity. J. Ind. Ecol. 2012, 16, S28–S38. [Google Scholar] [CrossRef]
- Arteconi, A.; Brandoni, C.; Evangelista, D.; Polonara, F. Life-cycle greenhouse gas analysis of LNG as a heavy vehicle fuel in Europe. Appl. Energy 2010, 87, 2005–2013. [Google Scholar] [CrossRef]
- Goel, V.; Bhat, I.K.; Prakash, R. LCA of renewable energy for electricity generation systems—A review. Renew. Sustain. Energy Rev. 2009, 13, 1067–1073. [Google Scholar] [CrossRef]
- Peng, J.; Lu, L.; Yang, H. Review on life cycle assessment of energy payback and greenhouse gas emission of solar photovoltaic systems. Renew. Sustain. Energy Rev. 2013, 19, 255–274. [Google Scholar] [CrossRef]
- Wang, J.; Yang, Y.; Mao, T.; Sui, J.; Jin, H. Life cycle assessment (LCA) optimization of solar-assisted hybrid CCHP system. Appl. Energy 2015, 146, 38–52. [Google Scholar] [CrossRef]
- Ling-Chin, J.; Roskilly, A.P. Investigating a conventional and retrofit power plant on-board a Roll-on/Roll-off cargo ship from a sustainability perspective–A life cycle assessment case study. Energy Convers. Manag. 2016, 117, 305–318. [Google Scholar] [CrossRef] [Green Version]
- Hua, J.; Wu, Y.; Chen, H. Alternative fuel for sustainable shipping across the Taiwan Strait. Transp. Res. Part D Transp. Environ. 2017, 52, 254–276. [Google Scholar] [CrossRef]
- Taipower Company. Long-Term Power Development Plan. Available online: https://www.taipower.com.tw/en/page.aspx?mid=4488&cid=2796&cchk=27cb6139-c72e-41c1-91b8-bb3f0d5424f9 (accessed on 20 October 2020).
- Thomson, H.; Corbett, J.J.; Winebrake, J.J. Natural gas as a marine fuel. Energy Policy 2015, 87, 153–167. [Google Scholar] [CrossRef] [Green Version]
- Hatch Ltd. Meta-Analysis LCA of Power Generation: Lifecycle Assessment Literature Review of Nuclear, Wind and Natural Gas Power Generation; H345621-236-02 Rev. E.; The Canadian Nuclear Association: Mississauga, ON, Canada, 2014. [Google Scholar]
- Fullenbaum, R.; Fallon, J.; Flanagan, B. Oil & Natural Gas Transportation & Storage Infrastructure: Status, Trends, & Economic Benefits, Report for American Petroleum Institute; IHS Global Inc.: Washington, DC, USA, 2013. [Google Scholar]
- Gullberg, M.; Gahnström, J. Baseline Report, North European LNG Infrastructure Project, A Feasibility Study for an LNG Filling Station Infrastructure and Test of Recommendations; Danish Maritime Authority, ÅF Industry AB; SSPA Sweden AB: Stockholm, Sweden, 2011. [Google Scholar]
- Howarth, R.W.; Santoro, R.; Ingraffea, A. Methane and the greenhouse-gas footprint of natural gas from shale formations. Clim. Chang. 2011, 106, 679. [Google Scholar] [CrossRef] [Green Version]
- Meng, M.; Jing, K.; Mander, S. Scenario analysis of CO2 emissions from China’s electric power industry. J. Clean. Prod. 2017, 142, 3101–3108. [Google Scholar] [CrossRef]
- Bureau of Energy Taiwan. Energy Statistical Annual Report, 2015 Edition; Bureau of Energy Taiwan: Taipei, Taiwan, 2015.
- USEIA. Electric Power Annual 2015; USEIA: Washington, DC, USA, 2016.
- Hardisty, P.E.; Clark, T.S.; Hynes, R.G. Life Cycle Greenhouse Gas Emissions from Electricity Generation: A Comparative Analysis of Australian Energy Sources. Energies 2012, 5, 872–897. [Google Scholar] [CrossRef] [Green Version]
- Harrison, M.; Shires, T.; Wessels, J.; Cowgill, R. Methane Emissions from the Natural Gas Industry; Final Report; Gas Research Institute and Environmental Protection Agency: Washington, DC, USA, 1996; Volumes 1–15.
- IPCC. Climate Change 2007-the Physical Science Basis: Working Group I Contribution to the Fourth Assessment Report of the IPCC; Solomon, S., Manning, M., Marquis, M., Qin, D., Eds.; Intergovernmental Panel on Climate Change: New York, NY, USA; Cambridge University Press: Cambridge, UK, 2007; Volume 4, p. 996. [Google Scholar]
- Bohnengel, B.; Patiño-Echeverri, D.; Bergerson, J. Environmental Implications of United States Coal Exports: A Comparative Life Cycle Assessment of Future Power System Scenarios. Environ. Sci. Technol. 2014, 48, 9908–9916. [Google Scholar] [CrossRef]
- Hughes, J.D. Lifecycle Greenhouse Gas Emissions from Shale Gas Compared to Coal: An Analysis of Two Conflicting Studies. Available online: https://www.postcarbon.org/publications/life-cycle-ghg-shale-gas/ (accessed on 29 December 2016).
- Pershing, D.W.; Wendt, J.O.L. Pulverized coal combustion: The influence of flame temperature and coal composition on thermal and fuel NOx. Symp. Combust. 1977, 16, 389–399. [Google Scholar] [CrossRef]
- Burnham, A.; Han, J.; Clark, C.E.; Wang, M.; Dunn, J.B.; Palou-Rivera, I. Life-Cycle Greenhouse Gas Emissions of Shale Gas, Natural Gas, Coal, and Petroleum. Environ. Sci. Technol. 2012, 46, 619–627. [Google Scholar] [CrossRef]
- Heath, G.A.; O’Donoughue, P.; Arent, D.J.; Bazilian, M. Harmonization of initial estimates of shale gas life cycle greenhouse gas emissions for electric power generation. Proc. Natl. Acad. Sci. USA 2014, 111, E3167–E3176. [Google Scholar] [CrossRef] [Green Version]
- Liu, C.H.; Lin, S.J.; Lewis, C. Evaluation of NOx, SOx and CO2 Emissions of Taiwan’s Thermal Power Plants by Data Envelopment Analysis. Aerosol Air Qual. Res. 2013, 13, 1815–1823. [Google Scholar] [CrossRef] [Green Version]
- Obringer, R.; Mukherjee, S.; Nateghi, R. Evaluating the climate sensitivity of coupled electricity-natural gas demand using a multivariate framework. Appl. Energy 2020, 262, 114419. [Google Scholar] [CrossRef]
- Turconi, R.; Boldrin, A.; Astrup, T. Life cycle assessment (LCA) of electricity generation technologies: Overview, comparability and limitations. Renew. Sustain. Energy Rev. 2013, 28, 555–565. [Google Scholar] [CrossRef] [Green Version]
- Taipower Company. Linkou Lily Eco Power Plant. Yuan Mag. 2018, 129, 4–9. (In Chinese) [Google Scholar]
- EPA Taiwan. Intended Nationally Determined Contribution Submission by Republic of China (Taiwan). Available online: https://enews.epa.gov.tw/Page/3B3C62C78849F32F/f328b652-4540-4a24-94fb-21eb17845f43 (accessed on 21 October 2020).
- MOEA Taiwan. Energy Transition White Paper-Draft; MOEA: Taipei, Taiwan, 2018. (In Chinese)
- MOEA Taiwan. Energy Transition Promotion Scheme-Promote Green Energy, Increase Nature Gas, Reduce Coal-fired, Achieve Nuclear-Free. Available online: https://www.moea.gov.tw/MNS/english/Policy/Policy.aspx?menu_id=32904&policy_id=19 (accessed on 21 October 2020).
- UNECE. The Co-Benefits of Climate Change Mitigation; Sustainability Development Briefs No. 2; UNECE: Geneva, Switzerland, 2016. [Google Scholar]
- Bollen, J.; Guay, B.; Jamet, S.; Corfee-Morlot, J. Co-Benefits of Climate Change Mitigation Policies; ECO/WKP(2009)34; OECD: Paris, France, 2009. [Google Scholar]
- Pope, C.A., III; Burnett, R.T.; Thun, M.J.; Calle, E.E.; Krewski, D.; Ito, K.; Thurston, G.D. Lung Cancer, Cardiopulmonary Mortality, and Long-term Exposure to Fine Particulate Air Pollution. JAMA 2002, 287, 1132–1141. [Google Scholar] [CrossRef] [Green Version]
- Adamchak, F.; Adede, A. LNG as marine fuel. In Proceedings of the 17th International Conference and Exhibition on Liquified Natural Gas (LNG 17), Houston, TX, USA, 16–19 April 2013. [Google Scholar]
- Jayadev, G.; Leibowicz, B.D.; Kutanoglu, E. US electricity infrastructure of the future: Generation and transmission pathways through 2050. Appl. Energy 2020, 260, 114267. [Google Scholar] [CrossRef]
- Venkatesh, A.; Jaramillo, P.; Griffin, W.M.; Matthews, H.S. Uncertainty in Life Cycle Greenhouse Gas Emissions from United States Natural Gas End-Uses and its Effects on Policy. Environ. Sci. Technol. 2011, 45, 8182–8189. [Google Scholar] [CrossRef]
- Venkatesh, A.; Jaramillo, P.; Griffin, W.M.; Matthews, H.S. Uncertainty in Life Cycle Greenhouse Gas Emissions from United States Coal. Energy Fuels 2012, 26, 4917–4923. [Google Scholar] [CrossRef]
- Venkatesh, A.; Jaramillo, P.; Griffin, W.M.; Matthews, H.S. Uncertainty Analysis of Life Cycle Greenhouse Gas Emissions from Petroleum-Based Fuels and Impacts on Low Carbon Fuel Policies. Environ. Sci. Technol. 2011, 45, 125–131. [Google Scholar] [CrossRef]


| Current—Fuel-Oil-Fired | Alternative 1—Coal-Fired 1 | Alternative 2—NGCC 2 |
|---|---|---|
|
|
|
| Scenario Number | Fuel | Route | Means of Transport | Distance (km) |
|---|---|---|---|---|
| Scenario 1 | FO | Crude imported from Yanbu, Saudi Arabia, unloaded at Taoyuan, and refined FO piped to the power plant | Pipeline, Hawiyah (in Ghawer oil field), to Abqaiq, Saudi Arabia | 158 |
| Pipeline, Abqaiq plant to Port of Yanbu (746 miles, 56-inch pipeline) | 1200 | |||
| Crude oil tanker from King Fahad Industrial Port (Yanbu) to Ta-Lin-Pu Offshore Oil Terminal (Kaohsiung) | 12,823 | |||
| Crude oil pipeline from Ta-Lin-Pu Offshore Oil Terminal (Kaohsiung) to Ta-Lin Refinery, round trip | 4 | |||
| FO tanker from Ta-Lin-Pu Offshore Oil Terminal (Kaohsiung) to HHPP | 414 | |||
| Oil pipeline from the terminal at Hsieh-ho (Keelung) to the power plant | 1 | |||
| Scenario 2 | Coal | Coal imported from Hunter Valley, Australia, unloaded at Keelung | Rail freighter average distance from Hunter Valley Coal Area to Kooragang coal terminal of the port of Newcastle | 128 |
| Bulk carriers from Newcastle, Australia, to Keelung, Taiwan | 7848 | |||
| Coal conveyer form the terminal at Hsieh-ho (Keelung) to the power plant | 0.2 | |||
| Scenario 3 | NG | LNG imported from Australia, unloaded and stored at the LNG terminal near Keelung port, then piped to HHPP | Pipe from the Northwest Shelf to the liquefaction facility in Port Dampier | 150 |
| The LNG carrier from Port Dampier to the LNG terminal at HHPP, near Keelung port | 6358 | |||
| LNG pipeline from the terminal to HHPP | 0.2 |
| Fuel | Heat Content of Fuel 1 | Amount of Fuel Used to Generate 1 kWh | kWh Generated/Fuel Used | Power Plant Heat Rates 2 |
|---|---|---|---|---|
| Coal | 5368 kCal/kg | 0.4895 kg | 1853 kWh/ton | 10,428 Btu/kWh |
| Natural Gas | 9000 kCal/m3 | 0.2214 m3 (gas mode), or 0.1677 kg (LNG) | 128 kWh/Mcf | 7907 Btu/kWh |
| Fuel Oil | 9600 kCal/L | 0.284 L or 0.271 kg | 560 kWh/barrel | 10,814 Btu/kWh |
| Types of Emissions | Fuel Source for the Power Plants | ||
|---|---|---|---|
| Fuel Oil | Coal | Natural Gas | |
| CO2 (kg/GJ) | 74.61791 | 95.2 | 50.8 |
| CH4 (kg/GJ) | 0.0053191 | 0.00076 | 0.00094 |
| N2O (kg/GJ) | 0.004 | 0.00221 | 0.001 |
| NOx (kg/GJ) | 0.187 | 0.119 | 0.0264 |
| SO2 (kg/GJ) | 0.025 | 0.513 | 0.000646 |
| CO (kg/GJ) | 0.01 | 0.01 | 0.0351 |
| PM10 (kg/GJ) | 0.0050000 | 0.003809 | 0.0005 |
| Scenario 1—FO Produced from Crude Imported from Saudi Arabia | ||||||||||
|---|---|---|---|---|---|---|---|---|---|---|
| Total | % | Crude Production | % | Refining | % | Transport | % | Electricity Generation | % | |
| GHG | 943.811 | (100%) | 31.484 | (3%) | 47.244 | (5%) | 24.094 | (3%) | 840.990 | (89%) |
| CO2 | 920.616 | (100%) | 25.571 | (3%) | 45.525 | (5%) | 23.294 | (3%) | 826.226 | (90%) |
| CH4 | 9.280 | (100%) | 5.539 | (60%) | 1.539 | (17%) | 0.587 | (6%) | 1.614 | (17%) |
| N2O | 13.729 | (100%) | 0.254 | (2%) | 0.150 | (1%) | 0.185 | (1%) | 13.141 | (96%) |
| SF6 | 0.049 | (100%) | 0.005 | (9%) | 0.020 | (42%) | 0.023 | (47%) | 0.001 | (2%) |
| Scenario 2—Coal Imported from Australia | ||||||||||
| Total | % | Mining | % | Transformation and Storage | % | Transport | % | Electricity Generation | % | |
| GHG | 1158.079 | (100%) | 47.014 | (4%) | 1.872 | (0%) | 43.633 | (4%) | 1065.560 | (92%) |
| CO2 | 1113.821 | (100%) | 12.114 | (1%) | 1.770 | (0%) | 42.425 | (4%) | 1057.512 | (95%) |
| CH4 | 35.202 | (100%) | 33.551 | (95%) | 0.079 | (0%) | 0.845 | (2%) | 0.727 | (2%) |
| N2O | 8.824 | (100%) | 1.196 | (14%) | 0.017 | (0%) | 0.327 | (4%) | 7.284 | (83%) |
| SF6 | 0.036 | (100%) | 0.002 | (6%) | 0.006 | (16%) | 0.024 | (67%) | 0.004 | (11%) |
| Scenario 3—LNG Imported from Australia | ||||||||||
| Total | % | Excavation | % | Liquefaction and Regasification | % | Transport | % | Electricity Generation | % | |
| GHG | 564.015 | (100%) | 14.740 | (3%) | 95.420 | (17%) | 26.857 | (5%) | 426.997 | (76%) |
| CO2 | 554.133 | (100%) | 14.017 | (3%) | 89.711 | (16%) | 26.111 | (5%) | 424.294 | (77%) |
| CH4 | 7.081 | (100%) | 0.633 | (9%) | 5.641 | (80%) | 0.599 | (8%) | 0.208 | (3%) |
| N2O | 2.771 | (100%) | 0.081 | (3%) | 0.062 | (2%) | 0.139 | (5%) | 2.489 | (90%) |
| SF6 | 0.012 | (100%) | 0.004 | (34%) | 0.004 | (36%) | 0.003 | (29%) | 0.000 | (1%) |
| Scenario 4—50% Coal and 50% LNG | ||||||||||
| Total | % | Mining or Excavation | % | Transformation, Liquefaction and Regasification | % | Transport | % | Electricity Generation | % | |
| GHG | 861.047 | (100%) | 30.877 | (4%) | 48.646 | (6%) | 35.245 | (4%) | 746.279 | (87%) |
| CO2 | 833.977 | (100%) | 13.066 | (2%) | 45.741 | (5%) | 34.268 | (4%) | 740.903 | (89%) |
| CH4 | 21.141 | (100%) | 17.092 | (81%) | 2.860 | (14%) | 0.722 | (3%) | 0.467 | (2%) |
| N2O | 5.797 | (100%) | 0.638 | (11%) | 0.039 | (1%) | 0.233 | (4%) | 4.886 | (84%) |
| SF6 | 0.024 | (100%) | 0.003 | (13%) | 0.005 | (21%) | 0.014 | (58%) | 0.002 | (8%) |
| Fuel Source | Total GHG | CO2 | CH4 | N2O | SF6 | |||||
|---|---|---|---|---|---|---|---|---|---|---|
| FO | 869–1020 | (0.039) | 848–997 | (0.039) | 5.7–14.9 | (0.257) | 3.9–37.8 | (0.630) | 0.03–0.075 | (0.229) |
| Coal | 1060–1270 | (0.047) | 1020–1230 | (0.046) | 16.8–73.0 | (0.407) | 4.7–15.4 | (0.295) | 0.02–0.06 | (0.288) |
| LNG | 544–587 | (0.018) | 535–577 | (0.019) | 5.2–9.8 | (0.162) | 1.1–7.8 | (0.546) | 0.007–0.019 | (0.265) |
| 50% Coal, 50% NG | 810–912 | (0.031) | 785–884 | (0.032) | 12.1–36.6 | (0.275) | 3.4–9.1 | (0.247) | 0.014–0.041 | (0.266) |
| Fuel Source | NOx | SO2 | CO | PM10 | ||||
|---|---|---|---|---|---|---|---|---|
| FO | 1740–3710 | (0.195) | 699–1560 | (0.273) | 137–540 | (0.368) | 64–202 | (0.306) |
| Coal | 1940–2770 | (0.092) | 5350–7240 | (0.077) | 204–758 | (0.359) | 62–171 | (0.267) |
| LNG | 259–843 | (0.327) | 21–42 | (0.206) | 239–915 | (0.369) | 12–40 | (0.345) |
| 50% Coal, 50% NG | 1150–1710 | (0.101) | 2620–3720 | (0.088) | 272–735 | (0.277) | 40–102 | (0.244) |
Publisher’s Note: MDPI stays neutral with regard to jurisdictional claims in published maps and institutional affiliations. |
© 2022 by the authors. Licensee MDPI, Basel, Switzerland. This article is an open access article distributed under the terms and conditions of the Creative Commons Attribution (CC BY) license (https://creativecommons.org/licenses/by/4.0/).
Share and Cite
Wu, Y.; Hua, J. Investigating a Retrofit Thermal Power Plant from a Sustainable Environment Perspective—A Fuel Lifecycle Assessment Case Study. Sustainability 2022, 14, 4556. https://doi.org/10.3390/su14084556
Wu Y, Hua J. Investigating a Retrofit Thermal Power Plant from a Sustainable Environment Perspective—A Fuel Lifecycle Assessment Case Study. Sustainability. 2022; 14(8):4556. https://doi.org/10.3390/su14084556
Chicago/Turabian StyleWu, Yihsuan, and Jian Hua. 2022. "Investigating a Retrofit Thermal Power Plant from a Sustainable Environment Perspective—A Fuel Lifecycle Assessment Case Study" Sustainability 14, no. 8: 4556. https://doi.org/10.3390/su14084556
APA StyleWu, Y., & Hua, J. (2022). Investigating a Retrofit Thermal Power Plant from a Sustainable Environment Perspective—A Fuel Lifecycle Assessment Case Study. Sustainability, 14(8), 4556. https://doi.org/10.3390/su14084556