Article

Dynamic Coupling Trajectory and Spatial-Temporal Characteristics of High-Quality Economic Development and the Digital Economy

1
College of Economics, Hebei GEO University, Shijiazhuang 050031, China
2
Strategic Research Center for Military-Civilian Integration, Northwestern Polytechnical University, Xi’an 710072, China
3
College of Land Management, Huazhong Agricultural University, Wuhan 430070, China
*
Author to whom correspondence should be addressed.
Sustainability 2022, 14(8), 4543; https://doi.org/10.3390/su14084543
Submission received: 1 March 2022 / Revised: 7 April 2022 / Accepted: 8 April 2022 / Published: 11 April 2022

Abstract

:
This paper takes China’s 2014–2019 provincial data as the observation sample to explore the dynamic coupling law of the digital economy and high-quality economic development. First, using the coupling coordination model, it is found that the coupling coordination degree of the digital economy and high-quality economic growth is on an upward trend, and the coupling coordination degree in the eastern region is higher than that in other regions; then, using Markov chain algorithm, it is found that the coupling coordination degree in the east of region achieves a two-level leap of “antagonism stage-running-in stage-coordination stage”, while the central and western regions accomplish a single level of “antagonism stage-running-in stage” leap. Finally, using the Dagum Gini coefficient decomposition method, it was found that the mean values of inter-regional, intra-regional, and supervariate density differences in coupling coordination contributed 67.60%, 24.03%, and 8.36% to the overall differences, respectively, with highly moderate fluctuations. The general, inter-regional and intra-regional differences all show a decreasing trend, but there is heterogeneity in their corresponding variation characteristics. This paper provides substantial empirical evidence for exploring the inherent laws and provides an essential guarantee for China’s regional economy’s comprehensive, coordinated, and sustainable development.

1. Introduction

Along with the rapid development of modern information technology such as the internet, cloud computing, blockchain, and the Internet of Things, the digital economy has emerged as a powerful driving force for the sustainable development of the global economy. In 2019, digital economy measurement of 47 countries around the world found that the scale of the digital economy grew 3% year-on-year, higher than the GDP growth rate of 2.8% during the same period, accounting for about 43.7% of GDP. The U.S. digital economy development scale is far ahead, with nearly 13.6 trillion U.S. dollars; the U.S., Britain, and Germany digital economy GDP accounted for more than 60%. Indeed, the digital economy is a vital force for the green and sustainable development of our regional economy and has become a key pillar to support the green growth of our economy, according to the Digital Economy Report 2020, the volume of global export of digital services reached US $31.93 trillion in 2019, 1.74 times higher than in 2008, with an average annual growth of 7.47%. During the same period, the proportion of the digital economy in the gross domestic product (GDP) of China increased from 9.85% in 2008 to 36.23% in 2019, thus indicating the important reliance on the digital economy for achieving high quality and transforming the mode of economic development. Owing to the high resource allocation efficiency and remarkably improved product quality, the digital economy has become an important technical support for China to catch up with the developed countries with their powerful data processing capability. Thus, it has also become a vital growth point for the innovative economy of China. Meanwhile, in the post-international financial crisis period, the status quo of sluggish global demand was hard to change, and it is in this context that China’s economy moved from the stage of high-speed growth to the stage of high-quality development, aimed at successfully achieving this leap; this requires a sustained driving force, and if it is insufficient, China’s economic growth will eventually fall into the “middle-income trap” [1]. Therefore, there is an urgent need to change from the original investment-driven model to the innovation-driven model, emphasizing the harmony between people and the ecological environment, optimizing industrial structure, and enhancing green total factor productivity (GTFP). The digital economy is a powerful driving force for the economy to grow from crude and high-speed growth to high-quality growth under the new development concept. Innovation, green, coordination, openness, and sharing have become the main themes of the current sustainable development of the regional economy. Technological innovation and demand pull will become the new driving force for sustainable regional economic growth in the future. This requires the digital economy and high-quality regional development to always adhere to the green concept of sustainable development to escort the regional economy’s comprehensive, coordinated, and sustainable development. According to the remarks of General Secretary Xi Jinping at the first Digital China Summit in 2018, ‘the new development concept should be comprehensively implemented, new dynamic energy should be cultivated with information technology, new development should be promoted with new dynamic energy, and a new chapter should be created with new development.’ The questions thus arise: when the digital economy does become a new engine and a new driving force for China’s high-quality economic development, wherein will lie the state of benign coupling between the two? What is the trajectory for the realization of dynamic coupling change? How should the spatial coupling differences and their sources be characterized? The above-mentioned queries need to be addressed. The rest of the paper is organized as follows. Section 2 provides a literature review; Section 3 presents the data sources and the construction of the indicator system; Section 4 empirically investigates the dynamic coupling relationship over time; and Section 5 further explores the spatial variation characteristics. Finally, Section 6 concludes with conclusions.

2. Literature Review

An important prerequisite and foundation of achieving high-quality economic development, an important development strategy for China, is the digital economy. In recent years, the attention of government, experts, and scholars has been attracted towards bringing into play the powerful boost of the digital economy for high-quality economic development. In the existing literature, studies on the relationship between the digital economy and the impact of high-quality economic development are mainly reflected in the mechanism underlying the inherent role of the two, the trajectory of realization, the impact of the internet technology on economic development, and the effects of the role of digital economy space. The following conclusions can be drawn: given the mechanistic perspective underlying the intrinsic roles of high-quality development and the digital economy, several fields [2] of production, life, and ecology have been empowered by the internet, mobile communication technology, cloud computing, big data, and other emerging digital tools, thereby yielding a positive economic environment, realizing the balance between supply and demand of resources, forming a perfect pricing mechanism, and achieving diversified, dynamic, and balanced development [3]. Through the enrichment of the sources of innovation factors, improving factor allocation efficiency, and deepening the capital effects, rapid economic growth has been promoted by the digital economy [4]. Simultaneously, technological progress, enhancement of the market operational efficiency and the total factor productivity, improvement in the economic structure and market system, increase in the social welfare and economic sharing, improvement in the resource utilization efficiency as well as a reduction in the environmental pollution [5] have been achieved as a result of the diffusion of technology and technological innovation. However, there are some disadvantages to the development of the digital economy, leading to the disorderly evolution of supply and demand in the market, increasing the difficulty in market risk prevention, thereby threatening the stability and sustainability [6] of China’s economic growth.
For realizing the approaches or the path of utilizing the digital economy for high-quality economic development, upgrading the industrial structure is indispensable. The advanced industrial structure significantly drives regional economic development [7,8,9], and the rationalization of industrial structure promotes resource-based regional effects, which in turn suppresses the non-resource-based regions [10,11]. Although upgradation of the industrial structure exerts prominent suppressing effects on high-quality economic development, it can be corrected by scientific and technological innovation, thereby promoting economic development [12,13]. Digital industrialization is the core path for high-quality economic development by the functioning of the digital economy, involving the improvement in the digital economy infrastructure and creating a positive environment leading to a reasonable flow of digital talent, improving the levels of regional economic development, and finally yielding high-quality development of the economy [14,15]. Digitalization of industries has become a feasible strategy [16] for the impacts of the digital economy on the high-quality development of the economy. Certainly, the digital economy cannot enhance high-quality economic development in the absence of digital talent, security, industry, technology, infrastructure, and formats, in particular for the “six-in-one” digital innovation path [17].
Using the internet to assess the impact of the digital economy on high-quality economic development has shown evidence that the internet has broken the spatial–temporal boundaries, promoted high-quality development of the manufacturing industries, and optimized the efficiency of factor allocation; however, the internet has prominent regional differences in promoting the high-quality development of manufacturing industries, as evidenced by its effects on the central and western regions, which are more prominent relative to the eastern regions [18,19,20]. The technological progress of the internet promotes economic development but has a marked inhibitory effect on technical efficiency; nonetheless, the internet indirectly enhances economic development [21,22] by initially driving the technological progress, which in turn improves total factor productivity, thus achieving the goal of high-quality economic development [23,24,25]. Therefore, China should accelerate their devising an inclusive internet strategy to achieve inclusive development.
Research is based on the impact of space on the digital economy and quality development with technological approaches. Unlike the traditional “core-edge” spatial model, the spatial distribution of the digital economy applies policy-oriented development strategies to overcome the limitations of a “core-edge” structure [26], thereby not only improving the quality of regional economic development but also promoting the level of economic development in neighboring regions, thus forming a transmission path of digital economy-driven high-quality regional economic development by stimulating urban innovation, market potential, and industrial agglomeration [27]. Meanwhile, the Dagum Gini coefficient decomposition method, Kernel density estimation, and Markov chain algorithm have gradually become critical technical methods for high-quality spatial evolution and variance analysis in Chinese agriculture, the Yellow River basin, and the Yangtze River basin [28,29,30].
The above-mentioned studies have focused on the one-way impact of the digital economy on the high-quality development of the economy; only a few studies have investigated the two-way associations of high-quality economic development and the digital economy, and rarely, the coupling and coordination degree of the two and the dynamic transformation trajectory in a region have been empirically confirmed, which was precisely the initial objective of the current study. This study is innovative owing to the following reasons: (1) using the Markov chain algorithm, we have depicted the dynamic transformation trajectory of the coupling and coordination degree in the western and eastern regions of China, thus enriching the evaluation method of the role of the digital economy in high-quality economic development; (2) we quantified the overall, intra-regional, and inter-regional variations in the coupling and coordination degree of high-quality development of economy and the digital economy using the spatial perspective with the help of Dagum Gini coefficient and the decomposition; the root causes of the differences in the coupling and coordination degree, along with the degree of their contribution, are thereby highlighted. Together, we have examined the inherent non-equilibrium characteristics more comprehensively than previous studies, and the findings are expected to provide an important reference for the formulation of policies on high-quality economic development in the subregion with the digital economy.

3. Data Sources and Construction of Indication System (IS)

3.1. Measuring the Level of Development of Digital Economy

Based on the [31] results of Zhao Tao et al. (2020), we constructed an IS for the digital economy development between 2014 and 2019 (see Table 1). Owing to large amounts of missing data on internet penetration, the number of mobile internet users/total population was used as a proxy variable, drawing from the ideas [32] of Huang Qunhui et al. (2019) for measuring the number of cell phone users per 100 people, the ratio of the number of employees in the computer services and software industry to the number of employees in urban units, and the total number of telecommunications services/total population, all of which were derived from the CHINA CITY STATISTICAL YEARBOOK, National Bureau of Statistics of China, and the Easy Professional Superior (EPS) database. Finally, the digital financial inclusion index, jointly integrated by the Institute of Digital Finance, Peking University, and the Ant Group was considered a metric for digital finance [33]. All of the aforementioned indicators are positive in nature, and the data were initially standardized and subsequently synthesized into the digital economy development index using the entropy weight method (EWM).

3.2. Measuring the Quality of Economic Development

High-quality economic development can be achieved by the complete implementation of the five new developmental concepts of “innovation, green, coordination, openness, and sharing”. Drawing on the findings [34] of Wang Shujuan and Gu Shen (2021), we constructed corresponding indicators using the above-mentioned five dimensions (see Table 1). The ratios of fiscal expenditure on science and technology and that of the science and technology personnel were considered innovation inputs, and the number of patents granted per 10,000 people, along with the number of technology market transactions, was the innovation outputs to quantify innovation development levels. According to the ideas [35] of Yang Yaowu and Zhang Ping (2021), the ratio of disposable income of the urban and rural residents and the ratio of consumption of urban and rural resident expenditure comprised a metric of coordinated development in urban and rural areas; the registered urban unemployment rate and the ratio of secondary and tertiary industries were the metric of industrial coordinated development, while the ratio of bank financial deposits to loans was a measure of coordinated financial development. Based on the [36] conclusions of Ma Ru et al. (2019), green energy development was measured as the energy consumption per unit of GDP; to measure the degree of environmental protection, the completed investment in industrial pollution control and greenery coverage was added in this study. The import and export volume/GDP, foreign investment volume/GDP, and the number of foreign enterprises/the number of enterprise units were used to indicate the degree of opening up of China’s economy to the world. Finally, based on the research [37] of Wei Min and Li Shuhao (2018), the degree of shared development was measured based on the sharing of knowledge, medicine-related information, entertainment, and economy. The data for the above indicators were derived from China Statistical Yearbook on Science and Technology, China Statistical Yearbook, China Energy Statistical Yearbook, China Statistical Yearbook on Environment, and EPS database, among others, and the synthesis of indices was consistent with the above-mentioned methods.

4. Dynamic Coupling

4.1. Model of Coupling Coordination Degree

Herein, we measured the strength of the benign coupling between the high-quality development of the economy and digital economy using the coupling coordination degree model typically employed in physics. Herein, n was the number of systems and U i , the value of the corresponding system, with a range of [ 0 ,   1 ] ; C was the coupling degree, the larger was the C value, and the smaller was the degree of dispersion between the systems, which implied greater strength of the interaction, and vice versa [38]. The general form of the coupling coordination degree model used in the present study is shown in Equation (1) as follows:
C = [ Π i = 1 n U i ( 1 n Σ i = 1 n U i ) n ] 1 n
In this study, two systems of high-quality development of the economy and the digital economy were studied. Herein, we considered n = 2 and thus calculated the value of C as shown in Equation (2); further, according to the inequality ( 2 x y     x + y ) , the range of C- value was [ 0 ,   1 ] .
C = U 1 U 2 ( U 1 + U 2 2 ) 2 = 2 U 1 U 2 U 1 + U 2    
T was the degree of coordination between high-quality economic development and the digital economy, as well as, α i , the weight of the system i . By considering that both systems were equally important and equal to 0.5, D   was the degree of coupling coordination and the corresponding expression is shown in Equation (4). Moreover, the degree of coupling coordination was classified based on existing studies as the reference (see Table 2) [39].
T = i = 1 2 α i × U i , i = 1 2 α i = 1
D = C T = 2 U 1 U 2 U 1 + U 2 ( α 1 U 1 + α 2 U 2   )

4.2. Dynamic Trajectory of Coupling Coordination Based on the Markov Chain

The n state stochastic process was ( X n ,   n     0 ) , the set of states [ A 1 ,   A 2 ,   ,   A n ] at the moment t was the probability b i j   (   i ,   j = 1 ,   2 ,   ,   n   ) that a state A i was transferred to the state A j at the moment, t + 1 , and the one-step transfer matrix B = ( b i j ) was defined such that it was related only to states A i and A j and not to n , wherein b i j     0 and the sum of its elements in each row was 1. b i j ( k ) referred to the state A i transferred to state A j through the k step transformation, and combining with the K C we had the following: B   ( k ) = B   ( k 1 ) × B = B   ( k 2 ) × B × B =   B k . The transfer matrix was used to represent the transfer of state A i to A j . On combining the recurrence relation, A   ( n ) = A   ( n 1 ) × B = A   ( 0 ) × B n ,     A   ( n ) was the state vector at the moment   n [40]. Herein, in the moment n , the state coupling coordination degree state vector was D   ( n ) = { D 1   ( n ) , D 2   ( n ) , D 3   ( n ) } , whereby D 1   ( n ) , D 2   ( n ) , D 3   ( n ) were the antagonistic states, the running-in state, and the coordination state of coupling coordination degree, respectively. The structure of the coupling coordination state distribution in a region was a one-step transfer matrix B   ( n ) from the moment n to n + 1 .
B ( n ) = ( b 1 1 ( n ) b 1 2 ( n ) b 1 3 ( n ) b 2 1 ( n ) b 2 2 ( n ) b 2 3 ( n ) b 3 1 ( n ) b 3 2 ( n ) b 3 3 ( n ) )    

4.3. Measuring the Coupling Coordination

As shown in Table 3, during the sample observation period, the coupling and coordination degrees of high-quality economic development and the digital economy developed from the pre-transition period (0.3491) to the late-transition period (0.5569), corresponding to the running-in stage. Although the coupling and coordination degrees of the digital economy and high-quality economic development was observed as substantially improving, its average annual growth rate was only 3.46%, as, although the digital economy can enhance high-quality development of the economy through technology spillover effects, its lagging effects are fully reflected in a current stage, coupled with the large differences in the conversion rate of digital technologies across regions, thereby making the overall development relatively slow. Temporally, the coupling coordination degree high-quality economic development and the digital economy in all regions showed an upward trend, indicating the increase in the positive coupling between the two, and that the digital economy could drive high-quality development of the economy in all regions. Combined with the spatial perspective, the average value of coupling coordination in the eastern region was higher than the national average, while the number of provinces in the antagonistic stage decreased substantially from one in 2014 to zero in 2016. Moreover, the number of provinces in the running-in stage decreased from eight in 2014 to five in 2019, and the number of provinces in the coordination stage increased by four. The mean values of coupling coordination in the western and central regions were lower than that of the national average, and that of the coupling coordination in the western region was slightly higher relative to the central region. The number of provinces in the antagonistic stage in the central and western regions decreased from five and seven to zero, respectively, between 2014–2017, while the corresponding running-in stages increased from three and four to eight and eleven, respectively. Additionally, the number of provinces in the coordination stages in both regions was zero during the sample observation period. Thus, the positive coupling between the high-quality economic development and the digital economy in the east was markedly stronger than those in the west and central regions, owing to the remarkably greater development of the digital economy in the eastern region relative to the others. The inherent advantageous location and resources promote the in-depth integration of the region with economic development. The coefficient of variation was further used to investigate the degree of differences in coupling coordination, and it was observed that the coefficient of variation decreased from an initial 0.3342 to 0.2052 at the end of the period, which indicated that the gap in coupling coordination between regions in China showed a trend of narrowing, and the synergistic effects between regions were significantly enhanced. In general, the coupling coordination degrees of all regions in China showed an optimization trend and the preliminary estimation of the differences in coupling coordination degree showed the characteristics of shrinking. Thus, to evaluate the change law of coupling coordination degree in detail, the following trajectory analysis was performed using the Markov chain algorithm.

4.4. Probabilistic Transformation Trajectory of the Coupling Coordination Degree

The trajectory transformation probabilities of coupling and coordination in the east, west, and central regions were measured and the corresponding values are listed in Table 4, which suggested that the probability of trajectory of the regions in the antagonistic stage jumped to the running-in stage in the west, east, and central regions between 2014 and 2017, estimated at 100.00%. Thus, the digital economy exerted a more prominent role in enhancing the development in the regions in this stage during this period, and the effect of digital technology empowerment was validated (specifically, Hebei Province crossed over from the end of antagonism to the pre-transition period of the running-in stage). The trajectory probabilities of the eastern, central, and western regions maintained in the running-in and coordination stages were 100.00% (as shown in Table 3, there was no tendency for the initial eight regions in the eastern region in the running-in stage to shift across the state; all regions in the west and central regions were in the running-in stage as of 2017, and the number of provinces in the coordination stage was zero). No regions were in the antagonistic stage in the west, east, and central regions during 2017–2019, so this was excluded. The probabilities of the trajectories of regions in the running-in stage in the eastern region leaping to the coordinated stage were 44.44% (specifically, Tianjin, Zhejiang, and Jiangsu showed a leap from the late stages of running-in transition to the low-level coordinated developmental stage, while Guangdong leaped from the late stage of running-in transition to the medium-level coordinated developmental stage). The probability of maintaining the original state was 55.56%, while that of maintaining the status quo for the central and western regions was 100.00% (the regions at this stage developed at a slower pace as compared to the east and did not show the leapfrog tendency). The probability of maintaining the coordinated state in the east was 100.00% (the central and western regions were not considered as they do not appear to reach the coordinated stage). Taken together, the eastern region achieved a two-stage leap from the “antagonistic stage-running-in stage-coordination stage” during the sample observation period, while the central and western regions showed a single-stage leap from the “antagonistic stage-running-in stage” without any risk of falling back during the process. This indicated that the digital economy of China and the high-quality development of the economy are dynamically optimized and show an enhancement trajectory.

5. Spatial and Temporal Characteristics

5.1. Dagum Gini Coefficients and Their Decomposition

The problem of overlapping regional sample data was addressed using the Dagum Gini coefficient unlike the traditional Gini coefficient and the Theil index, having prominent advantages in analyzing the characteristics of spatial differences. The Dagum Gini coefficient and its decomposition were used to study the spatial non-equilibrium characteristics of the high-quality economic development and the digital economy [41]. H e r e i n ,   n was the number of regions, k   , the number of divisions of the regions, and   Y   ¯ , the mean value of coupling coordination degree. y j i   ( y h r ) denotes the coupling coordination degree within the i   ( r ) unit region in the j   ( h ) region, while n j   ( n h ) indicates the number of regions included in j   ( h ) . The overall Gini coefficient was obtained as shown in Equation (6); G j j denotes the Gini coefficient for region j as shown in Equation (7), G j h denotes the Gini coefficient between regions j and h as shown in Equation (8).
G = Δ / ( 2 Y ¯ ) = j = 1 k h = 1 k i = 1 n j r = 1 n h | y j i y h r | / 2 n 2 Y ¯
G j j = Δ j j / ( 2 Y j ¯ ) = 1 2 Y j ¯ i = 1 n j r = 1 n j | y j i y j r | / n j 2
G j h = Δ j h / ( Y j ¯ + Y h ¯ ) = i = 1 n j r = 1 n h | y j i y h r | / n j n h ( Y j ¯ + Y h ¯ )
d j h   ( p j h )   denoted the weighted average of the unevenness of the coupling coordination between the high-quality development of the economy and the digital economy. Using a mathematical expectation, we represented the overall degree of influence among different regions. F was the continuous density distribution function, and D j h reflected the relative impact of different regions.
Y ¯ 1 Y ¯ 2 Y ¯ j Y ¯ k p j = n j / n s j = n j Y ¯ j / n Y ¯ d j h = 0 d F j ( y ) 0 y ( y x ) d F h ( x ) p j h = 0 d F h ( y ) 0 y ( y x ) d F j ( x ) D j h = d j h p j h / d j h + p j h
The overall variation in coupling coordination was decomposed using the Dagum Gini coefficient into intra-regional variation contribution G w , inter-regional variation contribution, and the hypervariable density contribution G t , G = G w + G n b + G t .
G w = j = 1 k G j j p j s j
G n b = j = 2 k h = 1 j 1 G j h ( p j s h + p h s j ) D j h
G t = j = 2 k h = 1 j 1 G j h ( p j s h + p h s j ) ( 1 D j h )

5.2. Analysis of Regional Differences in Coupling Coordination and Their Sources

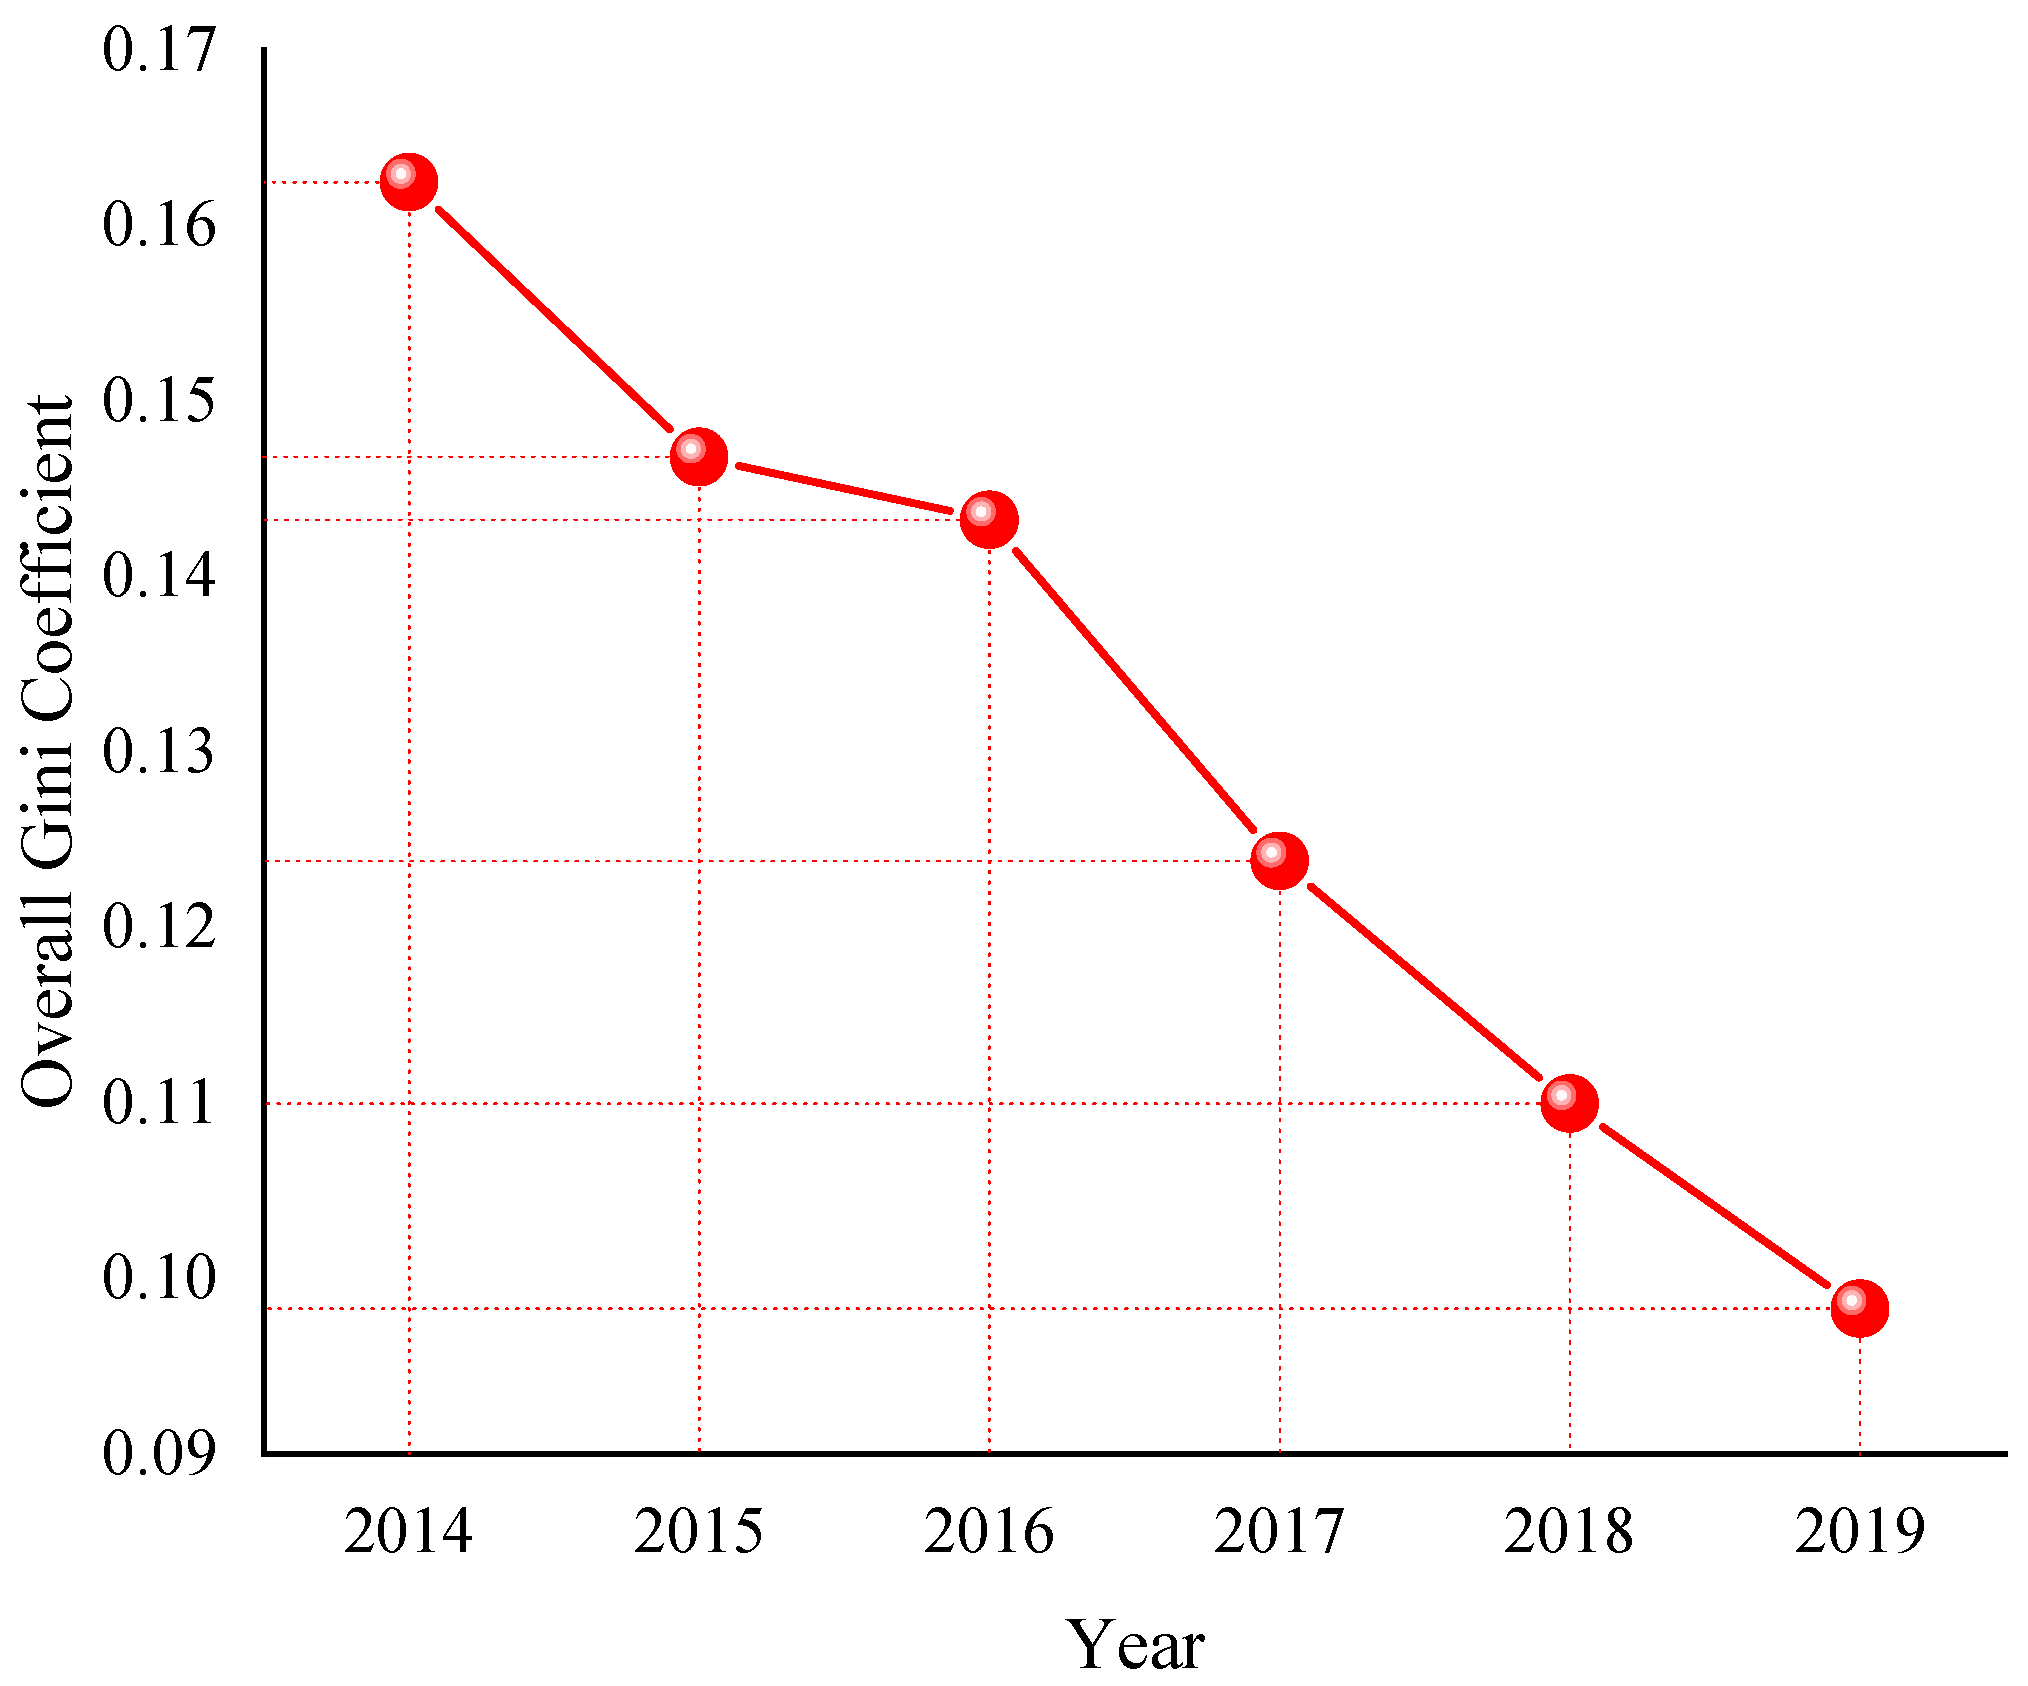
5.2.1. Overall Differences in Coupling Coordination

The evolution trends of the overall differences in the coupling and coordination degrees of the digital economy and the high-quality development of the economy are depicted in Figure 1. The overall Gini coefficient of coupling and coordination degrees showed a decreasing trend during 2014–2019, which indicated that the overall differences in positive coupling of the digital economy and high-quality economy in China were continually shrinking. For spatial characteristics, as listed in Table 5, the overall difference decreased from 0.1625 in 2014 to 0.0983 in 2019, with a decline of 0.0642, and an average annual decline of 1.07%. Thus, we inferred that the continuous improvement in the level of the digital economy development would accelerate the efficient empowerment of digital technology for economic growth, thereby exerting an endogenous growth momentum by optimizing the structure of economic development, improving production efficiency, and promoting the mobility of factors. Moreover, the high quality of the economy could feed the development of the digital economy, thereby forming a benign coupling mechanism of the digital economy in the long run, as well as high-quality development of the economy.

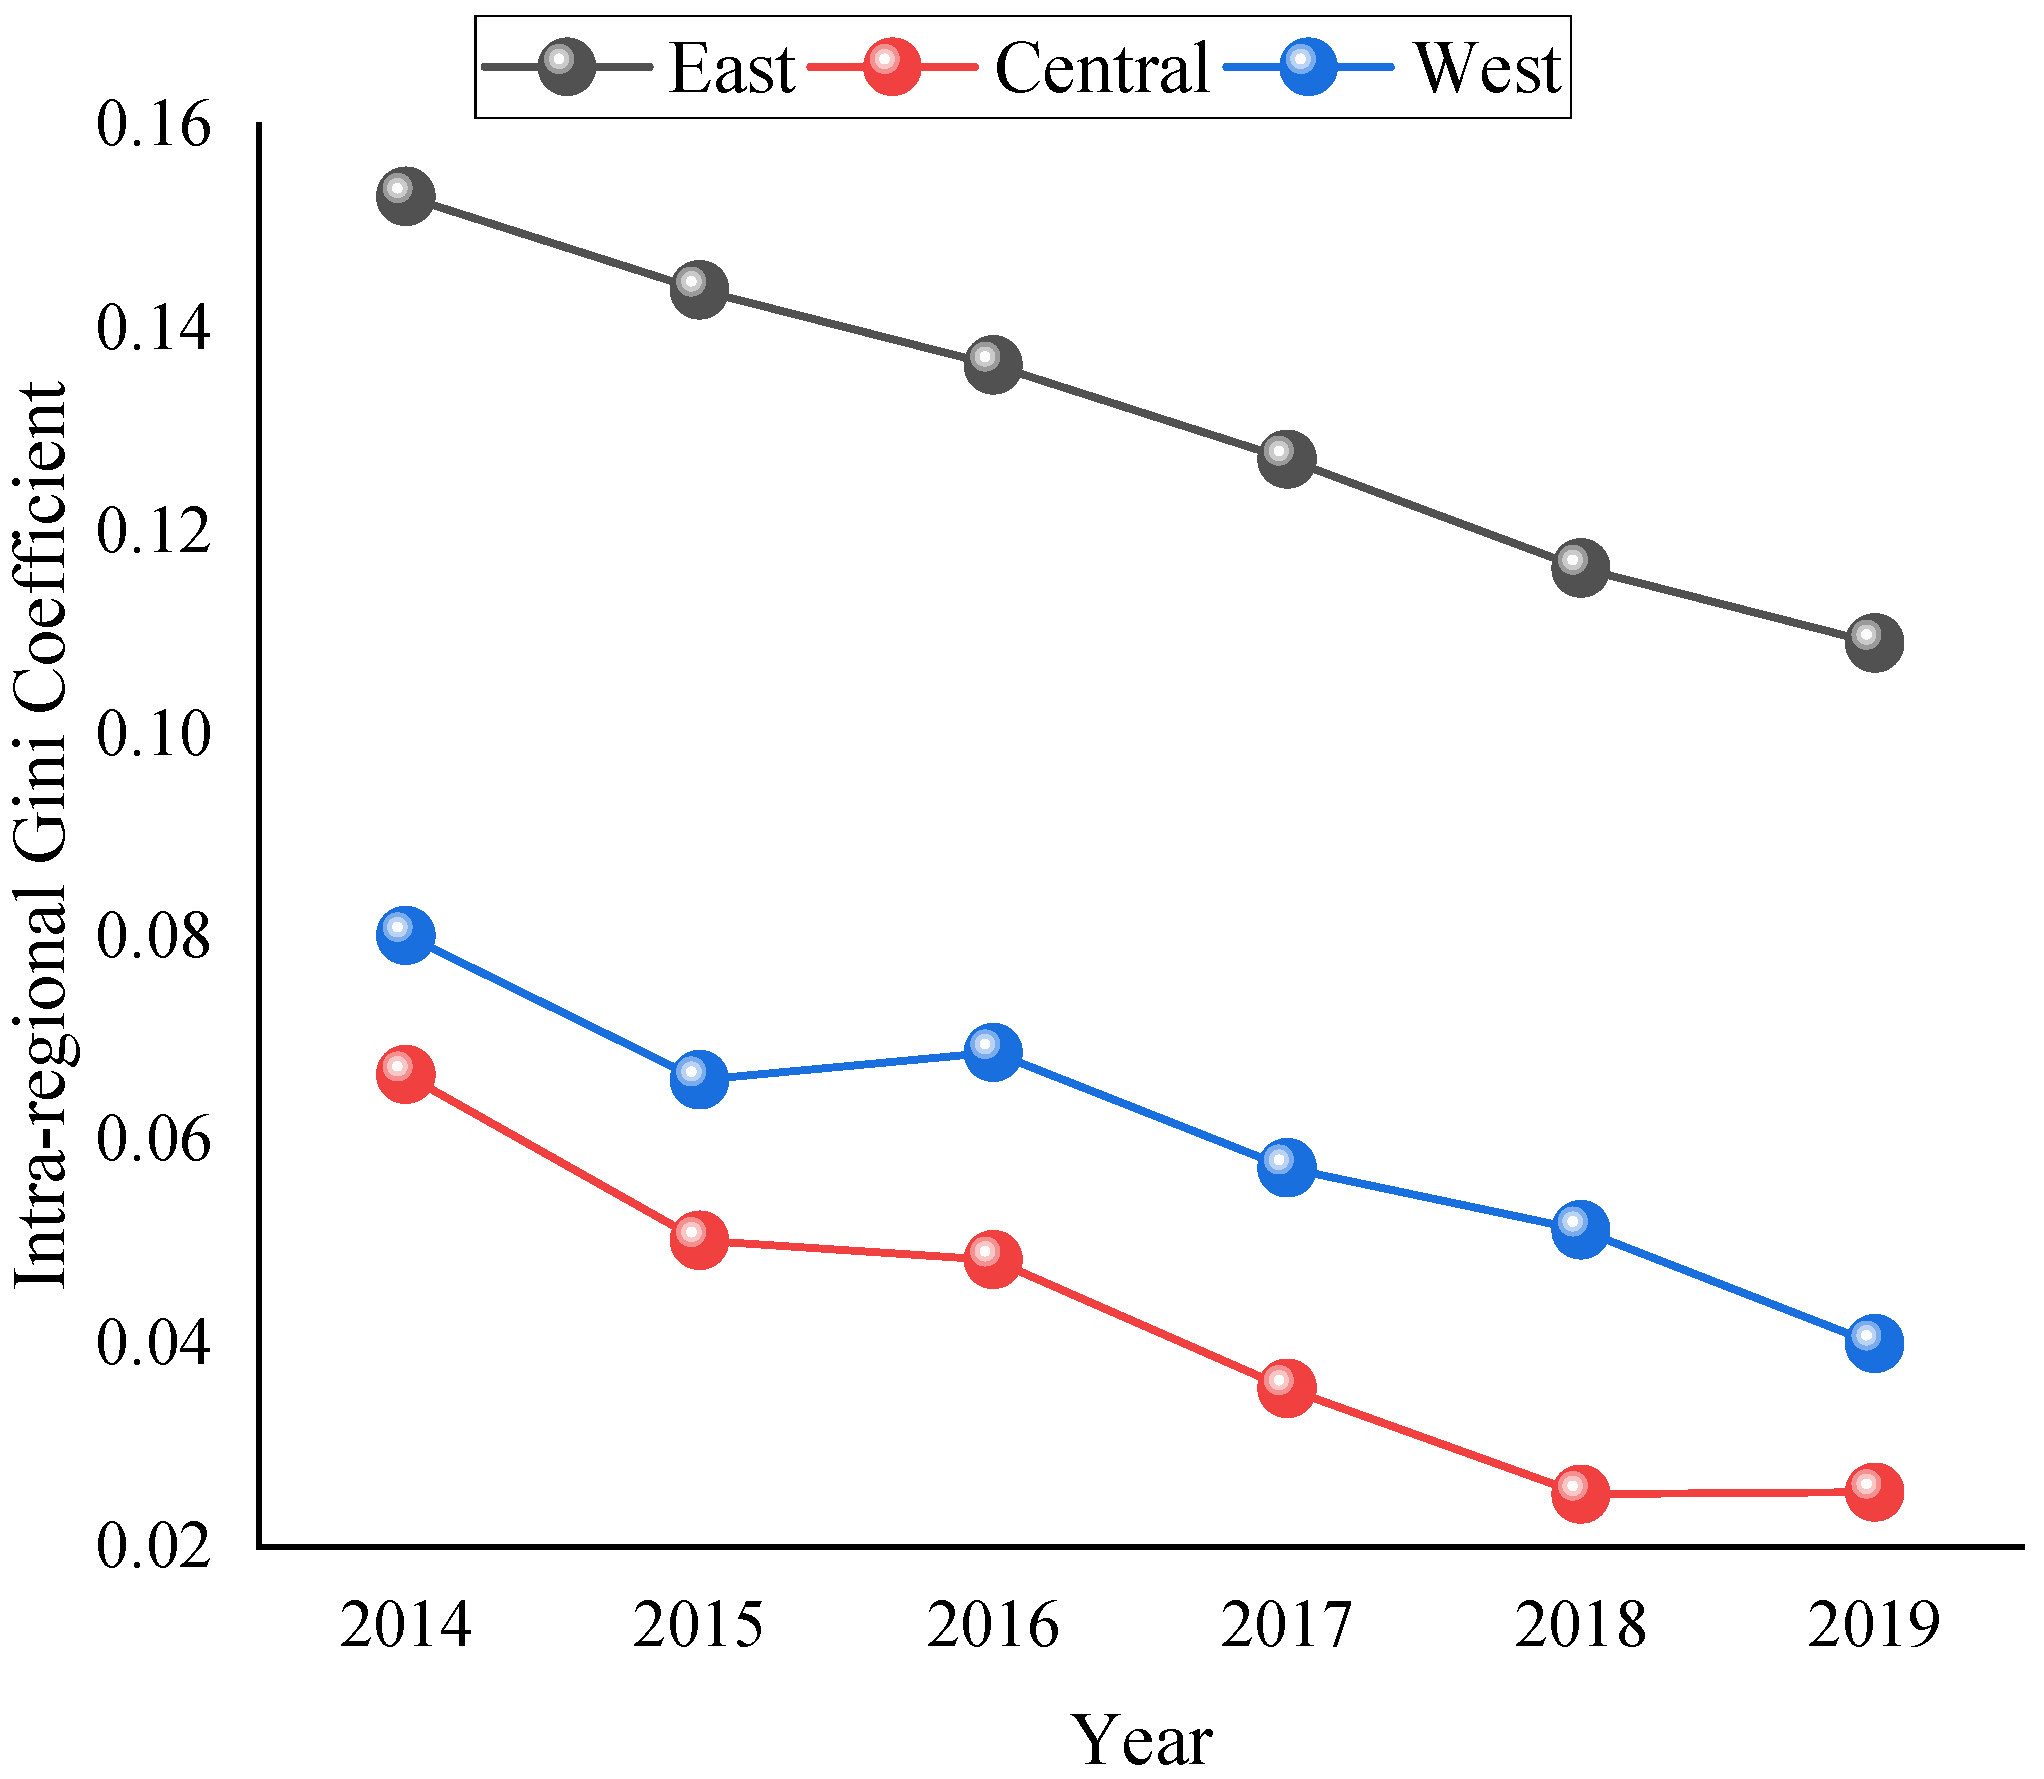
5.2.2. Intra-Regional Variations in Coupling Coordination Degrees

The evolution of intra-regional variations in the coupling and coordination degrees of the digital economy and high-quality economic development are shown in Figure 2. The intra-regional differences in the coupling and coordination degrees of the east, central, and west showed decreasing trends. As listed in Table 5, the characteristics of the intra-regional mean values were “east (0.1309) > west (0.0606) > central (0.0419)”, and the standard deviation followed the trend of “east (0.0152) > central (0.0148) > west (0.0129)” during the observation period of the sample. The eastern region had the relatively largest Gini coefficient and the fluctuations were more drastic, while the regional variations in the coupling coordination degrees in the west and central regions were smaller and with moderate fluctuations. The reason may be attributed to the fact that the eastern region had a wider scope, and the benign coupling of the high-quality economy and the digital economy among the regions was uneven. The gap in the eastern region showed a continuous downward trend, from an initial of 0.1530 to 0.1090 at the end of the period, with a decline of 0.0439, and the average annual rate of decline of 0.73%; the gap in the central and western regions showed signs of easing, from an initial 0.0665 and 0.0802 to 0.0254 and 0.0400 at the end of the period, respectively, with a corresponding decline of 0.0411 and 0.0402, and an average annual decline rate of 0.68% and 0.67%. Thus, the intra-regional variations among the three major regions showed a significant reduction; however, the average annual rate of decline was relatively slow, with none of them exceeding 1%; the Gini coefficient curves of the three major regions did not cross. The order of the region from top to bottom was the eastern, western, and central regions.

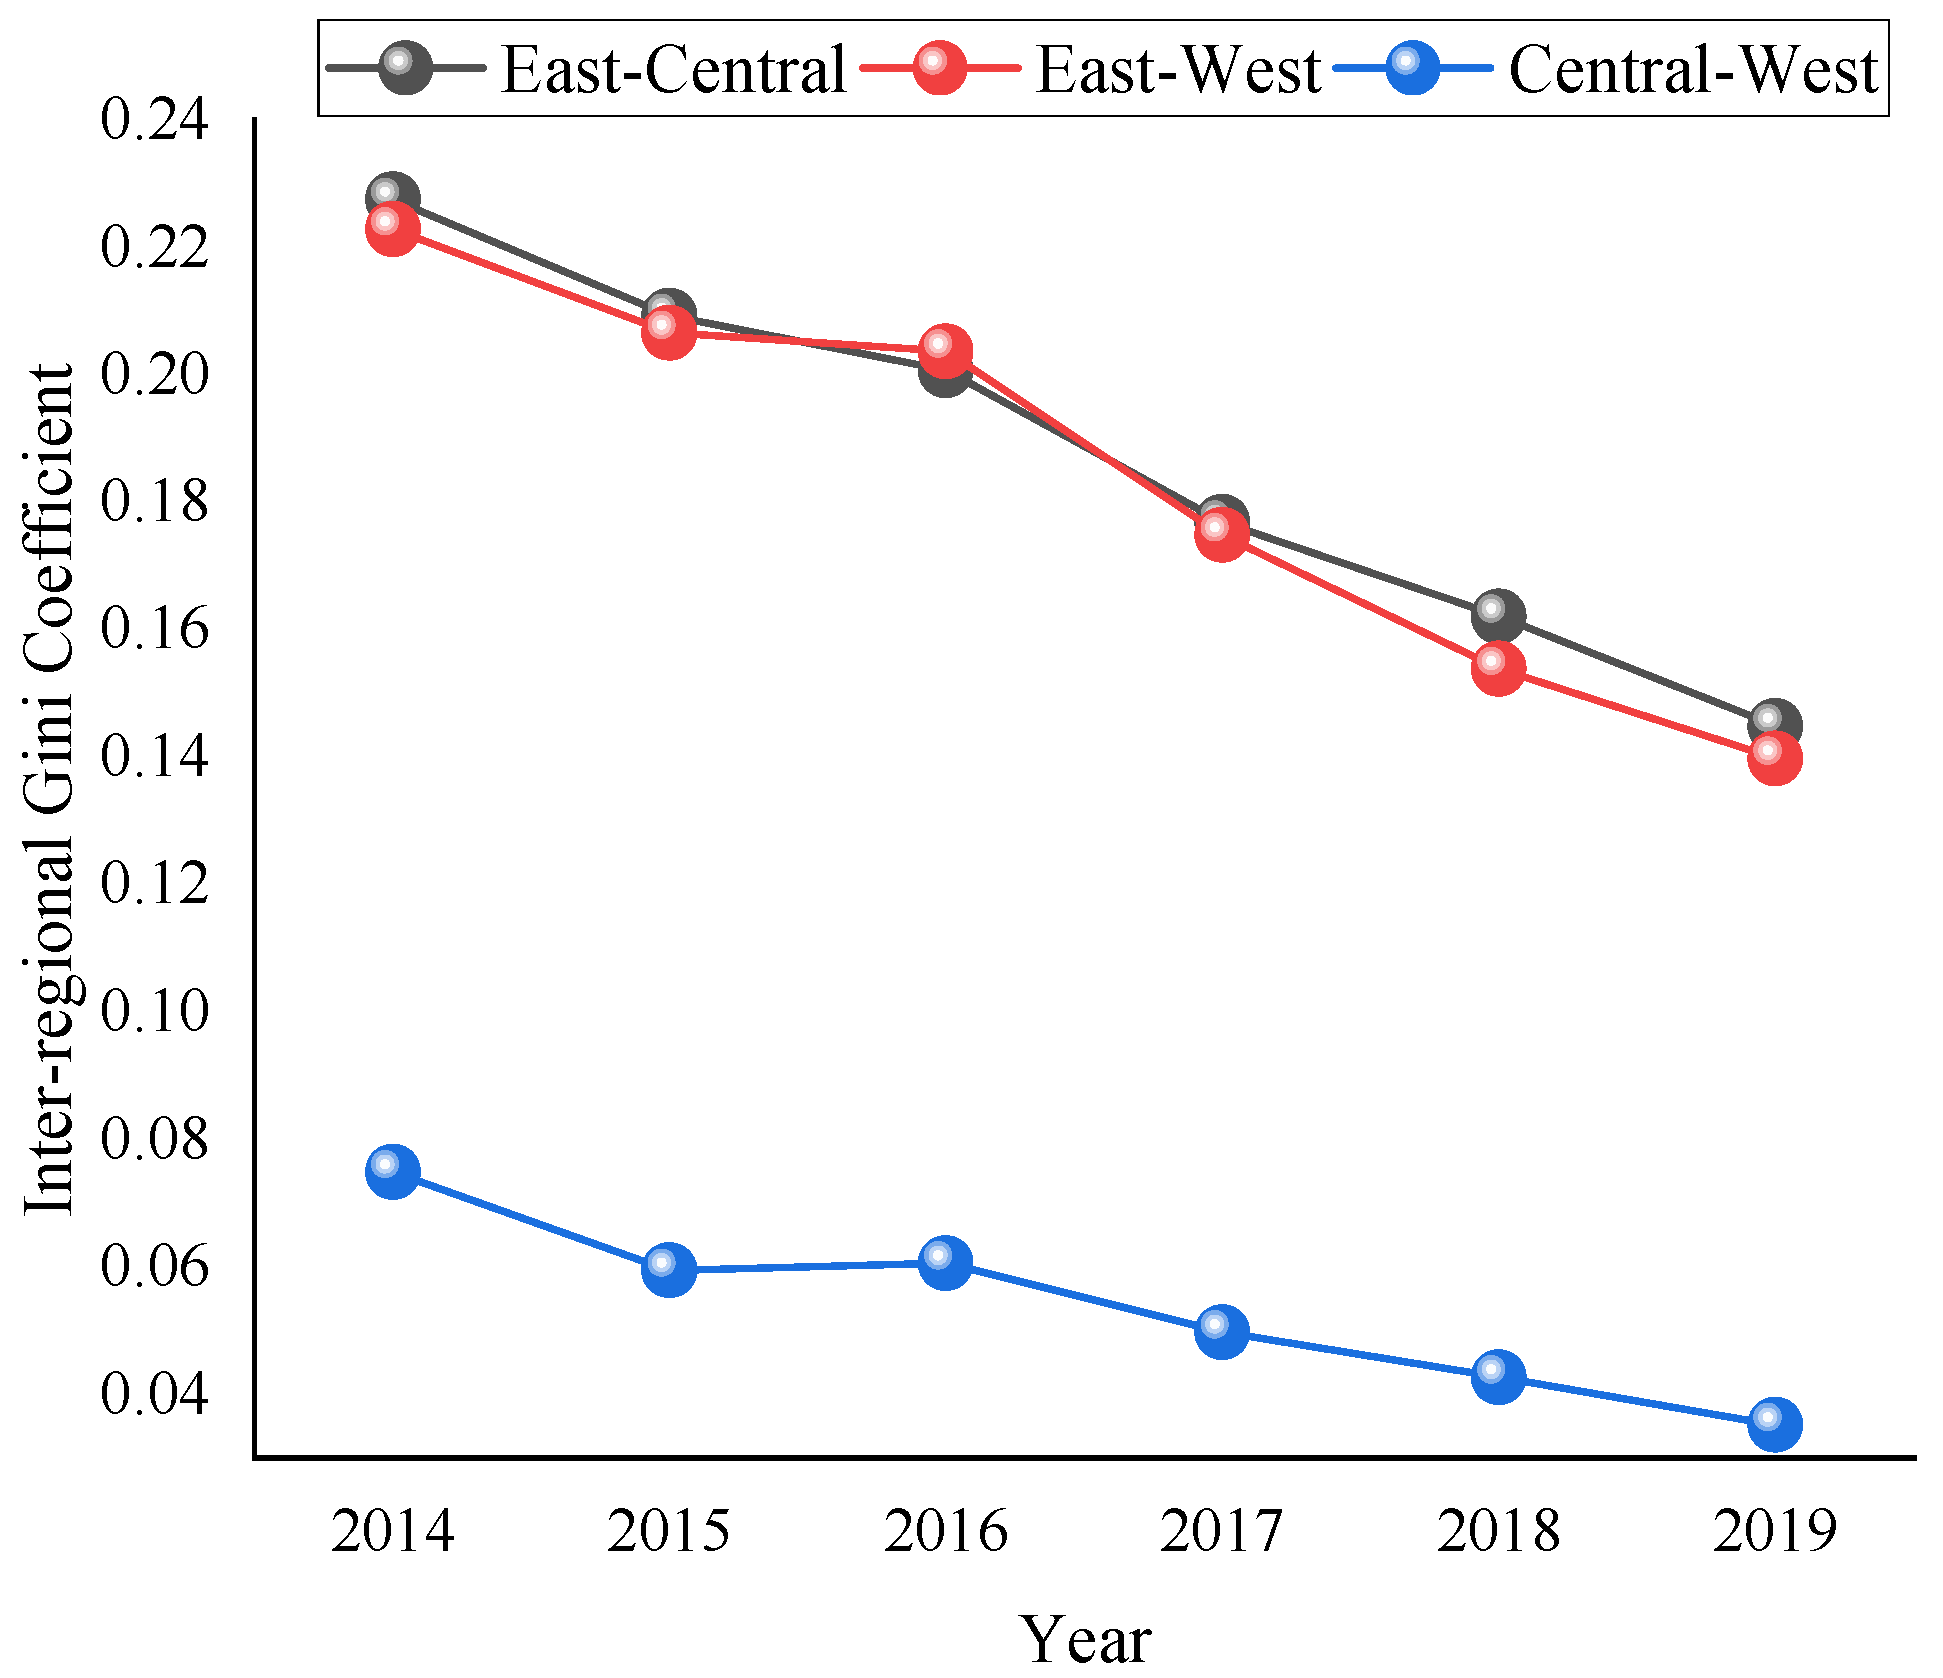
5.2.3. Inter-Regional Variations in Coupling Coordination

The evolution of inter-regional variations in the coupling and coordination degrees of the digital economy and high-quality development of the economy are shown in Figure 3. The inter-regional variations in the coupling and coordination degrees of the east, central, and west showed a reducing trend. As listed in Table 5, the characteristics of the inter-regional mean values were “east-central (0.1869) > east-west (0.1836) > central-west (0.0538)” and the standard deviation followed a trend of “east-west (0.0327) > east-central (0.0311) > central-west (0.0142)”. The Gini coefficients of east-central and east-west regions were relatively higher, while those of central-west regions were significantly lowered; the fluctuation patterns of the three regions were relatively similar. The gap between the east-central and east-west regions declined from an initial of 0.2275 and 0.2229 to 0.1449 and 0.1398, respectively, with a corresponding decline rate of 0.0826 and 0.0832, and a mean annual decline rate of 1.38% and 1.39%; the gap between the central-west regions declined from an initial of 0.0749 to 0.0352, with a decline rate of 0.0397, and an average annual decline rate of 0.66%. Collectively, there was a narrowing trend in the differences among the three regions, and the variations between the east-central and east-west regions were very close; their corresponding Gini coefficient curves almost overlapped, while the differences between the central-west regions were prominently lesser in comparison.

5.2.4. Sources of Variation in Coupling Coordination and Their Contributions

The degree of contribution of three differences in the coupling and coordination of digital economy and high-quality economic development to the overall difference is shown in Figure 4. The intra-regional differences and hypervariable density showed a slightly decreasing trend in the contribution rate to the overall difference, while the contribution rate of inter-regional differences showed an increasing trend. As shown in Table 6, the average values of inter-regional variations, intra-regional variations, and hypervariable density contribution rates were 67.60%, 24.03%, and 8.36%, respectively, and their corresponding change curves did not cross within the same period and showed a prominent stratified structure. Thus, the primary source of the differences of the digital economy and economic high-quality coupling coordination were from inter-regional differences, followed by intra-regional variations and hypervariable density, respectively. The sum of the latter two accounted for less than 35%, and their contribution to hypervariable density was less than 10%, thereby indicating that their contributions to the overall variation were relatively limited. For the evolution of the sources of variation, the fluctuations of the three sources of variations were found to be extremely flat, all below 1%; specifically, the contribution of intra-regional variation reduced slightly from an initial of 24.30% to 24.16%, with a decline of 0.14%, and the average annual rate of decline is 0.02%. Moreover, the inter-regional variation increased from an initial of 66.52% to 68.26%, with an increase of 1.74%, and the mean annual rate of growth was 0.29%. The hypervariable density decreased from an initial of 9.18% to 7.59%, with a decline of 1.60%, and a mean annual rate of decline of 0.27%. This indicates that the overall difference in the degree of coupling and coordination between the digital economy and high-quality economic development has been derived from inter-regional differences. It is difficult to change this distribution pattern in the short term.

6. Conclusions

This paper aims to complement the existing literature on the digital economy and high-quality economic development. This study extends the current literature by researching the dynamic coupling trajectory of the digital economy and high-quality economic development. The degree of coupling and coordination between the digital economy and the high-quality economic growth of China tends towards optimization. Besides, the eastern region shows a two-stage leapfrog development from the “antagonism stage-running-in stage-coordination stage,” while the west and central areas exhibit the single-stage leapfrog development from the “antagonism stage-running-in stage.” Further research also finds that the overall difference in coupling and coordination between the digital economy and high-quality economic development has narrowed significantly. The internal gap among the eastern, central, and western regions has decreased; however, all three have shown a narrowing trend. Moreover, the result indicates that the primary source of overall variance is inter-regional variance, followed by the intra-regional clash and hypervariable density.
The coupling degree of China’s digital economy development and economic growth quality has been growing evenly, as discussed by [42]. The provinces and cities with higher coupling degrees extend from the eastern coast to the inland in a “T”-shaped distribution pattern. This study finds that the degree of coupling and coordination between the digital economy and quality economic development in China tends to be optimized. Still, the overall degree of coupling has been in the grinding stage, and the degree of benign coupling in the eastern region is higher than the national average. In contrast, the development in the central and western areas is relatively slow. Compared with previous studies, the paper further confirms the development stages that both facilitate the adoption of governance measures in settings.
Taking advantage of the region’s resources can realize the leapfrog development of the regional economy [6,30]. This paper shows that the eastern part of the dynamic coupling trajectory achieves a two-stage leap in the coupling coordination degree of the “antagonism stage-running-in stage-coordination stage,” while the central and western parts of the region achieve a single-stage leap in the “antagonism stage-running-in stage” and do not fall back during this period. Consumption expansion accelerates the development of regional economy from single-stage leapfrog development to two-stage leapfrog development, which has been discovered by [9]. However, that result is not observed in this paper.
The overall difference in coordination between the digital economy and high-quality economic development in China is significantly reduced. Based on intra-regional differences, the eastern, central, and western regions show a decreasing trend, and the east area fluctuates more than the west and the main areas. Still, the annual decline rate of the three areas is slow, and none of them exceeds 1%. According to inter-regional differences, all three show a significant decreasing trend, with the differences between the east-central and east-west regions being very close. In contrast, the differences between the central-west areas are significantly lower. However, a prior study indicates that the digital economy and regional economic quality development are especially non-equilibrium, showing a decreasing trend in the east, central and west [36]. This study remedies the deficiencies of previous studies in the analysis of intra- and inter-regional differences and causes.
Literature studies have pointed out [28,29] differences in the influencing factors of high-quality economic development between intra- and inter-regional. However, this study, based on the sources of spatial differences, confirms that inter-regional difference is the primary source of overall differences, followed by intra-regional differences and supervariable density, respectively, and the three sources of differences show an apparent stratified structure with extremely flat fluctuations, all below 1%. This paper broadens the existing research ideas on the digital economy and confirms the sources and magnitude of variation.
There are some limitations of this research. (1) Markov chain algorithm emphasizes the finiteness of states, and the transfer probability between states needs to be fixed. (2) The Dagum Gini coefficient decomposition method is less specific to explain the difference of hypervariable density economically. Therefore, in the next step of the study, the article will delve into the trajectory equations of the two coupling coordination degrees and use the spatial Durbin model to explore the influence mechanism affecting the differences in coupling coordination degrees, which will be an excellent complement to the existing findings.
In the future, we should increase support for the digital economy in the central and western regions in terms of tax policies, financial subsidies, and talent training, accelerate the construction of digital infrastructure, improve the level of total factor productivity in the central and western regions with digital, networked and intelligent innovation models, and promote inter-regional exchanges and cooperation.

Author Contributions

Conceptualization, W.S. and S.L.; methodology, W.S.; software, W.S.; validation, W.S., S.L. and W.X.; formal analysis, W.S.; investigation, S.L.; resources, S.L.; data curation, W.X.; writing—original draft preparation, W.S.; writing—review and editing, S.L.; visualization, W.S.; supervision, W.S.; project administration, S.L.; funding acquisition, S.L. All authors have read and agreed to the published version of the manuscript.

Funding

This research was supported by the Innovative Capability Improvement Program of Hebei Province (S&T Program of Hebei, Grant No. 21557693D); 2022 Hebei Province Innovation Capability Improvement Plan Project (Grant No. 22556109D); Ministry of Education Youth Project (Grant No. 19YJCZH168); Humanities and Social Science Research Project of Hebei Province Colleges and Universities (Grant No. SD2022064).

Institutional Review Board Statement

Not applicable.

Informed Consent Statement

Not applicable.

Data Availability Statement

Not applicable.

Conflicts of Interest

The authors declare no conflict of interest.

References

  1. Liu, W.; Xin, F. China Remains in an Important Period of Strategic Opportunities: Transcending Potential Economic Growth. Manag. World 2019, 35, 13–23. [Google Scholar]
  2. Zhou, Q.X.; He, A.P. Digital economy empowers high-quality development in the Yellow River Basin. Econ. Probl. 2020, 8–17. [Google Scholar] [CrossRef]
  3. Jing, W.J.; Sun, B.W. Digital economy promotes high-quality economic development: A theoretical analysis framework. Economist 2019, 2, 66–73. [Google Scholar] [CrossRef]
  4. Ding, Z. Research on the mechanism of digital economy driving high-quality economic development: A theoretical analysis framework. Mod. Econ. Res. 2020, 1, 85–92. [Google Scholar] [CrossRef]
  5. Ma, Q.; Tariq, M.; Mahmood, H.; Khan, Z. The nexus between digital economy and carbon dioxide emissions in China: The moderating role of investments in research and development. Technol. Soc. 2022, 68, 101910. [Google Scholar] [CrossRef]
  6. Zhang, T.; Jiang, F.X.; Wei, Z.T. Can the digital economy become a new driving force for China’s high-quality economic development? Inq. Econ. Issues 2021, 25–39. Available online: https://kns.cnki.net/kcms/detail/detail.aspx?FileName=JJTL202001011&DbName=CJFQ2020 (accessed on 28 February 2022).
  7. Zhang, R.; Wang, G.Y.; Sun, X.L. Fiscal Decentralization, Industrial Structure and High-quality Development of the Yellow River Basin. Econ. Probl. 2020, 1–11. [Google Scholar] [CrossRef]
  8. Xu, X.H. Digital economy and high-quality economic development: Empirical evidence based on the perspective of industrial structure upgrading. Stat. Decis. 2022, 38, 95–99. [Google Scholar]
  9. Yang, W.P. Digital economy for high-quality development: Production efficiency improvement and consumption expansion. J. Shanghai Univ. Financ. Econ. 2022, 24, 48–60. [Google Scholar]
  10. Li, K.; Kim, D.J.; Lang, K.R.; Kauffman, R.J.; Naldi, M. How should we understand the digital economy in Asia? Critical assessment and research agenda. Electr. Commer. Res. Appl. 2020, 44, 101004. [Google Scholar] [CrossRef]
  11. Ali, M.A.; Hoque, M.R.; Alam, K. An empirical investigation of the relationship between e-government development and the digital economy: The case of Asian countries. J. Knowl. Manag. 2018, 22, 1176–1200. [Google Scholar] [CrossRef]
  12. Jia, H.W.; Zhang, W.T.; Pan, Y.Z. Science and technology innovation, industrial structure upgrading, and high-quality economic development. Shanghai J. Econ. 2021, 50–60. [Google Scholar] [CrossRef]
  13. Noseleit, F. Entrepreneurship, Structural Change, and Economic Growth; ERSA Conference Papers; European Regional Science Association: Louvain-la-Neuve, Belgium, 2011. [Google Scholar] [CrossRef] [Green Version]
  14. Yang, D.; Zhang, Y.T.; Hu, D.F. Research on the Paths of Digital Economy Empowering High-quality Development: Based on the Configuration Analysis of the Integrated Central Cities in the Yangtze River Delta. East China Econ. Manag. 2021, 35, 39–47. [Google Scholar]
  15. Zhang, X.; Wan, G.H.; Zhang, J.J.; He, Z.Y. Digital Economy, Financial Inclusion, and Inclusive Growth. Econ. Res. J. 2019, 54, 71–86. [Google Scholar]
  16. Han, W.L. Political economy analysis of the digital economy empowering high-quality economic development. J. Grad Sch. Chin. Acad Soc. Sci. 2021, 98–108. Available online: https://kns.cnki.net/kcms/detail/detail.aspx?FileName=ZSKY202102011&DbName=CJFQ2021 (accessed on 28 February 2022).
  17. Zhang, H.; Liu, Z.; Wang, S.X. Exploration of the path of high-quality development of China’s economy in the context of digital economy. J. Commer. Econ. 2019, 183–186. Available online: https://kns.cnki.net/kcms/detail/detail.aspx?FileName=SYJJ201923049&DbName=CJFQ2019 (accessed on 28 February 2022).
  18. Wang, J.; Chen, G.F. “Internet Plus”, Factor Allocation and High-Quality Development of Manufacturing Industry. Tech. Econ. 2020, 39, 61–72. [Google Scholar]
  19. Fan, H.J.; Wu, T. Can digitalization promote economic growth and high-quality development: Empirical evidence from provincial panel data in China. J. Manag. 2021, 34, 36–53. [Google Scholar]
  20. Guo, J.T.; Luo, P.L. Can Internet promote total factor productivity in China? Manag. World 2016, 34–49. [Google Scholar] [CrossRef]
  21. Liu, Z.B.; Ling, Y.F. Structural Transformation, Total Factor Productivity, and High-quality Development. Manag. World 2020, 36, 15–29. [Google Scholar]
  22. Min, L.L.; Xu, Z.Z. Digital economy, innovation performance, and high quality economic development: Empirical evidence based on Chinese cities. Stat. Decis. 2022, 11–15. [Google Scholar] [CrossRef]
  23. Liu, X.X.; Hui, N. Internet, technological innovation and high-quality development of manufacturing industry: Analysis of heterogeneous effects based on innovation models. Inq. Econ. Issues 2021, 143–155. Available online: https://kns.cnki.net/kcms/detail/detail.aspx?FileName=JJWS202109013&DbName=DKFX2021 (accessed on 28 February 2022).
  24. Liu, S.C. Targeting Path and Policy Supply for the High-Quality Development of China’s Digital Economy. Economist 2019, 52–61. [Google Scholar] [CrossRef]
  25. Wang, K.K.; Wu, G.B.; Zhang, G.J. Has the Development of the Digital Economy Improved Production Efficiency? Economist 2020, 10, 24–34. [Google Scholar] [CrossRef]
  26. Zhu, W.J.; Chen, J.J. The spatial analysis of digital economy and urban development: A case study in Hangzhou, China. Cities 2022, 123, 103563. [Google Scholar] [CrossRef]
  27. Lu, Y.X.; Fang, X.M.; Zhang, Q. Digital Economy, Spatial Spillover and High-Quality Development of Urban Economy. Econ. Surv. 2021, 38, 21–31. [Google Scholar]
  28. Yan, Y.; Zhang, W. Dynamic evolution of regional disparity and distribution of high-quality urban development in the Yangtze River Economic Belt. Yangtze River Basin Resourc. Environ. 2022, 31, 259–272. [Google Scholar]
  29. Liu, Z.; Wakasi, R. Regional differences and dynamic evolution of the distribution of high-quality agricultural development in China. Quant. Econ. Tech. Econ. Res. 2021, 38, 28–44. [Google Scholar]
  30. Shi, B.; He, L.; Zhang, W.M. Dynamic evolution and trend prediction of high-quality development of urban economy in the Yellow River Basin. Econ. Issues 2021, 1–8. [Google Scholar] [CrossRef]
  31. Zhao, T.; Zhang, Z.; Liang, S.K. Digital economy, entrepreneurial activity and high-quality development: Empirical evidence from Chinese cities. Manag. World 2020, 36, 65–76. [Google Scholar]
  32. Huang, Q.H.; Yu, Y.Z.; Zhang, S.J. Internet development and manufacturing productivity improvement: Intrinsic mechanism and China’s experience. China Industr. Econ. 2019, 5–23. [Google Scholar] [CrossRef]
  33. Guo, F.; Wang, J.Y.; Wang, F.; Kong, T.; Zhang, X.; Cheng, Z.Y. Measuring China’s digital financial inclusion: Index compilation and spatial characteristics. China Econ. Quart. 2020, 19, 1401–1418. [Google Scholar]
  34. Wang, S.J.; Gu, S. Research on the impact of S&T finance on the high-quality development of Chinese economy—Theoretical analysis and empirical test. Economist 2021, 81–91. [Google Scholar] [CrossRef]
  35. Yang, Y.W.; Zhang, P. Logic, measurement and governance in China’s high quality economic development. Econ. Res. J. 2021, 56, 26–42. [Google Scholar]
  36. Ma, R.; Luo, H.; Wang, H.W.; Wang, T.C. Study of evaluating high-quality economic development in Chinese regions. China Soft Sci. 2019, 7, 60–67. [Google Scholar]
  37. Wei, M.; Li, S.H. Study on the measurement of economic high-quality development level in China in the new era. J. Quant. Tech. Econ. 2018, 35, 3–20. [Google Scholar]
  38. Liu, Y.C.; Shen, W.K.; Liu, L.L. A study on the dynamic coupling coordination degree between science and technology finance and advanced manufacturing innovation development. Econ. Probl. 2021, 36–43. [Google Scholar] [CrossRef]
  39. Hong, M.Y.; He, Y.F.; Song, H.F. Spatial and temporal coupling of agricultural land transfer and farmers’ income in China and spatial effects. J. Nat. Resour. 2021, 36, 3084–3098. [Google Scholar] [CrossRef]
  40. Quah, D.T. Twin peaks: Growth and convergence in models of distribution dynamics. Econ. J. 1996, 106, 1045–1055. [Google Scholar] [CrossRef] [Green Version]
  41. Dagum, C. A new approach to the decomposition of the Gini income inequality ratio. Empir. Econ. 1997, 22, 515–531. [Google Scholar] [CrossRef]
  42. Deng, R.R.; Zhang, A.X.; Chen, M. Spatial and temporal evolution of the coupling degree of digital economy development and economic growth quality and the driving factors--numerical measurement and empirical analysis. J. Nanjing Univ. Financ. Econ. 2021, 5, 33–43. [Google Scholar]
Figure 1. Trends of the overall differences in coupling coordination degrees.
Sustainability 14 04543 g001
Figure 2. Intra-regional variations in coupling coordination.
Sustainability 14 04543 g002
Figure 3. Inter-regional differences in coupling coordination.
Sustainability 14 04543 g003
Figure 4. Trends in the sources of coupling coordination differences.
Sustainability 14 04543 g004
Table 1. Construction of the indication system.
SystemsSubsystemsSpecific IndicatorsDirection
Digital Economy DevelopmentInternet penetrationMobile internet penetration rate+
Cell phone penetrationCell phone penetration rate (units per 100 people)+
Internet PractitionersPercentage of computer and software employees+
Internet OutputTotal telecom business per capita (RMB/person)+
Digital Financial DevelopmentDigital Financial Inclusion Index+
High-Quality Economic DevelopmentInnovationPercentage of fiscal expenditure on science and technology+
Percentage of science and technology personnel+
Number of patents granted per 10,000 people+
Technology Market Turnover+
CoordinationUrban Registered Unemployment Rate
Ratio of bank financial deposits to loans
Ratio of secondary and tertiary industries+
Ratio of disposable income of urban and rural residents
Ratio of urban and rural residents’ consumption expenditure
GreenInvestment in industrial pollution control
Energy consumption per unit of GDP
Greening coverage rate+
OpennessImport and export volume/GDP+
Amount of foreign investment/GDP+
Number of foreign enterprises/number of enterprise units+
SharingTotal library collections per 10,000 people+
Number of museums per 10,000 people+
Number of beds in medical institutions per 10,000 people+
Urbanization rate+
GDP per capita+
Note: All populations here refer to Chinese people.
Table 2. Classification of the coupling coordination degree.
The   Range   of   Values   of   D Type of DevelopmentDevelopment Stage
D     [ 0 ,   0.1 ) Antagonistic early stage D     [ 0 ,   0.3 )
Antagonistic stage
D     [ 0.1 ,   0.2 ) Middle antagonism
D     [ 0.2 ,   0.3 ) End of antagonism
D     [ 0.3 ,   0.4 ) Pre-running-in transition
D     [ 0.4 ,   0.5 ) Mid-running-in transition D     [ 0.3 ,   0.6 )
running-in stage
D     [ 0.5 ,   0.6 ) Late running-in transition
D     [ 0.6 ,   0.7 ) Low level of coordinated development D     [ 0.6 ,   1 ]
Coordination stage
D     [ 0.7 ,   0.8 ) Medium level of coordinated development
D     [ 0.8 ,   1 ] High level of coordinated development
Table 3. Coupling coordination degree and coefficient of variation between the digital economy and high-quality economy development.
Region201420152016201720182019
Shanghai0.63070.65780.65300.70200.77050.8163
Beijing0.75090.78320.77680.82820.88840.9440
Tianjin0.40710.45160.45850.51790.60260.6564
Shandong0.32700.36240.37190.41890.48120.5355
Guangdong0.48240.51310.51020.57550.66570.7164
Jiangsu0.45280.48510.47710.52880.60770.6676
Hebei0.26800.29580.31230.35410.41640.4702
Zhejiang0.47830.51550.50940.56200.63860.7028
Hainan0.38680.41460.42370.46990.54410.5937
Fujian0.39550.42700.41660.46080.53090.5760
Liaoning0.38110.40600.40880.46060.51070.5455
The east region0.45100.48290.48350.53440.60520.6568
Jilin0.33490.35410.35820.40760.45510.5053
Anhui0.27610.32300.33370.38140.45310.5160
Shanxi0.29590.31570.31660.36370.42410.4707
Jiangxi0.26730.30140.29540.35640.42420.4807
Henan0.23900.28330.29480.35690.42490.4770
Hubei0.32400.36410.36610.41640.48620.5467
Hunan0.24750.28300.29080.34720.42060.4816
Heilongjiang0.31800.33440.34270.39080.43320.4794
The central region0.28780.31990.32480.37760.44020.4947
Yunnan0.24450.28010.28160.34520.40540.4636
Inner Mongolia0.32990.34810.34950.39670.45590.5012
Sichuan0.32040.35900.36080.40360.47670.5256
Ningxia0.29790.32860.33390.43620.49850.5451
Guangxi0.24860.28590.28250.34010.41510.4635
Xinjiang0.28980.31120.30360.33210.39450.4591
Gansu0.26390.29890.29580.35920.42920.4834
Guizhou0.22550.26700.27250.34220.42090.4822
Chongqing0.32610.36190.36360.41350.48840.5360
Shaanxi0.36970.39230.40130.44580.52750.5724
Qinghai0.29490.31730.31500.37470.44810.4921
The west region0.29190.32280.32370.38090.45090.5022
Nationwide0.34910.38070.38260.43630.50460.5569
C.V0.33420.30470.29620.25760.22670.2052
Table 4. Probabilistic transformation transfer trajectory matrix for coupling coordination degree.
Eastern Region
14–17 D 1 D 2 D 3 17–19 D 1 D 2 D 3
D 1 0.00%100.00%0.00% D 1 100.00%0.00%0.00%
D 2 0.00%100.00%0.00% D 2 0.00%55.56%44.44%
D 3 0.00%0.00%100.00% D 3 0.00%0.00%100.00%
Central Region
14–17 D 1 D 2 D 3 17–19 D 1 D 2 D 3
D 1 0.00%100.00%0.00% D 1 100.00%0.00%0.00%
D 2 0.00%100.00%0.00% D 2 0.00%100.00%0.00%
D 3 0.00%0.00%100.00% D 3 0.00%0.00%100.00%
Western Region
14–17 D 1 D 2 D 3 17–19 D 1 D 2 D 3
D 1 0.00%100.00%0.00% D 1 100.00%0.00%0.00%
D 2 0.00%100.00%0.00% D 2 0.00%100.00%0.00%
D 3 0.00%0.00%100.00% D 3 0.00%0.00%100.00%
Table 5. Dagum Gini coefficients.
YearOverall Variation
G
Intra-Regional VariationInter-Regional Variation
EastCentralWestEast-CentralEast-WestCentral-West
20140.16250.15300.06650.08020.22750.22290.0749
20150.14680.14380.05020.06600.20930.20660.0595
20160.14320.13640.04830.06870.20070.20370.0606
20170.12380.12710.03560.05730.17690.17490.0498
20180.11000.11640.02520.05120.16210.15390.0427
20190.09830.10900.02540.04000.14490.13980.0352
Mean0.13080.13090.04190.06060.18690.18360.0538
Standard deviation0.02220.01520.01480.01290.03110.03270.0142
Decline0.06420.04390.04110.04020.08260.08320.0397
Rate1.07%0.73%0.68%0.67%1.38%1.39%0.66%
Table 6. Decomposition of the sources of variation of Dagum Gini coefficients and their contribution.
YearContributionContribution Rate
Intra-Regional VariationInter-Regional VariationHypervariable DensityIntra-Regional VariationInter-Regional VariationHypervariable Density
20140.03950.10810.014924.30%66.52%9.18%
20150.03510.09920.012623.88%67.55%8.57%
20160.03390.09700.012323.67%67.74%8.58%
20170.02980.08320.010724.11%67.22%8.67%
20180.02650.07510.008424.07%68.33%7.60%
20190.02370.06710.007524.15%68.26%7.59%
Mean0.03140.08830.011124.03%67.60%8.36%
Standard deviation0.00580.01570.00280.22%0.68%0.64%
Decline0.01570.04100.00750.14%−1.74%1.60%
Rate0.26%0.68%0.12%0.02%−0.29%0.27%
Publisher’s Note: MDPI stays neutral with regard to jurisdictional claims in published maps and institutional affiliations.

