
Analytic Hierarchy Process Based Land Suitability for Organic Farming in the Arid Region

 ,
,  , , and
Abstract
:1. Introduction
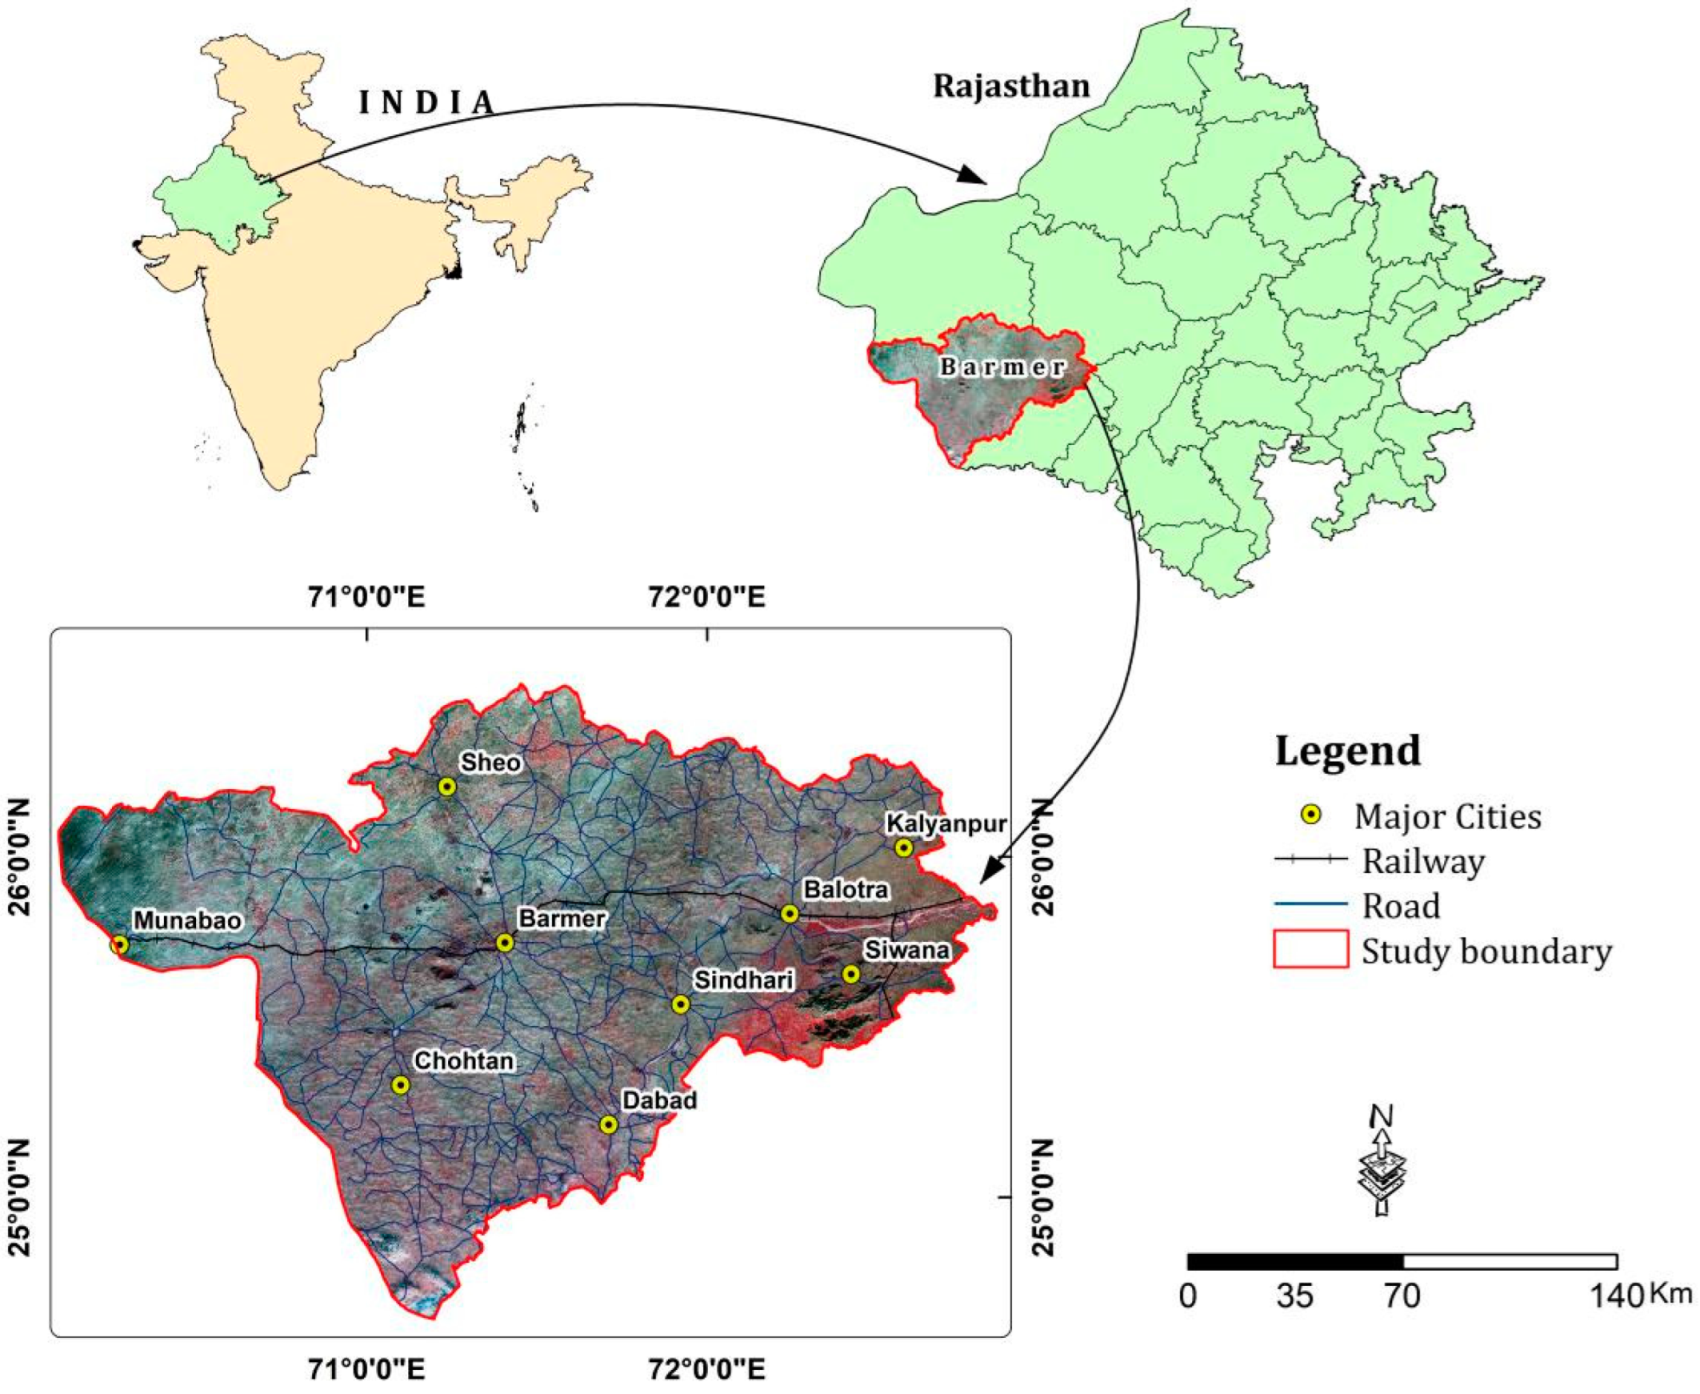
2. Study Area
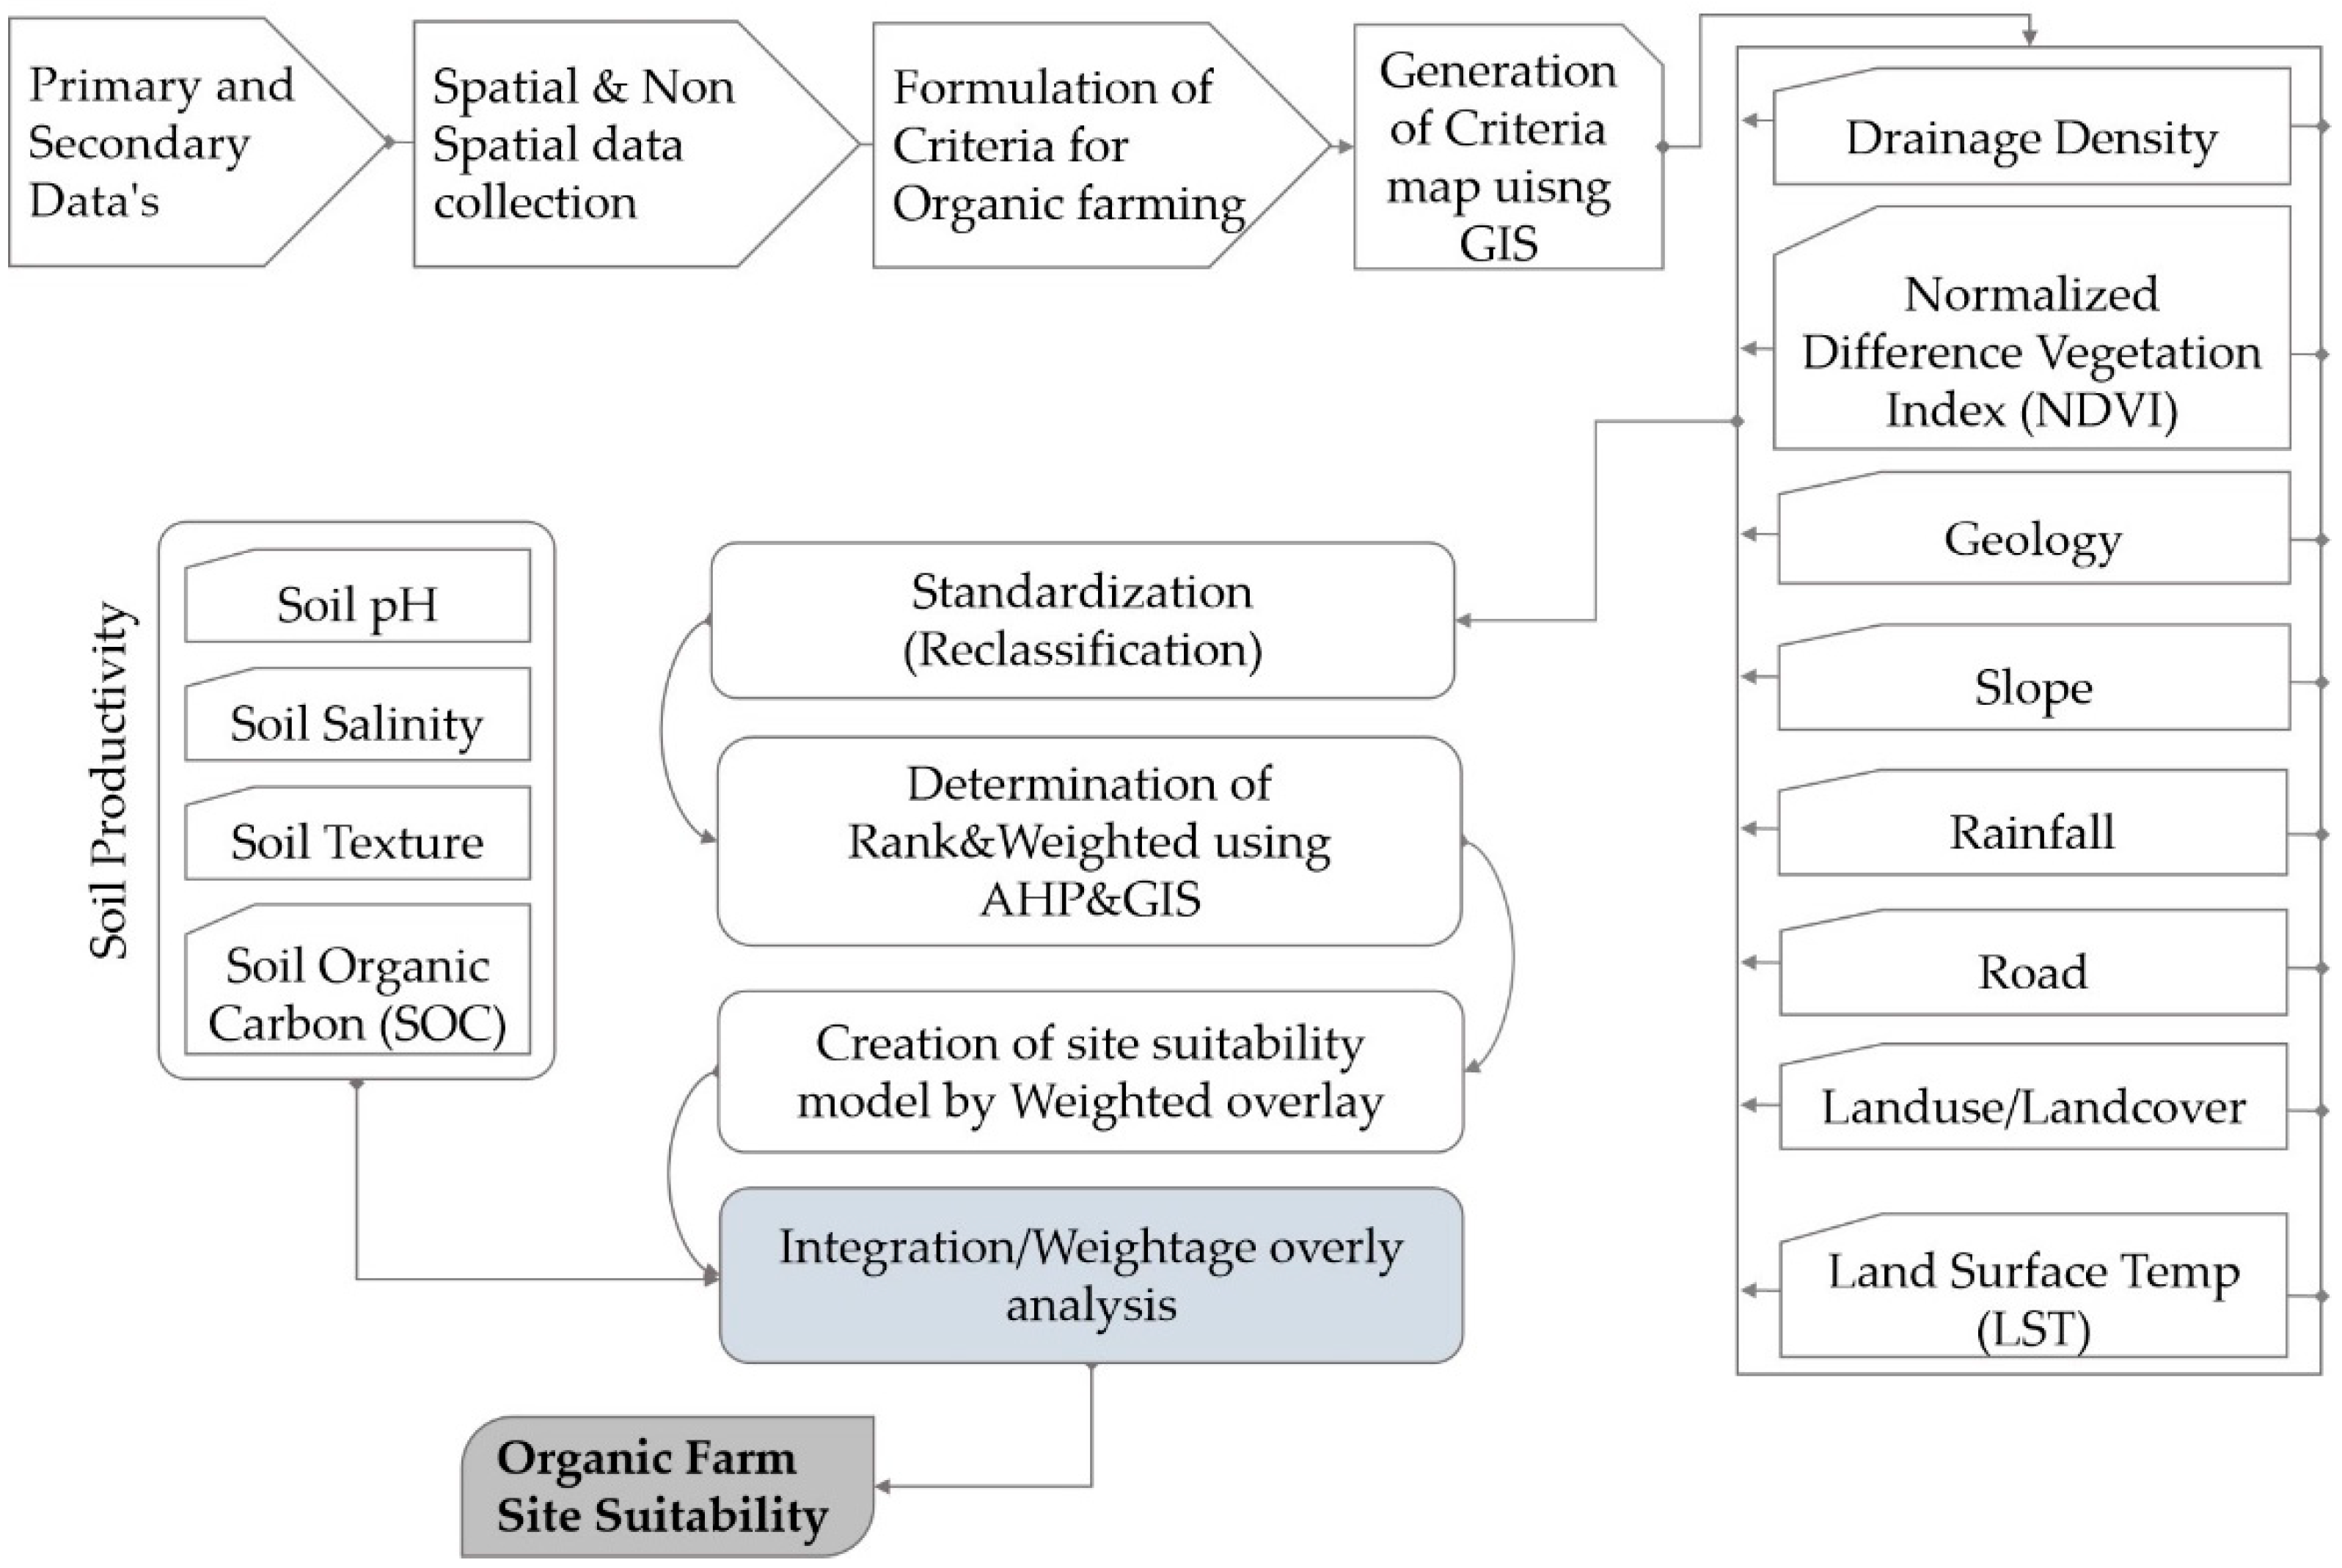
3. Materials and Methods
3.1. Preparation of Multi-Criteria Maps
3.2. Determination of Weights Using AHP
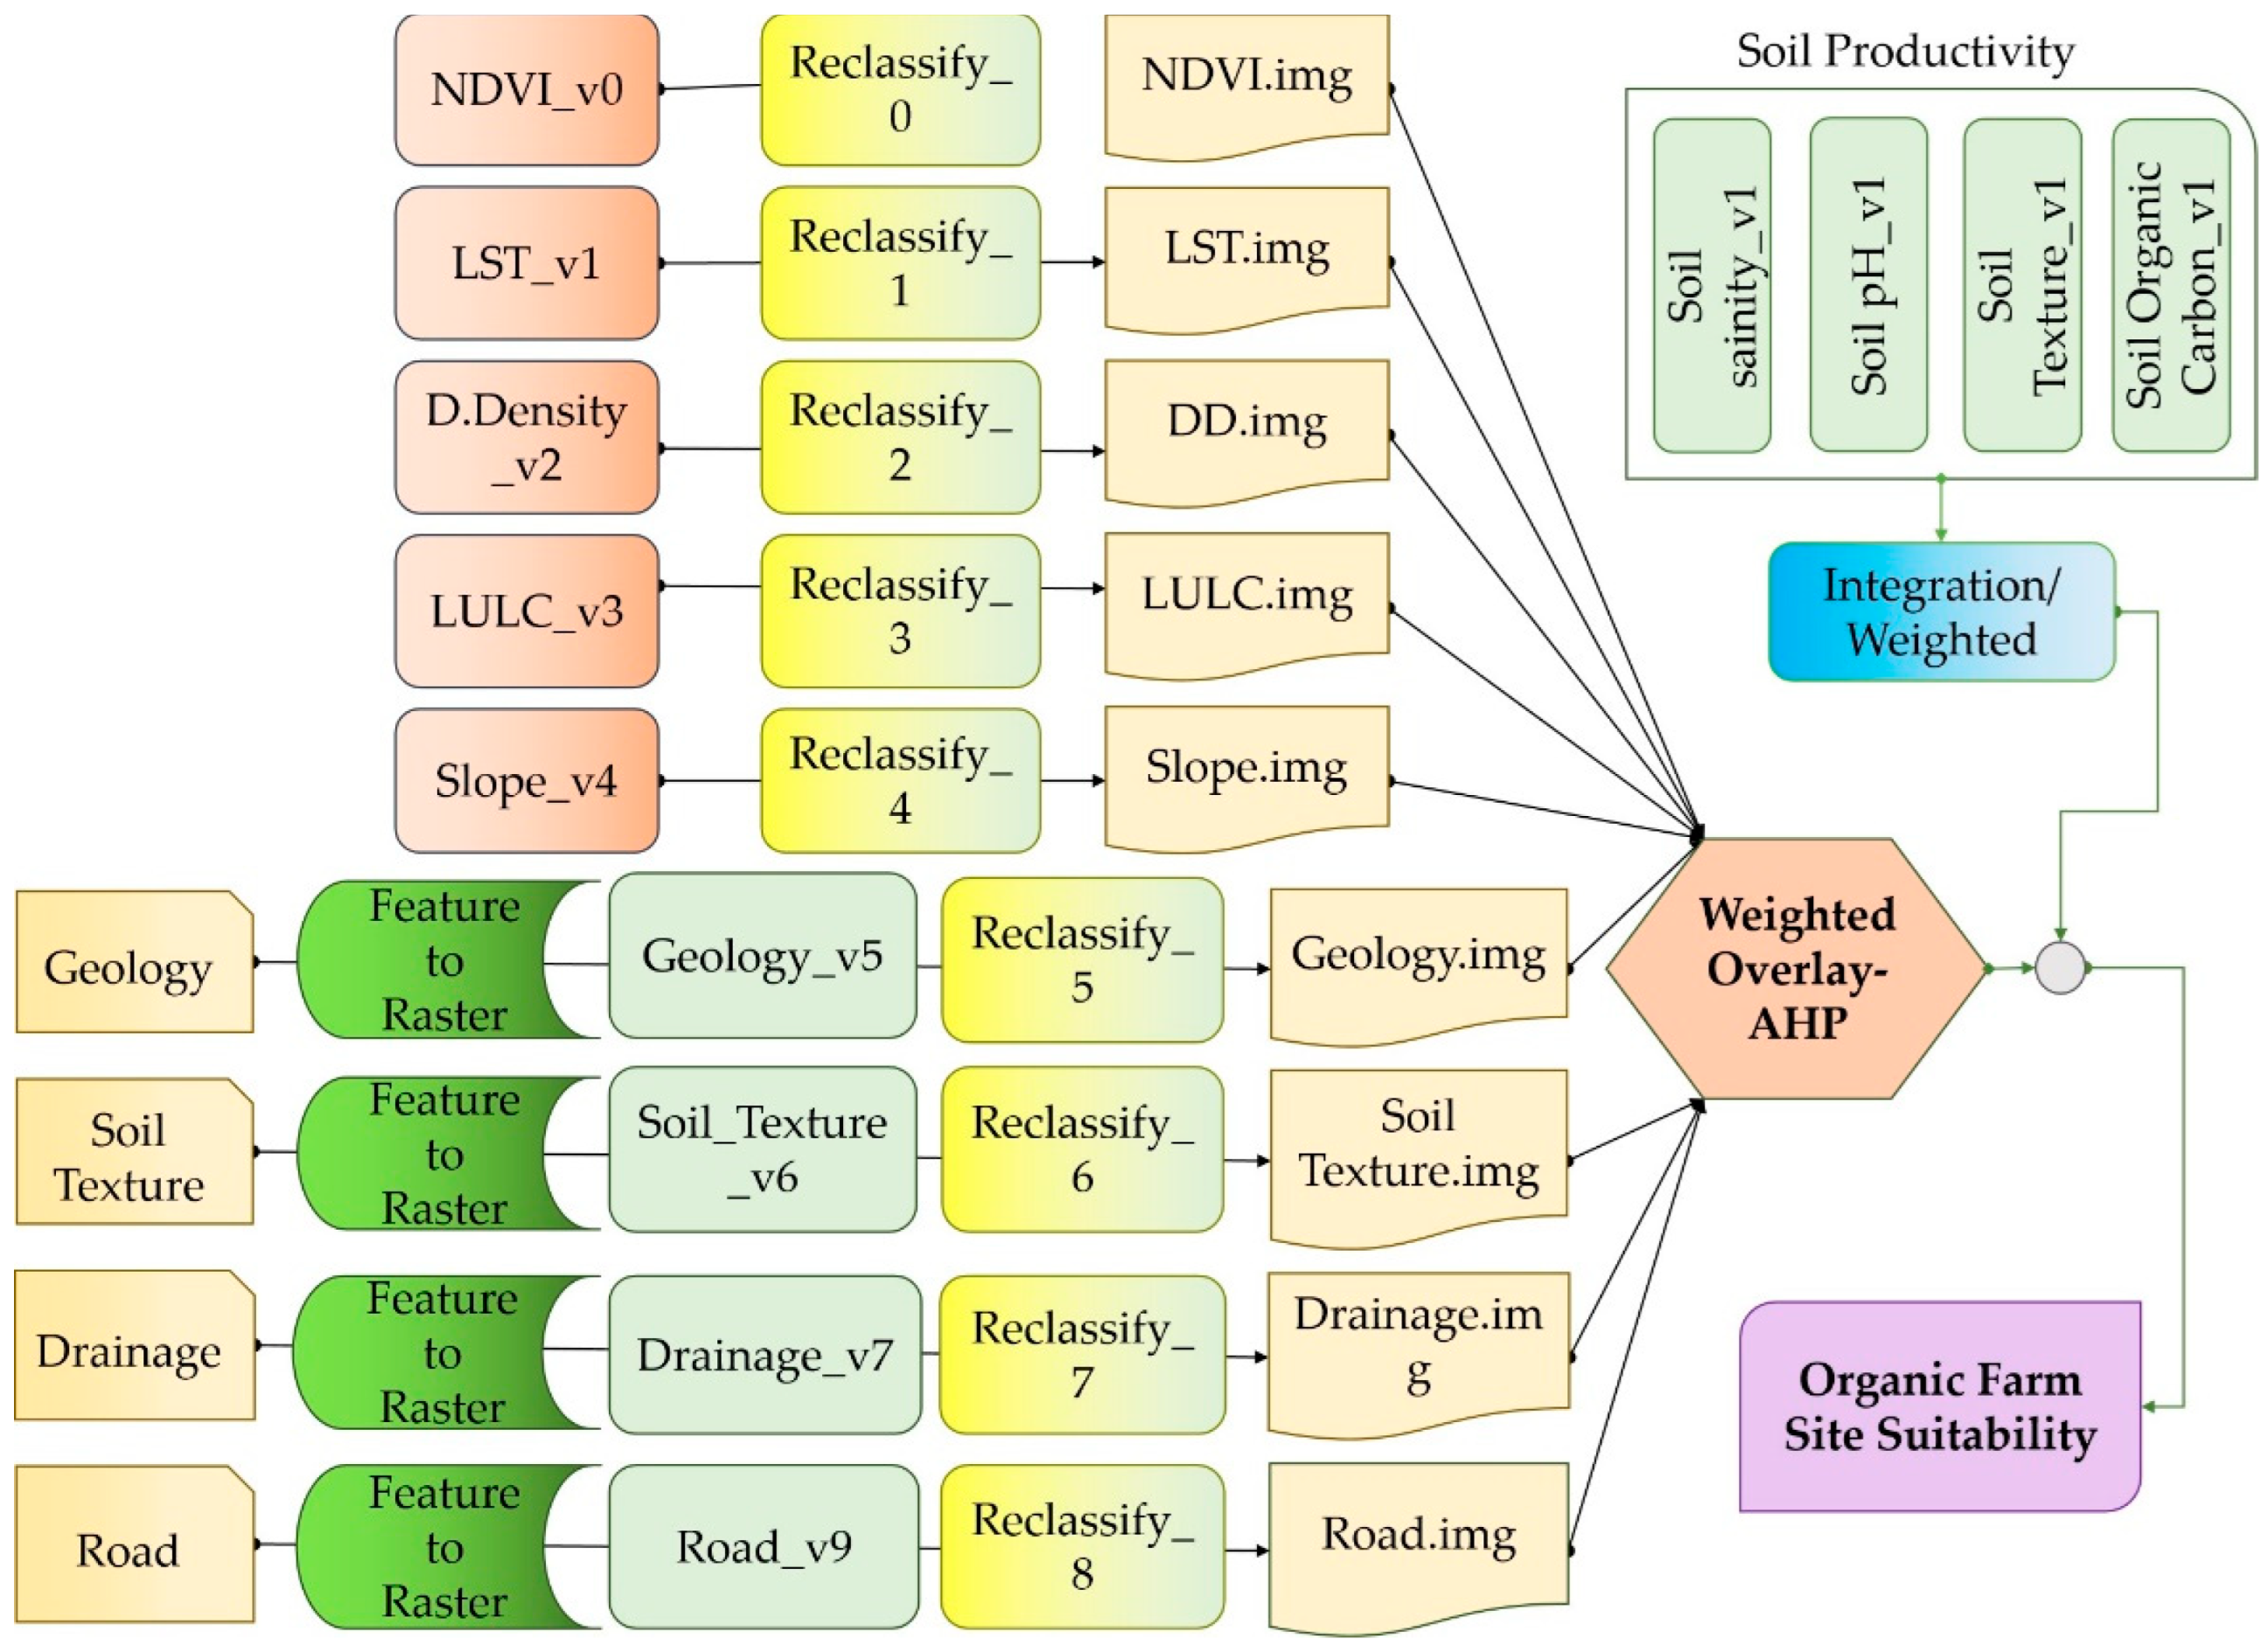
3.3. Generating Suitability Organic Farming Using Geospatial Model
3.4. Gravity Recovery and Climate Experiment (GRACE) and Precipitation Data in An Arid Region
4. Results and Discussion
4.1. Thematic Criteria Contribution
4.2. Pairwise Comparison Matrix
4.3. Normalized Comparison Matrix
4.4. Weight Overlay Analysis for Sub-Criteria
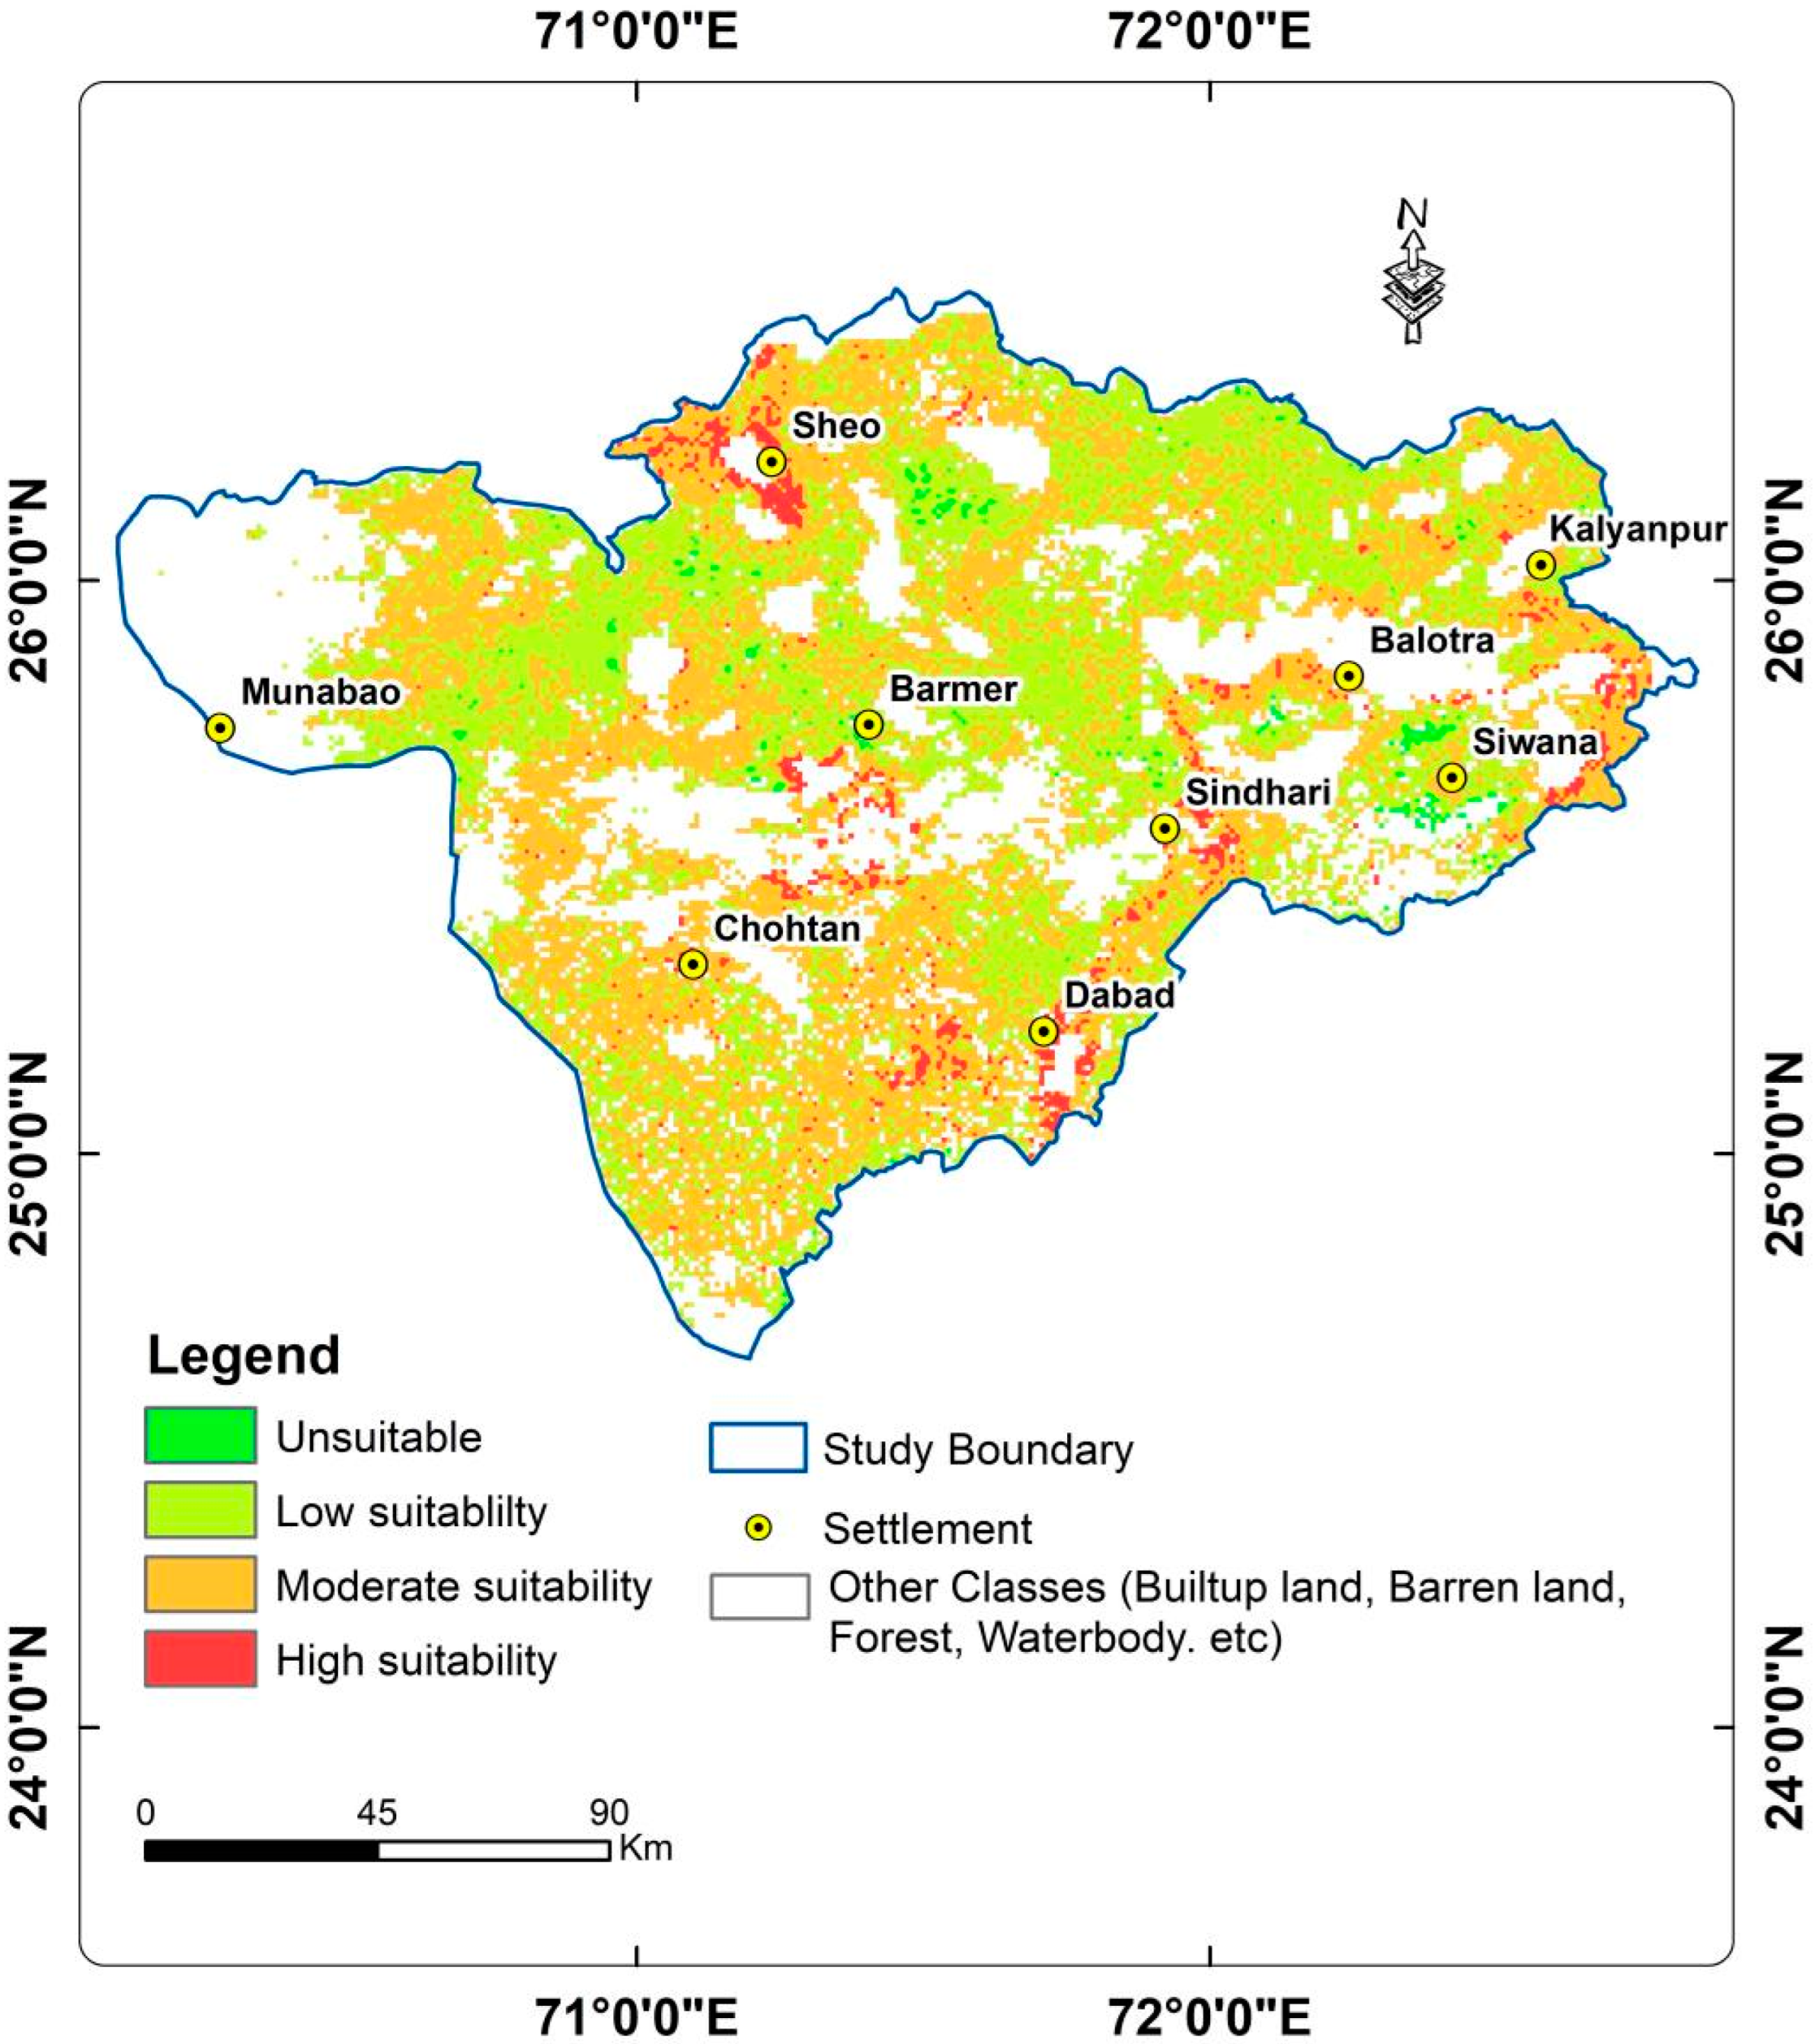
4.5. Suitability of Organic Farming
4.6. Comparison of Water Equivalent Thickness and Precipitation Data
5. Conclusions
Supplementary Materials
Author Contributions
Funding
Data Availability Statement
Acknowledgments
Conflicts of Interest
References
- Albalawi, E.K.; Kumar, L. Using Remote Sensing Technology to Detect, Model and Map Desertification: A Review. J. Food Agric. Environ. 2013, 11, 791–797. [Google Scholar]
- Haq, M.A.; Khadar Jilani, A.; Prabu, P. Deep Learning Based Modeling of Groundwater Storage Change. Comput. Mater. Contin. 2022, 70, 4599–4617. [Google Scholar] [CrossRef]
- Ajai, R.R.; Arya, A.S.; Dhinwa, P.S.; Pathan, S.K.; Ganesh Raj, K. Desertification/Land Degradation Status Mapping of India. Curr. Sci. 2009, 97, 1478–1483. [Google Scholar]
- Huang, J.; Zhang, G.; Zhang, Y.; Guan, X.; Wei, Y.; Guo, R. Global Desertification Vulnerability to Climate Change and Human Activities. Land Degrad. Dev. 2020, 31, 1380–1391. [Google Scholar] [CrossRef]
- Varghese, N.; Singh, N.P. Linkages between Land Use Changes, Desertification and Human Development in the Thar Desert Region of India. Land Use Policy 2016, 51, 18–25. [Google Scholar] [CrossRef]
- Kumar, M.; Santra, P.; Singh, S.K.; Raina, P.; Kar, A.; Ram, B.; Moharana, P.C. Identifying Sensitive Soil Properties as a Function of Land Use Change in Thar Desert of India. Agric. Res. 2018, 7, 187–199. [Google Scholar] [CrossRef]
- Salunkhe, S.S.; Bera, A.K.; Rao, S.S.; Venkataraman, V.R.; Raj, U.; Murthy, Y.V.N.K. Evaluation of Indicators for Desertification Risk Assessment in Part of Thar Desert Region of Rajasthan Using Geospatial Techniques. J. Earth Syst. Sci. 2018, 127, 116. [Google Scholar] [CrossRef] [Green Version]
- Leifeld, J. How Sustainable Is Organic Farming? Agric. Ecosyst. Environ. 2012, 150, 121–122. [Google Scholar] [CrossRef]
- Kamkar, B.; Dorri, M.A.; Da Silva, J.A.T. Assessment of Land Suitability and the Possibility and Performance of a Canola (Brassica Napus L.)—Soybean (Glycine Max L.) Rotation in Four Basins of Golestan Province, Iran. Egypt. J. Remote Sens. Space Sci. 2014, 17, 95–104. [Google Scholar] [CrossRef] [Green Version]
- Keshtkar, A.R.; Oros, Z.; Mohammadkhan, S.; Eagdari, S.; Paktinat, H. Multi-Criteria Analysis in Artemia Farming Site Selection for Sustainable Desert Ecosystems Planning and Management (Case Study: Siahkouh Playa, Iran). Environ. Earth Sci. 2016, 75, 1195. [Google Scholar] [CrossRef]
- Karimi, F.; Sultana, S.; Shirzadi Babakan, A.; Royall, D. Land Suitability Evaluation for Organic Agriculture of Wheat Using GIS and Multicriteria Analysis. Pap. Appl. Geogr. 2018, 4, 326–342. [Google Scholar] [CrossRef] [Green Version]
- Rajasekhar, M.; Sudarsana, R.G.; Nanabhau, K.; Ramachandra, M.; Pradeep, K.B. Multi-Criteria Land Suitability Analysis for Agriculture in Semi-Arid Region of Kadapa District, Southern India: Geospatial Approaches. Remote Sens. Land 2021, 5, 59–72. [Google Scholar] [CrossRef]
- Haq, M.A. Intellligent Sustainable Agricultural Water Practice Using Multi Sensor Spatiotemporal Evolution. Environ. Technol. 2021, 1–14. [Google Scholar] [CrossRef] [PubMed]
- Zolekar, R.B.; Bhagat, V.S. Multi-Criteria Land Suitability Analysis for Agriculture in Hilly Zone: Remote Sensing and GIS Approach. Comput. Electron. Agric. 2015, 118, 300–321. [Google Scholar] [CrossRef]
- Saaty, T.L. A Scaling Method for Priorities in Hierarchical Structures. J. Math. Psychol. 1977, 15, 234–281. [Google Scholar] [CrossRef]
- Roig-Tierno, N.; Baviera-Puig, A.; Buitrago-Vera, J.; Mas-Verdu, F. The Retail Site Location Decision Process Using GIS and the Analytical Hierarchy Process. Appl. Geogr. 2013, 40, 191–198. [Google Scholar] [CrossRef]
- Feizizadeh, B.; Jankowski, P.; Blaschke, T. A GIS Based Spatially-Explicit Sensitivity and Uncertainty Analysis Approach for Multi-Criteria Decision Analysis. Comput. Geosci. 2014, 64, 81–95. [Google Scholar] [CrossRef] [Green Version]
- Boroushaki, S.; Malczewski, J. Implementing an Extension of the Analytical Hierarchy Process Using Ordered Weighted Averaging Operators with Fuzzy Quantifiers in ArcGIS. Comput. Geosci. 2008, 34, 399–410. [Google Scholar] [CrossRef]
- Bunruamkaew, K.; Murayama, Y. Site Suitability Evaluation for Ecotourism Using GIS & AHP: A Case Study of Surat Thani Province, Thailand. Procedia Soc. Behav. Sci. 2011, 21, 269–278. [Google Scholar] [CrossRef] [Green Version]
- Khahro, S.H.; Matori, A.N.; Chandio, I.A.; Talpur, M.A.H. Land Suitability Analysis for Installing New Petrol Filling Stations Using GIS. Procedia Eng. 2014, 77, 28–36. [Google Scholar] [CrossRef] [Green Version]
- Xu, Y.; Sun, J.; Zhang, J.; Xu, Y.; Zhang, M.; Liao, X. Combining AHP with GIS in Synthetic Evaluation of Environmental Suitability for Living in China’s 35 Major Cities. Int. J. Geogr. Inf. Sci. 2012, 26, 1603–1623. [Google Scholar] [CrossRef]
- Le Campion, A.; Oury, F.X.; Heumez, E.; Rolland, B. Conventional versus Organic Farming Systems: Dissecting Comparisons to Improve Cereal Organic Breeding Strategies. Org. Agric. 2020, 10, 63–74. [Google Scholar] [CrossRef] [Green Version]
- Alsharif, W.; Saad, M.M.; Hirt, H. Desert Microbes for Boosting Sustainable Agriculture in Extreme Environments. Front. Microbiol. 2020, 11, 1666. [Google Scholar] [CrossRef] [PubMed]
- Thapa, G.B.; Rattanasuteerakul, K. Adoption and Extent of Organic Vegetable Farming in Mahasarakham Province, Thailand. Appl. Geogr. 2011, 31, 201–209. [Google Scholar] [CrossRef]
- Mishra, A.K.; Deep, S.; Choudhary, A. Identification of Suitable Sites for Organic Farming Using AHP & GIS. Egypt. J. Remote Sens. Space Sci. 2015, 18, 181–193. [Google Scholar] [CrossRef] [Green Version]
- Zolekar, R.B. Integrative Approach of RS and GIS in Characterization of Land Suitability for Agriculture: A Case Study of Darna Catchment. Arab. J. Geosci. 2018, 11, 780. [Google Scholar] [CrossRef]
- Sadeghiravesh, M.H.; Zehtabian, G.; Khosravi, H. Application of AHP and ELECTRE Models for Assessment of Dedesertification Alternatives. Desert 2014, 19, 141–153. [Google Scholar] [CrossRef]
- Saaty, T.L. How to Make a Decision: The Analytic Hierarchy Process. Eur. J. Oper. Res. 1990, 48, 9–26. [Google Scholar] [CrossRef]
- Chen, Y.; Yu, J.; Khan, S. Spatial Sensitivity Analysis of Multi-Criteria Weights in GIS-Based Land Suitability Evaluation. Environ. Model. Softw. 2010, 25, 1582–1591. [Google Scholar] [CrossRef]
- Effat, H.A.; Hassan, O.A. Designing and Evaluation of Three Alternatives Highway Routes Using the Analytical Hierarchy Process and the Least-Cost Path Analysis, Application in Sinai Peninsula, Egypt. Egypt. J. Remote Sens. Space Sci. 2013, 16, 141–151. [Google Scholar] [CrossRef] [Green Version]
- Haq, M.A.; Jain, K.; Shoab, M.; Menon, K.P.R. Estimation of Terrestrial Water Storage Change in the Bhagirathi Ganga and Vishnu Ganga Basins Using Satellite Gravimetry. In Proceedings of the 2013 IEEE International Geoscience and Remote Sensing Symposium (IGARSS), Melbourne, Australia, 21–26 July 2013; pp. 1817–1820. [Google Scholar] [CrossRef]
- Nefeslioglu, H.A.; Sezer, E.A.; Gokceoglu, C.; Ayas, Z. A Modified Analytical Hierarchy Process (M-AHP) Approach for Decision Support Systems in Natural Hazard Assessments. Comput. Geosci. 2013, 59, 1–8. [Google Scholar] [CrossRef]
- García, J.L.; Alvarado, A.; Blanco, J.; Jiménez, E.; Maldonado, A.A.; Cortés, G. Multi-Attribute Evaluation and Selection of Sites for Agricultural Product Warehouses Based on an Analytic Hierarchy Process. Comput. Electron. Agric. 2014, 100, 60–69. [Google Scholar] [CrossRef] [Green Version]
- Haq, M.A. CDLSTM: A Novel Model for Climate Change Forecasting. Comput. Mater. Contin. 2022, 71, 2363–2381. [Google Scholar] [CrossRef]
- Antzoulatos, G.; Kouloglou, I.-O.; Bakratsas, M.; Moumtzidou, A.; Gialampoukidis, I.; Karakostas, A.; Lombardo, F.; Fiorin, R.; Norbiato, D.; Ferri, M.; et al. Flood Hazard and Risk Mapping by Applying an Explainable Machine Learning Framework Using Satellite Imagery and GIS Data. Sustainability 2022, 14, 3251. [Google Scholar] [CrossRef]
- Chen, L.; Ren, C.; Li, L.; Wang, Y.; Zhang, B.; Wang, Z.; Li, L. A comparative assessment of geostatistical, machine learning, and hybrid approaches for mapping topsoil organic carbon content. ISPRS Int. J. Geo-Inf. 2019, 8, 174. [Google Scholar] [CrossRef] [Green Version]
- Rukhovich, D.I.; Koroleva, P.V.; Rukhovich, D.D.; Kalinina, N.V. The Use of Deep Machine Learning for the Automated Selection of Remote Sensing Data for the Determination of Areas of Arable Land Degradation Processes Distribution. Remote Sens. 2021, 13, 155. [Google Scholar] [CrossRef]


| Parameters | Classes | Weights |
|---|---|---|
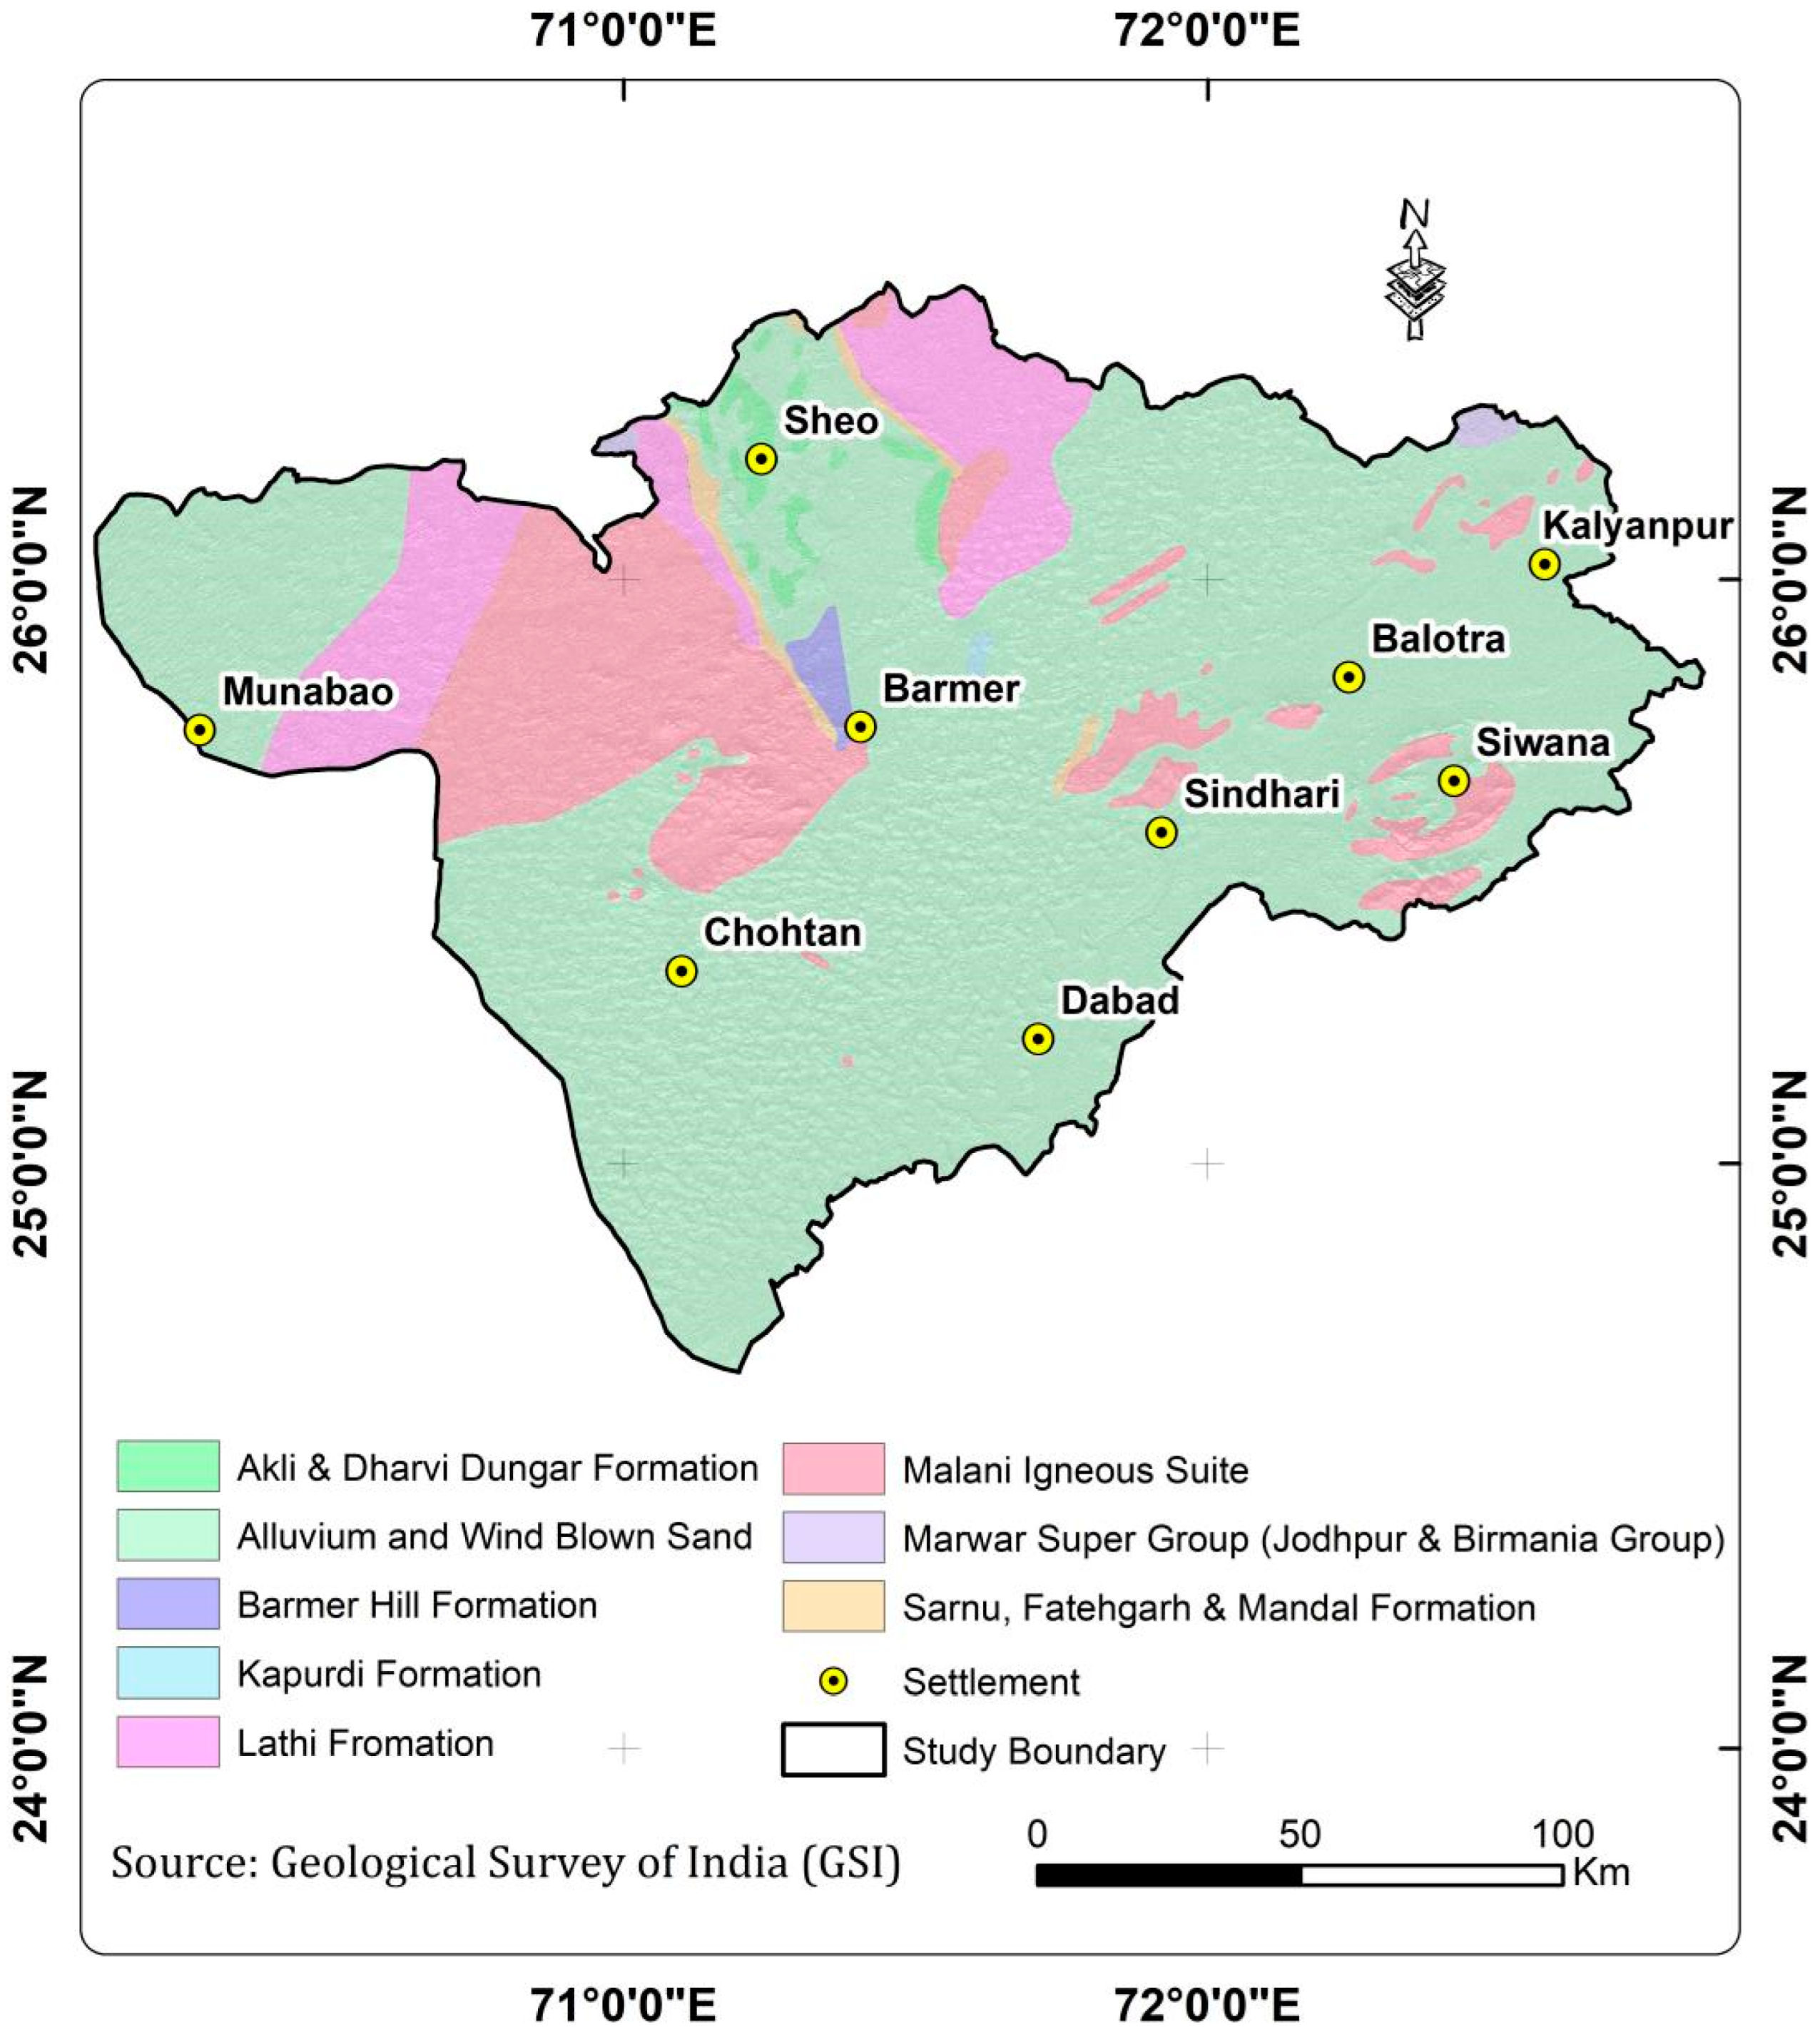
| Geology | Akli&DharviDungar Formation | 0.56 |
| Alluvium and windbl sand | 2.26 | |
| Kapurdi formation | 0.56 | |
| Lathi formation | 1.13 | |
| Malani Igneous suite | 0.56 | |
| Marwar supergroup | 0.56 | |
| Srnu, Fetehgarh& Mandal formation | 1.69 | |
| Soil pH | Acid | 4.13 |
| Neutral | 2.75 | |
| Alkaline | 1.38 | |
| Soil Texture | Loamy | 2.91 |
| Sandy | 0.97 | |
| Gravelly Loam hilly soil | 1.46 | |
| Gravelly sand | 0.97 | |
| Gravelly loamy | 1.94 | |
| LULC | Settlement | 0.57 |
| Agriculture land | 2.29 | |
| Rocky outcrop | 0.57 | |
| Sand dunes | 0.57 | |
| Open Forest | 0.57 | |
| Plantation | 0.57 | |
| River | 0.57 | |
| Industry/wasteland | 0.86 | |
| Shrubland | 1.14 | |
| Sand dunes + shrub land | 1.71 | |
| LST | High | 1.57 |
| Moderate | 3.14 | |
| Low | 4.71 | |
| DD | Very low | 0.73 |
| Low | 1.47 | |
| Moderate | 2.20 | |
| High | 2.93 | |
| Very high | 3.67 | |
| Road | <5 km | 3.67 |
| 5–10 km | 2.93 | |
| 11–20 km | 2.20 | |
| 21–40 km | 1.47 | |
| >40 | 0.73 | |
| Slope | Nearly Level | 3.30 |
| Gently sloping | 2.83 | |
| Moderately sloping | 2.36 | |
| Strongly sloping | 1.89 | |
| Moderately steep | 1.41 | |
| Steep | 0.94 | |
| Very steep | 0.47 | |
| SOC | Very low | 1.10 |
| Low | 2.20 | |
| Moderate | 3.30 | |
| High | 4.40 | |
| Very high | 5.50 | |
| Salinity | Non salinity | 7.33 |
| Low salinity | 5.87 | |
| Medium salinity | 4.40 | |
| High salinity | 2.93 | |
| Extra salinity | 1.47 | |
| Rainfall | very low | 4.40 |
| Low | 8.80 | |
| Moderate | 13.20 | |
| High | 17.60 | |
| Very high | 22.00 | |
| NDVI | Very low | 2.20 |
| Low | 4.40 | |
| Moderate | 6.60 | |
| High | 8.80 | |
| Very high | 11.00 |
Publisher’s Note: MDPI stays neutral with regard to jurisdictional claims in published maps and institutional affiliations. |
© 2022 by the authors. Licensee MDPI, Basel, Switzerland. This article is an open access article distributed under the terms and conditions of the Creative Commons Attribution (CC BY) license (https://creativecommons.org/licenses/by/4.0/).
Share and Cite
Mangan, P.; Pandi, D.; Haq, M.A.; Sinha, A.; Nagarajan, R.; Dasani, T.; Keshta, I.; Alshehri, M. Analytic Hierarchy Process Based Land Suitability for Organic Farming in the Arid Region. Sustainability 2022, 14, 4542. https://doi.org/10.3390/su14084542
Mangan P, Pandi D, Haq MA, Sinha A, Nagarajan R, Dasani T, Keshta I, Alshehri M. Analytic Hierarchy Process Based Land Suitability for Organic Farming in the Arid Region. Sustainability. 2022; 14(8):4542. https://doi.org/10.3390/su14084542
Chicago/Turabian StyleMangan, Pandian, Dinagarapandi Pandi, Mohd Anul Haq, Aniruddha Sinha, Rajagopal Nagarajan, Twinkle Dasani, Ismail Keshta, and Mohammed Alshehri. 2022. "Analytic Hierarchy Process Based Land Suitability for Organic Farming in the Arid Region" Sustainability 14, no. 8: 4542. https://doi.org/10.3390/su14084542
APA StyleMangan, P., Pandi, D., Haq, M. A., Sinha, A., Nagarajan, R., Dasani, T., Keshta, I., & Alshehri, M. (2022). Analytic Hierarchy Process Based Land Suitability for Organic Farming in the Arid Region. Sustainability, 14(8), 4542. https://doi.org/10.3390/su14084542