Article

Identification of Waste Based on Lean Principles as the Way towards Sustainability of a Higher Education Institution: A Case Study from Indonesia

by
Lusia Permata Sari Hartanti
1,*,
Ivan Gunawan
1,
Ig. Jaka Mulyana
1 and
Herwinarso Herwinarso
2
1
Industrial Engineering Department, Faculty of Engineering, Widya Mandala Surabaya Catholic University, Surabaya 60114, Indonesia
2
Physics Department, Faculty of Education and Teacher Training, Widya Mandala Surabaya Catholic University, Surabaya 60114, Indonesia
*
Author to whom correspondence should be addressed.
Sustainability 2022, 14(7), 4348; https://doi.org/10.3390/su14074348
Submission received: 31 January 2022 / Revised: 1 April 2022 / Accepted: 2 April 2022 / Published: 6 April 2022
(This article belongs to the Special Issue Sustainable Higher Education and Leadership)

Abstract

:
Lean management has generated new approaches to reduce non-value-adding activities in different sectors of the economy, including in higher education systems. Lean principles in higher education institutions (HEIs) contribute positively to sustainability performance. The current study aims to: (a) assess waste in HEIs based on lean principles and even their potential effect on sustainability; (b) establish the relationship among wastes; (c) develop a structural model using Interpretative Structural Modeling (ISM); (d) carry out the Matrice d’impacts Croisés Multiplication Appliqué Àun Classement (MICMAC) analysis. In Phase 1 of this study, the identification of waste modes in HEIs was established. In Phase 2, risk assessment of each waste mode was conducted using the waste-Failure Mode and Effect Analysis (w-FMEA) technique. In Phase 3, ISM-MICMAC was used to identify relationships among critical waste modes. The results showed that eighteen waste modes were identified as critical in HEIs—with six waste modes being autonomous determinants; four were dependent determinants, four were linkage determinants, and four were driver determinants. This study is expected to help academicians and practitioners understand HEI’s waste types by listing the critical wastes, mapping their interrelationship, identifying the driving power and dependence, and proposing mitigation actions. It will also contribute to the growing body of literature highlighting the waste in HEIs.

Graphical Abstract

1. Introduction

Toyota first introduced lean principles as an alternative process management system. To produce process efficiency by focusing on customer and effective operations management, Toyota invented the ‘Toyota Production System (TPS)’, later known as lean philosophy [1]. Lean philosophy focuses on stabilizing and standardizing work processes so that critical problems become apparent, and the workforce develops the ability to think critically to solve problems and improve workflow [2]. It seeks optimal production of goods or services by eliminating waste and increasing the flow of activity throughout the entire value stream [3].
Lean principles were born in the manufacturing industry and then—due to the opportunities and benefits it creates [4]—have been adopted as an improvement program in various organizations such as service organizations [5] in both public [6] and private sectors [7]. Nowadays, the implementation of lean principles has increased in HEIs [8]. Lean higher education is the application of lean principles to higher education administration (admissions, add/drop credit, purchasing, facilities, hiring, and budgeting) as well as academic activities (course design and teaching, improving degree programs, student feedback, handling of assignments) [9]. Although many service sectors still perceive lean practices are only applicable to the manufacturing sector [10], more HEIs in developed countries such as the United Kingdom and the United States are now using lean principles to improve their operations. According to Thomas et al. [11], compared to the amount of knowledge on lean in the manufacturing sector, the literature on applying lean principles in HEIs is still in its infancy, but this research’s extent is growing.
Currently, many businesses are concerned with sustainability. Sustainability, as defined, is a property of a process or state that can be maintained at a certain level indefinitely [12]. Namely, the Triple Bottom Line strategy necessitates a comprehensive performance based on three pillars of sustainability, including social, economic, and environmental [13,14]. To measure sustainability in HEIs, Aleixo et al. [15] presented four metrics: social, economic, environmental, and institutional/educational/political sustainability, as shown in Table 1. The need to become involved in environmental, social, and economic sustainability and institutional/academic/political sustainability in HEIs arose primarily due to increased pressure from stakeholders. Applying sustainability in management processes and organizations contributes to the quality of life of all stakeholders and contributes to society, the economy, and environmental conservation [16].
There is a relationship and interaction between lean and sustainability that helps increase competitiveness and efficiency in production. Camuffo et al. [17] stated that lean principles represent sustainability and streamline costs, time, waste, and quality processes. Nawanir et al. [13] found a positive relationship between lean principles in HEIs and sustainability performance in terms of environmental, economic, institutional, and social; this implied that HEIs could implement lean principles to improve sustainability. However, the implementation of lean sustainability in higher education is faced with the unique problem that there are no mutually agreed metrics for institutional efficiency and, in particular, the lack of metrics for student learning and teaching effectiveness [18].
Several authors have analyzed the relationship between lean principles and sustainability criteria. Tăucean et al. [19] explained 12 principles of sustainability, the 12 principles of lean, and the interaction between lean operation and sustainability criteria in the management process. Khodeir and Othman [16] examined the interaction between lean and sustainability principles in the management process and found that lean and sustainability development have practically the same agenda in terms of enhancing processes and stakeholder quality of life, decreasing all forms of waste, monitoring, and self-evaluation for continuous improvement, and marketing concerns.
Kazancoglu and Ozkan-Ozen [10] conducted a study in a business school at Turkish HEIs to identify the eight wastes in HEIs and present a model for categorizing wastes and sub-wastes using criteria and sub-criteria using The Multi-Criteria Decision Making (MCDM) application. Kazancoglu and Ozkan-Ozen [10] identified 22 sub waste in HEIs and analyzed their cause–effect relationships. Then, an importance level could be assigned to each sub waste by assessing cause–effect relationships. This study may be used to understand better the wastes in higher education institutions (HEIs) and the causal relationships between them and develop ways to eliminate them. However, this study does not clearly explain the process of identifying wastes. Undoubtedly, brainstorming or interviews will reveal many hidden wastes in an HEI. We suggest prioritizing the significant wastes, and the insignificant wastes will usually be eliminated. Therefore, we propose w-FMEA as a waste screening instrument by considering its severity, occurrence, and detection.
Some studies have shown how lean principles have been successfully used in HEIs. Doman [20] conducted a case study to demonstrate that through an innovative and engaging learning experience involving undergraduate students, lean principles and techniques used in industry may be successfully implemented to improve higher education operations. Höfer and Naeve [21] showed the case studies of lean principle, i.e., customer focus, value stream, flow principle, pull principle, and pursue perfection in operational of HEI. However, the multiple case studies narrated by Höfer and Naeve [21] only focus on lean thinking in problem-solving. Focusing on a single in-depth case study will provide a clearer picture of an established method (lean) applied to a new subject (HEI). Nicholson and Pakgohar [22] used lean principles to solve some of the pressure points for academic workloads in a university law clinic. The studies have applied lean principles in HEI to evaluate and design the processes more effectively.
HEIs are now operating in an increasingly complex and challenging situation [20] as they have to meet growing student demand and the continuous organizational improvement it entails [21]. Educational institutions are now facing unprecedented competition for students, research funds, prestige, quality ratings, incubated companies, fundraising, academicians, skilled workers, and so on [9]. There are specific conflicting goals for service providers with customers inside and outside HEIs [22]. Globalization has also encouraged HEIs to constantly develop robust quality-assurance systems for faculty improvement, research funding, and academic and technological programs. These have motivated HEIs to redesign their business processes to reduce administration overheads and improve services for stakeholders [21].
Similar to the application in other industries, the goal of lean practices in HEIs is to add value without wasting resources [23]. If it is applied correctly, lean practices will eliminate waste—making processes more efficient and delivering better values to customers of HEIs—with core processes covering teaching-learning, research, and dissemination of new knowledge and information [22]. However, It is necessary to define waste and how they are interconnected to identify and eliminate the root causes [10].
Previous studies have identified lean wastes in HEIs by adapting the conceptual wastes in the manufacturing industry. Some identified seven types of waste, others eight [24]. The former was postulated by Narayanamurthy et al. [25], but then the categories were cut down into six, i.e., motion, waiting, overproduction, over-processing, defect, and rework. The latter was coined by Anthony et al. [26], with the eight categories being excess motion, excess transportation, underutilized human resource, inventory, defects, overproduction, waiting, and over-processing. Hartanti et al. [27] then conducted a systematic literature review and concluded that there are nine types of waste: excess motion, excess transportation, underutilized human resource, inventory, defects, overproduction, waiting, over-processing, and excess information.
Wastes such as the above may cause system failures that lead to discontent for a set of customers inside and outside HEIs. Therefore, HEIs must implement good risk management from the outset and throughout the systems. In risk management practice, risk analyses are needed to investigate and estimate the impacts and consequences of risks and comprehend the nature, sources, and causes. Failure Mode and Effect Analysis (FMEA) is a valuable risk management tool to identify potential system failures and assess the causes and effects, thereby preventing them from occurring [28]. FMEA is used in the review process or decision-making in a product or system design to improve safety and reliability [29]. The FMEA steps are as follows: (1) selecting a process; (2) designing a multidisciplinary team; (3) gathering and organizing information; (4) conducting a hazard analysis; (5) developing and implementing actions; (6) measuring the outcome [30]. The risk for each element is expressed as Risk Priority Number (RPN) and calculated as a product of severity (S), occurrence (Oc), and detection (D) [31]. Because FMEA in this study is employed to identify waste, the term w-FMEA is used. Then, RPN is also translated as Waste Priority Number (WPN). The WPN will rank the impact of each waste based on the S, Oc, and D.
After finding the rank of each waste, ISM will then be used to examine the relationship of the influential wastes so that a solution can be proposed. The hypothesis proposed in this study is that waste identification and waste mapping will provide insights that lead to the discovery of practical solutions to ensure the sustainability of an HEI. ISM is a qualitative tool to understand the complex interrelationships between elements [32,33]. ISM is frequently used to understand complex problems and build an action plan to resolve complex issues [34]. ISM describes how aspects are related to one another and discovers the pattern among the elements [33]. Elements in this research are the identified wastes in the HEI. The analysis of ISM is usually integrated with MICMAC [35]. MICMAC cartesian diagram will group each waste into four quadrants (autonomous, linkage, driver, and dependent) based on its driving power and dependencies. With MICMAC analysis, a more comprehensive waste analysis can be generated.

Sustainability in HEIs

Nawanir et al. [13] divided lean practices in HEIs into seven categories: waste identification, work standardization, level and balance workloads, built-in quality, pull system, multifunctional employees, and continuous improvement. Lean practices in HEIs as a systemic approach play an important role in sustainability because of their potential effect on sustainability performance. The primary purpose of lean principles is to maximize stakeholder value and eliminate all waste to optimize the entire process [18,19]. Applying lean principles in HEI can improve student satisfaction.
HEIs are a good candidate for lean and sustainable practices [18]. In the last few years, there have been many studies on successful sustainable development in HEIs, e.g., [13,15,17,36,37]. Aleixo et al. [15] pointed out five sustainable development activities in HEIs—education, research, campus operations, community outreach, and raising awareness in the community—that need communication and coordination with the different stakeholders. These circumstances triggered waste in day-to-day activities related to many cross-functional or departmental processes, so it requires more time or steps.
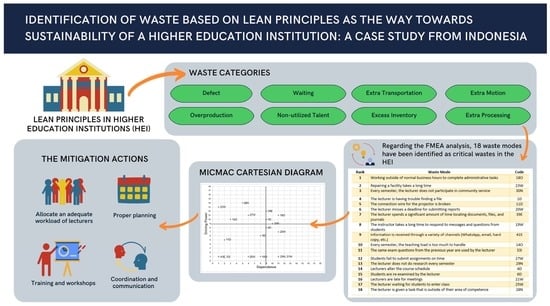
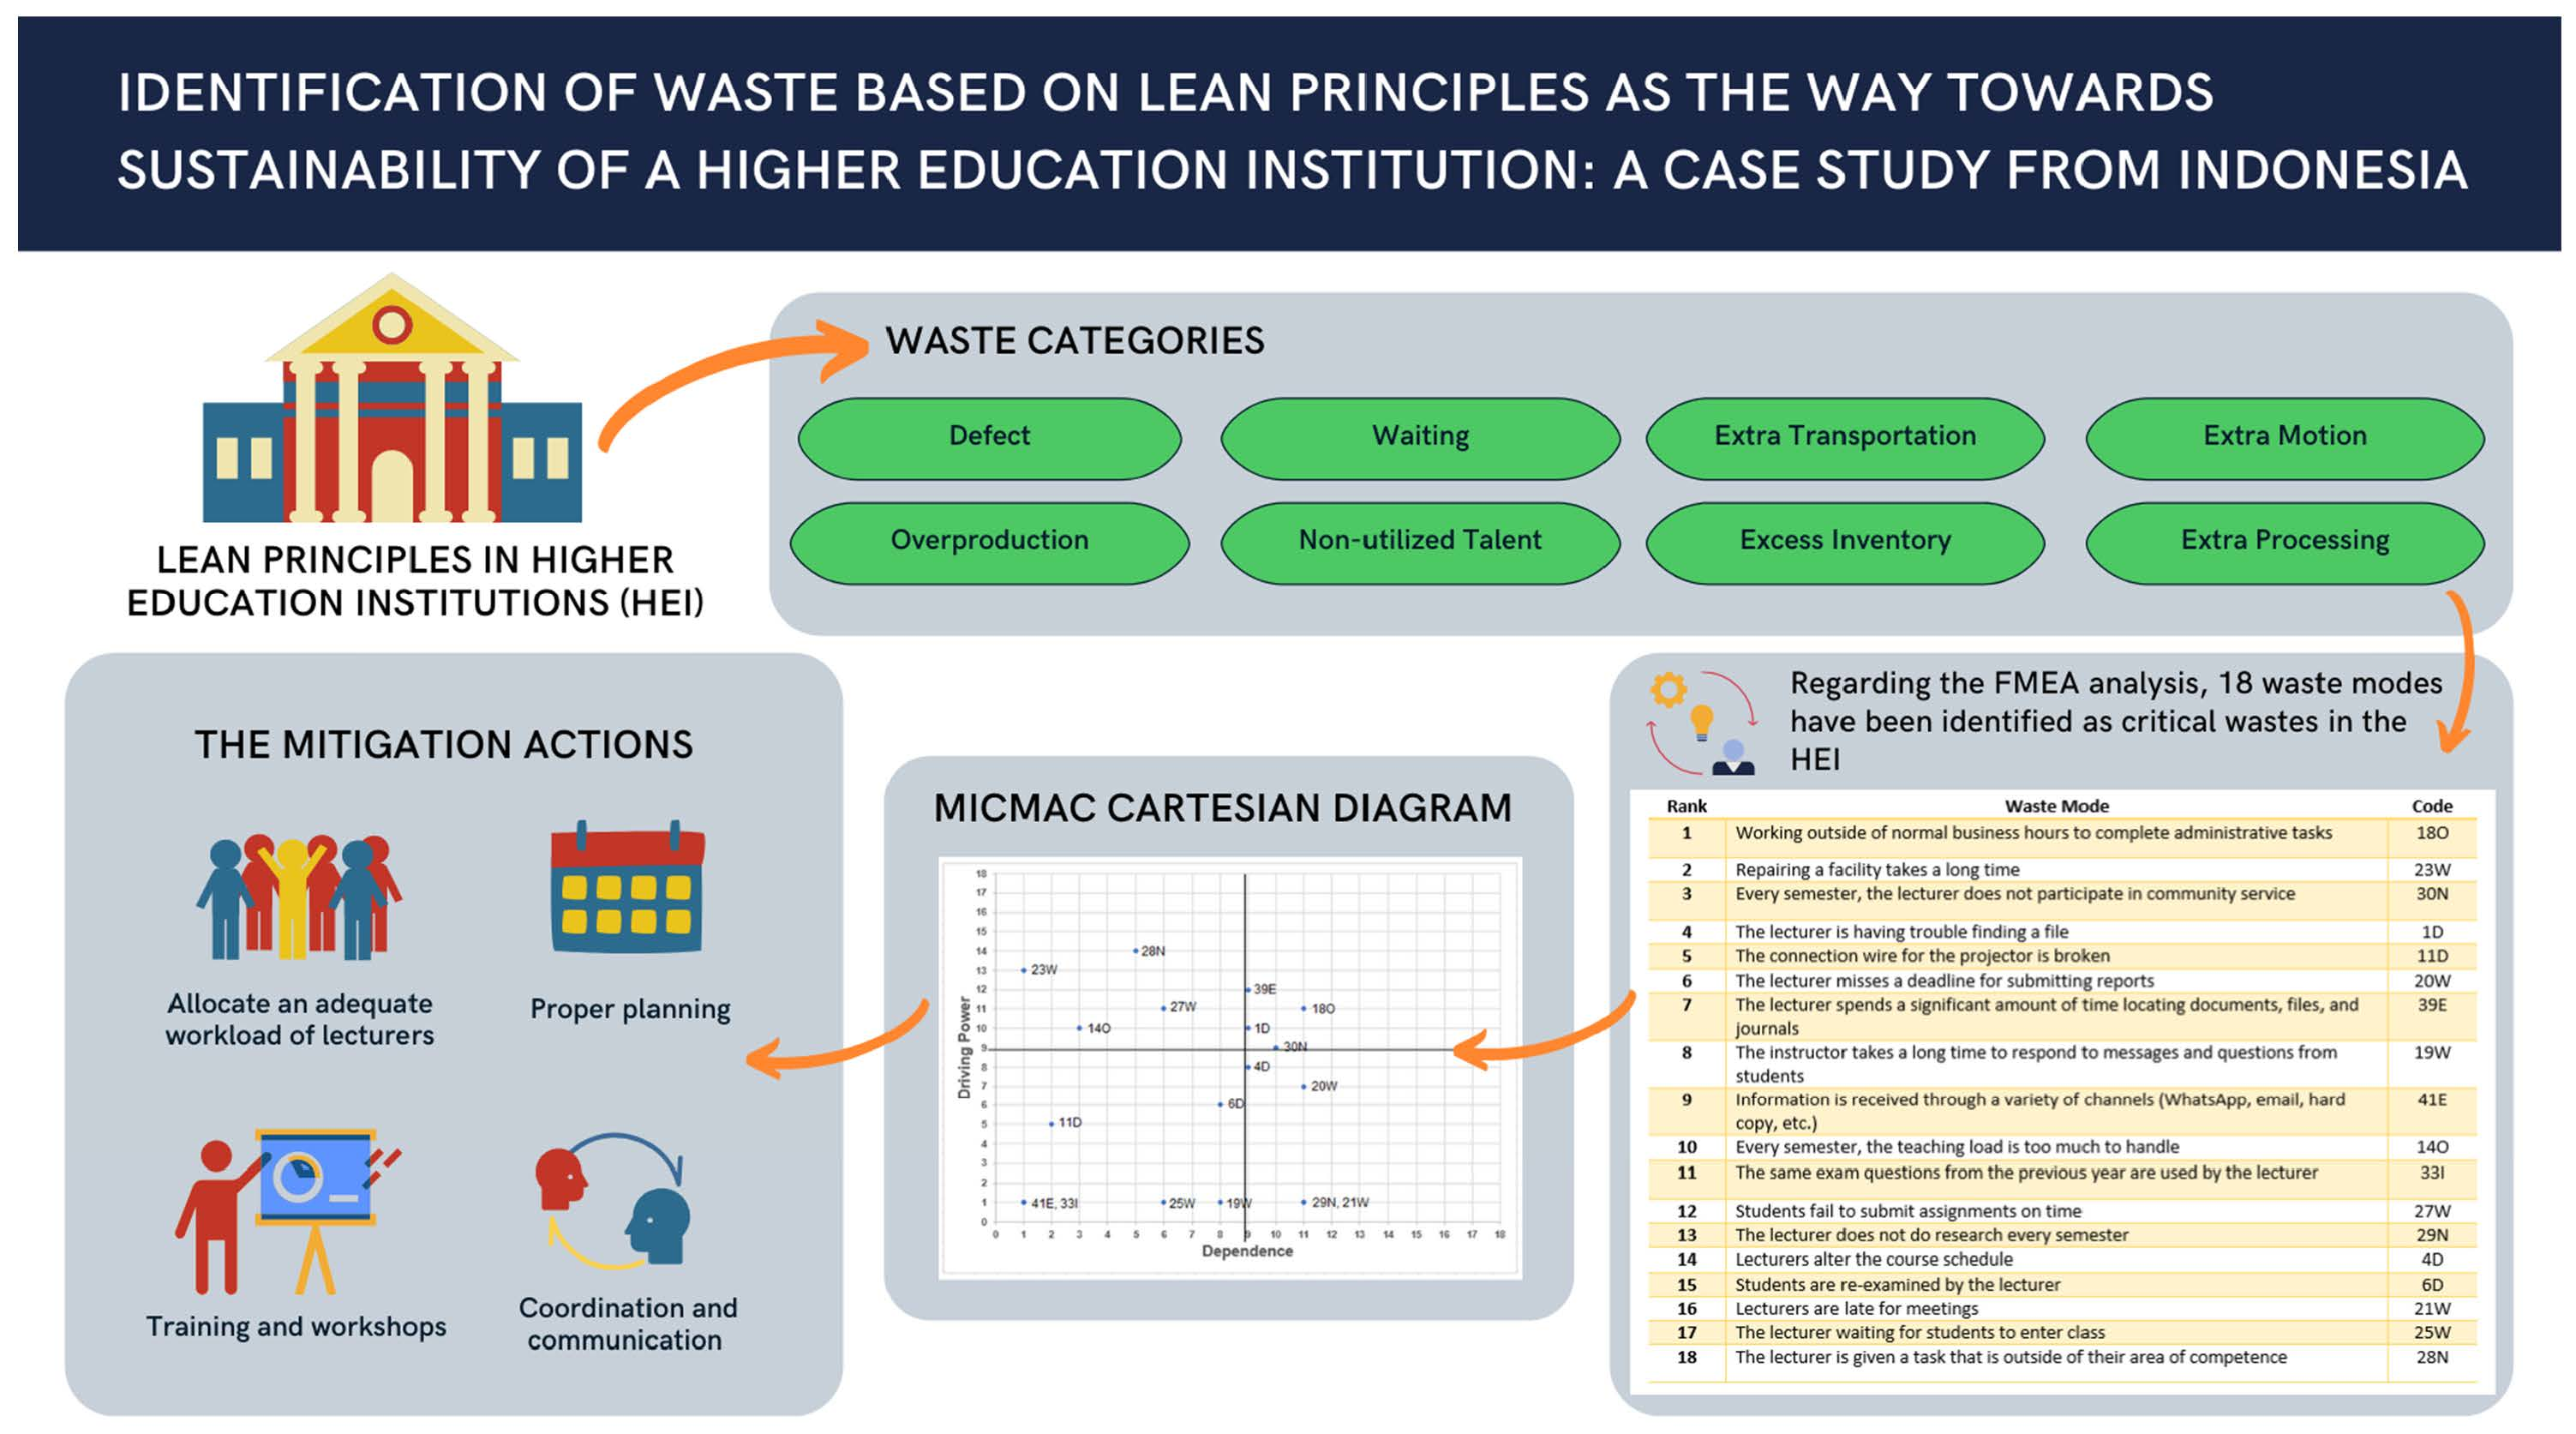
The aims of this study are (a) to assess waste in HEIs based on lean principles and even their potential effect on sustainability; (b) to establish the relationship among wastes; (c) to develop a structural model using ISM; (d) to carry out the MICMAC analysis. By identifying the critical wastes, HEIs can focus on developing strategies for waste minimization and improving the quality of HEIs. The results of this study exemplified priorities for HEIs to start the utilization of lean practices as well as define actions to reduce the most critical wastes and practice sustainable development in HEIs.

2. Materials and Methods

The case study was conducted in the Faculty of Engineering (FE) and Faculty of Teacher and Training Education (FTTE) in an HEI in Surabaya, Indonesia. This case was selected using the availability sampling technique. The first phase was to define the types of waste categorized into eight groups: defects, overproduction, waiting, non-utilized talent, extra transportation, excess inventory, excess motion, and extra processing.
The second phase was developing risk prioritization of each waste based on the FMEA technique adopted from de Souza and Carpinetti [38]. This technique is called w-FMEA. The w-FMEA technique starts by determining the potential failure and effect, then the severity of each effect is determined by giving a rating from 1 (low risk) to 10 (maximum severity). After that, the potential causes are identified, and their potential occurrence is determined by giving a rating from 1 (rare) to 10 (very high). The detection value is measured by rating from 1 (very effective) to 10 (very ineffective). WPN was calculated by multiplying the S, Oc, and D, based on the equation for calculation RPN [37]. The head of department and faculty completed the S, Oc, D scoring. In 2021, the population of department heads was sixteen in FE and FTTE. Sixteen department heads in FE and FTTE were asked to complete the questionnaire.
The third phase is to employ ISM in developing a risk source hierarchy that will support the decision-making process to eliminate each waste mode. ISM is conducted by following the steps developed by [39] as follows:
  • Steps 1: An expert panel examined the contextual relationship among waste modes from the WPN score identified in the first phase.
    The judgment was conducted to construct the contextual links among the elements/variables of interest. Four separate symbols (V, A, X, and O) were used in the ISM technique to characterize the relationship between each pair of variables of interest:
    •  V: attribute i determines attribute j;
    •  A: attribute i is determined by attribute j;
    •  X: attributes i and j determine each other;
    •  O: attributes i and j are unrelated.
2.
Step 2: A Structural Self-Interaction Matrix (SSIM) is developed for the waste modes.
3.
Step 3: The SSIM creates an initial reachability matrix, verified for transitivity to become a final reachability matrix.
The initial reachability matrix is a binary matrix that is created by replacing V, A, X, or O with one or zero using the standard rules found in the ISM [40]:
  • If the (i, j) entry in the SSIM is V, then entry (i, j) in the reachability matrix is set to one, while entry (j, i) is set to zero.
  • If the (i, j) entry in the SSIM is A, then entry (i, j) in the reachability matrix is set to zero, while entry (j, i) is set to one.
  • If the (i, j) entry in the SSIM is X, then both the (i, j) and (j, i) entries in the reachability matrix are set to one.
  • If the (i, j) entry in the SSIM is O, then in the reachability matrix, both entries (i, j) and (j, i) are set to zero.
    • The final reachability matrix was created by applying the transitivity property based on the initial reachability matrix.
4.
Step 4: The final reachability matrix obtained in Step 3 is partitioned into different levels and then interpreted.
5.
Step 5: The final reachability matrix obtained in Step 3 also becomes the basis for constructing a MICMAC Cartesian diagram to enrich the interpretation.

3. Results

3.1. Waste Modes in the HEI

This study used w-FMEA, which concentrates on identifying waste categories in an HEI and defining priorities for waste category elimination [38]. The initial phase defines the types of waste collected from FE and FTTE lectures. In this phase, 46 waste modes were found, covering eight categories (Table A1): defects, overproduction, waiting, non-utilized talent, extra transportation, excess inventory, excess motion, and extra processing. In total, 46 waste modes in HEI were obtained based on academicians’ opinions of lecturers and department heads.
The application of w-FMEA has led to identifying the waste modes, evaluation of severity, occurrence, detection, and calculation of WPN, as presented in Table A2. Table A2 presents a qualitative and quantitative description of the cause-and-effect analysis, the occurrence score, detection score, severity score, and WPN. A questionnaire was distributed, and the heads of departments and faculties were asked to give S, Oc, D scores. The application of w-FMEA resulted in the WPN of waste modes. The waste modes listed in Table A2 were ranked according to WPN to identify critical waste modes. This study identified eighteen critical waste modes, as presented in Table 2. Eighteen waste modes have been identified as critical waste in the HEI: 18O, 23W, 30NT, 1D, 11D, 20W, 39E, 19W, 41E, 14O, 33I, 27W, 29NT, 4D, 6D, 21W, 25W, and 28N.
After identifying the critical wastes based on the WPN scores in the HEI and understanding the relationship among waste modes, the present study creates the ISM.

3.2. Applying ISM Technique in the Case Study

The SSIM was created by establishing contextual relationships among the waste modes and their direction. Four symbols (V, A, X, and O) have been used, and each symbol represents a particular relationship dependent on the direction. Based on the contextual relationship, the SSIM matrix has been consistently established and is provided in Table A3. After establishing the SSIM, the next step was to develop an initial reachability matrix. SSIM is transformed by replacing each cell entry of SSIM with one and zero to construct an initial reachability matrix. The initial reachability matrix is shown in Table A4. The initial reachability matrix was checked for transitivity, where relationships are made on assumptions. The final reachability matrix is shown in Table A5. After that, each attribute’s reachability and antecedent set were further developed as the next logical step in applying ISM.
Level partitions are being developed to determine the hierarchy among the waste modes based on reachability set, antecedent sets, and the intersection of reachability set and antecedent set. The reachability set is a column of waste modes with a value of one for all waste modes in row i of the final reachability matrix. The antecedent set is a set of waste modes in a row with a value of one in j of the final reachability matrix. Through a series of iterations, the waste modes were grouped into various levels. Results of the iteration process are presented in Table 3. The final step in applying the ISM technique is to identify and assess each determinant’s driving and dependent powers (attribute) of interest using MICMAC analysis. By grouping the waste modes into clusters, MICMAC helps minimize the scale of some complicated issues, making them more manageable and discovering hidden linkages between diverse waste modes. Following the MICMAC analysis procedure, Figure 1 depicts the driving power and dependence diagram for the determinants of waste modes, with the identified determinants placed into the appropriate quadrants based on the driving power and dependence values available in the final reachability matrix. The MICMAC analysis has divided the determinants into four clusters, which are:
  • Autonomous determinants or the first quadrant that includes waste modes with weak driving power and weak dependence: 41E, 33I, 25W, 19W, 11D, and 6D;
  • Dependent determinants or the second quadrant that includes waste modes with weak driving power but strong dependence: 29N, 21W, 20W, and 4D;
  • Linkage determinants or the third quadrant that consists of waste mode with solid driving power and strong dependence: 30N, 1D, 180, and 39E;
  • Driver determinants or the fourth quadrant include waste mode with strong driving power but weak dependence: 23W, 14O, 27W, and 28N.
This study’s findings are summarized in Table 4.

4. Discussion

In the manufacturing sector, lean implementation has proved quite successful as it reduces waste and increases efficiency. This success encourages another sector to implement lean principles to improve the quality of its services. In the recent decade, lean principles have become a methodology for development in various sectors, including higher education [41]. HEIs are seeking new methods to stay competitive in an ever-changing world. This means going above and beyond the competitors in terms of education and service and keeping expenses reasonable. In higher education, sustainable development is a critical concern. As a systematic approach, lean principles in HEIs play a significant role in sustainability.
Lean principles are relevant to be applied to HEIs, taking into consideration of their application, especially regarding the distinctive attributes of service operations. Hess and Benjamin [42] used lean principles in the university to improve processes in curriculum delivery, business and auxiliary services, admissions and enrollment management, and research. They found that the key to successful implementation in a university setting is to avoid a top-down approach instead of focusing on faculty involvement in the design and implementation of the lean methodology. Cudney et al. [43] found that in lean implementation, engaging internal and external customers and emphasizing the value of direct involvement, stakeholders’ commitment, and participation can improve quality and decrease waste in learning, teaching, and administration.
In lean principles, the different categories of waste are overproduction, over-processing, waiting or delay, motion waste, excess inventory, waste talent, transportation, and defect or reworking [44]. In the manufacturing sector, each waste form is defined as follows: overproduction refers to products for which there is no demand; over-processing refers to unnecessary production line processes; waiting may occur as products, waiting in queues or delays that keep employees waiting; motion waste refers to unnecessary movements of workers; transportation waste means unnecessary traffic in the manufacturing area; inventory waste may be a shortage and excessive stocking of raw materials or finished goods; defects refer to avoidable production of defective products, and talent waste refers to the non-use of workers’ abilities or skills [10]. Because the eight categories of waste refer to the manufacturing sector, they must be adapted to the context of HEIs [10,25,26,42,43,44,45,46]. Kazancoglu dan Ozkan-Ozen [10] investigated eight wastes in HEIs by proposing a multi-stage model. They are classified into overproduction, over-processing, waiting, motion, transportation, inventory, defects, and talent. Douglas et al. [26] classified wastes as overproduction, over-processing, waiting, motion, transportation, inventory, defect, and underutilized people. The examples of waste modes in HEI are shown in Table A1, which are briefly described as follows:
  • A defect is defined as an error in the process or service support requirements. Such wastes are the lecturer having trouble finding a file, typographical mistakes, and making mistakes in learning materials and preparation.
  • Overproduction occurs when doing services that do not need or earlier than scheduled. Such as wastes are lecturers printing too many copies of materials, the teaching load is too much to handle, and the lecture adds extra hours to accomplish their work.
  • Waiting is defined as delays in a process. For example, the lecturer takes a long time to respond to messages and questions from students, waits in a meeting, the lecturer misses a deadline for submitting reports.
  • Non-utilized talent represents inappropriate work allocation or non-use of lecturer/staff abilities or skills. The lecturer exemplifies non-utilized talent is given a task that is outside of their area of competence, and the lecturer does not do research or community services every semester
  • Extra transportation is defined as unnecessary traffic in HEIs areas. For example, when distributing documents/files across work units, the lecturer makes mistakes.
  • Excess inventory represents goods or services that are no longer required to meet current needs. Examples of excess inventory in HEIs are the lecturer storing too many documents and the lecturer hoarding office stationery.
  • Extra motion or unnecessary movement: This waste occurs when lecturers or staff have to spend more time/energy to provide a service. Consider the examples such as the distance between classrooms and office/workspace is far, and the lecturer’s workplace is always disorganized.
  • Over-processing or doing more work than required. Such as waste are the lecturer spends a significant amount of time locating documents, files, and journals, information is received through various channels (WhatsApp, email, hard copy, etc.), repeatedly posting the same information or announcement. Underutilization of a highly talented and educated lecturer/staff is common in education; furthermore, the disconnection between stakeholders in education prevents real learning for change [44].
The FMEA approach has been widely used in analyzing failure modes and their effects on product/service quality because it can assist manufacturers/service providers in identifying product/service failures/defects, as well as the severity levels of those failures and their impacts on related stakeholders and business performance [47]. In this study, waste modes that have been identified were ranked based on WPN. The WPN values were between 3 and 67.5. There were eighteen waste modes as critical waste, as shown in Table 2.
According to the result of w-FMEA, a structural model was developed. The model was built regarding the ISM technique, consisting of eight levels. The structural model at the end of the ISM reveals the interrelationships between numerous aspects, their dependency/independence, and the level of each element [48]. Table 3 presents the hierarchy level of waste modes. The waste mode at level eight is the one that has an impact on the waste modes at the higher levels. As a result, the waste elimination procedure will begin at level eight and progress to level one. From the model developed with the identified waste modes in this study, it is clear that the most critical waste mode is repairing facilities that take a long time, which comes as the base of the ISM hierarchy. The facilities are an essential part of teaching and learning activities. If the facility is damaged and fixing it takes a lengthy time, it has the potential to generate other waste modes. The instructor takes a long time to respond to messages and questions from students, and information is received through a variety of channels (WhatsApp, email, hard copy, etc.); the lecturer uses the same exam questions from the previous year; the lecturer does not do research every semester; lecturers are late for meetings; the lecturer waiting for students to enter class, which is dependent on other waste modes have appeared on the top hierarchy.
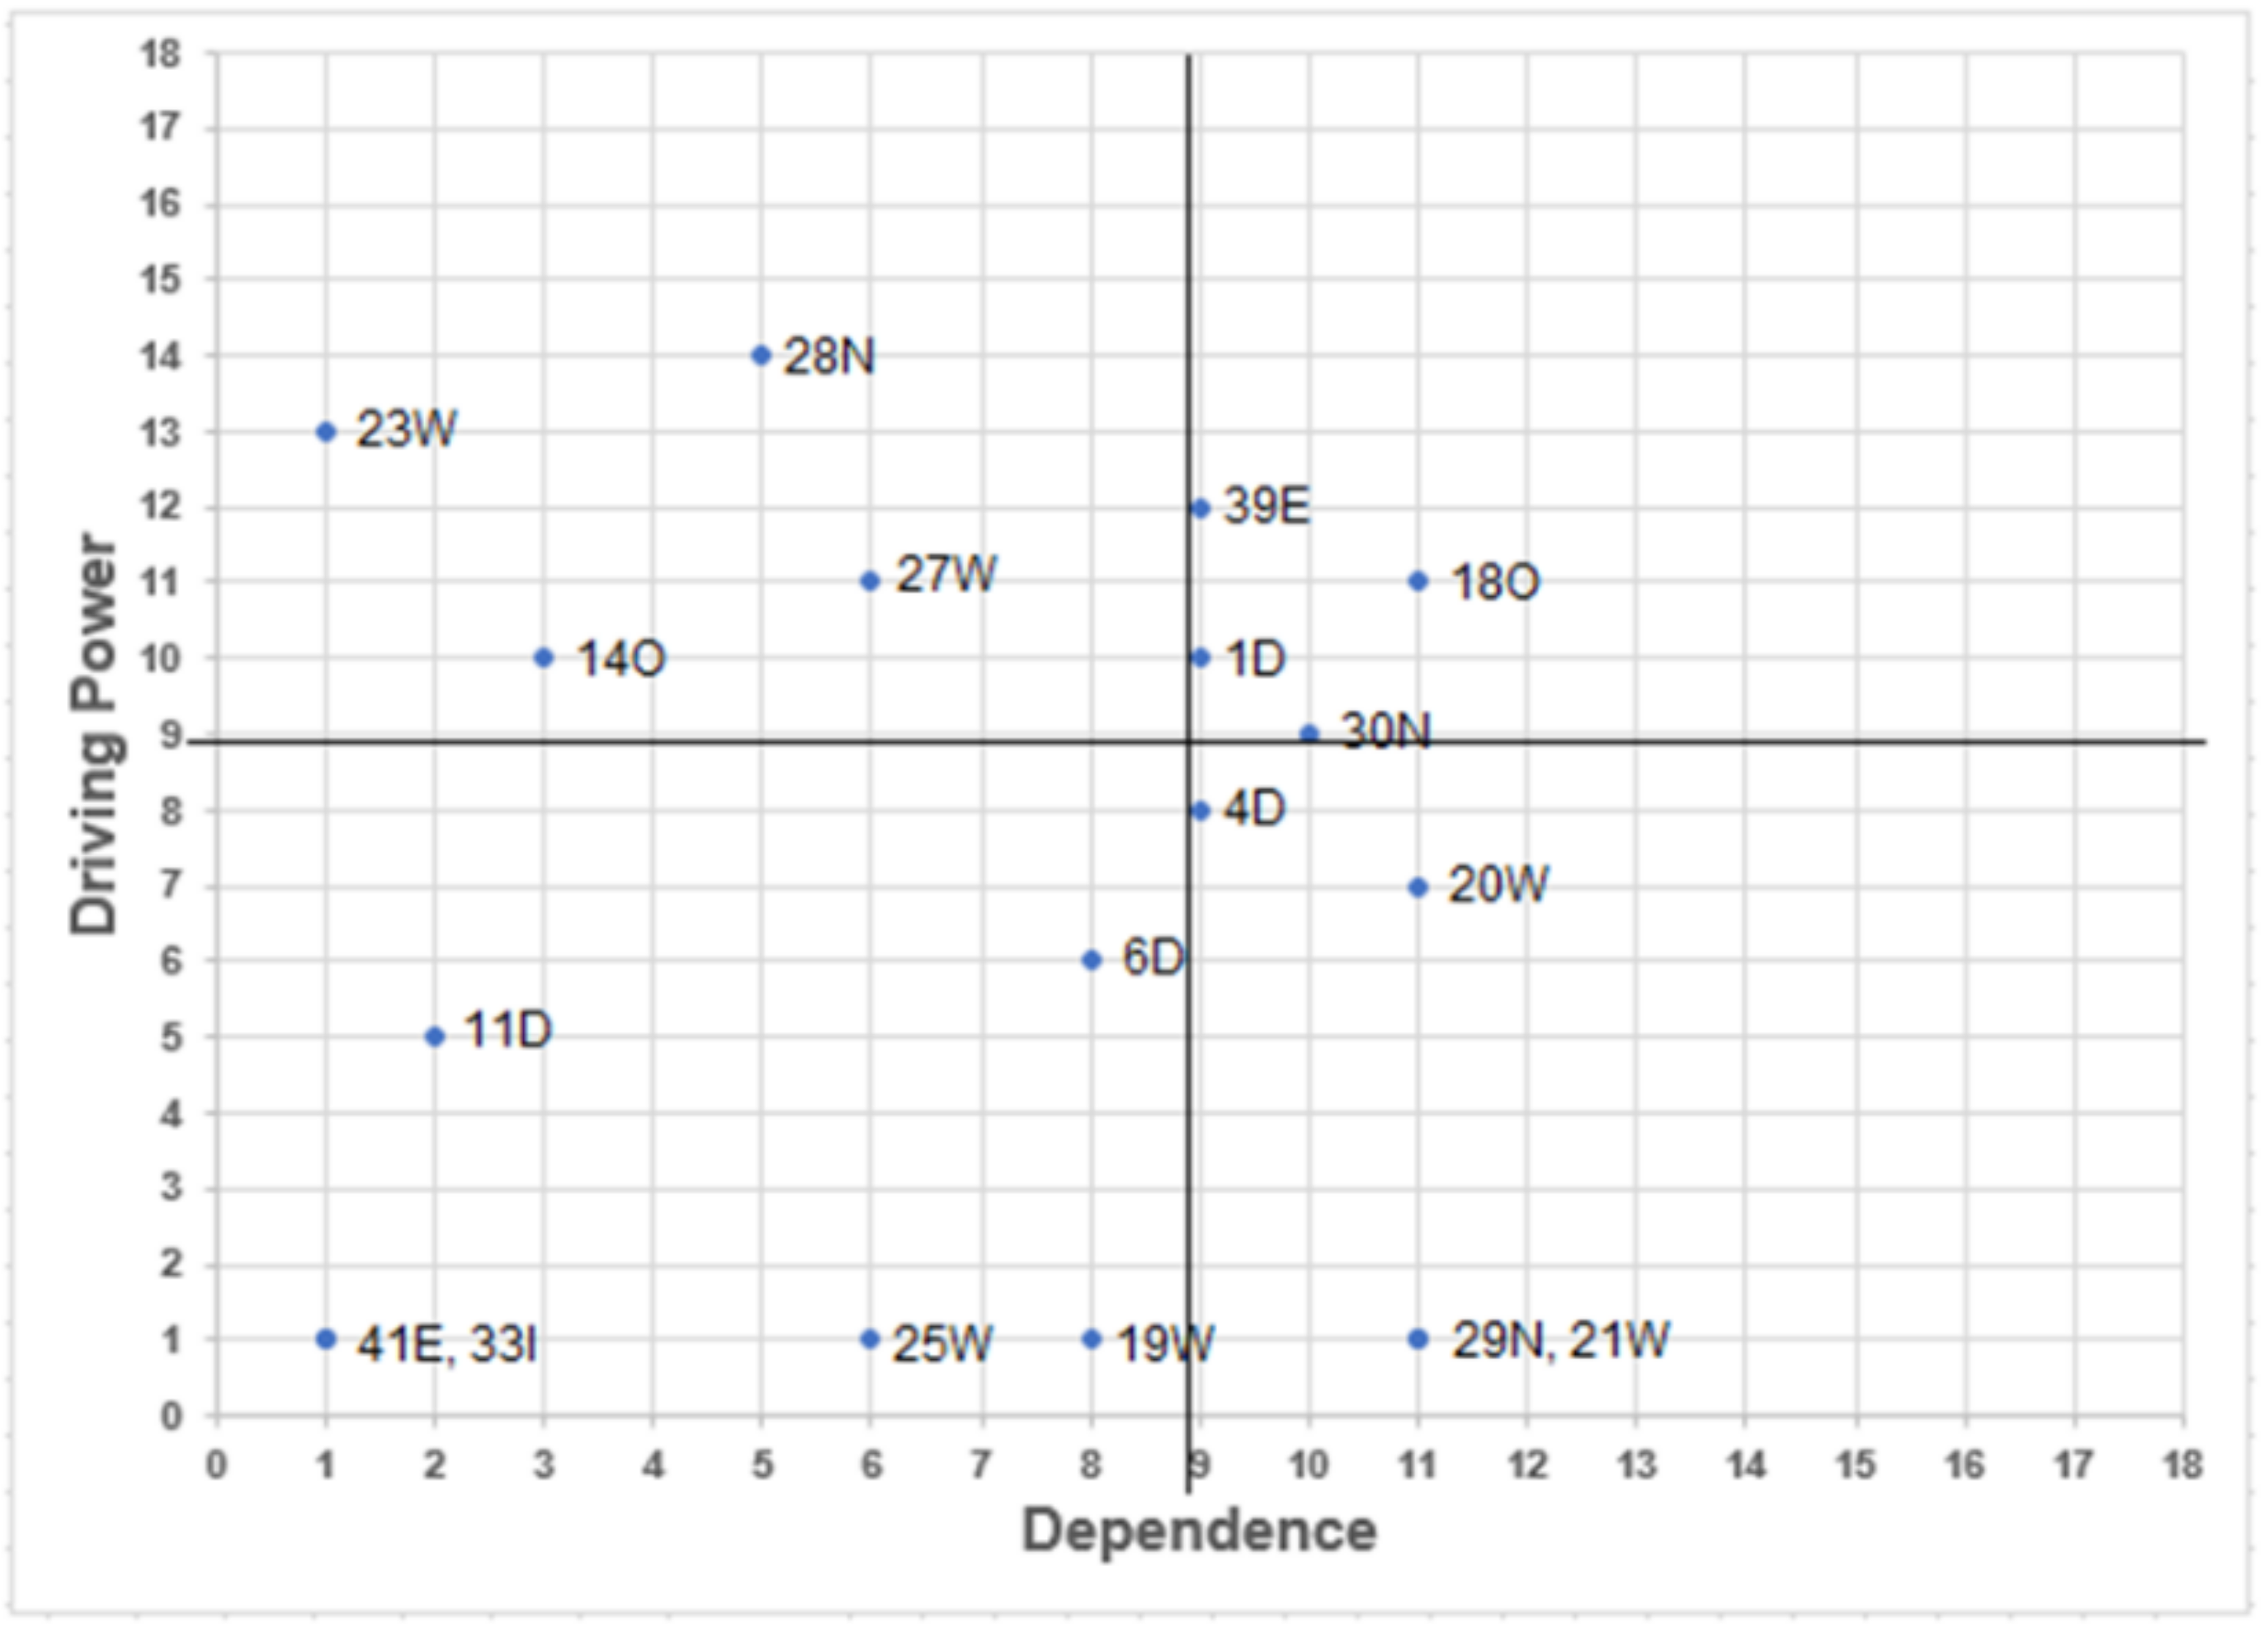
The developed eight-level ISM model is further analyzed using MICMAC analysis based on each determinant’s driving and dependence power (attribute) of interest. The determinants are categorized into autonomous, dependent, linkage, and driver determinants. The dependence and the driving power of waste modes are shown in Figure 1. Table 5 provides more details about determinants and their characteristics.
Based on the developed ISM model and MICMAC analysis, mitigating actions for minimizing waste modes are being proposed, such as:
  • Department heads should allocate an adequate workload of lecturers. This helps lecturers in resolving the waste modes, namely, every semester, the teaching load is too much to handle (14O); working outside of regular business hours to complete administrative tasks (18O); the lecturer misses a deadline for submitting reports (20W); the lecturer does not do research every semester (29N); lecturers do not participate in community service every semester (30N).
  • Proper planning is required to ensure the adequate availability of resources. This helps in eliminating waste modes such as lecturers altering the course schedule (4D); the connection wire for the projector being broken (11D); repairing a facility taking a long time (23W); the lecturer being given a task that is outside of their area of competence. (28N); the same exam questions from the previous year are used by the lecturer (33I).
  • Coordination and communication between the academicians must be open and transparent. This helps in mitigating waste modes; namely, the lecturer conducts a re-examination of the students (6D); the instructor takes a long time to respond to messages and questions from students (19W); lecturers are late for meetings (21W); the lecturer waiting for students to enter class (25W); students fail to submit assignments on time (27W); information is received through a variety of channels (WhatsApp, email, hard copy, etc.) (41E).
  • Training and workshops help lecturers develop a solid commitment to their work. This helps mitigate the waste modes; namely, the lecturer is having trouble finding a file (1D); The lecturer spends a significant amount of time locating documents, files, and journals (39E).
This paper shows that identification wastes have massive potential for lean in HEIs for HEIs sustainability and develop propositions for future studies. Furthermore, this research outlines mitigating strategies for minimizing waste modes in HEIs.

5. Conclusions

The lean principle is a concept for improving systems and maximizing value. Lean has its origin in the private sector generally and the manufacturing sector particularly. It has been proven effective in strengthening operation systems in various sectors, including higher education. It is acknowledged that there is a significant difference between the manufacturing sector and HEIs sectors in terms of system, process, and product.
HEIs can be thought of as a collection of systems and processes. HEIs are organized around academic and non-academic departments and implement process management techniques to deliver the output that should meet student satisfaction. There is, for example, a registration process, an administration process, a financial process, and a teaching and learning process. Many functions in HEIs cut beyond functional and departmental boundaries. The product of HEIs is intangible and difficult to quantify because it is reflected in the transformation of individuals in their knowledge, character, and attitude. There is a fundamental concern of HEIs regarding the level of knowledge and skills graduates are legitimately supervised by academics.
The first step to implementing lean principles is understanding what value is and what activities and resources are vital to achieving it. Value and flow must be established according to the processes and circumstances of the HEI’s system to implement lean principles. Waste reduction and increased efficiency have been identified as critical goals of lean principles in HEIs. There is a gap in the literature regarding the eight waste types in HEIs and a lack of specific definitions for these wastes. This study is to add to the literature by first providing explicit definitions of the eight wastes in HEIs before proposing a model based on these wastes. This study presents a combination of well-established methodologies, i.e., w-FMEA and ISM.
The actual results extracted from the w-FMEA analysis during Phase 1 were potential failure modes, their effects, and their causes. Regarding the FMEA analysis, 18 waste modes have been identified as critical wastes in the HEI.
In Phase 2, the ISM technique was applied to identify and assess each waste mode’s driving and dependent powers using the MICMAC analysis. The integrated ISM-MICMAC model was created to provide the relevance of waste elimination as part of routine services operations in HEIs.
Information is received through a variety of channels (WhatsApp, email, hard copy, etc.); the same exam questions from the previous year are used by the lecturer; the lecturer waiting for students to enter class; the instructor takes a long time to respond to messages and questions from students; the connection wire for the projector is broken; the lecturer conducts a re-examination of the students have been identified as autonomous determinants.
Meanwhile, the dependent determinants are: The lecturer does not do research every semester; lecturers are late for meetings; the lecturer misses a deadline for submitting reports; lecturers alter the course schedule.
Also, the linkage determinants are that lecturers do not participate in community service every semester; the lecturer is having trouble finding a file; working outside of regular business hours to complete administrative tasks; the lecturer spends a significant amount of time locating documents, files, and journals.
Finally, the driver determinants are: facility repairs take a long time; every semester, the teaching load is too much to handle; students fail to submit assignments on time; the lecturer is given a task that is outside of their area of competence.
The limitation of the study should be pointed out in obtaining data. This study is a preliminary study with a sample size of two faculties in HEI. A small sample led to the results of this study may not be generalizable, but coherent and comprehensive writing allows this study to be transferable in similar cases with minor modifications. Therefore, this study should be seen as the first step in a broad set of other studies integrating lean implementation and sustainability in HEIs. Future studies are needed to expand data using all scope of HEI, compare lean principles implementation between HEIs, and find pathways for lean principles to be augmented with sustainability pillars in HEIs.
This study is expected to help academicians and practitioners understand HEI’s waste types by listing the critical wastes, mapping their interrelationship, identifying the driving power and dependence, and proposing mitigation actions. It will also contribute to the growing body of literature highlighting the wastes in HEI.

Author Contributions

Conceptualization, L.P.S.H. and I.J.M.; methodology, I.J.M. and I.G.; software, I.G.; validation, L.P.S.H. and I.G.; formal analysis, L.P.S.H., I.G., I.J.M. and H.; investigation, L.P.S.H., I.G., I.J.M. and H.; writing—original draft preparation, L.P.S.H., I.G., I.J.M. and H.H.; writing—review and editing, L.P.S.H., I.G., I.J.M. and H.H. All authors have read and agreed to the published version of the manuscript.

Funding

This work was supported by the Interdisciplinary Research Scheme 2020/2021 of Widya Mandala Surabaya Catholic University under Grant No. 005a/WM01.5/N/2021 and Publication Grant of Widya Mandala Surabaya Catholic University under Grant No. 1338/WM01/T/2022.

Institutional Review Board Statement

Not applicable.

Informed Consent Statement

Not applicable.

Data Availability Statement

Not applicable.

Acknowledgments

The authors would like to thank their colleagues for their contribution and support to the research.

Conflicts of Interest

The authors declare no conflict of interest.

Appendix A

Table A1 contains 46 waste modes, covering eight categories: defects, overproduction, waiting, non-utilized talent, unnecessary transportation, excess inventory, excess motion, and extra processing.
Table A1. Waste modes in the HEI.
No.Waste CategoryWaste ModeCode
1DefectsThe lecturer is having trouble finding a file1D
Entering an incorrect classroom2D
The lecturer fails to notify the class on absence/cancellation on the due date3D
Lecturers alter the course schedule4D
Making mistakes inputting grades into the academic information system5D
The lecturer conducts a re-examination of the students6D
The lecturer finds documents inaccessible7D
The lecturer finds teaching materials that are unable to be opened8D
Typographical mistake9D
Making mistakes in learning materials and preparation10D
The connection wire for the projector is broken11D
Insufficient exam question papers12D
2OverproductionLecturers prints too many copies of materials, question papers, journals, and handouts13O
Every semester, the teaching load is too much to handle14O
Outside of the schedule, lecturers add extra hours15O
There is an excessive amount of information/announcement disseminated16O
The department has an excessive number of lecturers17O
Working outside of regular business hours to complete administrative tasks18O
3WaitingThe instructor takes a long time to respond to messages and questions from students19W
The lecturer misses a deadline for submitting reports20W
Lecturers are late for meetings21W
When a class is rescheduled, the lecturer must wait until the following week22W
Repairing a facility takes a long time.23W
The lecturer is looking forward to the meeting when the results of the teaching tasks are determined24W
The lecturer waiting for students to enter class25W
The lecturer waits for students to finish collecting exam responses26W
Students fail to submit assignments on time27W
4Non-Utilized TalentThe lecturer is given a task that is outside of their area of competence28N
The lecturer does not do research every semester29N
Every semester, the lecturer does not participate in community service.30N
5Extra TransportationWhen distributing documents/files across work units, the lecturer makes mistakes31T
6Excess InventoryThe email is saved as a draft by the lecturer32I
The same exam questions from the previous year are used by the lecturer33I
The lecturer stores too many documents34I
The lecturer hoards office stationery35I
During operating hours, class facilities are not utilized36I
7Extra MotionThe distance between classrooms and office/workspace is far37M
The lecturer’s workplace is always disorganized
8Extra ProcessingThe lecturer spends a significant amount of time locating documents, files, and journals39E
The lecturer inputs student scores into various systems multiple times40E
Information is received through a variety of channels (WhatsApp, email, hard copy, etc.)41E
Repeatedly posting the same information or announcement42E
The lecturer goes over the same files (exam answers, theses, correspondence, and so on) several times43E
The lecturer double-checks the teaching materials regularly44E
The lecturer repeatedly teaches the same topic45E
The lecturer attends/creates discussion with the same topic over and over46E

Appendix B

Table A2 presents a qualitative and quantitative description of cause-and-effect analysis, the occurrence score, detection, severity, and WPN.
Table A2. w-FMEA in the HEI.
CodeCauseOcDEffectSWPN
1DImproper filling system33It is difficult to accomplish work that requires these documents, and it is a waste of time436
2DWrong information or teacher is in a hurry11.5Come in late for class23
3DThe lecturer has an urgent task/need22Students need to wait; the lecture is unfinished3.514
4DThe lecturer has an urgent task/need2.52.5Rescheduling or the new schedules overlapping318.8
5DCareless and no recheck1.52Disappointed students39
6DThe student does not pass the passing grade2.52.5Requiring additional time for re-examination and answer checking318.8
7DCorrupted file22Unable to use documents or late in downloading documents3.514
8DInsufficient material preparation22Class does not run well, or material is not covered312
9DMistakes in making syllabus documents1.51.5Mistakes in recapitulating or calculating honorarium2.55.625
10DInsufficient material preparation12Learning outcomes are not achieved48
11DPoor inspection and maintenance33Class starts late436
12DCareless and no recheck22The test does not go well312
13OMiscalculating the number of manuscripts22Manuscripts are redundant and unused28
14OUnbalanced proportion of teaching and other duties32Lecturers only focus on teaching, not doing others424
15OThe lecture’s plan is not running well or the students ask for additional classes22Lecturers and students add lecture time2.510
16OLack of coordination22Excessive printing/spreading of information/announcements28
17OLack of planning for lecturer needs or the number of students is dropping12The teaching potential of lecturers cannot be utilized24
18OPoor time management or too many lecturers53The main activity of the lecturer is disrupted4.567.5
19WThe message is received after office hour, or message is not answered43Students waiting for replies from the lecturer224
20WLack of time management or the lecturer forgets the schedule33Inhibiting the process flow3.531.5
21WLack of commitment32Coming in late to meeting318
22WThe previous class finishes late22Coming in late to the next class312
23WMaintenance is poor; technician is not available5.53Facilities cannot be used when needed466
24WThe schedule is too full22The lecturer is late in preparing materials3.514
25WStudents are not on time33Class starts late218
26WInsufficient exam time32Exams cannot be finished on time212
27WStudents are unable to manage time32.5Poor grades322.5
28NDeploying lecturers with the wrong expertise22Students competence cannot be achieved416
29NLecturers are not capable of doing research22.5Lecturers cannot fulfill their obligations44
30NLecturers are not capable of doing community service43Lecturers cannot fulfill their obligations4.554
31TCareless in doing administrative tasks22Documents arrive late3.514
32IUrgent task/need22Email is not sent312
33INeeded as references for preparing courses62Meets memory capacity224
34IPrinting or duplicating too many materials23Waste of material and using up storage space212
35IPurchase or request does not match the need22Waste of budget and storage space28
36IInadequate facility utilization planning22Overbudgeting2.510
37MThe layout of space and building is not efficient21.5Requires more time and energy26
38MInconsistent organization or a lack of facilities32.5Uncomfortable workspace215
39EImproper filling system33Takes more time3.531.5
40EUnintegrated system22.5Wasting time315
41EUnintegrated system4.52.5Wasting time and budget2.528.1
42ELack of coordination22Wasting time and energy2.510
43EError checking/correcting previous files22Wasting time and energy312
44ENot ready in preparing teaching materials; or add new information in teaching materials22.5Wasting time and energy315
45EPoor course planning or low student acceptance rate22.5Lecture material is not finished315
46EInappropriate arrangement of the meeting agenda22Lecture material is not finished312

Appendix C

Table A3 presents the SSIM matrix. Table A4 presents initial reachability matrix. The final reachability matrix is shown in Table A5.
Table A3. The Structural Self-Interaction Matrix (SSIM).
Waste Modesi
j18O23W30N1D11D20W39E19W41E14O33I27W29N4D6D21W25W28N
18O AVXOXXOOAOAVOOOOA
23W OOVVOOOOOVVVVOOO
30N OOAOOOAOOOOOOOX
1D OVVOOOOAOOVOOO
11D OOOOOOOOVOOOO
20W AOOAOAVOAOOA
39E VOOOAOVVVOO
19W OAOOOOOOOA
41E OOOOOOOOO
14O OOVOOVOA
33I OOOOOOO
27W OAOOOO
29N OOOOA
4D OVVA
6D VOA
21W OO
25W O
28N
Table A4. Initial Reachability Matrix.
Waste Modesj
i18O23W30N1D11D20W39E19W41E14O33I27W29N4D6D21W25W28N
18O 01101100000100000
23W1 0011000001111000
30N00 000000000000001
1D100 01100000001000
11D0000 0000000010000
20W10100 000000100000
39E100001 10000011100
19W0000000 0000000000
41E00000000 000000000
14O101001010 00100100
33I0000000000 0000000
27W10010110000 000000
29N000000000000 00000
4D0000000000010 0110
6D00000100000000 100
21W000000000000000 00
25W0000000000000000 0
28N10100101010011100
Table A5. Final Reachability Matrix with Driving Power and Dependence.
Waste Modesj
i18O23W30N1D11D20W39E19W41E14O33I27W29N4D6D21W25W28NSum
18O10110111000011110111
23W11111110000111111013
30N1010010101001110019
1D10110111000011110010
11D0000100000010101105
20W1011011000001000017
39E10110111000111111012
19W0000000100000000001
41E0000000010000000001
14O10110111010010010110
33I0000000000100000001
27W10110111000111110011
29N0000000000001000001
4D1001011000010101108
6D1010010000001011006
21W0000000000000001001
25W0000000000000000101
28N10110111010111111114
Sum11110921198131611981165

References

  1. Gupta, S.; Sharma, M. Lean services: A systematic review. Int. J. Product. Perform. Manag. 2016, 65, 1025–1056. [Google Scholar] [CrossRef]
  2. Vignesh, V.; Suresh, M.; Aramvalarthan, S. Lean in service industries: A literature review. IOP Conf. Ser. Mater. Sci. Eng. 2016, 149, 012008. [Google Scholar] [CrossRef] [Green Version]
  3. Schiele, J.J.; McCue, C.P. Lean thinking and its implications for public procurement: Moving forward with assessment and implementation. J. Public Procure 2011, 11, 206–239. [Google Scholar] [CrossRef]
  4. Klein, L.L.; Tonetto, M.S.; Avila, L.V.; Moreira, R. Management of lean waste in a public higher education institution. J. Clean. Prod. 2021, 286, 125386. [Google Scholar] [CrossRef]
  5. Bortolotti, T.; Romano, P. ‘Lean first, then automate’: A framework for process improvement in pure service companies. A case study. Prod. Plan. Control 2011, 23, 513–522. [Google Scholar] [CrossRef]
  6. de Almeida, J.P.L.; Galina, S.V.R.; Grande, M.M.; Brum, D.G. Lean thinking: Planning and implementation in the public sector. Int. J. Lean Six Sigma 2017, 8, 390–410. [Google Scholar] [CrossRef]
  7. AlKhaldi, R.Z.; Abdallah, A. Lean management and operational performance in health care: Implications for business performance in private hospitals. Int. J. Prod. Perform. Manag. 2019, 69, 1–21. [Google Scholar] [CrossRef]
  8. Antony, J. Lean Six Sigma for higher education. Int. J. Prod. Perform. Manag. 2017, 66, 574–576. [Google Scholar] [CrossRef] [Green Version]
  9. Vukadinovic, S.; Djapan, M.; Macuzic, I. Education for lean & lean for education: A literature review. Int. J. Qual. Res. 2017, 11, 35–50. [Google Scholar] [CrossRef]
  10. Kazancoglu, Y.; Ozkan-Ozen, Y.D. Lean in higher education: A proposed model for lean transformation in a business school with MCDM application. Qual. Assur. Educ. 2019, 27, 82–102. [Google Scholar] [CrossRef]
  11. Thomas, A.; Antony, J.; Francis, M.; Fisher, R. A comparative study of Lean implementation in higher and further education institutions in the UK. Int. J. Qual. Reliab. Manag. 2015, 32, 982–996. [Google Scholar] [CrossRef] [Green Version]
  12. Fliedner, G. Sustainability: A new Lean principle. In Proceedings of the 9th Annual Meeting of the Decision Sciences Institute, Chicago, IL, USA, 17–19 December 2008; Volume 15, pp. 3321–3326. [Google Scholar]
  13. Nawanir, G.; Binalialhajj, M.; Lim, K.T.; Ahmad, M.H. Becoming Lean: The Way towards Sustainability of Higher Educations Institutions. In Proceedings of the FGIC 2nd Conference on Governance and Integrity, Pahang, Malaysia, 19–20 August 2019; pp. 603–626. [Google Scholar] [CrossRef]
  14. Henao, R.; Sarache, W.; Gómez, I. Lean manufacturing and sustainable performance: Trends and future challenges. J. Clean. Prod. 2019, 208, 99–116. [Google Scholar] [CrossRef]
  15. Aleixo, A.M.; Azeiteiro, U.; Leal, S. The Implementation of Sustainability Practices in Portuguese Higher Education Institutions. Int. J. Sustain. High. Educ. 2018, 19, 146–178. [Google Scholar] [CrossRef]
  16. Khodeir, L.; Othman, R. Examining the interaction between lean and sustainability principles in the management process of AEC industry. Ain Shams Eng. J. 2018, 9, 1627–1634. [Google Scholar] [CrossRef]
  17. Camuffo, A.; De Stefano, F.; Paolino, C. Safety Reloaded: Lean Operations and High Involvement Work Practices for Sustainable Workplaces. J. Bus. Ethics 2017, 143, 245–259. [Google Scholar] [CrossRef]
  18. Comm, C.L.; Mathaisel, D.F. A case study in applying lean sustainability concepts to universities. Int. J. Sustain. High. Educ. 2005, 6, 134–146. [Google Scholar] [CrossRef]
  19. Tăucean, I.M.; Tămășilă, M.; Ivascu, L.; Miclea, Ș.; Negruț, M. Integrating Sustainability and Lean: SLIM Method and Enterprise Game Proposed. Sustainability 2019, 11, 2103. [Google Scholar] [CrossRef] [Green Version]
  20. Psomas, E.; Antony, J. Total quality management elements and results in higher education institutions: The Greek case. Qual. Assur. Educ. 2017, 25, 206–223. [Google Scholar] [CrossRef]
  21. Svensson, C.; Antony, J.; Baessa, M.; Bakhsh, M.; Albliwi, S. A Lean Six Sigma program in higher education. Int. J. Qual. Reliab. Manag. 2015, 32, 951–969. [Google Scholar] [CrossRef] [Green Version]
  22. Qayyum, A.; Manarvi, I.; Manarvi, I. Implementation of Lean Thinking in Higher Educational Institutions (HEIS). ICERI Proc. 2017, 1, 699–710. [Google Scholar] [CrossRef]
  23. Höfer, S.; Naeve, J. The Application of Lean Management in Higher Education. Int. J. Contemp. Manag. 2017, 16, 63–80. [Google Scholar] [CrossRef]
  24. Krdžalić, A.; Brgulja, A.; Duraković, B. Implementation of Lean Practices in a Higher Education Institution’s Student Affairs Office: A Case Study from a Bosnian University. Int. J. Adv. Sci. Eng. Inf. Technol. 2020, 10, 567–577. [Google Scholar] [CrossRef]
  25. Narayanamurthy, G.; Gurumurthy, A.; Chockalingam, R. Applying lean thinking in an educational institute – an action research. Int. J. Prod. Perform. Manag. 2017, 66, 598–629. [Google Scholar] [CrossRef]
  26. Douglas, J.A.; Antony, J.; Douglas, A. Waste identification and elimination in HEIs: The role of Lean thinking. Int. J. Qual. Reliab. Manag. 2015, 32, 970–981. [Google Scholar] [CrossRef]
  27. Hartanti, L.; Mulyana, I.; Hartiana, T. Waste in Higher Education Institution: A Systematic Literature Review. Int. J. Sci. Technol. Res. Vol. 2020, 9, 16–22. [Google Scholar]
  28. Liu, H.-C. Improved FMEA Methods for Proactive Healthcare Risk Analysis; Springer: Singapore, 2019. [Google Scholar]
  29. Takalo, S.K.; Abadi, A.R.N.S.; Vesal, S.M.; Mirzaei, A.; Nawaser, K. Fuzzy Failure Analysis: A New Approach to Service Quality Analysis in Higher Education Institutions. Int. Educ. Stud. 2013, 6, 93–106. [Google Scholar] [CrossRef]
  30. Chiozza, M.L.; Ponzetti, C. FMEA: A model for reducing medical errors. Clin. Chim. Acta 2009, 404, 75–78. [Google Scholar] [CrossRef]
  31. Magnezi, R.; Hemi, A.; Hemi, R. Using the failure mode and effects analysis model to improve parathyroid hormone and adrenocorticotropic hormone testing. Risk Manag. Health Policy 2016, 9, 271–274. [Google Scholar] [CrossRef] [PubMed] [Green Version]
  32. Sahney, S.; Banwet, D.; Karunes, S. Quality framework in education through application of interpretive structural modeling. TQM J. 2010, 22, 56–71. [Google Scholar] [CrossRef]
  33. Kusrini, E.; Safitri, W.; Helia, V.N. Identify Key Success Factors Using Interpretive Structural Modeling (ISM): A Case Study in Small and Medium Enterprise in Indonesia. IOP Conf. Ser. Mater. Sci. Eng. 2019, 697, 012015. [Google Scholar] [CrossRef]
  34. Sohani, N.; Sohani, N. Developing Interpretive Structural Model for Quality Framework in Higher Education: Indian Context. J. Eng. Sci. Manag. Educ. 2012, 5, 495–501. [Google Scholar]
  35. Gunawan, I.; Vanany, I.; Widodo, E. Typical traceability barriers in the Indonesian vegetable oil industry. Br. Food J. 2021, 123, 1223–1248. [Google Scholar] [CrossRef]
  36. Aleixo, A.M.; Azeiteiro, U.M.; Leal, S. Toward Sustainability Through Higher Education: Sustainable Development Incorporation into Portuguese Higher Education Institutions. In Challenges in Higher Education for Sustainability. Management and Industrial Engineering; Davim, J., Leal Filho, W., Eds.; Springer: Cham, Switzerland, 2016; pp. 159–187. [Google Scholar] [CrossRef]
  37. Novo-Corti, I.; Badea, L.; Tirca, D.M.; Aceleanu, M.I. A pilot study on education for sustainable development in the Romanian economic higher education. Int. J. Sustain. High. Educ. 2018, 19, 817–838. [Google Scholar] [CrossRef]
  38. De Souza, R.V.B.; Carpinetti, L. A FMEA-based approach to prioritize waste reduction in lean implementation. Int. J. Qual. Reliab. Manag. 2014, 31, 346–366. [Google Scholar] [CrossRef]
  39. Kumar, N.; Kumar, S.; Haleem, A.; Gahlot, P. Implementing lean manufacturing system: ISM approach. J. Ind. Eng. Manag. 2013, 6, 996–1012. [Google Scholar] [CrossRef]
  40. Alawamleh, M.; Popplewell, K. Interpretive structural modelling of risk sources in a virtual organisation. Int. J. Prod. Res. 2011, 49, 6041–6063. [Google Scholar] [CrossRef] [Green Version]
  41. Zighan, S.; El-Qasem, A. Lean thinking and higher education management: Revaluing the business school programme management. Int. J. Prod. Perform. Manag. 2020, 70, 675–703. [Google Scholar] [CrossRef]
  42. Hess, J.D.; Benjamin, B.A. Applying Lean Six Sigma within the university: Opportunities for process improvement and cultural change. Int. J. Lean Six Sigma 2015, 6, 249–262. [Google Scholar] [CrossRef]
  43. Cudney, E.A.; Venuthurumilli, S.S.J.; Materla, T.; Antony, J. Systematic review of Lean and Six Sigma approaches in higher education. Total Qual. Manag. Bus. Excel. 2018, 31, 231–244. [Google Scholar] [CrossRef]
  44. Lemahieu, P.G.; Nordstrum, L.E.; Greco, P. Lean for education. Qual. Assur. Educ. 2017, 25, 74–90. [Google Scholar] [CrossRef]
  45. Sunder, M.V. Constructs of quality in higher education services. Int. J. Prod. Perform. Manag. 2016, 65, 1091–1111. [Google Scholar] [CrossRef]
  46. Balzer, W.K. Lean Higher Education-Increasing the Value and Performance of University Processes, 2nd ed.; Productivity Press: New York, NY, USA, 2020. [Google Scholar]
  47. Nguyen, T.-L.; Shu, M.-H.; Hsu, B.-M. Extended FMEA for Sustainable Manufacturing: An Empirical Study in the Non-Woven Fabrics Industry. Sustainability 2016, 8, 939. [Google Scholar] [CrossRef]
  48. Jadhav, J.R.; Mantha, S.S.; Rane, S.B. Development of framework for sustainable Lean implementation: An ISM approach. J. Ind. Eng. Int. 2014, 10, 1–27. [Google Scholar] [CrossRef] [Green Version]
  49. Patidar, L.; Soni, V.K.; Soni, P.K. Manufacturing wastes analysis in lean environment: An integrated ISM-fuzzy MICMAC approach. Int. J. Syst. Assur. Eng. Manag. 2017, 8, 1783–1809. [Google Scholar] [CrossRef]
Figure 1. MICMAC Cartesian Diagram.
Sustainability 14 04348 g001
Table 1. Pillars and Practices of Sustainable Development in HEIs.
PillarsPractices
EnvironmentalEnvironmental declarations and activities related to HEIs engagement in resource scarcity and environmental issues
EconomicDeclarations and actions concerning HEI’s direct economic impact and financial sustainability
Social/CulturalDeclarations and explanations of human rights policies and processes
Institutional/Educational/Political
Declarations
Declarations and statements about the beliefs, values, strategy, governance transparency, and ethical commitments of HEIs.
Adapted from Aleixo et al. [15].
Table 2. Critical Waste Modes.
CodeWPNRankCodeWPNRank
18O67.5114O2410
23W66233I2411
30NT54327W22.512
1D36429N2013
11D3654D18.7514
20W31,566D18.7515
39E31,5721W1816
19W30825W1817
41E28.1928N1618
Table 3. Hierarchy Level.
LevelWaste CodesReachability SetAntecedent SetIntersection
Level 119W81,3,4,7,8,10,12,18
41E999
33I111111
29N131,2,3,4,6,7,10,12,13,15,1813
21W161,2,4,5,7,10,12,14,15,16,1816
25W172,5,7,14,17,1817
Level 218O1,3,4,6,7,14,15,181,2,3,4,6,7,10,12,14,15,181,3,4,6,7,14,15,18
20W1,3,4,6,7,181,2,3,4,6,7,10,12,14,15,181,3,4,6,7,18
Level 34D4,7,12,142,3,4,5,7,12,14,184,7,12,14
6D3,152,3,4,7,12,15,183,15
Level 430N3,10,182,3,4,7,10,12,183,10,18
Level 51D4,72,4,7,10,12,184,7
39E4,7,122,4,7,10,12,184,7,12
Level 614O10,1810,1810,18
27W122,5,12,1812
Level 711D52,55
28N181818
Level 823W222
Table 4. Study’s Findings.
FocusFindings
Critical Waste Modes18O; 23W; 30N; 1D; 11D; 20W; 39E; 19W; 41E; 14O; 33I; 27W; 29N; 4D; 6D; 21W; 25W; 28N
MICMAC analysis
  • Autonomous determinants: 41E, 33I, 25W, 19W, 11D, and 6D;
  • Dependent determinants: 29N, 21W, 20W, and 4D;
  • Linkage determinants: 30N, 1D, 180, and 39E;
  • Driver determinants: 23W, 14O, 27W, and 28N.
Table 5. Determinants and their characteristics.
NoClustersCharacteristicDriving PowerDependenceWaste Modes
1Autonomous determinantsThe autonomous waste modes are relatively disconnected from the system. These waste modes have weak driver and dependent powers, and they are located nearest to the origin [49].WeakWeak41E, 33I, 25W, 19W, 11D, and 6D
2Dependent determinantThese waste modes are the automatic followers of other waste modes [48].WeakStrong29N, 21W, 20W, and 4D
3Linkage determinantsThese waste modes are unstable because any action they perform has a feedback effect on the other waste modes [48,49].StrongStrong30N, 1D, 180, and 39E
4Driver determinantsThe major drivers of implementation are these waste modes [48]. The head of departments must pay close attention to these waste modes to gain immediate results.StrongWeak23W, 14O, 27W, and 28N
Publisher’s Note: MDPI stays neutral with regard to jurisdictional claims in published maps and institutional affiliations.

