Article

Anatomy of Research Performance from a Bottom-Up Approach: Examination of Researchers’ Perspective

Department of Teacher Education and Social Sciences, University POLITEHNICA of Bucharest, 060042 Bucharest, Romania
*
Authors to whom correspondence should be addressed.
Sustainability 2022, 14(4), 2254; https://doi.org/10.3390/su14042254
Submission received: 25 January 2022 / Revised: 7 February 2022 / Accepted: 10 February 2022 / Published: 16 February 2022
(This article belongs to the Special Issue Sustainable Higher Education and Leadership)

Abstract

:
Performance-based research policies and programmes have fundamentally altered both organisational and individual behaviours and expectations, putting immense pressure on researchers. The soundness of research, originality, valorisation potential, and societal and economic impacts are highly valued and expected characteristics of research. Yet, our understanding of the effects of various systemic and organisational factors on research performance is limited. In an exploratory, single-country case, this paper aimed to develop and examine different models of research performance as perceived by researchers themselves using a large cross-disciplinary sample of 553 researchers from 72 public research organisations in Romania. A pre-tested questionnaire was self-administered online, comprising seven scales: (1) recruitment and selection, (2) research recognition and value, (3) participation in research projects and teams, (4) work incentives, (5) job payment and salary, (6) career development opportunities, and (7) leadership effectiveness. Maximum likelihood and Bayesian estimators were used to test three structural models: (M1) mono-factor; (M2) intercorrelated dimensions, and (M3) the dimensions are indicators of a general construct. Additionally, a path analysis was carried out to study the relationships among the dimensions. We found that M2 and M3 fit the empirical data better. The results showed that career development programmes and opportunities gain centrality in achieving research performance by directly influencing participation and research projects and teams and mediating the effect of job payment. Revealingly, powerful work incentives within research organisations are international mobilities or appreciation awards. When informing evidence-based policies, the models we propose could serve the goal of improving research performance through talent development as the main proxy.

1. Introduction

Following the adaptation of specific or implicit principles of New Public Management within the academic world [1,2,3], academics and researchers are no longer hermits in the Ivory Tower of science [4], but producers of results, being compared, ranked, and financed according to market demands. Competition for research funds has become stronger and stronger, with researchers having to compete against both national and international field colleagues. This competition is not always an individual race, but rather a team one, as collaboration [5] has a positive effect on research productivity.
While the field of scientometrics abounds with studies on the impact of this market approach on the academic field, the phrase “publish or perish” has become a mantra in some research circles. Performance is now evaluated manifold: research output, research impact, research visibility, and social relevance are all elements considered when measuring individual and institutional performance. Individuals choosing a research career nowadays must therefore come to terms with the productivity requirements of their job. This productivity should not be analysed in a vacuum, but together with structural and institutional elements facilitating or hindering research and innovation. We therefore start our analysis by subscribing to the view that “a national research system is made up of the actors within a country that jointly (i.e., in interaction with each other) produce research outcomes” [6]. Hardeman et al. [6] go on to describe the map of a national research system, which is made up of structural capabilities, research assets, interactions, and research excellence, elements that influence each other in dynamic ways. Policies and funding instruments that can produce the optimal conditions and environment will enable research, development, and innovation (RD&I)-performing entities to radically improve the knowledge base of the economy and society and support the digitalisation and greening of entire sectors and value-chains [7].
Within this context, the main purpose of this research study was to propose and test several bottom-up models of research performance in Romania. We give credit to Hardeman’s model [6] and consider that in the Romanian context, there is also a dynamic influence and causal relation between research performance, structural capabilities, research assets, and interactions found in the system. The following sections unfold the state of play and discuss the frameworks underpinning the research. Our approach relies on several theoretical models of job satisfaction, job performance, and talent governance, arguing that research performance should be understood and approached from a multidimensional perspective. Systemic, institutional, and individual factors interact in a dynamic way and modify the research performance accordingly within the ecosystem. When informing evidence-based policies, the models we propose could achieve the goal of improving research performance through talent development as the main proxy.

2. Literature Review

2.1. Policies for Building a Sustainable Research Career

Previous studies have addressed the state of the research area in different contexts, analysing success factors and suggesting improvements, while policies have formulated guidelines and recommendations to re-shape and advance the state of things [6,8,9,10,11,12,13,14]. Researchers have noted that studies about the European research context are lagging behind those relating to the American context [8,9]. The present article wishes to contribute to closing this gap and investigates the key dimensions of research performance in the Romanian research landscape, as part of and in line with overarching policies of the European Research Area (ERA) and seminal theories on job performance.
As a recent position paper published by LERU pointed out, the assessment of researchers and research performance is at the heart of scientific endeavours [11], and multidimensional perspectives are needed to ensure sustainable approaches. Moreover, Aagaard and Schneider [14] suggested that a central question within science policy studies revolve around how different policies affect research performance [15].
Research funding plays a decisive role in orienting research and supporting its potential impact. Regarding the financial input and the scientific output of this system, the report by the Joint Research Centre from 2013 [6] shows that countries in the European Union (EU) scoring high on research excellence also spend higher percentages of their Gross Domestic Product (GDP) on RD&I [6]. Even if at the EU-27 level, member states have agreed to try and reach an average level of 3% of GDP dedicated to research, there are still considerable differences between member states. Based on data from 2019 and 2020, in 2021, Eurostat reported the highest percentage of GDP allocated to RD&I to be in Sweden and Belgium (3.5%), while the countries with the lowest RD&I intensities (defined at country level as the percentage of GDP dedicated to RD&I expenditure) are Romania (0.50%), Latvia (0.7%), and Malta (0.7%) [16]. In relation with these figures, we would say, is Romania’s Horizon 2020 country profile [17], according to which, the country has a knowledge-intensive employment rate well below the EU average (21.6% vs. 36.1%), a top-cited publication rate of 4.6% compared with a 11.1% EU average, and a 0.4% patent application rate compared to a 3.7% EU average [17]. According to the same source, Romania also has the smallest researchers ratio (897 per million of population) of all EU-27 member states. Because researchers represent research assets [10], we believe that this low number in the Romanian context has a direct effect on the research productivity. This could therefore be one of the reasons why according to the European Innovation Scoreboard for 2021, Romania is an emerging innovator with performance well below the EU average [18]. Previous national studies [15] observed a significant growth in research output in Romania during the first years following the enactment of the 2011 Education Law, but the trend was proved not to be sustainable over time.
Although financial indicators and bibliometric data have been largely used to assess research performance [11], the focus of this paper is on a more nuanced approach where a variety of factors is taken into consideration. In a generally accepted definition, research is seen as: ‘creative work undertaken on a systematic basis in order to increase the stock of knowledge, including knowledge of man, culture and society, and the use of this stock of knowledge to devise new applications’ [19]. Those undertaking such an activity must therefore be able to produce creative outputs or use methodologies in creative ways, be able to systematise information and knowledge in order to create new knowledge and be able to convert theory into applications. In a similar vein, the European Commission Directorate General for Research and Innovation [20] wishes European researchers to be: ‘creative, critical and autonomous intellectual risk takers, pushing the boundaries of frontier research’. If we relate productivity to the above-mentioned quotes, we find that in the case of research work, productivity also includes both behavioural aspects and result-goal aspects, as noted in the literature review on performance undertaken by Fogaça et al. [21]. Based on these considerations, it can be appreciated that researchers must therefore work creatively, systematically, critically, and autonomously (behavioural elements) in order to “increase the stock of knowledge” (outcome/goal elements).
In 2005, the European Commission put forward the European Charter for Researchers and Code of Conduct for their Recruitment, with 40 principles that contribute to the development of the European Research Area and subsequently to a Human Resource Strategy for Researchers (HRSR) [22]. From 2006 up to the present moment, 14 higher education (HE) and research institutes from Romania have declared their endorsement for the 40 principles, and in total, 1149 organisations have manifested their solidarity so far. This document specifically addresses the responsibility of employers to plan for the development of researchers’ careers: “Employers and/or funders of researchers should draw up […] a specific career development strategy for researchers at all stages of their career” [23] (p. 18).
Even though some research [2] suggested that reforms in the HE area could have an effect of the de-professionalisation of academics, the competences and abilities required nowadays from researchers are much more diverse, as a draft classification on research profile descriptors published on EURAXESS proves [24]. This classification divides researchers into four levels, depending on their research experience, with each level being provided with clear descriptors indicating demonstrated and desired competences and abilities: First-Stage Researcher (R1), meaning those who are conducting research under supervision, including doctoral students; Recognised Researchers (R2), who have a PhD but are not yet fully independent; Established Researchers (R3), who have proven their independence; and Leading Researchers (R4). Going through all these descriptors, especially the ones from R3 and R4, it can be observed that researchers are required to be competent in more than just their narrow research field, needing skills in broader areas such as communication, people management, and career management (for themselves and others). An Established Researcher is desired to be able to collaborate with relevant industry research or development groups [24]. Researchers should also be able to communicate about their research to both the academic community (starting with the Recognised Researcher level) and to society in general (from the Established Researcher level) [24].
Complementary to policy formulated competences, studies about the research career also name other required competences. Maer-Matei et al. [25], for example, in a study analysing the skills required from entry-level researchers in employment advertisements at the European level, concluded that core competences required of all RD&I professionals are data processing and handling, teaching, and management skills.

2.2. Job Satisfaction and Job Performance

Researchers, either from the public or the private sector, are directly involved in setting the speed at which innovation and development occur. Their performance is therefore paramount to sustainable development and is of interest to policy makers, governments, and universities alike.
Job satisfaction has been linked to job performance in different work sectors, including the academic one. Literature reviews on the factors influencing work productivity or job performance or the relationship between job satisfaction and job performance have been conducted, among others by Callaghan and Coldwell [26], Judge et al. [27], and Fogaça et al. [21]. Autonomous work (as is the case of research work), has been found to be characterised by the highest correlation between job satisfaction and job performance [27]. However, Bentley et al. [8] found only a weak relationship between productivity and job satisfaction, while Mamiseishvili and Rosser [28] and Callaghan and Coldwell [26] found no significant positive association between the two variables in their data. Bentley et al. [8] also noted that satisfaction is higher among senior ranking academics, but in the authors’ view, this could also be because rank is associated with age, experience, research performance, and gender. Masum et al. [29] found that compensation package, job security, and working conditions are the factors most influencing academic job satisfaction, and supervisory support, training and development opportunities, career growth, and organisational culture also have a positive impact on job satisfaction. Barbezat [30] found that research productivity, measured as the number of publications, is negatively influenced by one’s teaching load.
For our analysis, we rely on the highly referred-to job demands–resources (JD-R) model developed by Demerouti et al. [31], explaining the relationship between the characteristics of the work environment, performance, and well-being, and we partially rely on the Framework of academic satisfaction developed by Hagedorn [32], the Vitae Researcher Development [33], and Mobility Survey of the Higher Education Sector (MORE) Frameworks [34]. The model of Demerouti et al. [31] offers two sets of work conditions, namely job demands and job resources, that are considered as having an impact on the levels of burnout. Job demands conditions include physical workload, time pressure, recipient contact, physical environment, and shift work, while job resources conditions include performance feedback, rewards, job control, participation in decision making, job security, and supervisor support [31]. The model initially proved that low job resources are connected to low engagement, and high job demands are related to exhaustion [31].
Other research on job satisfaction of academics has relied on a similar two-step model. A notable framework considered in this sense is the one developed by Hagedorn [32], which includes Herzberg’s [35] two-factor theory of motivators and hygienes that influence job satisfaction. In this model, motivators and hygienes, together with demographics and environmental conditions are seen as mediators for job satisfaction, while changes in life or career stage, family or institution, perceived justice, or emotional stage are seen as triggers [32]. One commonality of these approaches is that job satisfaction and dissatisfaction have different sources or triggers which should be investigated separately [8].
The Concordat [33] principles aim to enhance the researcher workforce and thereby sustain research excellence, bringing benefits to the health, economy, and well-being of the UK. The Concordat is an agreement between the funders and employers of researchers in the UK. Sitting alongside a range of local, UK, and European initiatives, the agreement represents a significant policy development to support the good management of researchers and their careers. Vitae leads in the management and implementation of the Concordat to Support the Career Development of Researchers, monitoring and developing five clusters of principles related to recruitment and selection, recognition and value, support and career development, researchers’ responsibilities, and diversity and inclusion.
In our analysis, we focus our attention on the importance of these extrinsic motivators and hygienes: achievement, recognition, work itself, responsibility, advancement, and salary [32], which overlap with the job resources conditions in the model of Demerouti et al. [31], namely rewards, job control, participation in decision making, job security, performance feedback, and leader support. These are the dimensions that policy makers should address when implementing the Human Resource Strategy for Researchers (HRSR) at the national level and that, in our view, are key for developing a sustainable research career.
We stand by the position that performance in research is a two-way street: the performance of research institutions is supported by the individual performance of their human resources [26], and at the same time, the performance of researchers is influenced by the institutional setting and interactions in the system [10]. We argue that a sustainable career must be planned and analysed together with and taking into account the structural setting and institutional elements.

2.3. Purpose of the Present Study

The body of studies analysed in the previous section demonstrates the need to reshape the understanding of research performance and the underpinning policies and actions.
In the present study, we examined factors influencing research performance in Romanian public higher education institutions and national research institutes. The study considered the JD-R model [31,36] and partially considered the Framework of academic satisfaction developed by Hagedorn [32], the Vitae Researcher Development [33], and MORE Frameworks [34] as base models. We developed a customised conceptual framework of items and constructs influencing researchers’ performance in Romania. Generally, the framework brings together the variables associated with seven different dimensions: (1) recruitment and selection, (2) participation in research projects and teams, (3) work incentives, (4) salary, (5) career development opportunities, (6) leadership effectiveness, and (7) research recognition and value.
As pointed out in the MORE general framework [34], there are individual and human resources factors and organisational and system factors affecting the job performance of researchers. In the proposed conceptual framework, the recruitment and selection policies are regarded as both system factors and job demands. In Romania, national criteria are in place for entering a research institution or advancing in the research career. Those criteria are mandatory and represent the minimum requirements. Nevertheless, research institutions can add supplementary criteria to assess candidates or their employees. International recognition and participation in research projects and teams are the core dimensions of research performance in Romania. The national criteria mainly specify quantitative metrics (i.e., the number of research papers in high-impact journals, the number of citations and influence scores, and prizes won for research or teaching) to assess research performance, which has been highly criticised [12,37,38]. Apart from being job demands, achieving international recognition and collaboration in research teams could be impactful extrinsic job performance drivers [12,37]. In addition to personal prestige, work incentives, career development opportunities, and leadership effectiveness have been identified as potential determinants of job performance at the institutional level, while salary and job payment were considered system factors.
In a context of increasing emphasis on research performance assessment and metrics [39], our aim was to design and examine bottom-up models of research performance which could be used to develop national and institutional policies regarding the process of recruitment and selection, career development, research assessment, and leadership. Specifically, the research presented in this paper addressed the following research question (RQ) and hypotheses (H):
RQ1: What are the dimensions of research performance and how are they structured and related?
The research study we propose was guided by the following research hypotheses:
Hypothesis 1 (H1a).
The seven dimensions, because of their content and effect on research performance, will correlate positively with each other.
Hypothesis 1 (H1b).
The seven dimensions depend on a general construct, research performance.
In addition, we hypothesised two relationships:
Hypothesis 2 (H2a).
System factors, recruitment and selection, and job payment and salary have a positive predictive power over institutional factors of research performance.
Hypothesis 2 (H2b).
Institutional factors, namely career development, work incentives, and leadership effectiveness, have a positive effect on participation in research projects and teams and achieving recognition and value as individual factors of research performance.
The assumptions mentioned above are illustrated in Figure 1a,b.

3. Materials and Methods

3.1. Participants

The current research study followed an exploratory, empirical, cross-sectional mixed research design. The reference population of the study was represented by persons who formally carry out research activities in universities and public RD&I institutes.
All the public higher education institutions in Romania, all the National RD&I Institutes (INCD), and the research centres and institutes of the Romanian Academy received a formal letter presenting the research project and the invitation to participate in the survey. The selection unit was the research entity. Following the General Data Protection Regulation (GDPR) requirements, the institutions forwarded the survey invitation to their employees. A total number of 72 institutions participated (43 research institutes and 29 higher education institutions). In total, 1221 responses were obtained. We only kept the complete responses to the variables under investigation in this article in the database. The responses with a completion time shorter than 10 min were excluded, given the estimated completion time was around 25 min. The exclusion of these data resulted in 553 cases, which represent an overall response rate of around 40%. That is, the sample may not be adequately representative due to missing data of non-respondents. The demographic and disciplinary profiles of the respondent sample are described below.
In terms of gender, 47% of the respondents in the sample were female. The number of respondents occupying executive positions was up to 23% of the sample. Within this subgroup, the male subjects were over-represented (62%). The demographic profile shows that more than half of the respondents (56.1%) were aged 31–50. A third of the subjects (34.4%) were aged over 51, and fewer than 10% were aged 30 or below. As concerns the institution’s profile, 70% of the sample was represented by researchers working in research institutes.
The respondents were asked about their total experience as a researcher and length of service in their current institution. The results show that more than 75% of the respondents had been researchers for more than 10 years and only 9.9% for less than 3 years (see Table 1). More than two thirds of the respondents (70.3%) had been in their current institutions for more than 10 years (Table 2).
The geographical distribution shows an over-representation of the respondents who were residents in the capital region (58.2%). Nevertheless, respondents from 25 counties out of 41 were sampled.
The breakdown of the respondents’ profiles by subject specialism can be seen in Table 3. Advanced materials, energy, and environment were well-represented domains within the sample with over 10 percent. The high score computed for the ‘other’ response option is due to the great variety of domains it comprised (e.g., psychology, sciences of education, music, law, economy, communication, agriculture, architecture, and geography).
For some fields of research, the disciplinary profile was significantly gendered. For instance, the Energy and Information Technology and Telecommunications fields had a much lower proportion of female respondents (28.2% and 27.7%, respectively).
The total sample of 553 respondents was randomly divided into two sub-samples (n1 = 262, n2 = 291) to allow for cross-validation analyses.

3.2. Instrument and Measures

An ad hoc questionnaire was designed. We included variables on three hierarchical levels: system, institution, and individual levels. The identified variables were rated on an 11-point scale from −5 to +5, where −5 = very negative influence and +5 = very positive influence on researchers’ job performance. Each of the seven dimensions in the theoretical framework was operationalised with several items adapted from already existing instruments. The initial version of the questionnaire was quantitatively pretested. Purposefully selected researchers were invited to test the questionnaire through an online survey platform and to disseminate the invitation to other colleagues. The questionnaire had open fields associated with each dimension, where the respondents could comment on the clarity and relevance of the items in that dimension and made additional suggestions. A total sample of N = 117 participants filled out the test survey. The reliability analyses showed good to very good metrics of the questionnaire. Following the participants’ feedback, seven items were slightly rephrased, and two new items were added to the international recognition of research dimension.
In the following, the structure and metric qualities of the questionnaire are discussed.
At the system level, we considered the recruitment and selection and job payment policies. We operationalised the recruitment and selection dimension with four items following the recommendations in the IA study on the Open, transparent, and merit-based recruitment of researchers [40] and the respective scale in the ‘Five Steps Forward’ study conducted in the United Kingdom [33]. The reliability of the scale was good (Table 4): α = 0.890 , ( M s c a l e = 10.11 ,     S D = 8.97 ) —see Appendix A, items RS1–RS4. Complementarily, the job payment and salary dimension included two items ( α = 0.856 ) . The two items were translated into Romanian and adapted from the 6th European Working Conditions Survey [41]. One item referred to the influence of salary or wage in exchange for researchers’ work on job performance. The second one touched on additional components that might be of a variable nature and their influence on job performance—see Appendix A, items SAL1 and SAL2.
The variables associated with the institution level were seen as job resources and thematically organised in three dimensions: career development opportunities, work incentives, and leadership effectiveness. The career development opportunities dimension contained eight items ( α = 0.901 ) , answered in a scale ranging from −5 (very negative influence) to +5 (very positive influence). The items were translated into Romanian and adapted from the from the ‘Five Steps Forward’ study [33]—see Appendix A, items CD1–CD8. Similarly, the five items in the leadership effectiveness dimension (Appendix A, items MANAG1–MANAG5) were translated and adapted from the same study [33] and answered in a similar scale ( α = 0.872 ) .   The work incentives dimension (Appendix A, items WI1–WI5) included five items ( α = 0.863 ) . The items were extracted from the MORE2 Study [34] and translated into Romanian.
The individual level comprised two dimensions: recognition and value of research and participation in research projects and teams. The items were translated into Romanian and adapted from the ‘Five Steps Forward’ study and included three subscales, namely appraisal and review, recognition of management activities, and recognition of researchers’ contributions. To operationalise the Recognition and Value of Research dimension, we used the 10 items with the highest factor loadings of the primary factor ( α = 0.921 ) . Two items with factor loadings below the 0.4 threshold were not retained in this dimension for further analyses.
We operationalised the Participation in Research Projects and Teams with seven items, with the highest factor loadings on the first factor ( α = 0.893 ) . Two items with factor loadings below the 0.4 threshold were not retained in this dimension for further analyses.

3.3. Procedure

The research was structured in two phases, blending semi-structured interviews and quantitative surveys as primary data collection methods.
In the first phase, we explored the relevance of the conceptual framework through qualitative, semi-structured interviews. Based on the findings, a questionnaire was designed and deployed for quantitative data collection in phase 2. The present paper reports on the data collected in the second phase of the study.
Together, the two phases of the study provide empirical information on what variables and indicators affect researchers’ performance in Romania.
As described in the Participants subsection, the authors sent an official invitation to survey to all public HEIs and research institutes in Romania. The invitation extensively explained the rationale and context for the study. We relied on the institutions’ cooperation to complete the data collection process. The data were collected through an online specialised platform, Survey Alchemer®, with no compensation for participation. The average completion time was 26 min. No personal information leading to the identification of the subjects was collected. All the data were fully anonymised in compliance with GDPR regulations. Participation in the survey was voluntary and was granted clearance according to the recommended Ethics Guidelines of the university to which the three authors were affiliated at the time of data collection. The survey included electronic consent. The subjects had the option to participate or to decline participation by clicking the respective button. The ethical approval for the study was obtained from the Institutional Review Board, approval number 2552C/15.11.2019.

3.4. Data Analysis

In order to determine the factorial structure of researchers’ job performance, we carried out principal axis factoring analysis (PAF) using IBM SPSS v25.0 software. PAF was applied as an exploratory dimensionality-reduction method to deduce the main factors described by the variables in the study. Initially, the factorability of the 71 items in the questionnaire was examined. The Kaiser–Mayer–Olkin measure of sampling adequacy indicated that the strength of the relationships among variables was high: K M O = 0.935 . The dimensionality of the scales was also tested by the scree plot test and the Kaiser criterion—eigenvalues greater than 1 [42]. Fourteen items had low communalities ( h 2 ) below the 0.4 threshold. They were removed from the analysis. Sixteen items unsatisfactorily loaded on their primary factors, and five of them had cross-loadings ranging from 0.2 to 0.35. The items failed to meet the minimum criteria of having a primary factor loading of 0.4 or above [43,44], and no cross-loading of 0.3 or above. Consequently, PAF was re-run on 41 items. The communalities were above 0.4 ( 0.417 h 2 0.816 ) , further confirming that each item shared some common variance with other items. The Bartlett’s test of sphericity, which tests the overall significance of all the correlations within the correlation matrix, was significant ( X 2 ( 820 ) = 15,596.70 ,   p < 0.001 ) . Given these overall indicators, factor analysis was deemed to be suitable with all 41 items.
In the final solution, six factors with eigenvalues greater than one were extruded. Both Varimax and Oblimin rotations were performed. There was little difference between the two solutions provided, and we decided to keep the solution extracted based on the Varimax rotation with Kaiser normalisation.
Initially, by applying the factor analysis, we reduced the number of variables and tested the dimensionality of each latent variable. Subsequently, structural equation modeling was applied to validate the results of the factor analysis and to test the hypotheses. The first modelling part was implemented using IBM Amos 26.0 and maximum likelihood estimation (ML-SEM). In order to determine the factorial structure of the research performance, several models were tested. Firstly, we tested a reflective model where all items loaded on a single latent factor (Model 1 CFA 1). Secondly, as a base, we used a structure in which the six dimensions correlated with each other (Model 2 CFA2). Thirdly, Model 2 CFA 2 was cross-validated using the second sub-sample (Model 2 CFA 3). Fourthly, a new second-order reflective model was designed. The factors corresponding to research performance depended on a general second-order factor, namely job performance (Model 3 CFA 4). Similarly, it was cross-validated on the second sub-sample (Model 3 CFA5).
Following the recommendations of Hooper, Coughlan, and Mullen [45], the normed/relative chi-square ( X 2 / d f ) could take values between 2 and 5. Other fit indices were also computed and analysed: RMSEA, RFI, CFI, and TLI. MacCallum, Browne, and Sugawara [46] suggest that an RMSEA value between 0.05 and 0.10 can be considered a fair fit. More recent scholar opinions (e.g., Steiger) report values less than 0.07 [47] in order to consider a correct fit of the model. Regarding the CFI and TLI indices, the values should be close to the 0.95 threshold [45]. Values between 0.85 and 0.95 indicate a satisfactory fit of the model to empirical data [46]. In this paper, we followed the criteria and acceptable thresholds suggested by Hooper et al. [45] and MacCallum et al. [46].
To examine the relationships between the variables, a path analysis was carried out. Job payment, career development, work incentives, and participation in research projects and teams were used as mediators.
The final modeling part employed Bayesian analysis (B-SEM) with the same research framework along with Amos 26.0 software. The data were categorical ordered variables. Thus, we preferred to re-examine the data using Bayesian analysis and to compare the results for Model 2 B-SEM and Model 3 B-SEM with the maximum likelihood estimator models.

4. Results

4.1. Descriptives

Table 5 shows the descriptive statistics for the variables used in our study. High positive mean scores were computed for the variables MANAG5 (positive motivational support offered by the manager, M = 4.03 ,   S D = 1.44 ) , CD3 (possibility to participate in international teams, M = 4.02 ,   S D = 1.42 ) , CD1 (job security, M = 3.97 ,   S D = 1.76 ) , MANAG3 (manager’s capability to attract research funding, M = 3.95 ,   S D = 1.57 ) , RE3 (publications in high-impact-factor journals, M = 3.93 ,   S D = 1.64 ) ,   and MANAG4 (manager’s orientation toward research integrity, M = 3.93 ,   S D = 1.55 ) .
The correlations between the variables in the study were positive, of low to medium intensity, and statistically significant at the 0.01 level ( 0.194 ρ 0.753 ) —see Supplementary Sheet S1.

4.2. Results of the Principal Axis Factoring Analysis

At first, the factorability of the 71 items in the questionnaire was tested. The correlations between items were positive, statistically significant at the 0.01 level, and of low to medium intensity. The Kaiser–Mayer–Olkin measure of sampling adequacy indicated that the strength of the relationships among variables was high: K M O = 0.935 , and the Bartlett’s test was statistically significant: X 2 ( 8612485 ) = 22,742.98 ,     p < 0.001 ) . The communalities showed that 14 items did not prove satisfactory common variance with other items ( 0.067 h 2 0.392 ) .
To reduce the number of variables included in the statistical model, PAF with Varimax rotation was conducted. PAF was applied because the primary goal was to identify the latent factors underling researchers’ job performance. The initial solution included 14 factors with eigenvalues above 1 which explained 54% of the total variance. The first extracted factor accounted for 26% of the total variance. Factors 11, 12, 13, and 14 had eigenvalues just above the 1 threshold.
Based on the results of the initial PAF analysis and the criteria for factorability, 30 variables were removed from the analysis. The removed items had low communalities ( h 2 < 0.4 ) , did not meet the criteria for having a primary loading of 0.4 or above, and cross-loaded on other one or two factors (cross-loadings were below 0.3).
For the final stage, PAF was re-run for the remaining 41 items. The Varimax rotation provided the best-defined factor structure. All the 41 items included in the analysis had primary loadings over 0.4. Two items in the job payment dimensions (SAL 1 and SAL 2) had cross-loadings of 0.305 and 0.408, respectively. However, their primary loadings were 0.808 and 0.668.
The Kaiser–Mayer–Olkin measure of sampling adequacy indicated a strong relation among variables: K M O = 0.949 ,     X 2 ( 820 ) = 15,596.7 ,   p < 0.001 . All the correlations were positive and statistically significant at the 0.01 level (see Supplementary Sheet S1).
Table 6 presents the factor loadings, communalities, variance, and eigenvalues for the final solution. Six factors with eigenvalues greater than 1 were identified and retained in the model (Table 6), and together, they explained 58% of the total variance. Internal consistency for each of the scales was examined using Cronbach’s alpha. The coefficients proved to be good and very good ( 0.856 α 0.931 ) .
The first factor extracted relates to career development opportunities. Thirteen variables loaded on this factor, which accounted for 38.355 of the total variance. The loadings ranged from 0.512 to 0.734. The factor includes variables related to job stability, access to training in research management, team leadership, and mentorship. Additionally, variables referring to leadership effectiveness in career management were found to load strongly on this factor. The variables that had the highest loadings were the leader’s skills to provide researchers with guidance to develop their research careers (0.722) and to effectively engage in research teams’ development (0.705).
The second factor we extracted was research recognition and value. Together with the first factor, they accounted for 45.246 of the total variance explained by the six-factor solution. As expected, citations of research papers (0.769) and publications in high-impact-factor journals (0.745) and international conference proceedings (0.744) loaded strongly on the second factor. Affiliation to international professional associations and societies was found to be related to the factor research recognition and value.
The third factor extracted was participation in research projects and teams. This factor was represented by seven items, which accounted for 50.475 of the total variance (cumulated with the first two factors). The loadings of the variables ranged from 0.755 to 0.479. The highest loadings were related to the coordination of international (0.755) and national research projects (0.737). The lowest loading was computed for the contribution of highly prestigious research prizes and awards to researchers’ job performance.
The fourth factor was recruitment and selection. The factor was represented by four items, which accounted for 53.661 of the total variance (cumulated with the first three factors). The item referring to the transparency of the recruitment and selection process had the highest loading of 0.844.
The fifth factor was work incentives. Five items loaded on this factor and cumulatively explained 56.403 of the total variance. The loadings ranged from 0.737 to 0.437.
Finally, the sixth factor was salary or job payment. The factor was represented by two items, which had loadings of 0.806 and 0.668, respectively. The sixth factor accounted for 2.185 of the variance.

4.3. Results of the Structural Equation Modeling

4.3.1. Model 1 Mono-Factor CFA 1 (ML-SEM)

In Figure 2, we present the standardised estimates of the first confirmatory model (Model 1) as well as the regression weights. All estimated weights were significant (p < 0.001) (see Table 7). As for the fit statistics obtained for the mono-factor model, chi-square was significant, but the ratio   X 2 / d f , the RMSEA, TLI, and CFI were well outside the limits to accept the model. As suggested by the exploratory factor analysis and the research framework, researchers’ job performance could be a second-order construct underlying various primary constructs.

4.3.2. Model 2 Intercorrelated Factors CFA2 (ML-SEM)

We present the second confirmatory model in Figure 3. The data were run through Amos with maximum likelihood estimation, and the results (Table 8) indicate an acceptable fit (H1a). The skewness and kurtosis statistics indicated a violation of the univariate normality. Additionally, Mardia’s coefficient was 1085.64 , and the critical ratio (c.r.) was 214.97 , indicating a significant multivariate non-normality. Thus, the data were bootstrapped with 2000 draws at the 95% bias-corrected confidence level.
The path diagram presents the standardised estimates of the second confirmatory model as well as the squared multiple correlations after bootstrapping. All estimated weights were significant (p < 0.001). As for the fit statistics obtained for Model 2, chi-square was significant, but the ratio X 2 d f and the RMSEA were inside the limits to accept the model. Nevertheless, TLI and CFI adjustment indexes indicated it was satisfactory to accept the model.

4.3.3. Model 2 Intercorrelated Factors CFA3 Cross-Validation (ML-SEM)

Sample 2 (n2 = 291) was used to carry out a cross-validation analysis. All estimated weights were significant (p < 0.001) (see Table 9). All the other estimates were identical with those computed for Model 2 CFA2. Therefore, the model (Figure 4) could be accepted (H1a).

4.3.4. Model 2 Intercorrelated Factors (B-SEM)

Additionally, Bayesian SEM (B-SEM) was conducted with Markov chain Monte Carlo (MCMC) estimation. We show below that MCMC converged well with Model 2 and also resulted in a good model fit (H1a).
The default diffuse prior in Amos 26.0, a uniform over the interval 3.4 × 10 38   to 3.4 × 10 38 [48], was placed on all parameters in the model.
The Bayesian results for the measurement model are presented in Table S1. Before discussing the results, we first checked the convergence of MCMC chains using Amos 26.0 (Figure 5). The PSRF value was 1.0003. Since the value was less than the default cutoff of 1.002 in Amos 26.0 [48], the chains were likely sampling from the target distributions. For example, as shown in the convergence plots of some model parameters in Figure 5, the chains mixed well after a few thousand iterations and after 100,000 iterations in each case [49]. Since the trace plots for the six-factor model appeared to sample consistently from the same range of values over the course of the iterations, the chains were likely sampling from their target distributions.
The results of the B-SEM analysis are discussed in terms of posterior predictive p-values (ppp), posterior distributions, and autocorrelation. The hypothesised model produced a ppp value around 0.5, p p p = 0.43 , [50]; Model 2 appeared to fit the data well (H1a).
The posterior mean and the posterior SD are presented in Table 10 and Table S1. The loadings were all statistically significant at the 5% level, as noted by the low standard deviation. The results from the structural model are presented in Table 10. For each relationship, we show the posterior mean and standard deviation [49], as well as 95% higher posterior densities.
Figure 6 also presents the plots of the empirical posterior distributions for some of these relationships. The histograms from Model 2 exhibited gradual changes in the height of adjacent frequency bars over the parameter space. Thus, the chains likely represent the posterior distributions well.
The autocorrelation was low with increasing lags for all parameters (Figure 7). Therefore, the chains were likely sampling well from their target distributions.
As one final analysis of Model 2, we compared the unstandardised regression weights in ML and Bayesian approaches. The listing is presented in Table 11, and it is continued in Supplementary Table S2. The values of the estimates are very close, confirming the validity of the hypothesised structure in Model 2 (H1a).

4.3.5. Model 3 Hierarchical CFA 4 (ML-SEM)

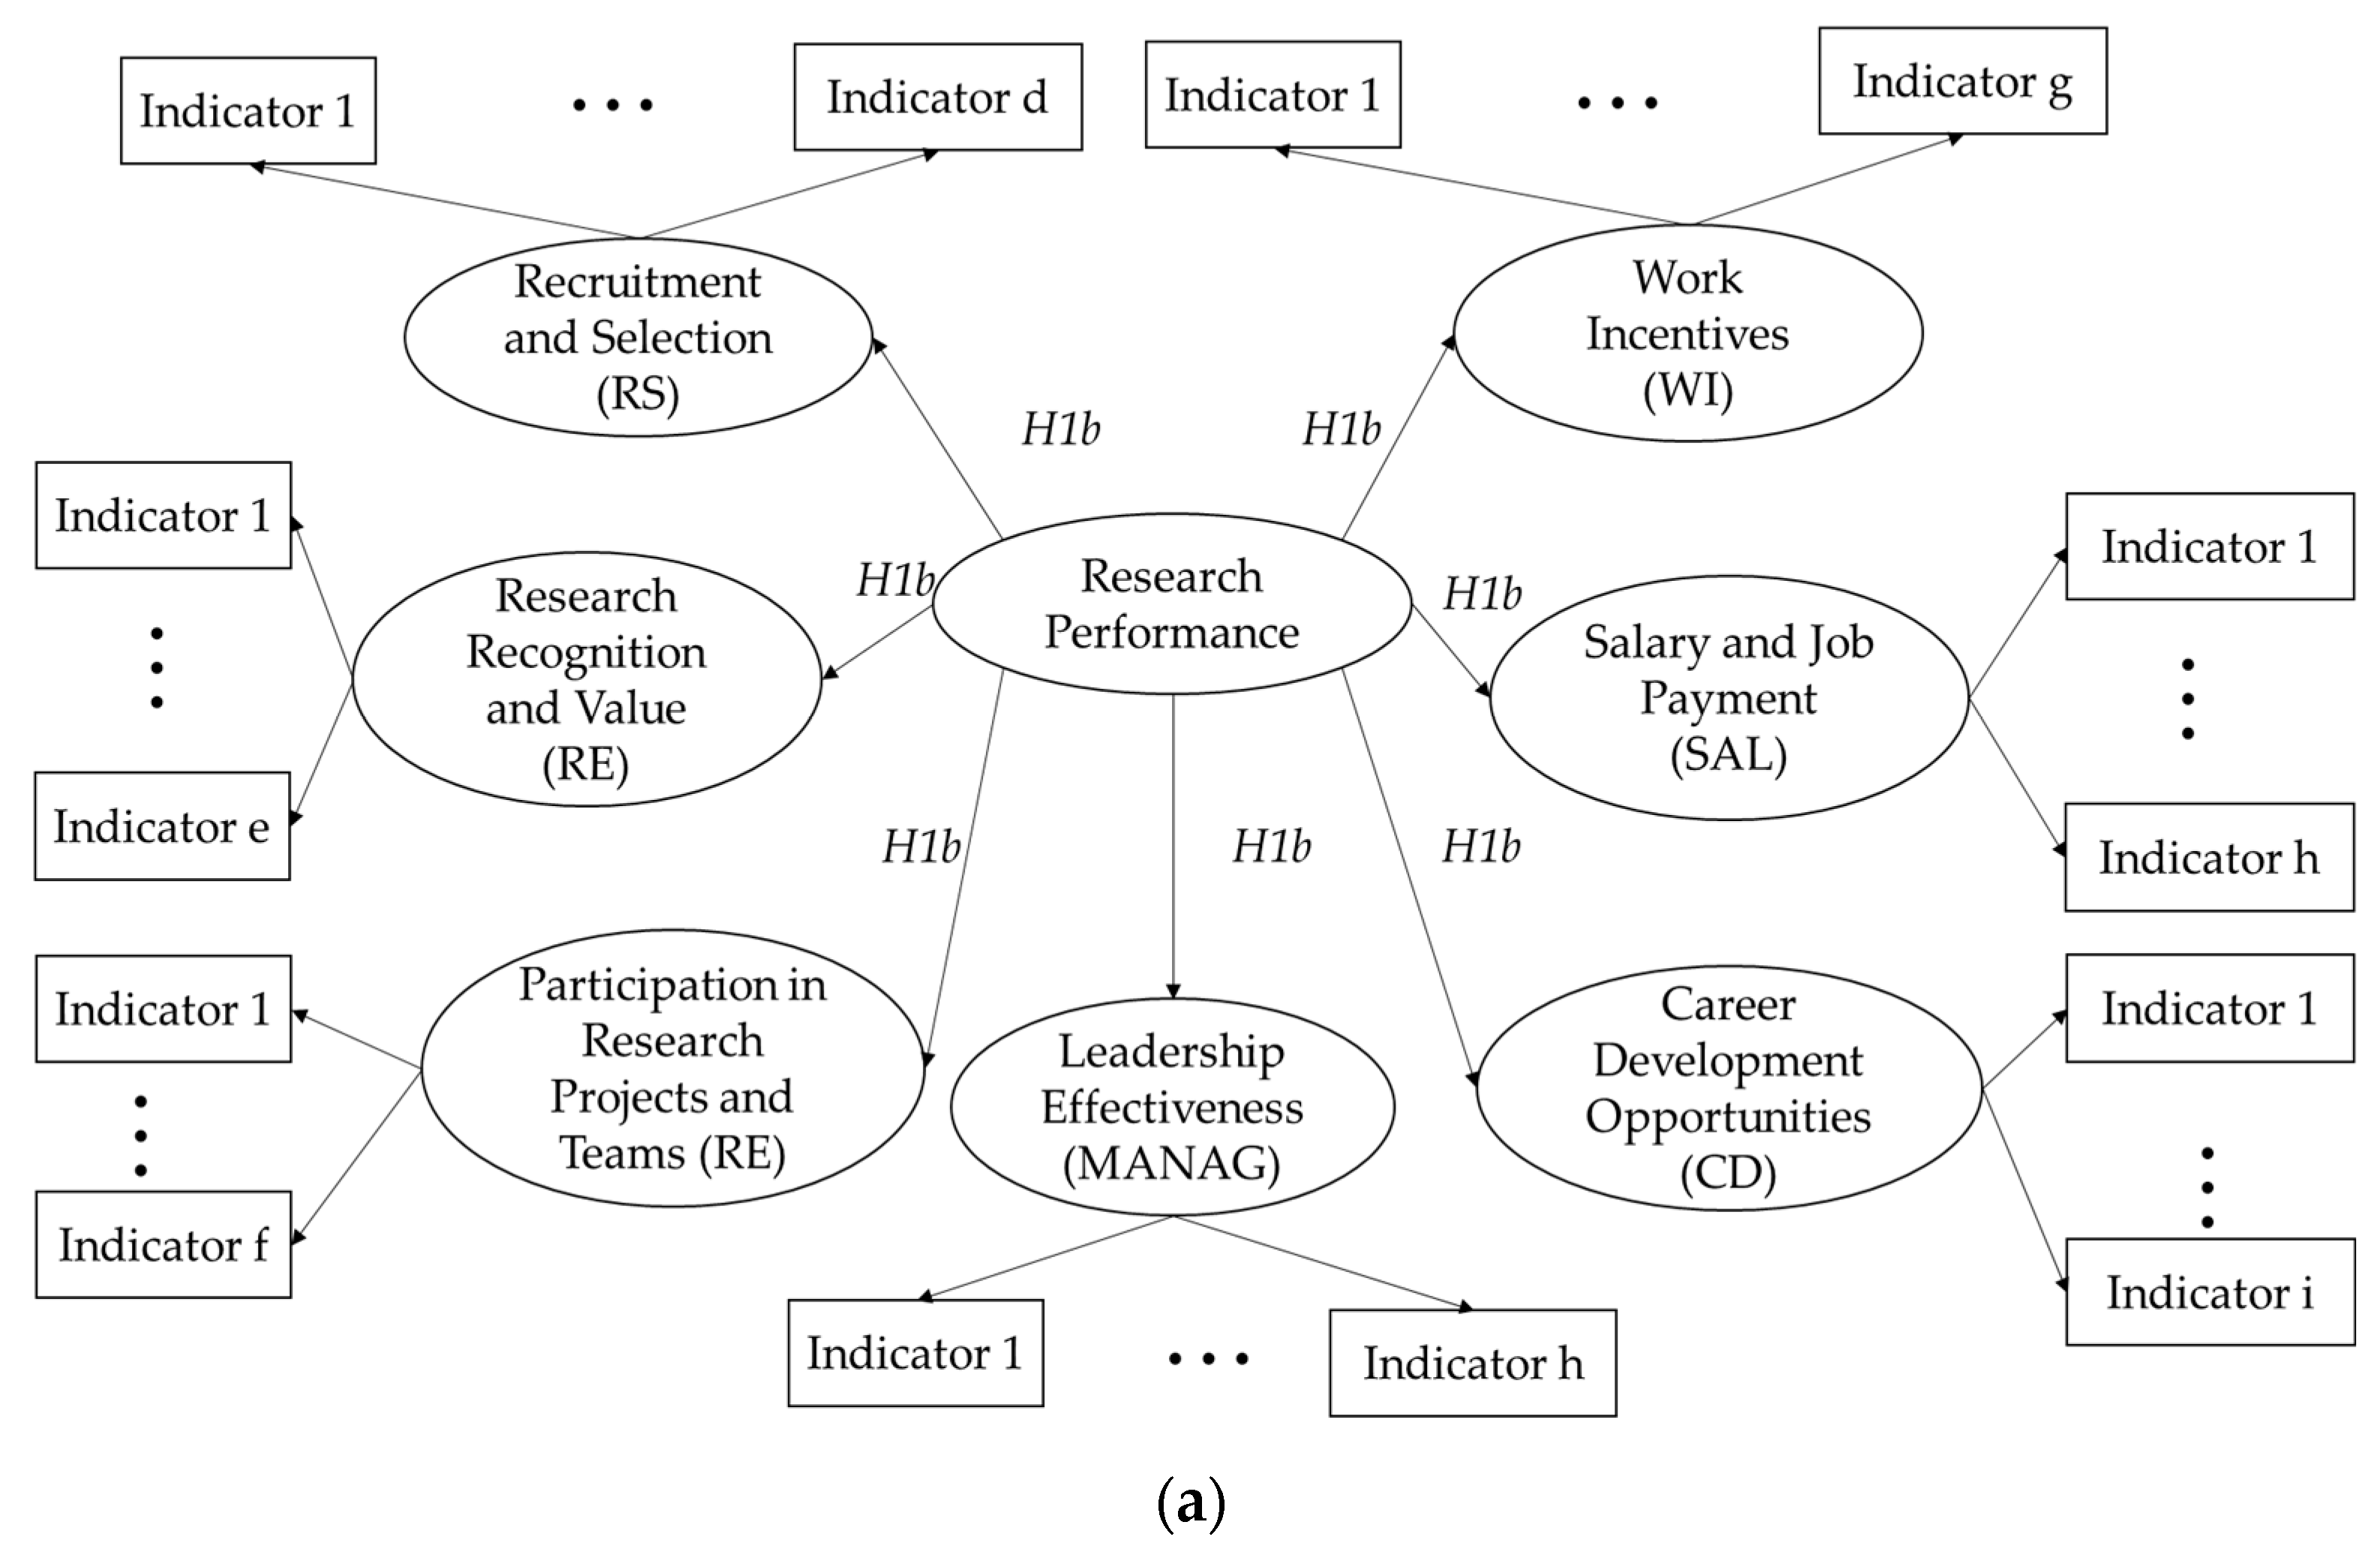
The aim of this analysis was to test whether the six first-order factors corresponding to the six groups of research performance drives were indicators of a general construct named research performance (H1b). To mitigate the violation of univariate and multivariate normality, Bollen–Stine bootstrapping with 2000 draws at the 95% bias-corrected confidence level was performed. Figure 8 shows the model and standardised estimates after bootstrapping. All the regression weights were statistically significant ( p < 0.001 ) . As it can be seen in Table 12, this model showed a goodness of fit, better than Model 2 CFA2 and CFA3. Chi-square was significant, but the ratio X 2 d f , the RMSEA, TLI, and CFI adjustment indexes were well inside the limits that allowed the model to be accepted.

4.3.6. Model 3 Hierarchical CFA 5 Cross-Validation (ML-SEM)

Sample 2 (n2 = 291) was used to cross-validate Model 3 (see Figure 9). All the estimated weights indicated a good fit of the model (see Table 13). Therefore, the model could be accepted.

4.3.7. Model 3 Hierarchical B-SEM

To check for further validation, B-SEM was conducted with MCMC estimation. We show below that MCMC converged well with Model 3 and resulted as well in a good model fit (H1b).
The default diffuse prior in Amos 26.0, a uniform over the interval 3.4 × 10 38 to 3.4 × 10 38   [48], was placed on all parameters in the model.
The Bayesian results for the measurement model are presented in 
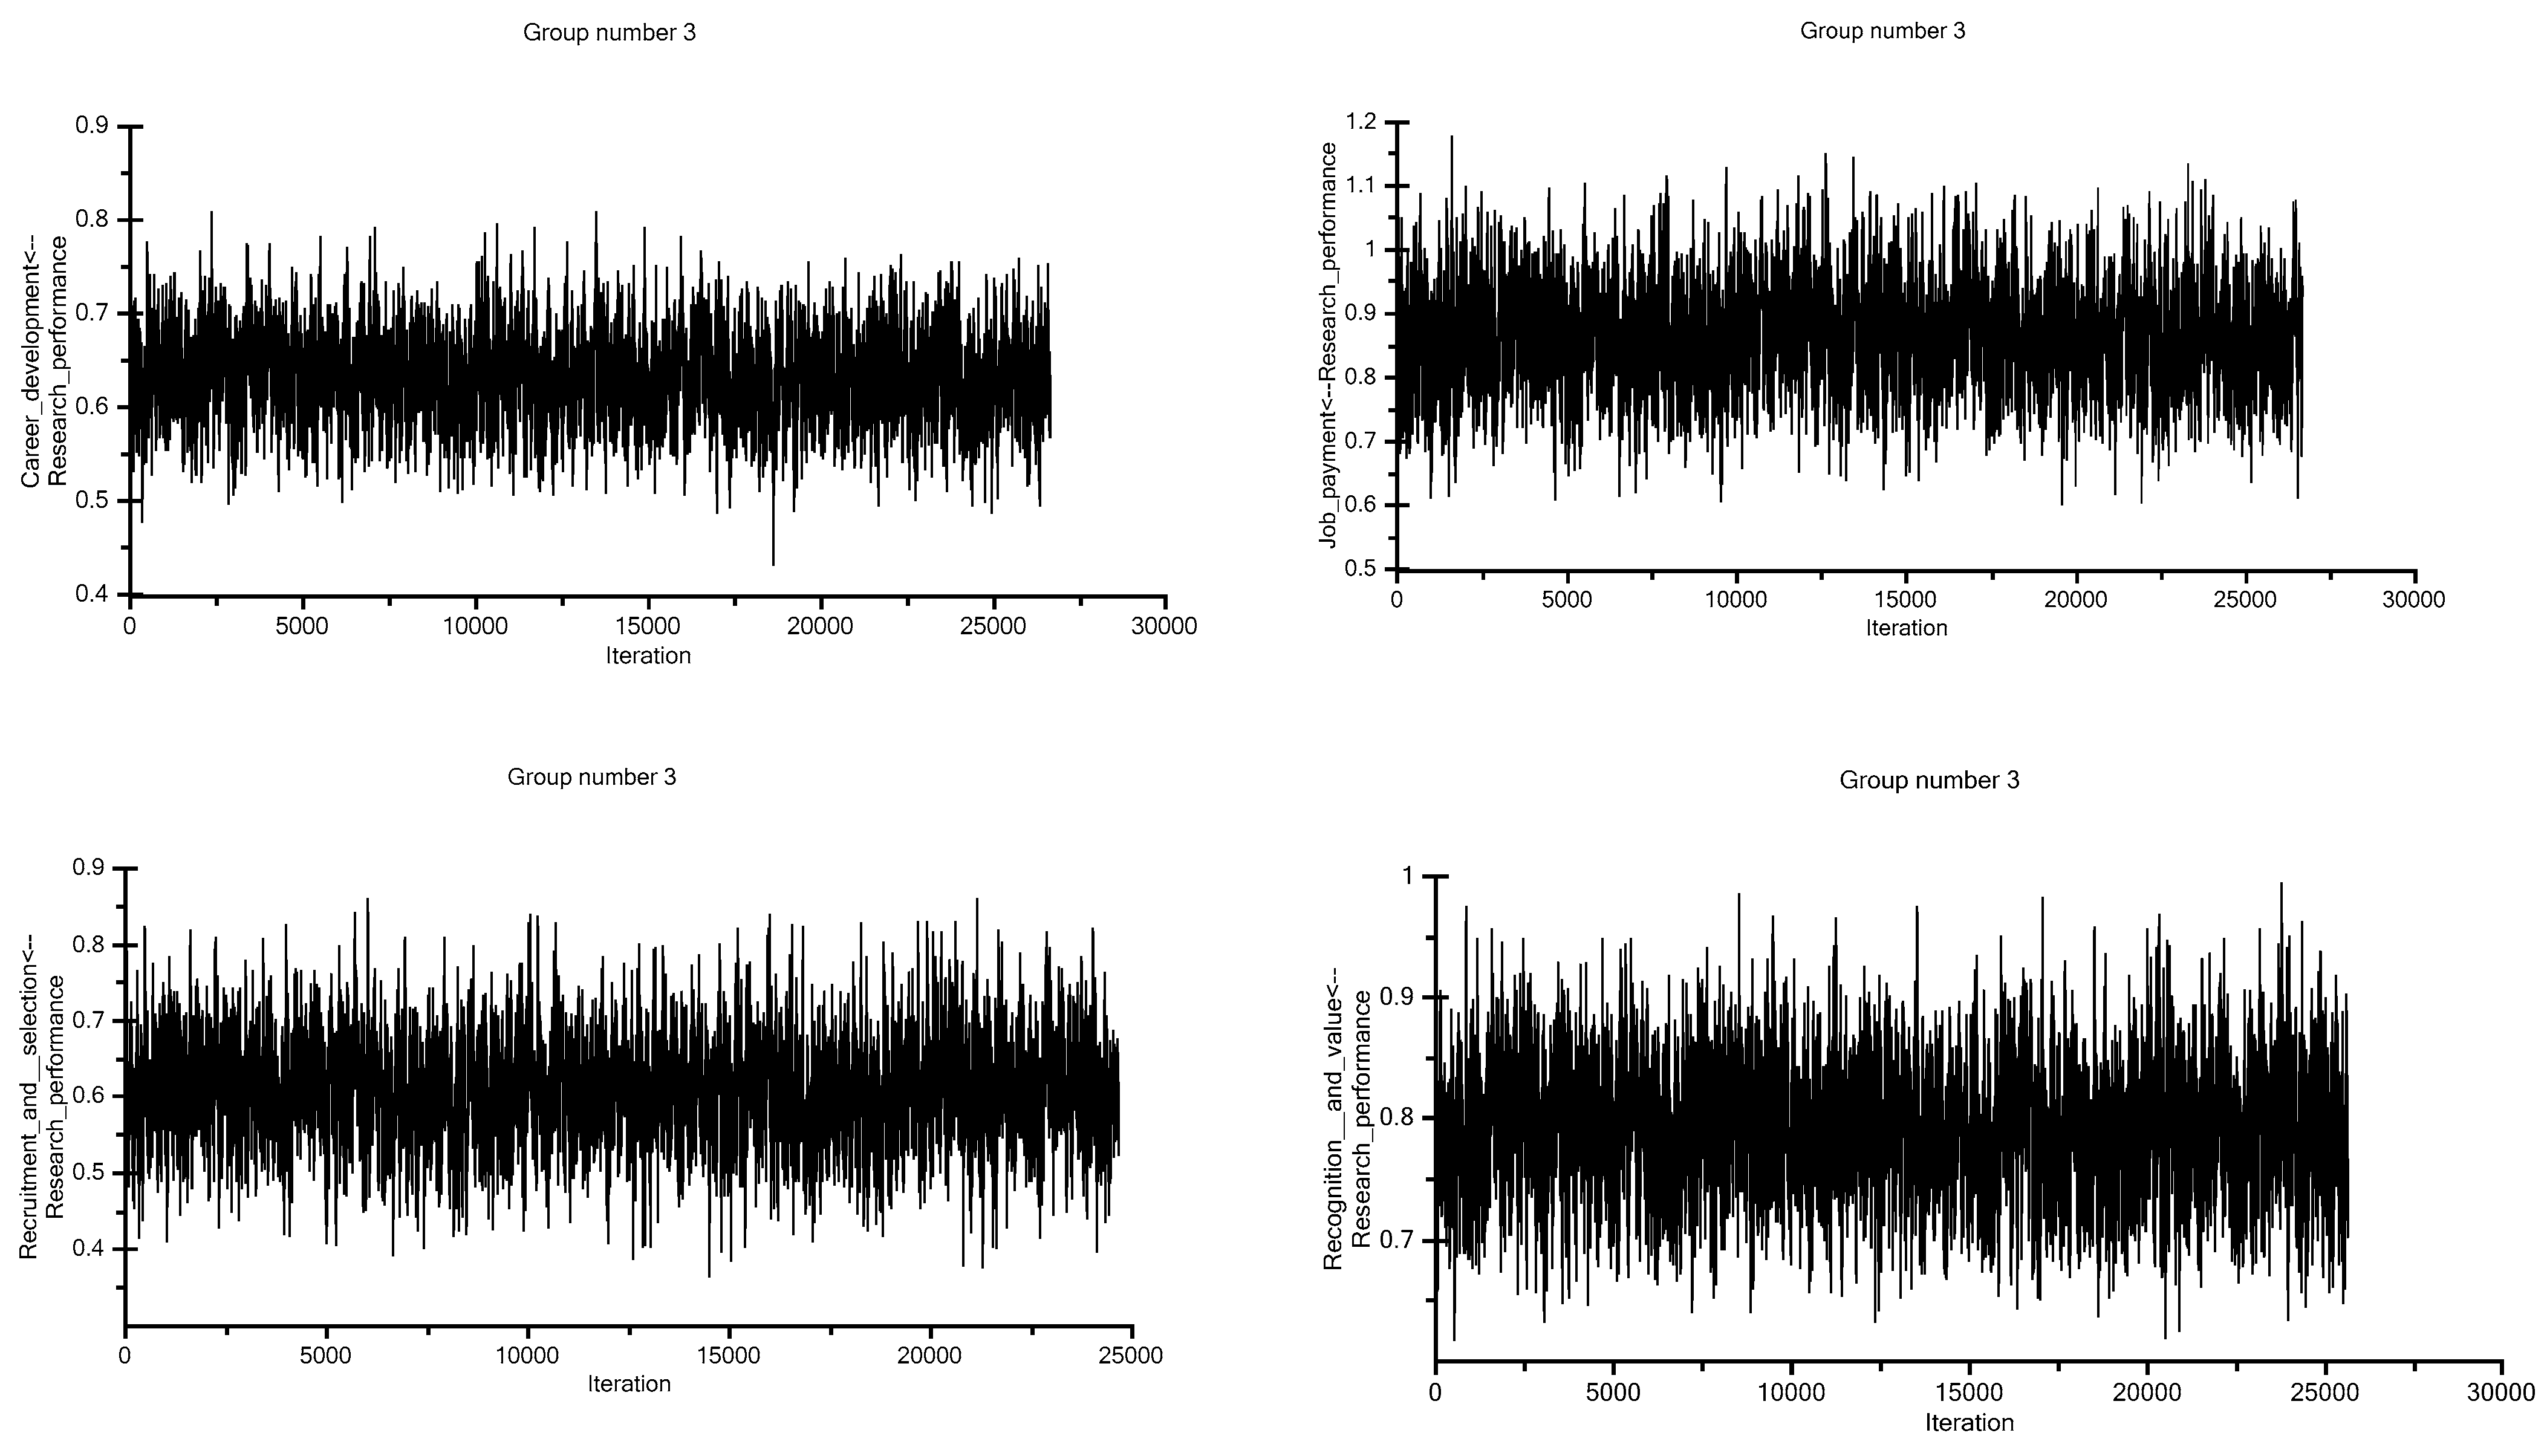
Supplementary Table S3. As presented in Figure 10, we checked the convergence of MCMC chains using Amos 26.0. The PSRF value was 1.0001, which was below the cut point of 1.002 in Amos 26.0 [48], thereby indicating convergence. Thus, the chains were likely sampling from the target distributions. For example, as shown in the convergence plots of some model parameters in Figure 10, the chains mixed well after a few thousands of iterations and after 100,000 iterations in each case. Since the trace plots for the six-factor model appeared to sample consistently from the same range of values over the course of the iterations, the chains were likely sampling from their target distributions.
The posterior predictive value produced by Model 3 was around 0.5, p p p = 0.37 [50]. Therefore, Model 3 appeared to fit the data well (H1b).
The posterior mean and the posterior SD are presented in Table 14 and Table S3. The loadings were all statistically significant at the 5% level, as noted by the low standard deviation. For each relationship, we show the posterior mean and standard deviation [49], as well as 95% higher posterior densities.
Figure 11 also presents the plots of the empirical posterior distributions for some of these relationships. The histograms and polygons from Model 3 exhibited gradual changes in the height of adjacent frequency bars over the parameter space. From the display in the plots in Figure 11, it can be observed that the two distributions were almost identical, thereby suggesting the successful identification of important features of the posterior distributions of the analysed items. Thus, the chains likely represented the posterior distributions well.
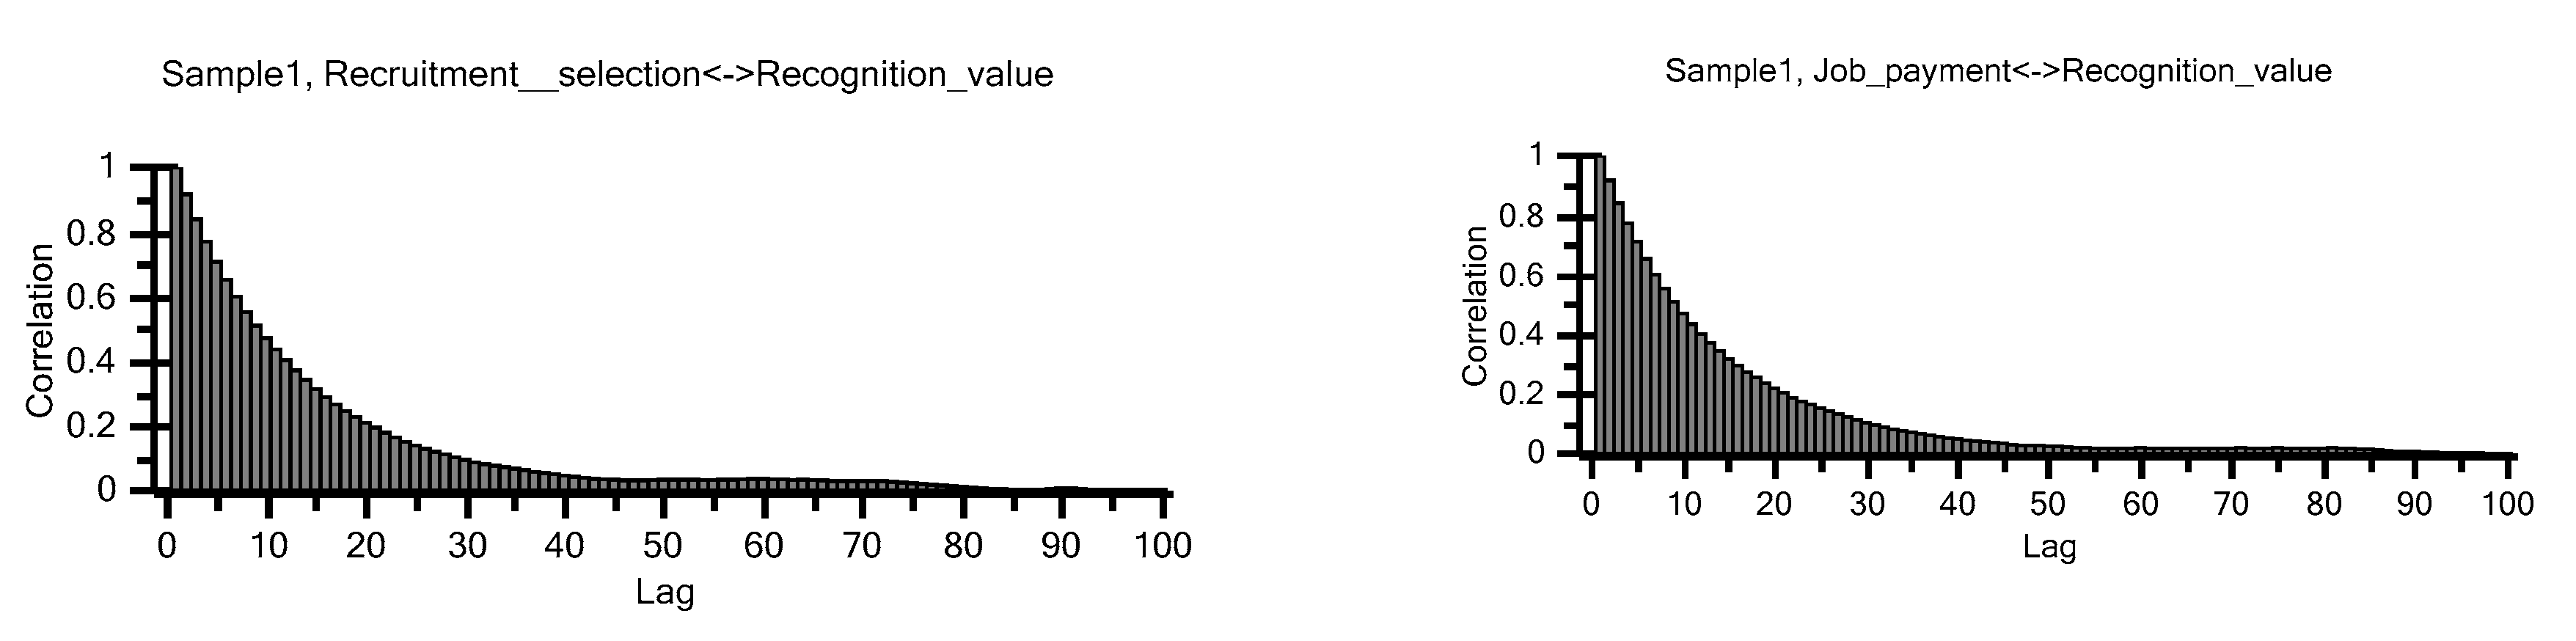
The autocorrelation was low with increasing lags for all parameters (some examples are presented in Figure 12). Therefore, the chains were likely sampling well from their target distributions.
Finally, we compared the unstandardised regression weights for the ML-SEM method versus the Bayesian posterior distribution estimates. A listing of both sets of estimates is presented in Table 15 and it is continued in Supplementary Table S4. As expected, based on the review of the diagnostic plots, these estimates are very close. We can, therefore, conclude that the hypothesised structure (H1b) is valid.

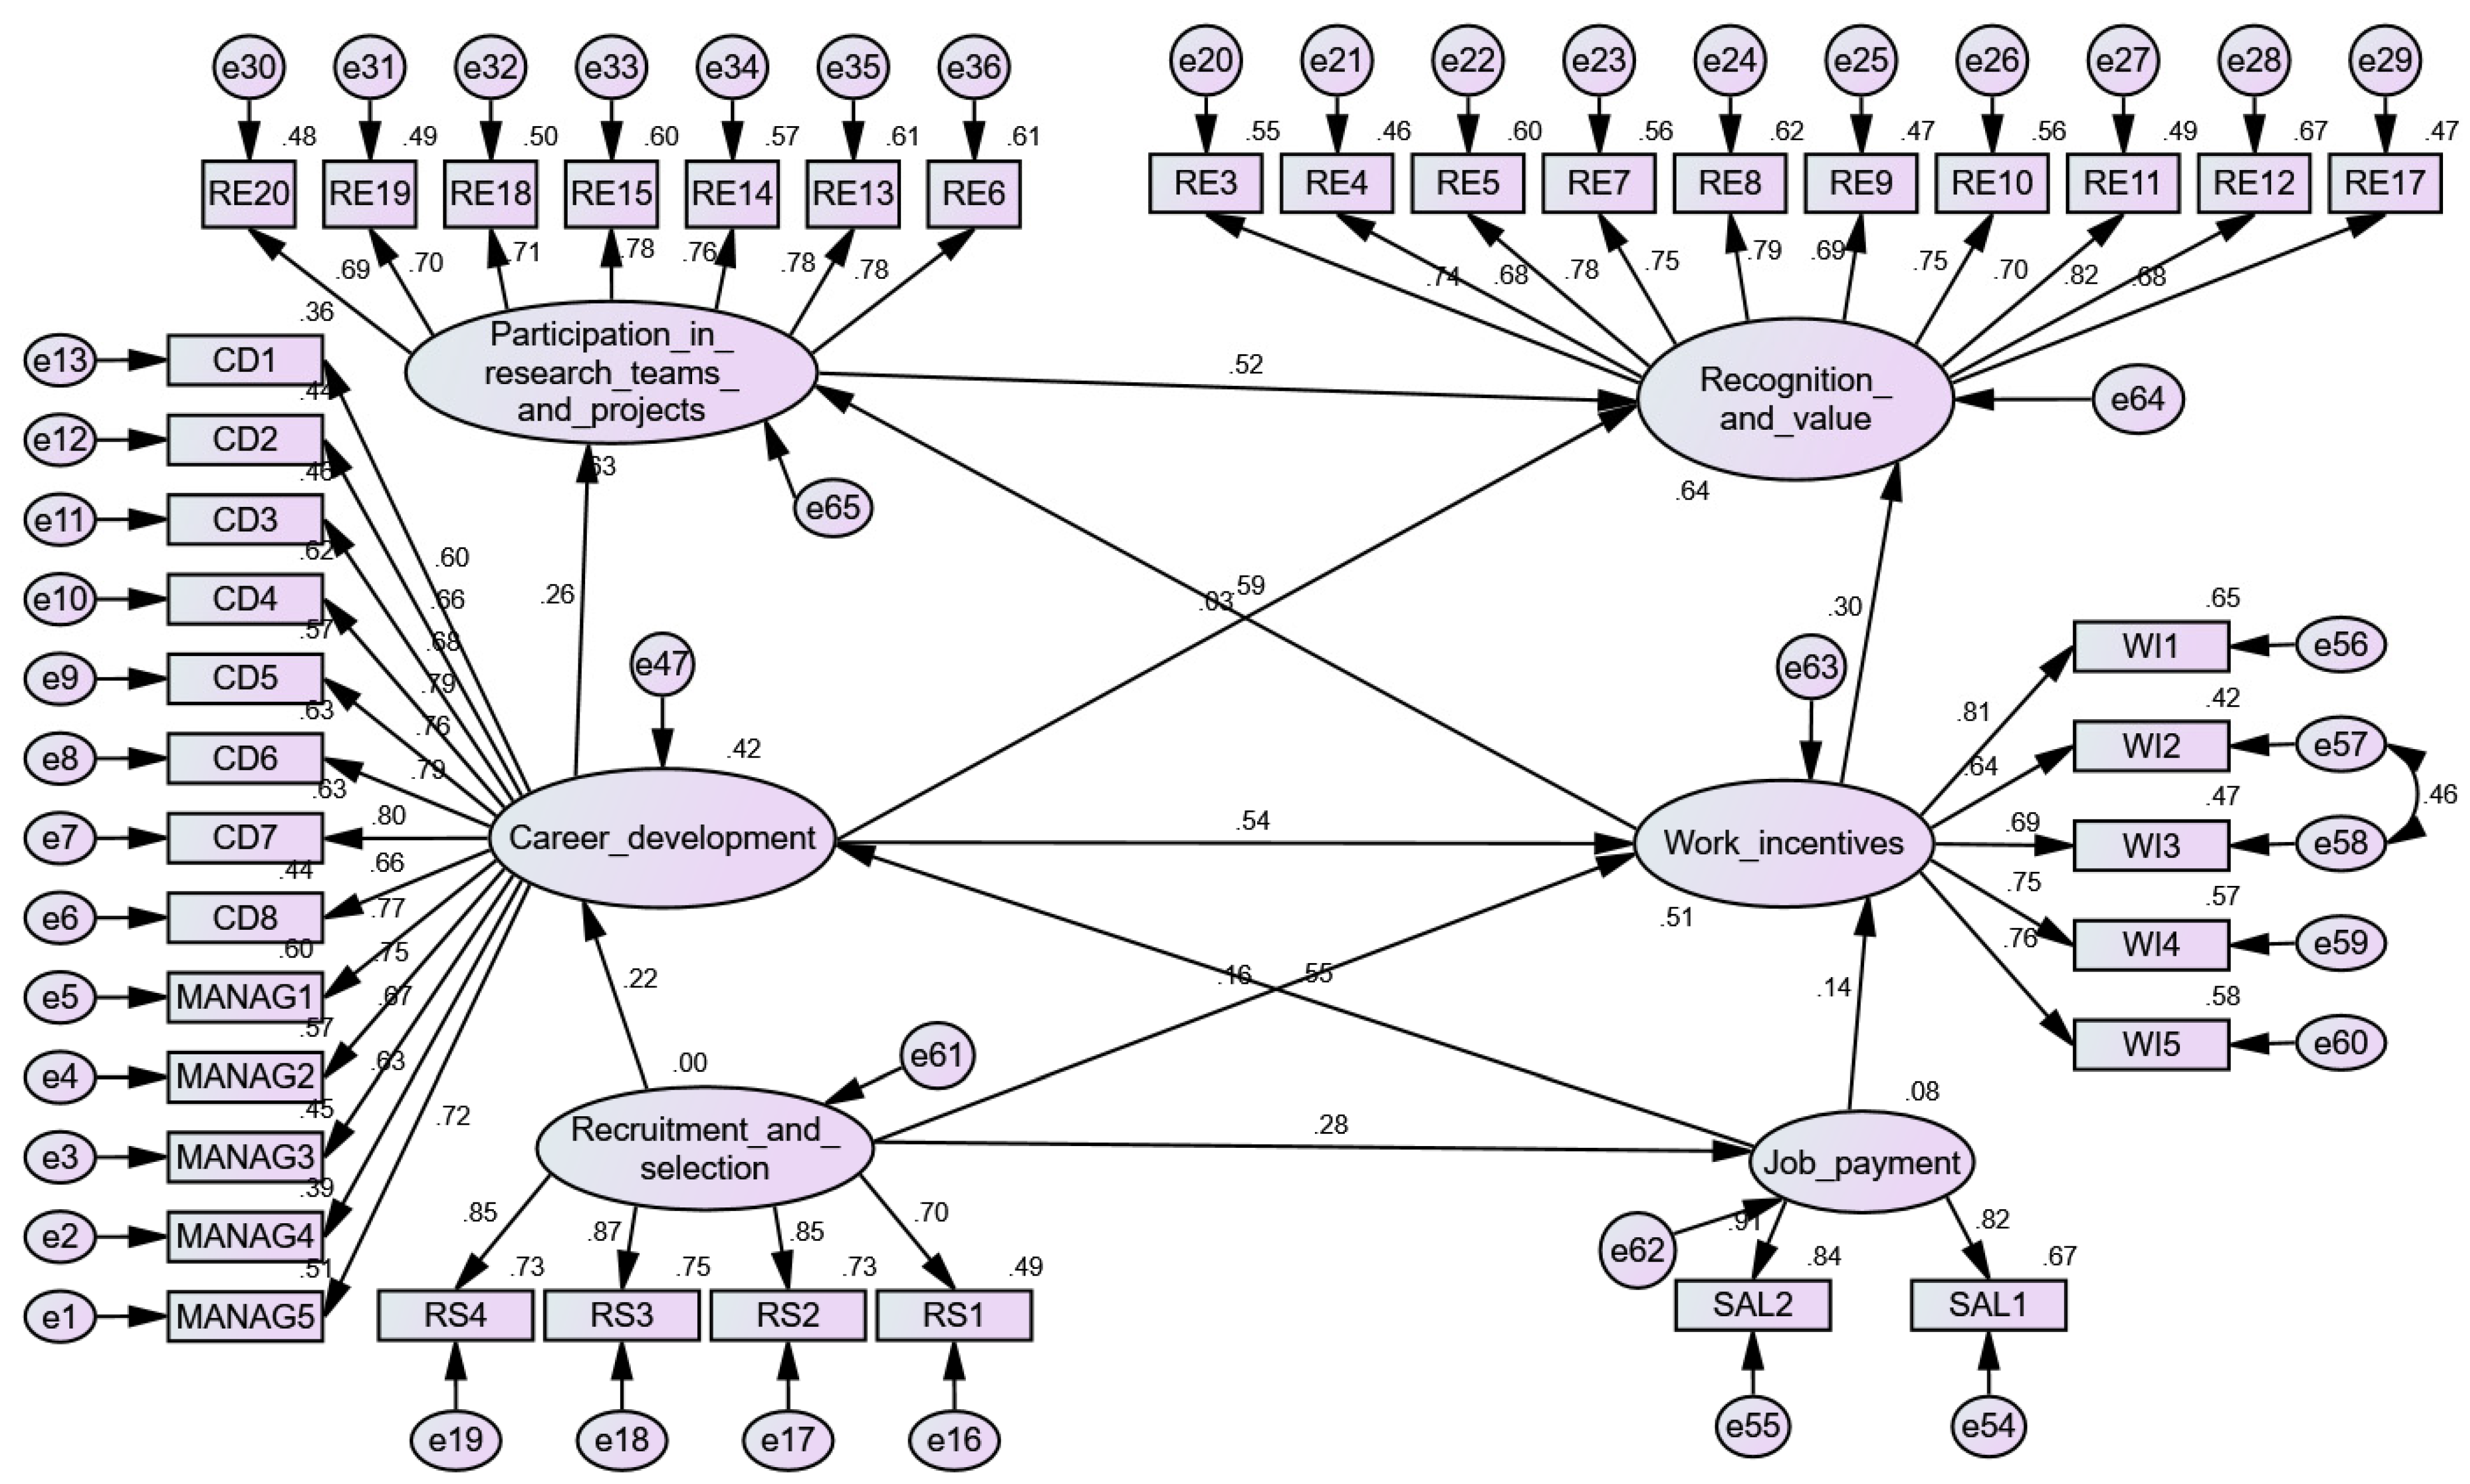
4.3.8. Path Analysis

Figure 13 shows the path analysis and Table 16 the fit indices of the model. The aim of the analysis was to determine the nature of the relationships between the six variables considered to be drivers of research performance. As it can be seen, the results confirmed the H2a and H2b hypotheses. The relationships and their implications are discussed in Section 5. All the regression weights were statistically significant ( p < 0.001 ) . The fit indices in Table 16 fit into the acceptance limits. The skewness and kurtosis statistics indicated a violation of the univariate normality. Additionally, Mardia’s coefficient was 784.76 , and the critical ratio (c.r.) was 106.96 , indicating a significant multivariate non-normality. Thus, the data were bootstrapped with 2000 draws at the 95% bias-corrected confidence level.
Table 17 shows the mediator variables, the variance explained, and the total, direct, and indirect effects. Recruitment and selection and job payment explain 42% of career development variance. The effect of recruitment and selection is mediated through job payment. Participation in research projects and teams depends (63%) on career development and work incentives, but the effect of career development is mediated through work incentives, as the path diagram in Table 17 suggests. The effect of career development is particularly noteworthy. If this predictor is removed, the work incentives variable explains 0% of participation is research variation. Career development has a total effect of 0.581 on participation in research projects and teams. Therefore, by increasing career development the participation in research activities would increase as well. It is estimated that the predictors of recognition and value explain 64 percent of its variance. Career development has a total effect on recognition and value of 0.497. Participation in research projects and teams mediates the effect of career development on recognition and value.
In closing out this section, we point out the importance of our comparative analysis of research performance factorial structure from two perspectives: ML and Bayesian estimations. Given that items comprised in the research instrument are based on an eleven-point scale, the argument could be made that analyses should be based on a methodology that takes this ordinality into account. In this case, Models 2 and 3 were well specified, the was scaling based on more than three categories and, therefore, we did not find very much difference between the findings.

5. Discussion

This study aimed to design and examine bottom-up models of research performance by applying ML-SEM and B-SEM. In order to do so, a seven-dimension theoretical framework, echoing the JD-R model and partially the Framework of academic satisfaction developed by Hagedorn [32], was designed. The development of such models of research performance is necessary because research performance is at the heart of national, European, and international policies and initiatives aimed to tackle global challenges [38,51,52]. The context surrounding research performance in RD&I institutions is manifold. For example, the positive momentum for open science [53], the exponential growth of data and data science [38], and the inception of new generation metrics [39] shape new pathways for strategic development. In this context subject of change, the models we propose shed light on potentially effective RD&I policies and inform the decision-making process.
Although much research has focused on analysing research performance, there are not so many studies modelling this construct with SEM and particularly with B-SEM. This is particularly true when factors such as career development, leadership, and recruitment and selection policies are included in the analysis.
Overall, we observed that systemic factors such as recruitment and selection and job payment policies positively and significantly influence institutional factors, which have a positive and significant effect on individual factors related to achieving value and recognition in research. Moreover, in line with the initial assumptions, all three categories of factors were proved to depend on higher-order construct, namely research performance.
In the current study, PAF was initially applied to explore the factorability of the variables. The results showed that six factors explain more than 58% of the variance of research performance: (1) recruitment and selection, (2) participation in research projects and teams, (3) work incentives, (4) salary, (5) career development opportunities, and (6) recognition and value. Thereby, all the indicators associated with the seven dimensions were re-grouped in six factors. All indicators associated with the leadership effectiveness dimension were loaded on the career development dimension. Therefore, they were kept and included in the career development factor, and the number of dimensions was reduced to six. The finding is consistent with the results of previous research [10,12,29,54], pointing out that comprehensive career development policies, (inter-sectoral) mobility, and dedicated human resources policies could significantly contribute to research performance [55,56].
Following the PAF analysis, ML-SEM was applied as a parametric analysis for testing the relationships among the observed variables and their respective factors, as well as among the latent variables. Comparatively, B-SEM was carried out as a nonparametric analysis.
Thus, three reflective models were tested: M1 mono-factor; M2 intercorrelated dimensions; M3 hierarchical. The estimates and statistics computed proved that the hypothesised relations in Model 2 and Model 3 were valid. The indicators that were found to be significant in explaining the latent factors considered in this study are as follows.
As regards the career development factor, the items loaded on this factor indicate more challenging pathways for both institutions and researchers. In addition to sharpening their scientific profile, R3 and R4 researchers need to play more varied roles such as mentors, career advisors, and grant managers. As models M2 CFA 2 and CFA 3 showed, career orientation plays a key role in career development (factor loading = 0.723) and by effectively engaging in research team development (factor loading = 0.705). In addition, integrating a set of skills related to project management (factor loading = 0.734) and the motivation of research team members (factor loading = 0.731) is expected to have considerable potential to support career development and, thus, to positively influence the research performance. Within this context, ‘particular priority should be given to the organisation’s working and training conditions in the early stage of the researchers’ careers, as it contributes to the future choices and attractiveness of a career in R&D’, as the European Charter and Code for Researchers states [22].
Within the research recognition and value dimension, citations of research papers (factor loading = 0.772) and publications in journals indexed in internationally recognised databases and in internationally recognised conference proceedings (factor loading = 0.746) are the most important indicators. This is probably since, in Romania, the mechanisms for evaluating the performance of employees in the RD&I sector are merely based on bibliometric indicators. Although it was not the purpose of this paper to address new generation metrics, we argue that a new narrative of research performance is needed. New metrics oriented towards science openness, public engagement and outreach, and contributions to sustainability could better align RD&I institutions to society and employers’ needs and consolidate their role in innovation ecosystems [38,39].
In terms of participation in research projects and teams, the coordination of international (factor loading = 0.751) and national research projects (factor loading = 0.737) are strong indicators. The lowest factor loading was computed for the contribution of highly prestigious research prizes and awards to research performance (factor loading = 0.476). Awards can bring appreciation from those awarded for the recognition received and can represent a symbol of excellence, giving confidence and credibility to those awarded. However, awards do not necessarily bring significant changes in performance at work [57]. The effects may not always be in the desired direction, or they can even destroy the value [58].
At the level of recruitment and selection process, the transparency of the recruitment and selection process (factor loading = 0.844) followed by openness of the available positions to any candidate who matches the profile (factor loading = 0.836) are the most important indicators. Thus, it can be appreciated that the existence and quality of information sources regarding vacancies jobs in RD&I, the high level of transparency in the recruitment and selection process, but also open positions for any candidate are aspects necessary from a formal point of view but are not actually enough to attract the best candidates in the RD&I sector. In relation to recruitment and selection, we strongly advocate for the adherence to the principles of the European Charter and Code for Researchers [22].
Regarding the work incentives factor, financial incentives have the greatest positive influence on this variable. Specifically, internal competitions to win funding for scientific events (factor loading = 0.737) and internal competitions for participation in training programmes (0.686) or international mobilities are the most important indicators.
Finally, for the salary and job payment factor, employers and/or funders of researchers should ensure that researchers enjoy fair and attractive conditions of funding and/or salaries (factor loading = 0.806) with adequate and equitable social security provisions (factor loading = 0.668).
Through SEM, we tested the structure and the relationships among those factors. As the first model M1 CFA1 proved a poor fit, it was not cross-validated, and the Bayesian analysis was not performed either. As shown in M2 CFA2, M2 CFA 3, and M2 B-SEM models, all six latent variables positively and significantly correlated with each other, which provides a confirmation of the H1a hypothesis. High levels of participation in research projects and teams and of achieving research recognition are closely related to significant career development policies and opportunities. Similarly, work incentives such as international mobilities or prizes strongly correlate with research participation and recognition. As well as this, intense participation in research is associated with significant recognition of research. The results are intrinsically related to the knowledge-based economy framework. RD&I entities crucially need to invest in talent to drive participation and recognition [55,59]. By addressing the six factors in comprehensive policies, systems and institutions could nurture researchers to perform better in their careers [11,59]. Moreover, research leadership and mentorship can be understood as pillars of career development and addressed accordingly [1,7,10].
One of our hypotheses postulated that the six factors will depend on a general construct, research performance (H1b)—Model 3. This relationship was validated through ML and Bayesian estimations. Therefore, the higher the value in the research performance, the more the researchers achieve recognition and value, participate in research projects and teams, are incentivised and rewarded, and engage in their career development [12,13,54].
Moving forward in our analysis, we intended to find empirical evidence about the relationship between the six factors of research performance and their respective effects (H2a and H2b). As shown in the path analysis model, system factors, recruitment and selection and salary and job payment, respectively, have a significant and moderate effect on the institutional factors, confirming H2a. Furthermore, researchers’ recognition and value and their participation in research activities (understood as individual drives of performance) are affected by the institutional factors, namely career development and incentives, confirming H2b. A powerful feature of the path analysis model is that it gives centrality to career development in boosting research performance [25,34]. In line with other scholars’ opinions [55], we argue that RD&I institutions are responsible for ensuring the leadership towards boosting the career of researchers in line with the principles in the European Charter and Code for Researchers [9,40]. Providing researchers with well-structured career perspectives, career development support, training, and mentorship would consequently develop researchers’ skillsets and would be associated with more significant rewards. In terms of rewards and incentives, institutions could consider mobility stages, internal grant competitions, or performance bonuses. Moreover, work incentives positively influence participation in research projects and teams which, further, leads to the recognition of research.

6. Conclusions

This paper aimed to design and examine bottom-up models of research performance by building upon the specific context of RD&I landscape in Romania. In order to do so, maximum likelihood SEM and Bayesian SEM estimations were carried out.
The results highlighted that recruitment and selection, salary and job payment, career development, work incentives, participation in research projects and teams, and recognition and value strongly and positively corelate with each other and depend on a higher-order construct named research performance. System factors, recruitment and selection, and job payment and salary, respectively, have a positive predictive power over institutional factors of research performance, and the institutional factors, namely career development and work incentives, have a positive predictive power over individual factors of research performance. As argued in the previous sections, an essential feature of the models we developed is career development and its effect on participation in research projects and teams and achieving research recognition and value. Therefore, the models we propose could be used to develop national and institutional research policies in which career development, research leadership, and co-careering gain centrality. At the national level, the paper could inform the implementation of specific reforms and initiatives proposed in the National Plan for Resilience and Recovery [60]. More importantly, the models provide a common ground and inspiration for research-performing entities to design their internal policies to support a sustainable research culture. As the factors influencing research performance largely exceed the participation in research projects and teams and researchers’ payment, the proposed models open a perspective in which leadership and research career governance complement the role of career development practices. Even if it was not the purpose of this paper, the models may also be relevant for the assessment of individual researchers in the context of career advancement.
Thus, it can be concluded that the RD&I institutions need to play a dynamic role and firmly engage to support their researchers, throughout their careers, in their development and career choices. This requires coherent but distinct sets of skills training programmes, career support structures, and human resources policies for various career phases to boost research performance and thoroughly support the ‘Lisbon Strategy’.
We acknowledge several limitations of the study.
Firstly, it is important to mention that sample and sampling limitations need to be considered in the interpretation of the results. Although all public research entities in the country received the invitation to participate in the survey, the authors were not able to control the dissemination of the survey within the institutions.
Secondly, we acknowledge that some limitations may arise as consequences of the administered scales and data collection procedures. Since the questionnaire was self-administered through an online platform, some of the responses were incomplete or proved to be of poor quality and were removed from the database.
Finally, it is important to note that even though the models were in agreement with the empirical data and provided a theoretically consistent set of findings, there may be other equivalent models that fit the data equally well.
In conclusion, our study represents a step forward toward a better understanding of research performance. The main contributions of the paper are twofold. Primarily, the paper designs a framework for the conceptualisation and inception of relevant practices to ensure a sustainable, multidimensional pathway towards research performance.
Furthermore, we point out the importance of our comparative analysis of research performance factorial structure from two perspectives: ML and Bayesian estimations. The analyses conducted demonstrate the potential of ML-SEM and B-SEM approaches in modelling research performance. The results of this study could be used as priors for future studies applying Bayesian estimations. Complementarily, future studies could test formative models of research performance. Although there are some limitations, comparative studies can be conducted to model research performance across the European Research Area.

Supplementary Materials

The following supporting information can be downloaded at: https://www.mdpi.com/article/10.3390/su14042254/s1, Sheet S1: Correlations statistics; Table S1: Measurement Model 2 results. Posterior estimates; Table S2: Comparison of Regression Weights Unstandardized Parameter Estimates—Maximum Likelihood versus Bayesian in Model 2; Table S3: Model 3 B-SEM Estimates and statistics; Table S4: Comparison of Regression Weights Unstandardized Parameter Estimates—Maximum Likelihood versus Bayesian.

Author Contributions

Conceptualisation, L.M., D.P. and G.I.; methodology, L.M. and D.P.; data curation, L.M., D.P. and G.I.; writing—original draft preparation, L.M., D.P. and G.I.; writing—review and editing, L.M., D.P. and G.I. All authors have read and agreed to the published version of the manuscript.

Funding

This study was supported by the Ministry of Research and Innovation under the grant number 8PS Metode avansate de monitorizare și creștere a performanțelor în cariera de cercetare (Advanced Techniques to Boost Performance in Research Careers).

Institutional Review Board Statement

The ethical approval for the study was obtained from the Institutional Review Board, approval number 2552C/15.11.2019.

Informed Consent Statement

Informed consent was obtained from all subjects involved in the study.

Data Availability Statement

The data presented in this study are available on request from the authors.

Acknowledgments

The authors would like to express their sincere gratitude to the Ministry of Research, Innovation, and Digitalization for supporting this study as a part of a broader national initiative focusing the governance of research careers. Additionally, we thank Irina Cristescu, the National Institute for Research and Development in Informatics, for her contribution to the development of the questionnaire. We also highly appreciate the contribution of the institutions and researchers who filled out the questionnaire.

Conflicts of Interest

The authors declare no conflict of interest. The funder had no role in the design of the study; in the collection, analyses, or interpretation of data; in the writing of the manuscript, or in the decision to publish the results.

Appendix A

Research Performance Dimensions in RD&I Questionnaire.
−5−4−3−2−1012345
Negative influence
−1 = slightly negative influence;
−5 = highly negative influence
No influencePositive influence
1 = slightly positive influence;
5 = highly positive influence
Recruitment and Selection
RS1The advertisements on open positions provide applicants with a broad description of knowledge and competences required and include a description of the working conditions and entitlements
RS2The recruitment and selection procedures are transparent
RS3Available positions are open to any candidate who matches the profile
RS4Selection procedures are merit-based, as well as tailored to the type of positions advertised
Research Recognition and Value
RE3Publication of research results/contributions in high-impact-factor journals indexed in Web of Science—Clarivate
RE4Publication of research results/contributions in journals without an impact factor indexed in Web of Science—Clarivate
RE5Publication of research results/contributions in journals indexed in internationally recognised databases (other than Web of Science—Clarivate)
RE7Publication of research results/contributions in conference proceedings indexed in Web of Science—Clarivate
RE8Publication of research results/contributions in conference proceedings indexed in internationally recognised databases (other than Web of Science—Clarivate)
RE9Publication of research results/contributions in national conference proceedings
RE10Citations of research papers in high-impact-factor journals indexed in Web of Science—Clarivate
RE11Citations of research papers in journals without impact factor indexed in Web of Science—Clarivate
RE12Citations of research papers in journals indexed in internationally recognised databases (other than Web of Science—Clarivate)
RE17Affiliation to professional associations and societies
Participation in Research Projects and Teams
RE6Contributions to winning research grants
RE13Coordination of an international research project
RE14Membership in an international research team
RE15Coordination of a national research project
RE18Academia–Enterprise Cooperation
RE19Highly prestigious research prizes and awards
RE20Patent Recognition
Work Incentives
WI1Rewards and other appreciation awards
WI2Internal funding competitions for participation in training programmes
WI3Internal competitions for winning funding for scientific research
WI4Competitions for obtaining travel or mobility funding
WI5Financial incentives/Performance bonuses
Salary and Job Payment
SAL1Adequate salary for the activity undertaken and the effort made
SAL2Benefits package (meal/gift vouchers, health insurance, bonuses, etc.)
Career Development Perspectives
CD1Job stability/security
CD2Promotion opportunity
CD3Participation in international and national research projects
CD4Training/improvement on project management skills
CD5Training/improvement on counselling regarding career opportunities
CD6Training and development for members/ research teams’ motivation and retention
CD7Leadership training/development
CD8Professional mobility skills in the same career field (public-> private and vice versa)
MANAG1Career development specialist competencies
MANAG2Competencies for building and development of research teams
MANAG3Ability to raise funds for RDI
MANAG4Professional integrity role model
MANAG5(Positive) career motivation

References

  1. Froumin, I.; Lisyutkin, M. Excellence-driven policies and initiatives in the context of bologna process: Rationale, design, implementation and outcomes. In The European Higher Education Area; Curaj, A., Matei, L., Pricopie, R., Salmi, J., Scott, P., Eds.; Springer International Publishing: Cham, Switerland, 2015; pp. 249–265. ISBN 978-3-319-18767-9. [Google Scholar]
  2. Cardoso, S.; Carvalho, T.; Videira, P. Is it still worth working in Academia? The views from portuguese academics. High Educ. Policy 2019, 32, 663–679. [Google Scholar] [CrossRef]
  3. Enders, J.; Kaulisch, M. The binding and unbinding of academic careers. In Proceedings of the the Formative Years of Scholars; Wenner-Gren International Series; Portland Press: London, UK, 2006; Volume 2006, pp. 85–96. [Google Scholar]
  4. Slaughter, S.; Taylor, B.J. (Eds.) Higher Education, Stratification, and Workforce Development: Competitive Advantage in Europe, the US, and Canada. In Higher Education Dynamics, 1st ed.; Springer International Publishing: Cham, Switerland, 2016; ISBN 978-3-319-21512-9. [Google Scholar]
  5. Carlsson, B.; Jacobsson, S.; Holmen, M.; Rickne, A. Innovation Systems: Analytical and Methodological Issues. Res. Policy 2002, 31, 233–245. [Google Scholar] [CrossRef]
  6. Hardeman, S.; Van Roy, V.; European Commission; Joint Research Centre; Institute for the Protection and the Security of the Citizen. An Analysis of National Research Systems (II): Efficiency in the Production of Research Excellence; Publications Office: Luxembourg, 2013; ISBN 978-92-79-35011-5. [Google Scholar]
  7. INESC Excellence Needs Effective Synergies. INESC Position Paper on Synergies between European, National and Regional Funds and Programmes for Research, Development and Innovation 2020. Available online: https://www.inesctec.pt/en/news/excellence-needs-effective-synergies#about (accessed on 12 September 2021).
  8. Bentley, P.J. (Ed.) The changing academy—The changing academic profession in international comparative perspective. In Job Satisfaction around the Academic World; Springer: Dordrecht, The Netherlands; Heidelberg, Germany, 2013; ISBN 978-94-007-5434-8. [Google Scholar]
  9. Evans, L. Enhancing the quality of research in Europe: Theoretical perspectives on and guiding principles for researcher development. In The European Higher Education Area; Curaj, A., Matei, L., Pricopie, R., Salmi, J., Scott, P., Eds.; Springer International Publishing: Cham, Switerland, 2015; pp. 573–591. ISBN 978-3-319-18767-9. [Google Scholar]
  10. Hardeman, S.; Van Roy, V.; Vertesy, D.; Saisana, M.; European Commission; Joint Research Centre; Institute for the Protection and the Security of the Citizen. An Analysis of National Research Systems (I): A Composite Indicator for Scientific and Technological Research Excellence; Publications Office: Luxembourg, 2013; ISBN 978-92-79-32527-4. [Google Scholar]
  11. Overlaet, B. A Pathway towards Multidimensional Academic Careers. A LERU Framework for the Assessment of Researchers 2022. Available online: https://www.leru.org/files/Publications/LERU_PositionPaper_Framework-for-the-Assessment-of-Researchers.pdf (accessed on 4 February 2022).
  12. Wollersheim, J.; Lenz, A.; Welpe, I.M.; Spörrle, M. Me, myself, and my university: A multilevel analysis of individual and institutional determinants of academic performance. J. Bus. Econ. 2015, 85, 263–291. [Google Scholar] [CrossRef]
  13. Ringelhan, S.; Wollersheim, J.; Welpe, I.M.; Fiedler, M.; Spörrle, M. Work motivation and job satisfaction as antecedents of research performance: Investigation of different mediation models. In Performance Management im Hochschulbereich; Dilger, A., Dyckhoff, H., Fandel, G., Eds.; Springer Fachmedien Wiesbaden: Wiesbaden, Germany, 2013; pp. 7–38. ISBN 978-3-658-03347-7. [Google Scholar]
  14. Aagaard, K.; Schneider, J.W. Research funding and national academic performance: Examination of a Danish success story. Sci. Public Policy 2016, 43, 518–531. [Google Scholar] [CrossRef]
  15. Kifor, C.V.; Teodorescu, D.; Andrei, T.; Săvescu, R. Research production and international visibility in higher education: The evolution of romanian universities from 2011 to 2019. Sustainability 2021, 13, 13362. [Google Scholar] [CrossRef]
  16. EUROSTAT GERD by Sector of Performance 2021. Available online: https://appsso.eurostat.ec.europa.eu/nui/show.do?dataset=rd_e_gerdreg (accessed on 16 October 2021).
  17. R&D Landscape. H2020 Country Profile. Available online: https://webgate.ec.europa.eu/dashboard/sense/app/a976d168-2023-41d8-acec-e77640154726/sheet/eeb35687-5e03-44b8-ace0-9cd8802cbd00/state/analysis (accessed on 12 September 2021).
  18. European Commission. Directorate general for internal market, industry, entrepreneurship and SMEs. In European Innovation Scoreboard 2021; Publications Office: Luxembourg, 2021. [Google Scholar]
  19. OECD. The measurement of scientific and technological activities. In Frascati Manual 2002: Proposed Standard Practice for Surveys on Research and Experimental Development; OECD: Paris, France, 2002; ISBN 978-92-64-19903-3. [Google Scholar]
  20. European Commission Directorate-General for Research & Innovation Principles for Innovative Doctoral Training 2011. Available online: https://euraxess.ec.europa.eu/sites/default/files/policy_library/principles_for_innovative_doctoral_training.pdf (accessed on 12 March 2020).
  21. Fogaça, N.; Rego, M.C.B.; Melo, M.C.C.; Armond, L.P.; Coelho, F.A. Job performance analysis: Scientific studies in the main journals of management and psychology from 2006 to 2015: Job performance analysis. Perform. Improv. Q. 2018, 30, 231–247. [Google Scholar] [CrossRef]
  22. Europäische Kommission (Ed.) Europäische Charta für Forscher: Verhaltenskodex für die Einstellung von Forschern; EUR; Office for Official Publications of the European Communities: Luxembourg, 2005; ISBN 978-92-894-9311-6. [Google Scholar]
  23. European Commission Commission Recommendation on the European Charter for Researchers and on a Code of Conduct for the Recruitment of Researchers 2005. Available online: https://eur-lex.europa.eu/LexUriServ/LexUriServ.do?uri=OJ:L:2005:075:0067:0077:EN:PDF (accessed on 6 June 2020).
  24. Research Profiles Descriptors. Available online: https://euraxess.ec.europa.eu/europe/career-development/training-researchers/research-profiles-descriptors (accessed on 6 June 2020).
  25. Maer-Matei, M.M.; Mocanu, C.; Zamfir, A.-M.; Georgescu, T.M. Skill needs for early career researchers—A text mining approach. Sustainability 2019, 11, 2789. [Google Scholar] [CrossRef] [Green Version]
  26. Callaghan, C.W.; Coldwell, D. Job satisfaction and job performance: The case of research productivity. J. Econ. 2014, 5, 97–113. [Google Scholar] [CrossRef]
  27. Judge, T.A.; Thoresen, C.J.; Bono, J.E.; Patton, G.K. The job satisfaction–job performance relationship: A qualitative and quantitative review. Psychol. Bull. 2001, 127, 376–407. [Google Scholar] [CrossRef]
  28. Mamiseishvili, K.; Rosser, V.J. International and citizen faculty in the United States: An examination of their productivity at research universities. Res. High Educ. 2010, 51, 88–107. [Google Scholar] [CrossRef]
  29. Masum, A.K.M.; Azad, M.A.K.; Beh, L.-S. Determinants of academics’ job satisfaction: Empirical evidence from private universities in bangladesh. PLoS ONE 2015, 10, e0117834. [Google Scholar] [CrossRef] [PubMed]
  30. Barbezat, D.A. Gender differences in research patterns among phd economists. J. Econ. Educ. 2006, 37, 359–375. [Google Scholar] [CrossRef]
  31. Demerouti, E.; Bakker, A.B.; Nachreiner, F.; Schaufeli, W.B. The job demands-resources model of burnout. J. Appl. Psychol. 2001, 86, 499–512. [Google Scholar] [CrossRef] [PubMed]
  32. Hagedorn, L.S. Conceptualizing faculty job satisfaction: Components, theories, and outcomes. New Dir. Inst. Res. 2000, 2000, 5–20. [Google Scholar] [CrossRef]
  33. Mellors-Bourne, R.; Metcalfe, J. Five Steps Forward: Progress in Implementing the Concordat to Support the Career Development of Researchers 2008–2017; CRAC: Cambridge, UK, 2017. [Google Scholar]
  34. European Commission; Directorate General for Research and Innovation; IDEA Consult; WIFO; Technopolis. Survey on Researchers in European Higher Education Institutions: Annex to MORE3 Study: Support Data Collection and Analysis Concerning Mobility Patterns and Career Paths of Researchers; Publications Office: Luxembourg, 2017. [Google Scholar]
  35. Herzberg, F.; Mausner, B.; Snyderman, B.B. The Motivation to Work, 2nd ed.; Wiley: New York, NY, USA, 1959; ISBN 978-0-471-37389-6. [Google Scholar]
  36. Bakker, A.B.; Demerouti, E. The job demands-resources model: State of the art. J. Manag. Psychol. 2007, 22, 309–328. [Google Scholar] [CrossRef] [Green Version]
  37. Osterloh, M.; Frey, B.S. Motivation, knowledge transfer, and organizational forms. Organ. Sci. 2000, 11, 538–550. [Google Scholar] [CrossRef] [Green Version]
  38. Hicks, D.; Wouters, P.; Waltman, L.; de Rijcke, S.; Rafols, I. Bibliometrics: The leiden manifesto for research metrics. Nature 2015, 520, 429–431. [Google Scholar] [CrossRef] [Green Version]
  39. Bauer, I.; Bohmert, D.; Czernecka, A.; Eichenberger, T.; Garbajosa, J.; Iovu, H.; Kinnaird, Y.; Madeira, A.C.; Nygard, M.; Per-Anders Östling; et al. Next Generation Metrics. Zenodo 2020. [Google Scholar] [CrossRef]
  40. Peter, V.; Simmonds, P.; Markianidou, P.; Roman, L. IA Study on the Open, Transparent, and Merit-Based Recruitment of Researchers; Technopolis Groups: Brussels, Belgium, 2014. [Google Scholar]
  41. Publications Office. European foundation for the improvement of living and working conditions. In 6th European Working Conditions Survey: 2017 Update; Publications Office: Luxembourg, 2017. [Google Scholar]
  42. Tacq, J. Multivariate Analysis Techniques in Social Science Research: From Problem to Analysis; Sage Publications, Inc.: Thousand Oaks, CA, USA, 1997; p. xiv, 411. ISBN 0-7619-5272-1. [Google Scholar]
  43. Costello, A.B.; Osborne, J. Best practices in exploratory factor analysis: Four recommendations for getting the most from your analysis. Pract. Assess. Res. Eval. 2005, 10. [Google Scholar] [CrossRef]
  44. Guadagnoli, E.; Velicer, W.F. Relation of sample size to the stability of component patterns. Psychol. Bull. 1988, 103, 265–275. [Google Scholar] [CrossRef]
  45. Hooper, D.; Coughlan, J.; Mullen, M.R. Structural equation modelling: Guidelines for determining model fit. Electron. J. Bus. Res. Methods 2008, 6, 53–60. [Google Scholar]
  46. MacCallum, R.C.; Browne, M.W.; Sugawara, H.M. Power analysis and determination of sample size for covariance structure modeling. Psychol. Methods 1996, 1, 130–149. [Google Scholar] [CrossRef]
  47. Steiger, J.H. Understanding the limitations of global fit assessment in structural equation modeling. Personal. Individ. Differ. 2007, 42, 893–898. [Google Scholar] [CrossRef]
  48. Arbuckle, J.L. Amos (Version 25.0) [Computer Program]; IBM SPSS: Chicago, IL, USA, 2017. [Google Scholar]
  49. Assaf, A.G.; Tsionas, M.; Oh, H. The time has come: Toward bayesian sem estimation in tourism research. Tour. Manag. 2018, 64, 98–109. [Google Scholar] [CrossRef] [Green Version]
  50. Cain, M.K.; Zhang, Z. Fit for a bayesian: An evaluation of ppp and dic for structural equation modeling. Struct. Equ. Model. Multidiscip. J. 2019, 26, 39–50. [Google Scholar] [CrossRef]
  51. European Commission. Directorate General for Research and Innovation. Towards a Reform of the Research Assessment System: Scoping Report; Publications Office: Luxembourg, 2021. [Google Scholar]
  52. European Commission; Directorate General for Research and Innovation; RAND Europe; Deloitte. Research, Innovation and Economic Growth: R&D Policy Reforms and Strategies; Publications Office: Luxembourg, 2017. [Google Scholar]
  53. European Commission Directorate General for Research and Innovation; Athena Research & Innovation Center; PPMI; UNU MERIT. Monitoring the Open Access Policy of Horizon 2020: Final Report; Publications Office: Luxembourg, 2021. [Google Scholar]
  54. Szromek, A.R.; Wolniak, R. Job satisfaction and problems among academic staff in higher education. Sustainability 2020, 12, 4865. [Google Scholar] [CrossRef]
  55. Bailey, L.; Behar, V.; Bohmert, D.; Järbur, C.; Klee, D. Boost careers of early-stage researchers. Zenodo 2020. [Google Scholar] [CrossRef]
  56. The Committee for Public Information (TJNK) and Federation of Finnish Learned Societies (TSV). Working group for the responsible evaluation of a researcher. In Good Practice in Researcher Evaluation. Recommendation for the Responsible Evaluation of a Researcher in Finland; Vastuullisen Tieteen Julkaisusarja; The Committee for Public Information (TJNK) and Federation of Finnish Learned Societies (TSV): Helsinki, Finland, 2020; ISBN 978-952-5995-28-2. [Google Scholar]
  57. Harrison, B.; Jepsen, D.M. The career impact of winning an external work-related award. J. Vocat. Behav. 2015, 89, 21–31. [Google Scholar] [CrossRef]
  58. Gallus, J.; Frey, B.S. Awards: A strategic management perspective: Awards. Strat. Manag. J. 2016, 37, 1699–1714. [Google Scholar] [CrossRef] [Green Version]
  59. LERU Position Paper on ‘Delivering Talent: Careers of Researchers inside and outside Academia 2018. Available online: https://www.leru.org/files/LERU-PP-DeliveringTalent_2018-June.pdf (accessed on 12 June 2020).
  60. Annex to the Proposal for a Council Implementing Decision on the Approval of the Assessment of the Recovery and Resilience Plan for Romania 2021. Available online: https://www.europeansources.info/record/proposal-for-a-council-implementing-decision-on-the-approval-of-the-assessment-of-the-recovery-and-resilience-plan-for-romania/ (accessed on 4 February 2022).
Figure 1. (a) Assumed relationship between the seven dimensions and a higher-order construct. (b) Assumed relationship between system, institution, and individual factors.
Sustainability 14 02254 g001aSustainability 14 02254 g001b
Figure 2. Model 1 mono-factor CFA. Standardised regression weights.
Sustainability 14 02254 g002
Figure 3. Model 2 CFA2. Correlated factors. Standardised regression weights and correlations between factors.
Sustainability 14 02254 g003
Figure 4. Model 2 CFA 3. Correlated factors. Standardised regression weights and correlations between factors.
Sustainability 14 02254 g004
Figure 5. Model 2 B-SEM diagnostic trace plot.
Sustainability 14 02254 g005aSustainability 14 02254 g005b
Figure 6. Sampling from the posterior for some model parameters in Model 2.
Sustainability 14 02254 g006
Figure 7. Autocorrelation for some model parameters in Model 2.
Sustainability 14 02254 g007aSustainability 14 02254 g007b
Figure 8. Model 3 CFA 4. Hierarchical. Standardised regression weights.
Sustainability 14 02254 g008
Figure 9. Model 3 CFA 5. Hierarchical. Standardised regression weights.
Sustainability 14 02254 g009
Figure 10. Model 3 B-SEM diagnostic trace plot.
Sustainability 14 02254 g010
Figure 11. Sampling from the posterior for some model parameters in Model 3.
Sustainability 14 02254 g011
Figure 12. Autocorrelation for some model parameters in Model 3.
Sustainability 14 02254 g012
Figure 13. Path analysis, regression coefficients, measurement weights, and explained variance.
Sustainability 14 02254 g013
Table 1. Length of experience of the respondents (N = 553).
Number of YearsPercent
<3 years9.9
3–9 years14.3
10+ years75.8
Table 2. Time in the current institution (N = 553).
Number of YearsPercent
<3 years14.5
3–9 years15.2
10+ years70.3
Table 3. Subject specialism of the respondents (N = 553).
DisciplinePercent
Advanced materials14.54
Energy13.31
Environment11.03
Information technology and communication8.41
Eco-Nanotechnology7.88
Bioeconomy3.68
Space and Security2.98
Climatic changes0.53
Other37.65
Table 4. Cronbach’s alpha for the seven dimensions.
DimensionsCronbach’s Alpha Based on Standardised ItemsN of Items
Recruitment and selection0.8904
Participation in research Projects and teams0.8937
Recognition and value of research0.92110
Work incentives0.8635
Job payment0.8562
Career development opportunities0.9018
Leadership effectiveness0.8725
Table 5. Descriptive statistics (N = 553).
MinMaxMeanSDSkewnessKurtosis
RS1−552.062.351−0.690.104
RS2−552.482.648−1.0560.393
RS3−552.652.608−1.2310.891
RS4−552.922.729−1.4471.301
RE3−553.931.643−2.5258.233
RE4−552.52.014−0.9420.91
RE5−5531.811−1.3892.791
RE7−553.541.662−1.7844.082
RE8−553.121.691−1.2942.399
RE9−552.991.696−1.2582.642
RE10−553.761.704−2.1215.725
RE11−552.631.954−1.0251.501
RE12−5531.772−1.1191.451
RE17−552.831.705−0.8220.574
RE6−553.661.762−2.1085.381
RE13−553.582.043−1.8363.423
RE14−553.761.56−2.3237.991
RE15−553.481.969−1.9093.922
RE18−553.12.017−1.5952.819
RE19−553.331.893−1.4542.352
RE20−553.052.041−1.0240.552
WI1−553.371.782−1.7324.062
WI2−552.682.356−1.421.789
WI3−552.672.339−1.4151.769
WI4−553.082.08−1.582.746
WI5−553.681.746−2.0745.71
SAL1−553.782.163−2.6717.119
SAL2−553.242.185−1.6922.93
CD1−553.971.768−2.7668.849
CD2−553.771.697−2.0295.058
CD3−554.021.425−2.6869.962
CD4−553.151.885−1.3942.188
CD5−552.561.956−0.7180.34
CD6−553.371.764−1.8034.245
CD7−553.021.905−1.1321.288
CD8−552.851.949−1.0330.907
MANAG1−552.961.739−0.9330.726
MANAG2−453.781.528−1.9054.379
MANAG3−553.951.578−2.5157.917
MANAG4−553.931.559−2.2015.837
MANAG5−554.031.446−2.74810.728
Source: Developed by the authors on the basis of data collected for the present study.
Table 6. Summary of Rotated Component Matrix, Cronbach’s alpha, variance, and eigenvalues.
FactorItemsCommunalitiesItem Loading%Variance Explained (Cumulative)Cronbach’s AlphaEigenvalue
Career development opportunitiesCD40.6930.73438.3550.93016.124
CD60.6400.731
MANAG10.6240.723
CD70.7140.722
MANAG20.6580.705
MANAG50.5860.676
CD50.6630.668
MANAG40.5580.601
CD80.4430.579
MANAG30.5500.565
CD20.4690.546
CD30.5250.523
CD10.4260.512
Research recognition and valueRE120.7020.76945.2460.9213.216
RE50.6660.745
RE80.6650.744
RE40.4880.650
RE110.5070.649
RE100.5850.610
RE90.5010.577
RE170.5160.573
RE70.6000.565
RE30.6590.544
Participation in research teams and projectsRE130.6940.75550.4750.8932.452
RE150.6820.737
RE140.5920.565
RE60.5990.549
RE200.4850.506
RE180.4890.479
RE190.5210.479
Recruitment and selectionRS20.7750.84453.6610.8901.678
RS30.7340.836
RS40.7030.797
RS10.5100.647
Work incentivesWI30.7100.73756.430.8631.51
WI20.6050.686
WI40.6260.608
WI50.5190.452
WI10.5770.442
SalarySAL10.8150.80858.6150.8561.207
SAL20.6800.668
Source: Developed by the authors on the basis of data collected for the present study.
Table 7. Goodness of fit statistics for Model 2.
X 2 p X 2 / d f T L I C F I R M S E A
65.40778 p < 0.001 8.790.570.600.11
Table 8. Goodness of fit statistics for Model 2 CFA 2.
X 2 d f p X 2 / d f T L I C F I R M S E A
47.331528 p < 0.001 2.850.870.890.058
Table 9. Goodness of fit statistics for Model 2 CFA 3.
X 2 d f p X 2 / d f T L I C F I R M S E A
4367.331528 p < 0.001 2.850.870.890.058
Table 10. Structural model results M2 B-SEM.
MeanS.E.S.D.C.S.Median95% Lower Bound95% Upper BoundSkewnessKurtosisMinMax
Career_development<->Recruitment__selection0.65020.00200.09571.00020.64610.47210.84970.23240.10220.32261.0868
Recognition_value<->Participation_research1.36290.00320.13441.00031.35651.11541.64320.2336−0.00780.90012.0188
Work_incentives<->Recognition_value1.20980.00260.12041.00021.20370.99061.46150.27100.12700.78781.7952
Career_development<->Participation_research0.98740.00250.10241.00030.98240.80251.20470.32870.15390.56301.4371
Career_development<->Recognition_value0.74960.00170.07971.00020.74620.60440.91710.29280.19800.42951.1371
Work_incentives<->Career_development0.96750.00210.09691.00020.96190.79111.17280.28160.09280.55871.3862
Work_incentives<->Recruitment__selection0.84850.00270.13191.00020.84450.60281.12170.21130.09640.40031.4560
Work_incentives<->Participation_research1.47610.00370.14951.00031.46961.20301.78500.25660.01810.97052.1737
Recruitment__selection<->Recognition_value0.82320.00220.11431.00020.81840.61361.06240.25690.18230.38311.3741
Career_development<->Job_payment1.29360.00290.12771.00031.28871.05531.56050.23300.13300.82501.9221
Job_payment<->Recognition_value0.89360.00260.13021.00020.88890.64951.16000.15160.04120.34841.4405
Job_payment<->Participation_research1.41880.00360.16511.00021.41171.11271.76190.23640.17240.84272.2743
Work_incentives<->Job_payment1.40170.00370.16331.00021.39771.09461.73330.13190.00290.70172.0485
Job_payment<->Recruitment__selection0.95720.00380.17871.00020.95370.61931.32110.14230.06190.25601.6597
Recruitment__selection<->Participation_research0.94510.00300.13561.00020.93950.69411.22520.24180.15230.46251.5540
Table 11. Comparison of regression weights’ unstandardised parameter estimates—maximum likelihood versus Bayesian in Model 2.
ParameterBayesianML
MANAG4<--Career_development0.95710.936
MANAG3<--Career_development1.03811.017
MANAG2<--Career_development1.12381.098
MANAG1<--Career_development1.31521.261
CD8<--Career_development1.25781.127
CD7<--Career_development1.48231.344
CD6<--Career_development1.36881.326
CD5<--Career_development1.44631.353
CD4<--Career_development1.45691.387
CD3<--Career_development0.94480.887
Table 12. Goodness of fit statistics for Model 3 CFA4 ML-SEM.
X 2 d f p X 2 / d f T L I C F I R M S E A
7395.852325 p < 0.001 3.180.900.930.049
Table 13. Goodness of fit statistics for Model 3 CFA5 ML-SEM.
X 2 d f p X 2 / d f T L I C F I R M S E A
3740.191318 p < 0.001 2.830.900.930.045
Table 14. Structural model results M3 B-SEM.
MeanS.E.S.D.C.S.Median95% Lower Bound95% Upper BoundSkewnessKurtosisMinMax
Recognition__and_value<--Research_performance0.7920.0010.0521.0000.7910.6930.8950.101−0.0650.6160.995
Career_development<--Research_performance0.6320.0010.0451.0010.6320.5470.7220.095−0.0270.4310.810
Recruitment_and__selection<--Research_performance0.6090.0020.0681.0000.6080.4800.7460.0990.0610.3620.860
Job_payment<--Research_performance0.8620.0020.0771.0000.8610.7141.0190.098−0.0010.6001.176
Table 15. Comparison of regression weights’ unstandardised parameter estimates—maximum likelihood versus Bayesian in Model 3.
ParameterBayesianML
MANAG5<---→Career_development1.0001.000
MANAG4<--Career_development0.9650.943
MANAG3<--Career_development1.0511.023
MANAG2<--Career_development1.1421.111
MANAG1<--Career_development1.3271.296
CD8<--Career_development1.2731.240
CD7<--Career_development1.5001.463
CD6<--Career_development1.3841.349
CD5<--Career_development1.4581.423
RS2<--Recruitment_and__selection1.3781.258
RS3<--Recruitment_and__selection1.3721.231
RS4<--Recruitment_and__selection1.4161.273
Table 16. Path analysis. Goodness of fit indices.
X 2 d f p X 2 / d f T L I C F I R M S E A
7233.772301 p < 0.001 3.140.900.920.045
Table 17. Path analysis. Variance explained and total, direct, and indirect effects.
MediatorsJob PaymentCareer DevelopmentWork IncentivesParticipation in ResearchRecruitment and Selection
Variance Explained8%42%51%63%
Variables/EffectsTotalDirectIndirectTotalDirectIndirectTotalDirectIndirectTotalDirectIndirectTotalDirectIndirect
Job Payment 0.2810.281
Career development0.5540.554 0.3750.2190.156
Work incentives0.4370.1390.2980.5380.538 0.4050.1640.240
Participation in research0.405 0.4050.5810.2620.3190.5930.593 0.338 0.338
Recognition and value0.361 0.3610.4970.0310.4660.6130.3030.3090.5210.521 0.311 0.311
Publisher’s Note: MDPI stays neutral with regard to jurisdictional claims in published maps and institutional affiliations.

